Generation of inner ear hair cells by direct lineage conversion of primary somatic cells
- Department of Stem Cell and Regenerative Medicine, University of Southern California, United States
- Eli and Edythe Broad Center, University of Southern California, United States
- Zilkha Neurogenetic Institute, University of Southern California, United States
- USC Caruso Department of Otolaryngology – Head and Neck Surgery, University of Southern California, United States
- DRVision Technologies, United States
Figures
Figure 1 with 1 supplement

Overexpression of Six1, Atoh1, Pou4f3 and Gfi1 is capable of activating hair cell markers in mouse embryonic fibroblasts.
(A) Diagram of the mouse inner ear shows the vestibular system (green) and the cochlea of the auditory system (red). Cross section through one turn of the cochlea shows organization in the organ of Corti as a mosaic of sensory hair cells (one row of inner hair cells and three rows of outer hair cells) interdigitated by various supporting cell populations labeled from left to right (Inner border/phalangeal, Pillar, Deiters’ and Hensen’s). Space filling model care of Steven Raft. (B) Schematic of experimental design for transcription factor mediated reprogramming. Mouse embryonic fibroblasts (MEFs) were isolated from Atoh1-nGFP transgenic reporter mice. MEFs were plated at a density of 5000 cells per well of a 96 well plate, infected with retroviral transcription factors and allowed to reprogram for 14 days prior to analysis. (C) Images of MEFs reprogrammed with Six1, Atoh1, Pou4f3, and Gfi1 (SAPG) fixed at 14 days post infection (dpi). Atoh1-nGFP reporter activation (green) and immunostaining for anti-MyosinVIIa (red) and anti-Parvalbumin (cyan). Scale bar represents 50 um in length. (D) All quantification was performed at 14 dpi. Reprogramming efficiency was calculated as the number of Atoh1-nGFP positive cells divided by the 5000 MEFs plated per well. Reporter activation and immunostaining for anti-MyosinVIIa and anti-Parvalbumin was used to quantify triple positive cells (Atoh1-nGFP+/MyosinVIIa+/Parvalbumin+). A = Atoh1, P=Pou4 f3, G = Gfi1, S = Six1. The combination SAPG gave 35% (± 1.8) reprogramming efficiency and 78% (± 1.9) of Atoh1-nGFP+ cells were triple positive. Statistics shown are for the comparison of triple positive cells in each condition. (N = 3 independent experiments per condition, n = 3 replicates per condition per experiment; mean ± SEM; one-way ANOVA *p<0.05, **p<0.01, ***p<0.001, ****p<0.0001).
Figure 1—figure supplement 1
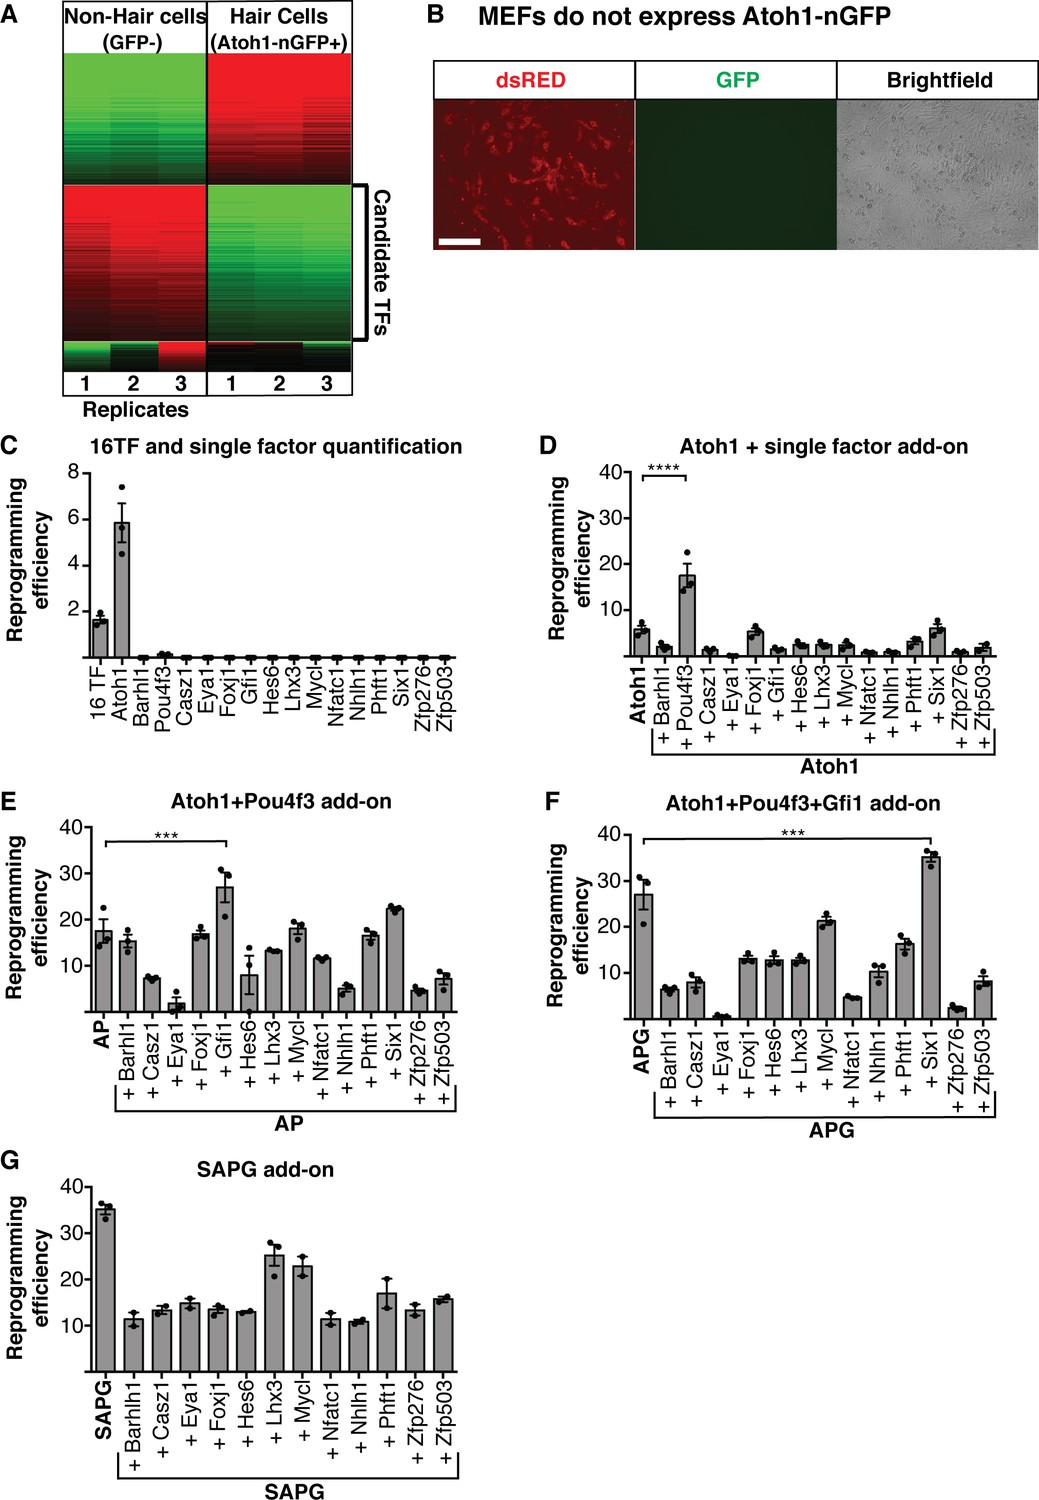
Overexpression of Six1, Atoh1, Pou4f3 and Gfi1 is capable of activating hair cell markers in mouse embryonic fibroblasts.
(A) Heat map of RNA sequencing data from primary P1 Atoh1-nGFP+ cochlear hair cells compared to the Atoh1-nGFP- population. 16 transcription factors (TFs) were identified as only and/or highly expressed in the Atoh1-nGFP+ hair cell population. (n = 3 replicates per sample). (B) Mouse embryonic fibroblasts (MEFs) isolated from the Atoh1-nGFP transgenic mouse do not express the transgenic reporter. MEFs were infected with a dsRed viral control for visualization. Scale bar represents 100 um. (C) All quantification of reporter activation was done at 14 days post infection (dpi). Reprogramming efficiency was calculated as the number of Atoh1-nGFP positive cells divided by the 5000 MEFs plated per well. Reprogramming efficiency with all 16 TFs was 1.7% (± 0.3) and single factor infections only gave reporter activation with Atoh1 alone (5.8% ± 1.5) and Pou4f3 alone (0.15% ± 0.03). (D) Reprogramming efficiency with Atoh1 alone (5.8% ± 1.5) graphed alongside single factor add-on to Atoh1. The addition of Pou4f3 gave a significant increase in reprogramming efficiency to 17.5% (± 4.4). (E) Reprogramming efficiency with Atoh1 and Pou4f3 (AP, 17.5% ± 4.4) graphed alongside single factor add-on to AP. The addition of Gfi1 gave a significant increase in reprogramming efficiency to 26.9% (± 5.6). (F) Reprogramming efficiency with Atoh1, Pou4f3 and Gfi1 (APG, 26.9% ± 5.6) graphed alongside single factor add-on to APG. The addition of Six1 gave a significant increase in reprogramming efficiency to 35.2% (± 1.8). (G) Reprogramming efficiency with Six1, Atoh1, Pou4f3, and Gfi1 (SAPG, 35.2% ± 1.8) graphed alongside single factor add-on to SAPG. No single factor addition gave a significant increase in reprogramming efficiency. (C–G): N = 3 independent experiments per condition, n = 3 replicates per condition per experiment; numbers reported as mean ± SEM; one-way ANOVA *p<0.05, **p<0.01, ***p<0.001, ****p<0.0001).
Figure 2 with 1 supplement
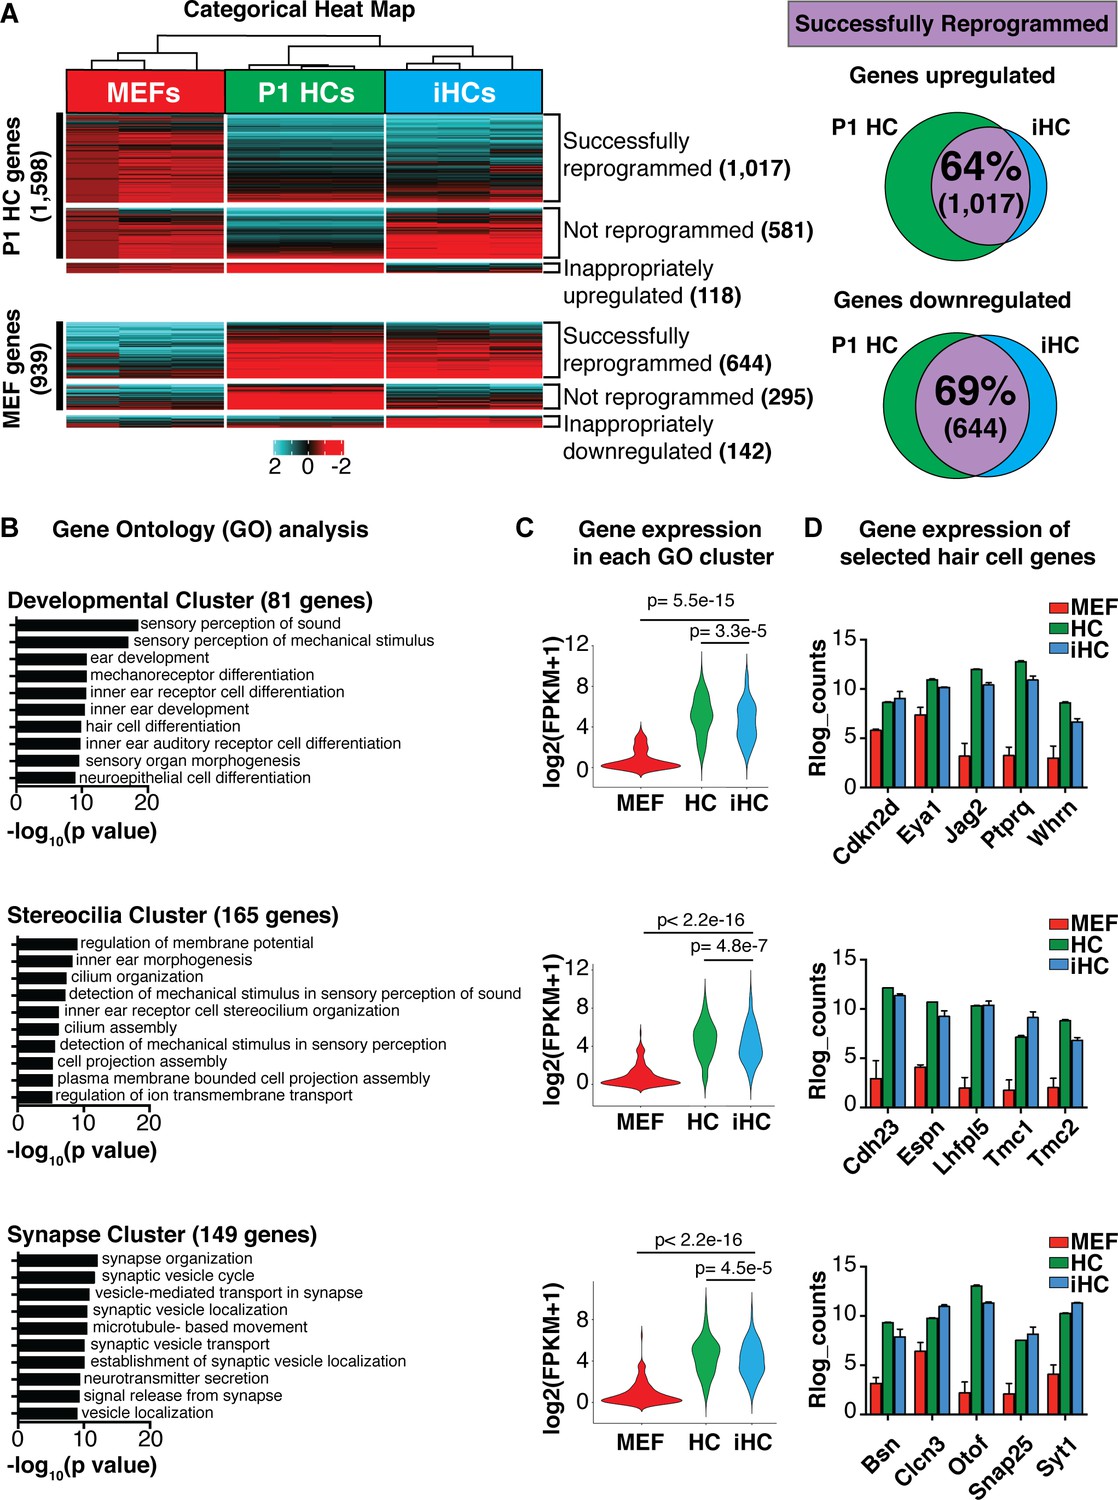
Transcriptional analysis of induced hair cells (iHCs) indicates expression profile similarity to primary cochlear hair cells.
(A) Categorical heat-map comparing gene expression (RNA-seq) of mouse embryonic fibroblasts (MEFs), P1 cochlear hair cells (P1 HCs), and induced hair cells (iHCs). (n = 3 replicates for P1 HCs, n = 3 replicates for iHCs, n = 3 replicates for MEFs). Venn diagrams show percent of correctly reprogrammed genes. 64% of uniquely expressed P1 HC genes are correctly upregulated during reprogramming, and 69% of inappropriately expressed MEF genes are downregulated. (B) Gene Ontology analysis (GO-terms) of successfully upregulated genes in iHCs categorized into three relevant gene clusters: Development, Stereocilia and Synapse. (C) RNA expression of the gene set associated with each GO Cluster. Violin plots show relative expression of genes in each of the three clusters: Development (81 genes), Stereocilia (165 genes) and Synapse (149 genes). Gene lists in Figure 2—figure supplement 1. (D) Gene expression (Rlog counts) in MEFs, iHCs and P1 HCs for selected hair cell-enriched genes in each of the three clusters. All genes are significantly upregulated in iHCs compared to MEFs with p<0.05 and FDR < 0.01. (n = 3 replicates for P1 HCs, n = 3 replicates for iHCs, n = 3 replicates for MEFs; mean ± SEM).
-
Figure 2—source data 1
Gene Ontology gene lists Gene Ontology (GO) analysis showed that the genes successfully upregulated during reprogramming were revealed as three clusters of GO terms: development-related GO terms, stereocilia-related GO terms, and synapse-related GO terms.
These three clusters of GO terms were used to generate cluster-specific gene sets driving the GO designation. Development GO terms represented 81 genes. Stereocilia GO terms represented 165 genes. Synapse GO terms represented 149 genes. These gene lists were used to calculate the level of gene expression of each GO cluster in MEFs, P1 HCs and iHCs (violin plots, Figure 2C).
- https://cdn.elifesciences.org/articles/55249/elife-55249-fig2-data1-v1.xlsx
Figure 2—figure supplement 1
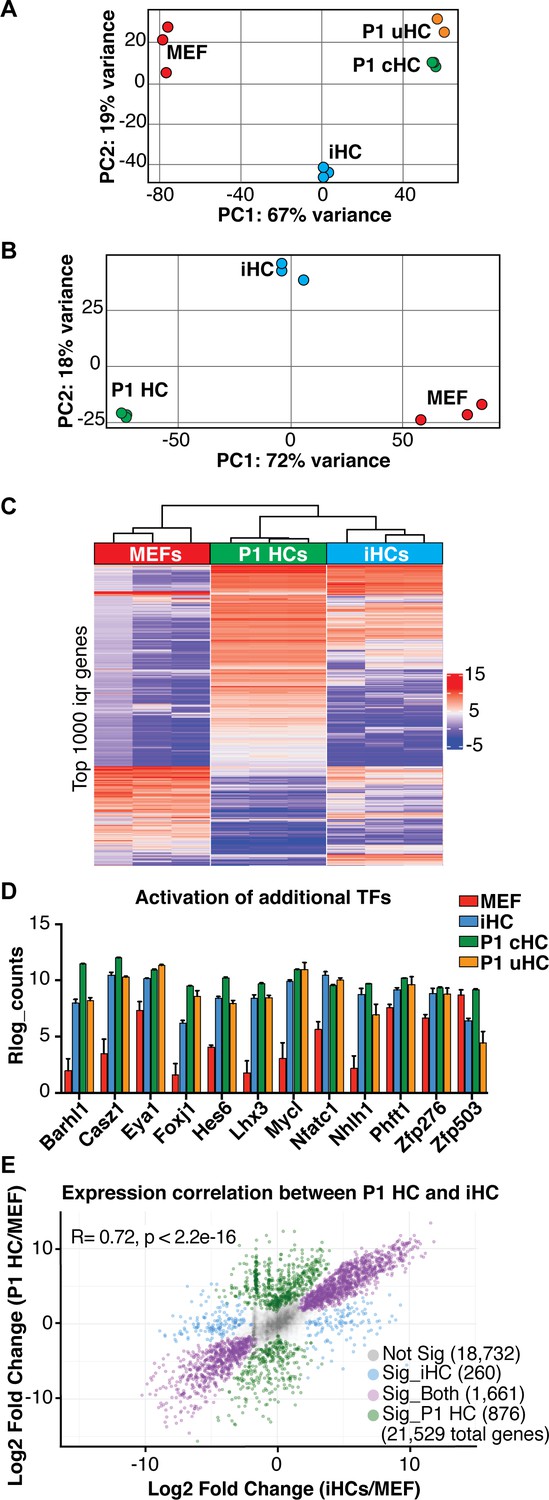
Transcriptional analysis of induced hair cells (iHCs) indicates expression profile similarity to primary cochlear hair cells.
(A) Principle component analysis (PCA) shows RNA expression profiles for MEFs, P1 cochlear hair cells (P1 cHCs), P1 utricular hair cells (P1 uHCs), and induced hair cells (iHCs). (n = 3 replicates for MEFs, n = 3 replicates for P1 cHCs, n = 2 replicates for P1 uHCs, n = 3 replicates for iHCs). (B) Principle component analysis (PCA) shows RNA expression profiles for MEFs, P1 cochlear hair cells (P1 HCs), and induced hair cells (iHCs). (n = 3 replicates for MEFs, n = 3 replicates for P1 cHCs, n = 3 replicates for iHCs). (C) Heat map of unsupervised hierarchical clustering shows the consistency between replicates across bulk RNA sequencing profiles for P1 cochlear hair cells (P1 HCs), induced hair cells (iHCs), and MEFs. (n = 3 replicates for P1 HCs, n = 3 replicates for iHCs, n = 3 replicates for MEFs). (D) Gene Expression (Rlog counts) in MEFs, iHCs, P1 cHCs and P1 uHCs for the additional 12 transcription factors (TFs) used in the initial set of 16 TFs identified for reprogramming. iHCs are able to activate expression of all TFs with the exception of Zfp503. (n = 3 replicates for MEFs, n = 3 replicates for P1 cHCs, n = 2 replicates for P1 uHCs, n = 3 replicates for iHCs; mean ± SEM). (E) Scatter plot of the differential gene expression levels in P1 hair cells (P1 HCs) and induced hair cells (iHCs). Both expression profiles were normalized to the MEF gene expression profile. Expression profiles of P1 HCs and iHCs show strong correlation (R = 0.72, p<2.2e-16).
Figure 3
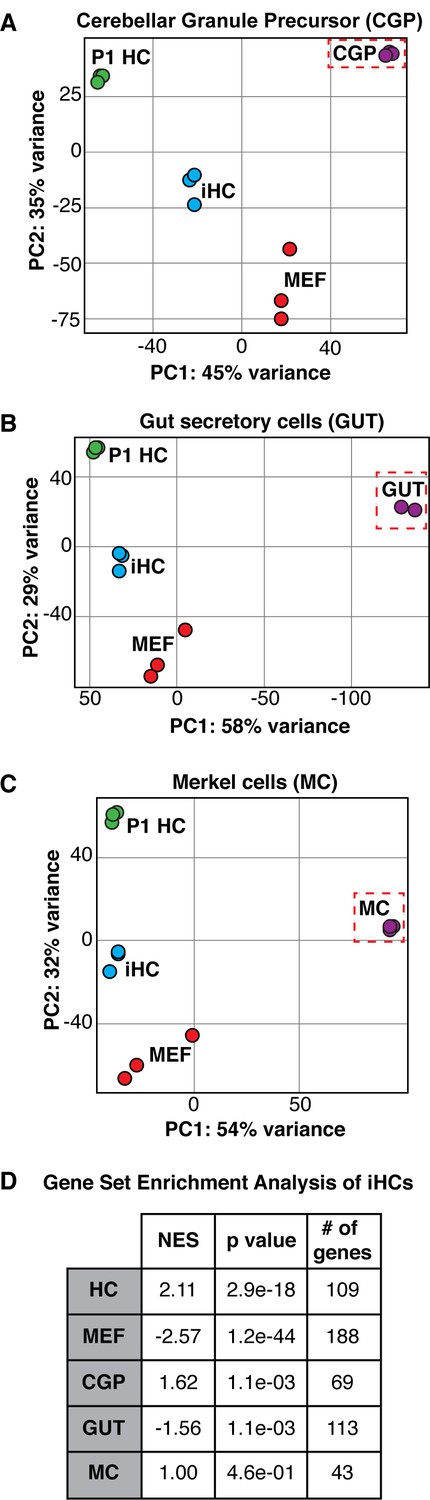
The expression profile of induced hair cells resembles primary hair cells and is distinct from other Atoh1-dependent lineages.
(A–C) Principle component analysis showing the differences in transcriptional profiles between P1 cochlear hair cells (P1 HCs), induced hair cells (iHCs), control mouse embryonic fibroblasts (MEFs), and cerebellar granule precursor cells (CGP), secretory cells of the gut (GUT), and Merkel cells (MC), respectively. (D) Gene Set Enrichment Analysis (GSEA) comparing iHC expression profile to the unique gene sets of MEFs, HCs, CGPs, GUT cells, and MCs. Table reports normalized enrichment score (NES), p values, and number of genes in each gene set. Normalized Enrichment Score (NES) shows the strongest correlation between gene sets was between iHCs and the primary hair cell (HC) gene set. Gene signature lists in Figure 3—source data 1.
-
Figure 3—source data 1
Gene Set Enrichment Analysis gene lists Gene Set Enrichment Analysis (GSEA) (Subramanian et al., 2005) was used to compare the transcriptomes in MEFs, P1 hair cells (HC), P1 Cerebellar granule precursors (CGP), adult Gut secretory cells (GUT), and P1 Merkel cells (MC).
We defined groups of genes as part of a specific signature for each cell type. MEF signature represents 188 genes. HC signature represents 109 genes. MC signature represents 43 genes. CGP signature represents 69 genes. GUT signature represents 113 genes. These gene signatures were used to calculate Normalized Enrichment Scores (NES) (Subramanian et al., 2005) and p-values for each cell type in comparison to iHCs (table, Figure 3D).
- https://cdn.elifesciences.org/articles/55249/elife-55249-fig3-data1-v1.xlsx
Figure 4

Chromatin accessibility of induced hair cells (iHCs) indicates profile similarity to primary cochlear hair cells.
(A) Heat map comparing genome wide chromatin accessibility profiles of MEFs, P1 HCs, and iHCs. Accessibility is divided into seven clusters: 1) successfully reprogrammed HC peaks, 2) not reprogrammed HC peaks, 3) inappropriately opened peaks, 4) successfully closed MEF peaks, 5) not reprogrammed MEF peaks, 6) inappropriately closed peaks, and 7) successfully unchanged peaks. Scale of each sample column is ± 2.5 Kb from ATAC peak. Venn diagrams show percent of correctly reprogrammed chromatin regions. 73% of unique P1 HC chromatin regions are successfully opened during reprogramming, and 84% of MEF chromatin regions are successfully closed in reprogramming. (B) Heat map comparing chromatin accessibility at primary cochlear hair cell enhancers. Enhancers were identified as regions with open chromatin ATAC peaks and H3K27ac in P1 HCs. ChIP data for H3K27ac shown as green heat map and ATAC chromatin accessibility data of the respective regions shown as blue heat maps. Heat maps ordered from low to high information content. iHCs successfully open P1 HC enhancer regions that were closed in the starting MEF population. Scale of each sample column is ± 2.5 Kb from ATAC peak. (C) Expression levels (Log2(RPKM)) of 3082 putative primary hair cell enhancer targets. Enhancer targets were identified by mapping to the nearest transcription start site for each enhancer and the expression of each putative target was acquired from the RNA-seq results. iHCs significantly upregulate the expression of the putative primary hair cell enhancer targets. (D) Integrative Genomics Viewer (Robinson et al., 2011) tracks show primary hair cell H3K27ac profile alongside chromatin accessibility profiles of P1 HCs, iHCs and MEFs. Chromatin accessibility changes at specific hair cell enhancers for Pou4f3, Mreg, Rasd2 and Barhl1 are highlighted in grey boxes.
Figure 5 with 1 supplement
Six1, Atoh1, Pou4f3 and Gfi1 are capable of reprogramming adult cells.
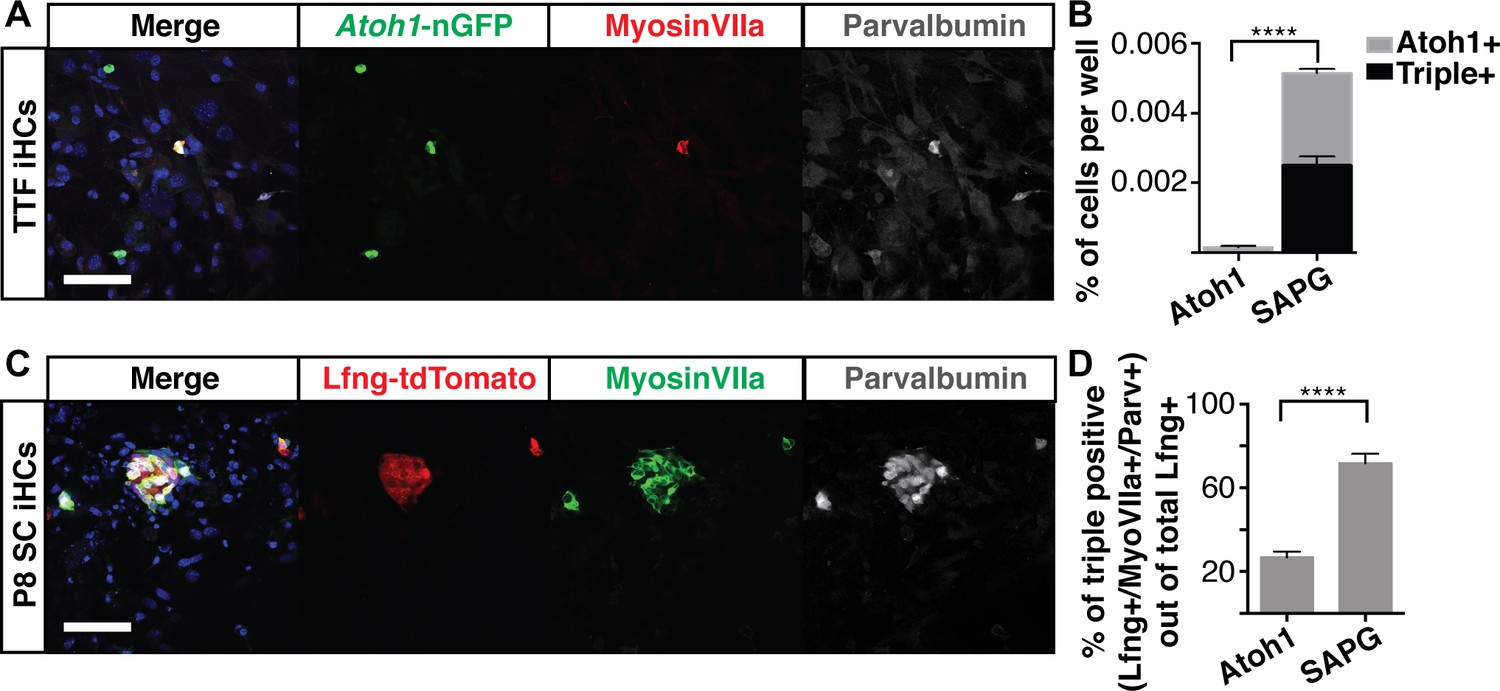
(A) Adult mouse tail tip fibroblasts (TTFs) were infected with SAPG and allowed to reprogram for 14 days before fixation and immunostaining. Reprogrammed TTF are able to activate the Atoh1-nGFP reporter and stain for anti-MyosinVIIa (red) and anti-Parvalbumin (grey). Merged image includes Hoechst nuclear stain (blue). TTFs were reprogrammed in HCM supplemented with 10% FBS and RepSox. Scale bar represents 50 um. (B) Quantification of Atoh1-nGFP+ cells and triple positive cells (Atoh1-nGFP+/MyosinVIIa+/Parvalbumin+) in TTFs infected with Atoh1 alone or SAPG. TTFs infected with SAPG generate significantly more Atoh1-nGFP+ cells and 48.6% (± 12) of the Atoh1-nGFP+ cells are triple positive. TTFs were reprogrammed in HCM supplemented with 10% FBS and RepSox. (N = 3 experiments, n = 3 replicates per experiment, mean ± SEM; Statistics shown for the comparison of triple positive cells in each condition; Student’s t-test *p<0.05, **p<0.01, ***p<0.001, ****p<0.0001). (C) Dissociated organs of Corti from P8 transgenic mice with lineage traced supporting cells (Lfng-tdTomato+ SC) were infected with SAPG. Cells were reprogrammed for 14 days prior to fixation and immunostaining for anti-MyosinVIIa (green) and anti-Parvalbumin (grey). P8 Lfng-tdTomato+ SCs infected with SAPG are able to activate primary hair cell markers MyosinVIIa and Parvalbumin. Scale bar represents 50 um. (D) Quantification of the percent of triple positive cells (Lfng-tdTomato+/MyosinVIIa+/Parvalbumin+) out of the total number of Lfng-tdTomato+ supporting cells per well in cultures infected with Atoh1 alone or SAPG. Presence of the Lfng-tdTomato reporter is independent of the viral infection. With Atoh1 alone 26.8% (± 7) of the total Lfng-tdTomato+ supporting cells are able to activate the primary hair cell markers MyosinVIIa and Parvalbumin, while with SAPG 71.8% (± 12) of the total Lfng-tdTomato+ supporting cells are able to activate primary hair cell markers. (n = 7 replicates, mean ± SEM; Student’s t-test *p<0.05, **p<0.01, ***p<0.001, ****p<0.0001).
Figure 5—figure supplement 1
Six1, Atoh1, Pou4f3 and Gfi1 are capable of reprogramming adult cells.
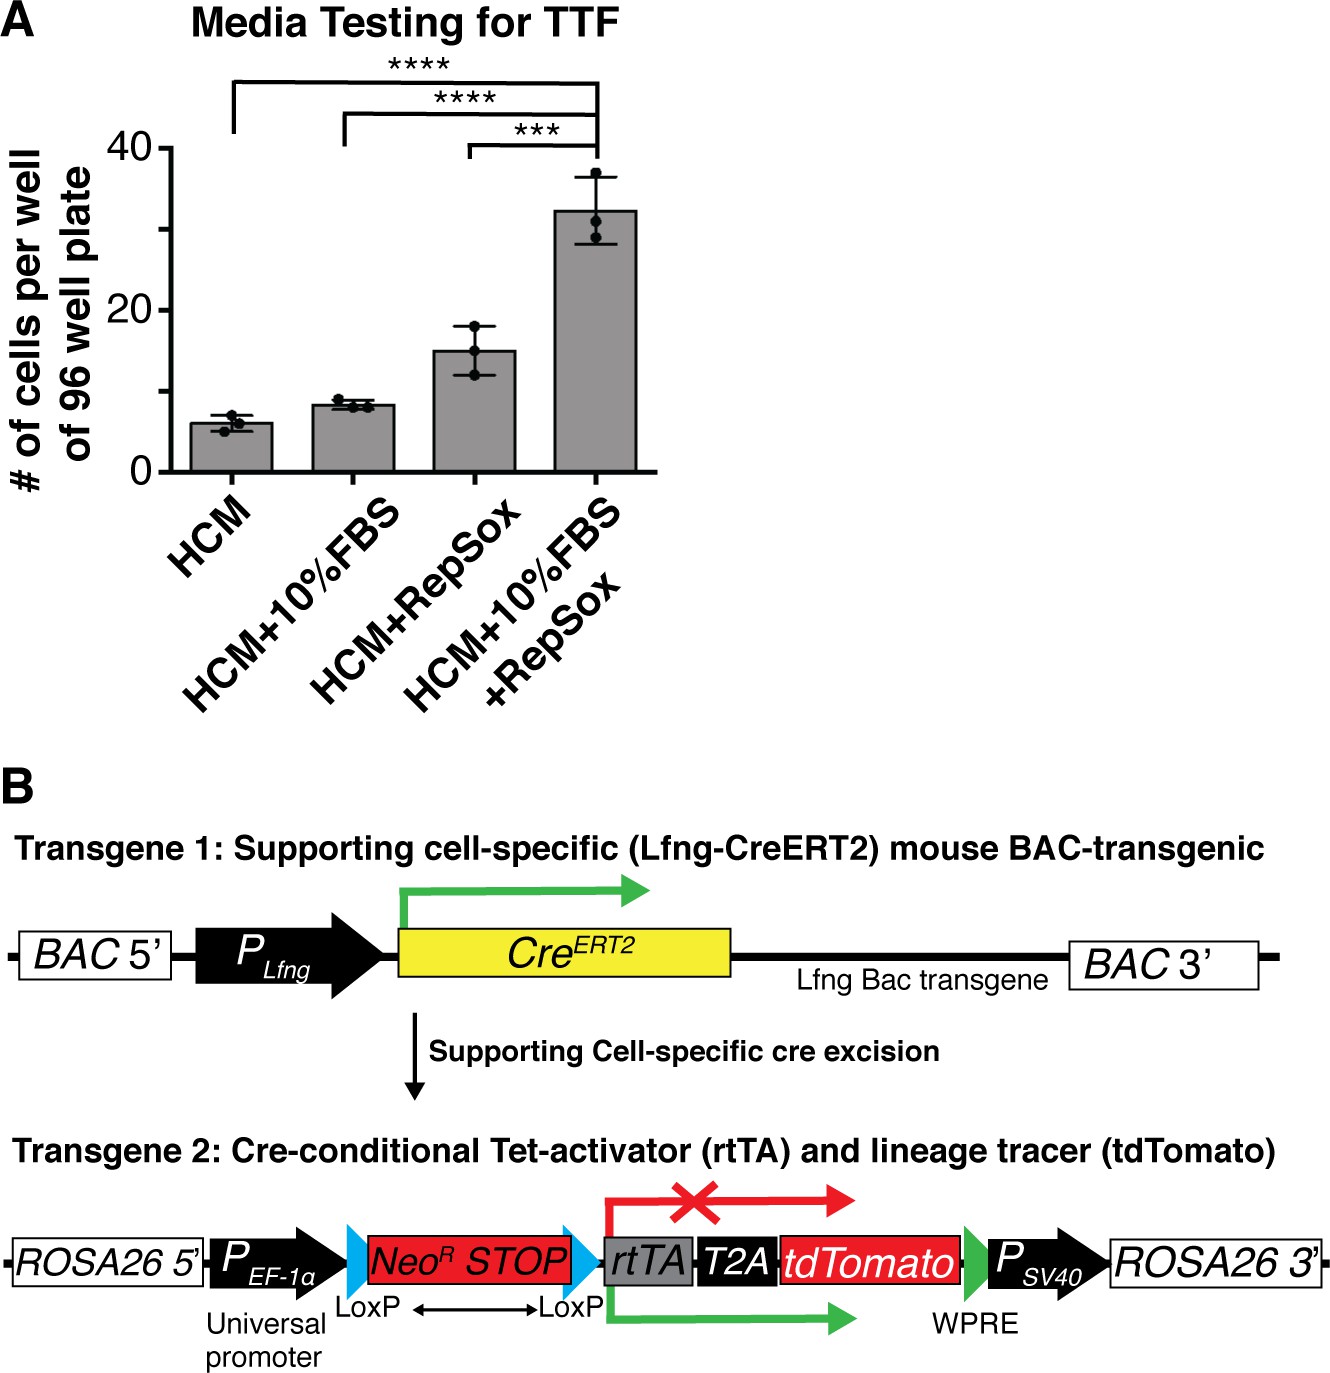
(A) Adult mouse tail tip fibroblasts (TTFs) were infected with SAPG and allowed to reprogram for 14 days before fixation and quantification. Regular hair cell media (HCM) was not optimal to culture TTF post-infection and caused severe loss of cells. TTF survival and reprogramming was best with the addition on 10% FBS and RepSox to the Hair Cell Media (HCM). (N = 3 experiments, n = 3 replicates per experiment, mean ± SEM; Student’s t-test *p<0.05, **p<0.01, ***p<0.001, ****p<0.0001). (B) Schematic of transgenes used for lineage tracing of Lunatic fringe (Lfng) positive supporting cells.
Figure 6 with 1 supplement
Induced hair cells demonstrate functional properties reminiscent of primary hair cells.
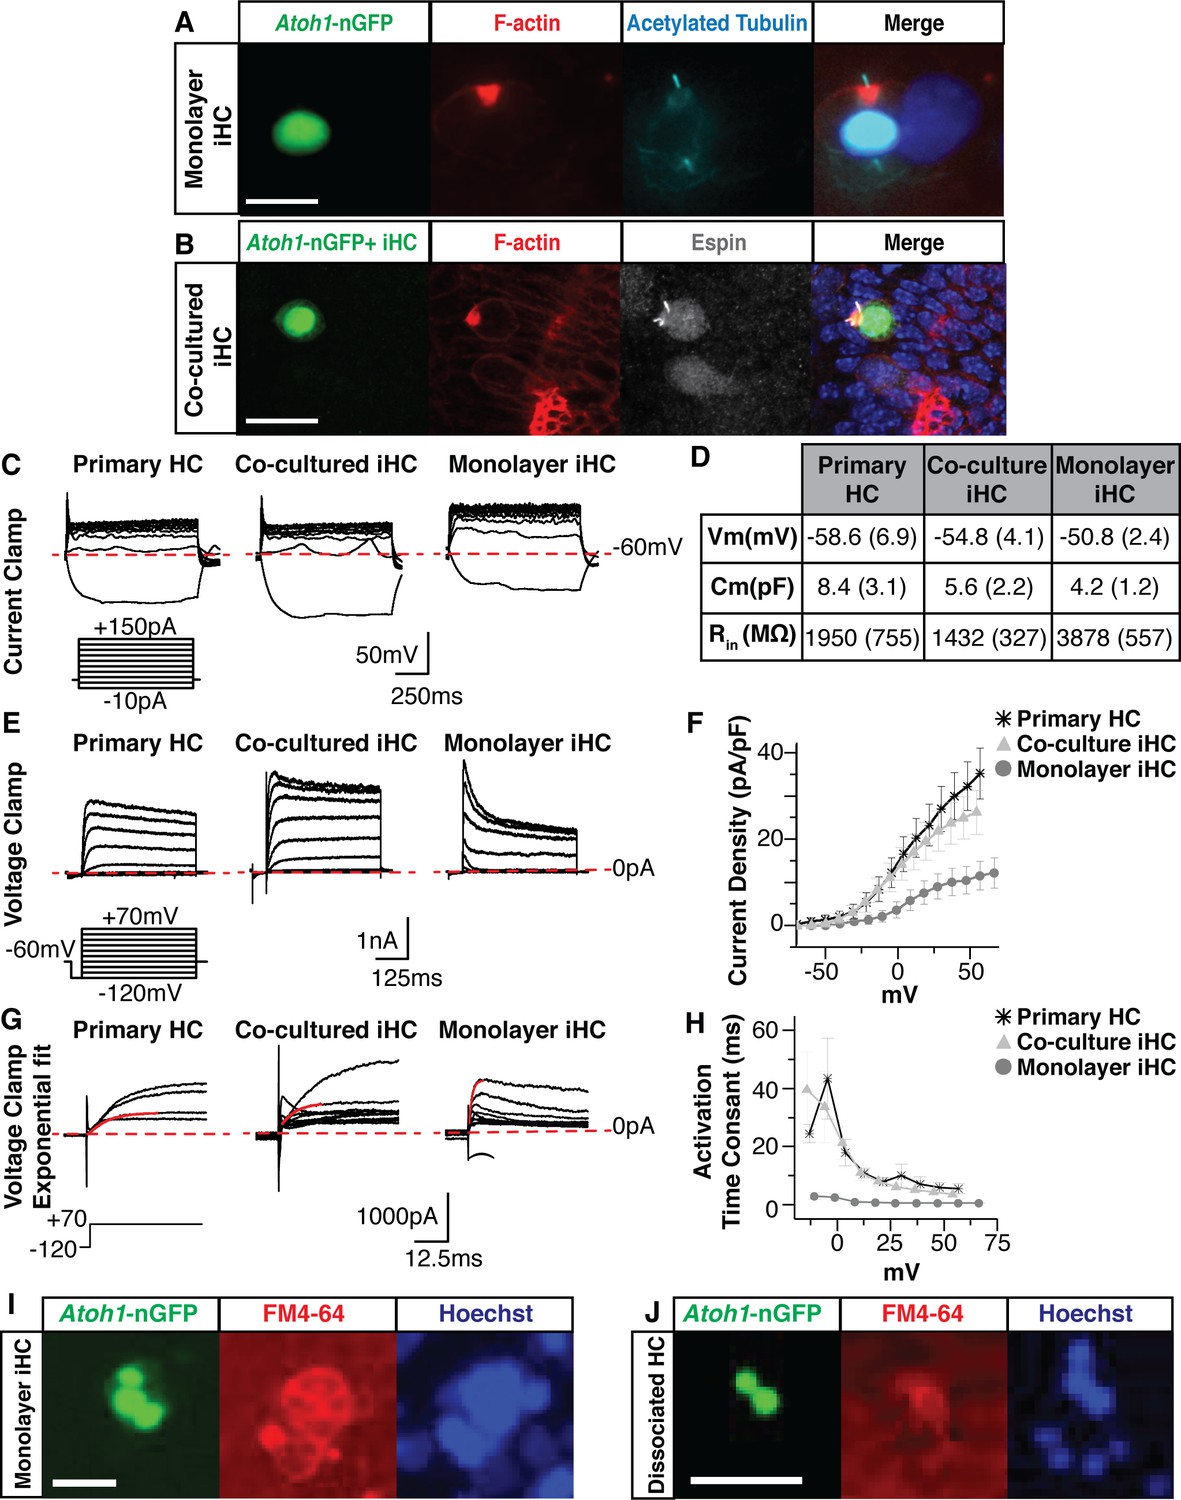
(A) Images of monolayer-cultured iHCs show polarized F-actin by Phalloidin labeling (red) and a kinocilium by anti-acetylated Tubulin labeling (cyan). Merged image includes Hoechst nuclear stain. Scale bar represents 10 um. (B) iHCs co-cultured with dissociated primary E13.5 organs of Corti show an F-actin rich cuticular plate by Phalloidin labeling (red) and stereocilia by anti-Espin labeling (grey). Merged image includes Hoechst nuclear stain. Scale bar represents 20 um. (C) Whole cell patch clamping was performed on P1 HCs from a dissociated organ of Corti, co-cultured iHCs and monolayer-cultured iHCs. Results from current clamp show the change in cell voltage as a response to an applied current. Dashed red line represents −60 mV. Current clamp protocol shows steps from −10 to +150 pA in 20 pA increments. Scale bars represent 50 mV on X-axis and 250 ms on Y-axis. (D) Basic membrane properties were calculated from the current clamp data to report resting membrane potential (Vm), membrane capacitance (Cm) and input resistance (Rin). Table reports mean (SEM) for each value. (E) Results from voltage clamp shows the current output of the cell as a response to applied voltage for primary HCs, co-cultured iHCs and monolayer-cultured iHCs. Dashed red line represents 0 pA. Voltage clamp protocol shows steps from −120 to +70 mV in 10 mV increments. Scale bars represent 1 nA on X-axis and 125 ms on Y-axis. (F) IV curve plotting current density (normalized for cell size) as a function of applied voltage for primary HCs, co-cultured iHCs and monolayer-cultured iHCs. Co-cultured iHCs show similar current output to P1 primary hair cells. (G) Exponential fits to the voltage clamp traces were used to calculate the current activation time constants for primary HCs, co-cultured iHCs and monolayer-cultured iHCs. Dashed red line represents 0 pA. Solid red line shows exponential fit to outward currents when clamped from −120 mV to +70 mV. Scale bars represent 1000 pA on X-axis and 12.5 ms of Y-axis. (H) Current activation time constants reported for P1 HCs, cocultured iHCs and monolayer-cultured iHCs. Co-cultured iHCs show similar current activation kinetics to P1 HCs. (I) iHCs expressing the Atoh1-nGFP reporter accumulate the styryl dye FM4-64. Image taken after 30 s of incubation with FM4-64. Nuclei labeled in blue using NucBlue live dye. Scale bar represents 25 um. (J) Dissociated primary hair cells expressing the Atoh1-nGFP reporter accumulate the styryl dye FM4-64. Image taken after 30 s of incubation with FM4-64. Nuclei labeled in blue using NucBlue live dye. Scale bar represents 25 um.
Figure 6—figure supplement 1
Induced hair cells demonstrate functional properties reminiscent of primary hair cells.
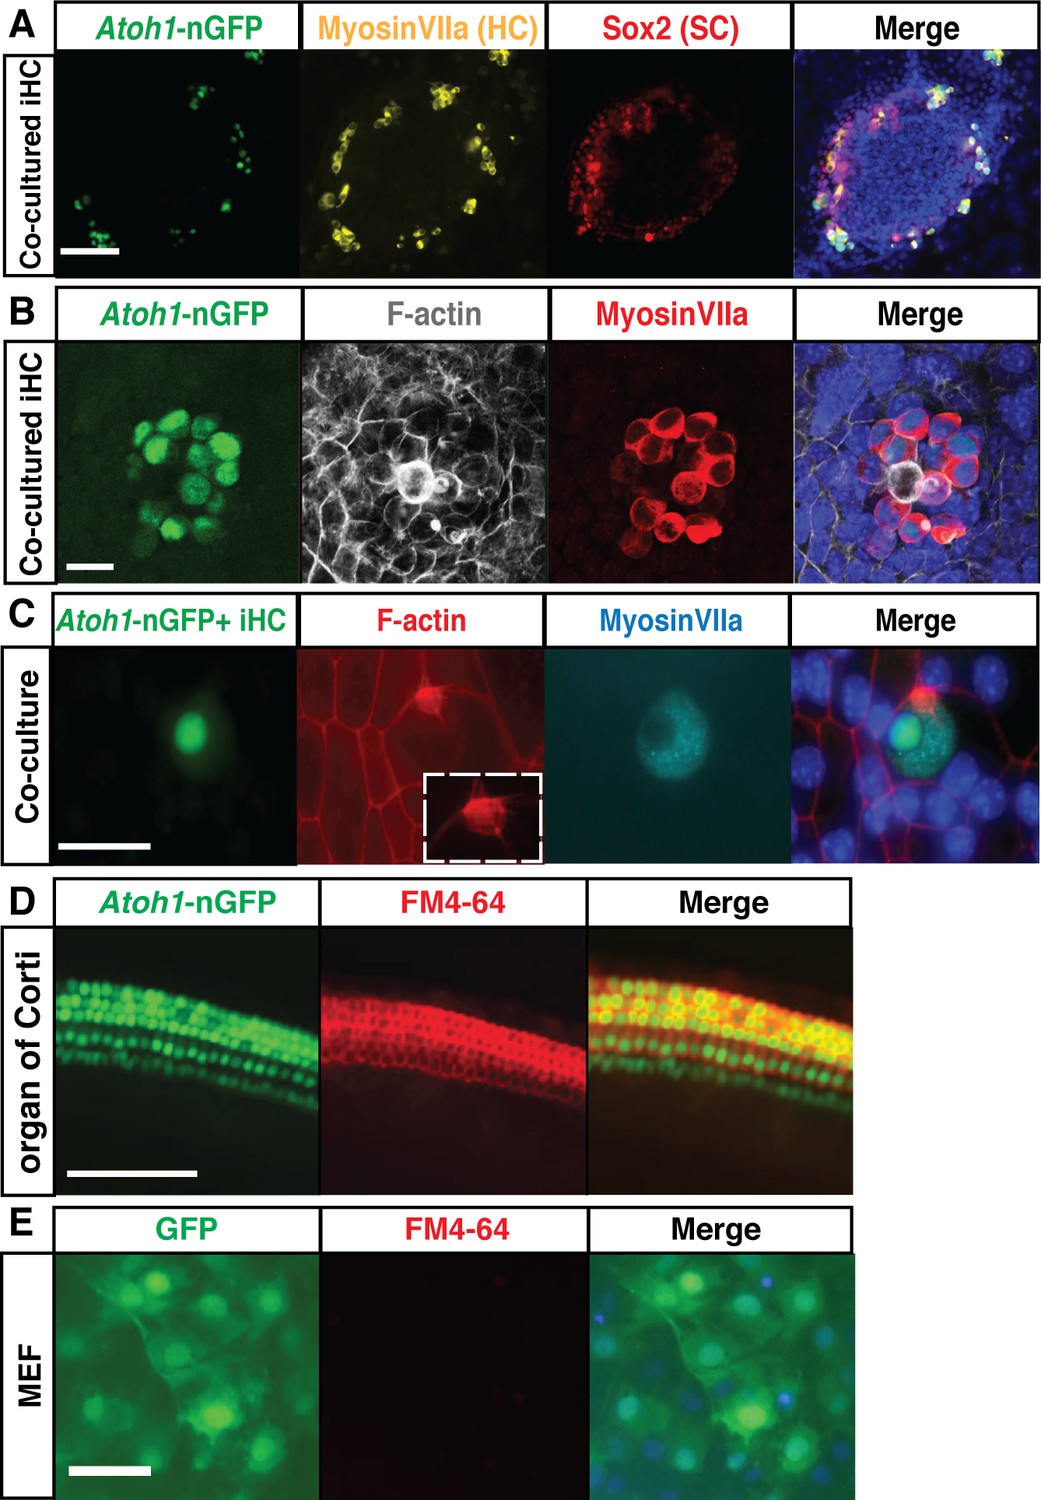
(A) iHCs (Atoh1-nGFP+/MyosinVIIa+) co-cultured with dissociated primary E13.5 organs of Corti organize into epithelial islands alongside primary hair cells (Atoh1-nGFP-/MyosinVIIa+) and primary supporting cells (Sox2+). Merged image includes Hoechst nuclear stain. Scale bar represents 100 um. (B) iHCs co-cultured with dissociated primary E13.5 organs of Corti show F-actin polarization by Phalloidin labeling (grey) and express MyosinVIIa (red). Merged image includes Hoechst nuclear stain. Scale bar represents 20 um. (C) iHCs co-cultured with dissociated primary E13.5 organs of Corti show F-actin rich projections by Phalloidin labeling (red) and express MyosinVIIa (cyan). Scale bar represents 20 um. (D) Organ of Corti explants from Atoh1-nGFP transgenic mice accumulate the styryl dye FM4-64 specifically in the hair cells. Image taken after 30 s of incubation with FM4-64. Merged image includes Hoechst nuclear stain. Scale bar represents 100 um. (E) MEFs infected with eGFP control virus do not accumulate the styryl dye FM4-64. Image taken after 30 s of incubation with FM4-64. Merged image includes Hoechst nuclear stain. Scale bar represents 50 um.
Figure 7 with 1 supplement
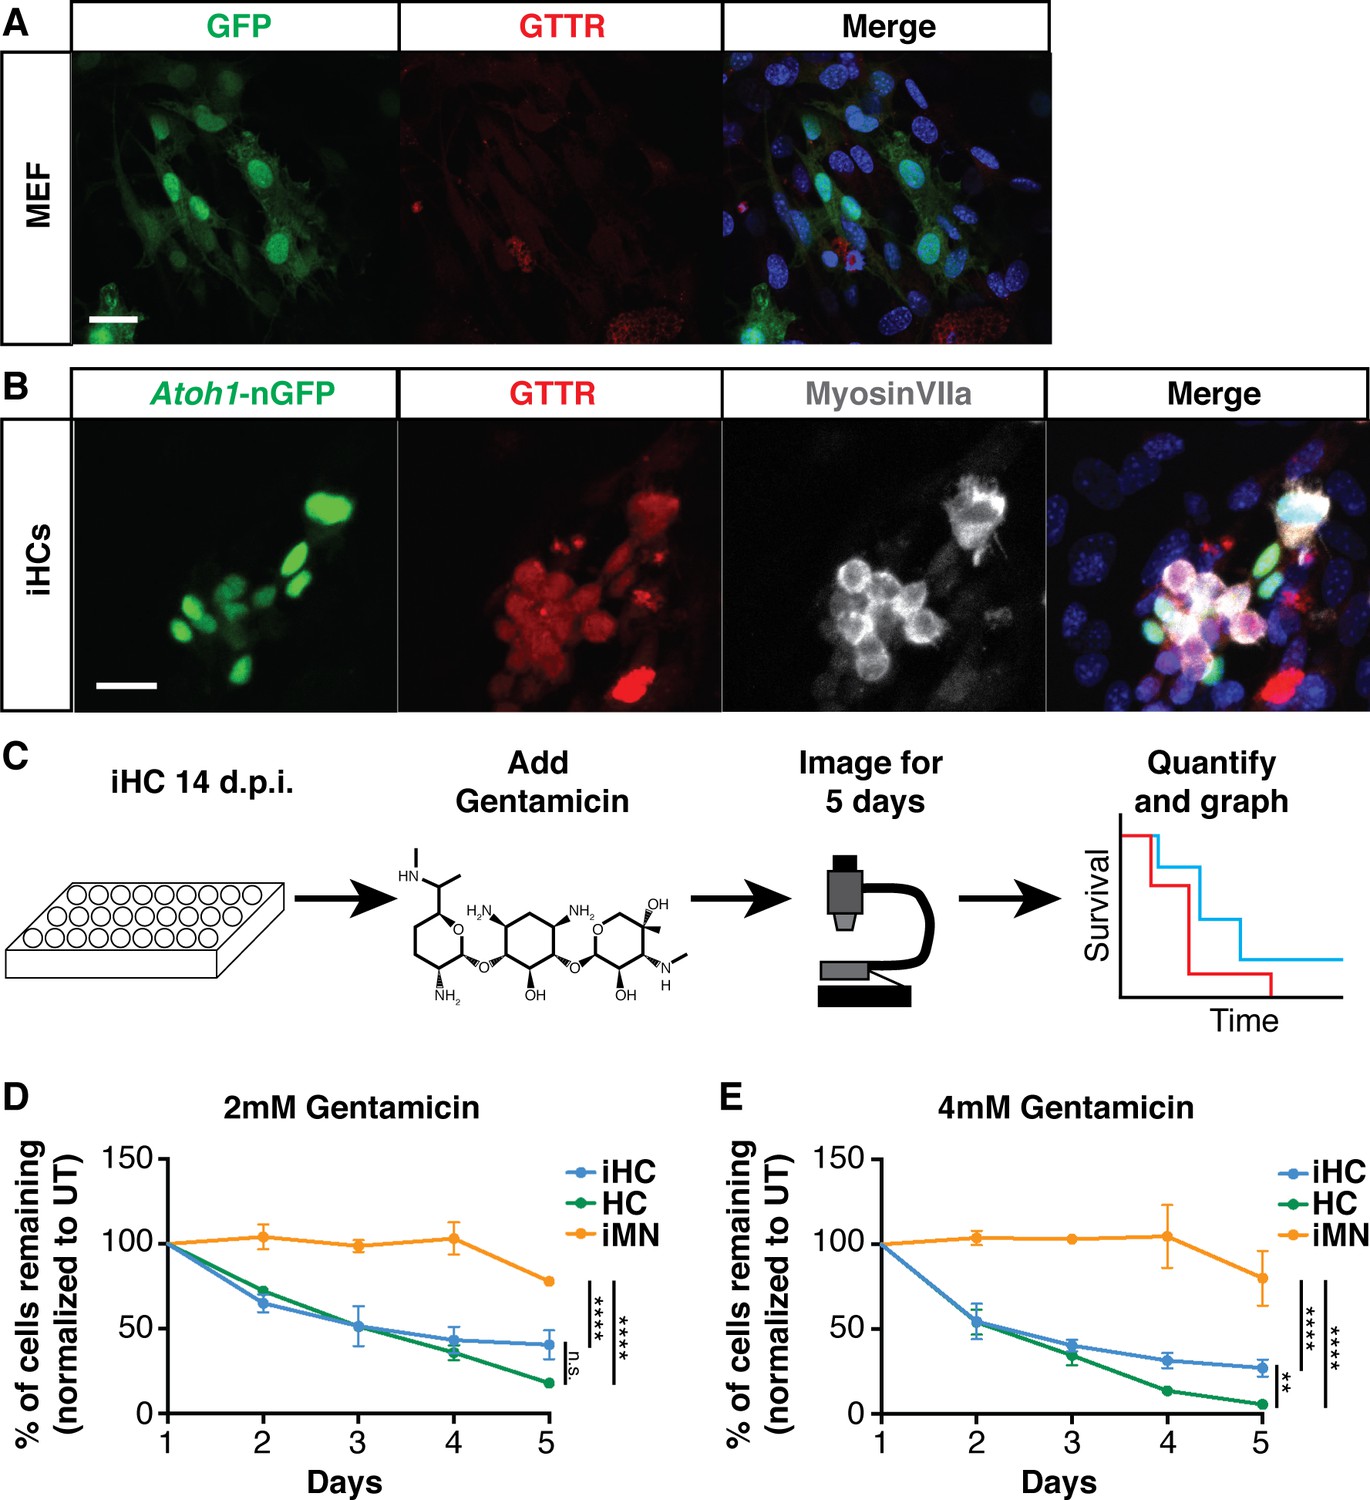
Induced hair cells recapitulate susceptibility to a known ototoxin, Gentamicin.
(A) MEFs infected with eGFP control virus do not accumulate Gentamicin-Texas Red (GTTR). MEFs were treated with 0.5 mM GTTR for 3 hr. Merged image includes Hoechst nuclear stain. Scale bar represents 50 um. (B) iHCs can accumulate GTTR. iHCs were treated with 0.5 mM GTTR for 3 hr. iHCs were also labeled for anti-MyosinVIIa (grey). Merged image includes Hoechst nuclear stain. Scale bar represents 50 um. (C) Schematic of experimental design for longitudinal survival of Atoh1-nGFP+ iHCs. (D–E). Longitudinal survival tracking of P1 hair cells (HC) from dissociated organ of Corti preparations, induced hair cells (iHCs) and induced motor neurons (iMNs) treated with gentamicin at 2 mM and 4 mM respectively. (n = 3 replicates each; mean ± SEM; Two-Way ANOVA *p<0.05, **p<0.01, ***p<0.001, ****p<0.0001).
Figure 7—figure supplement 1
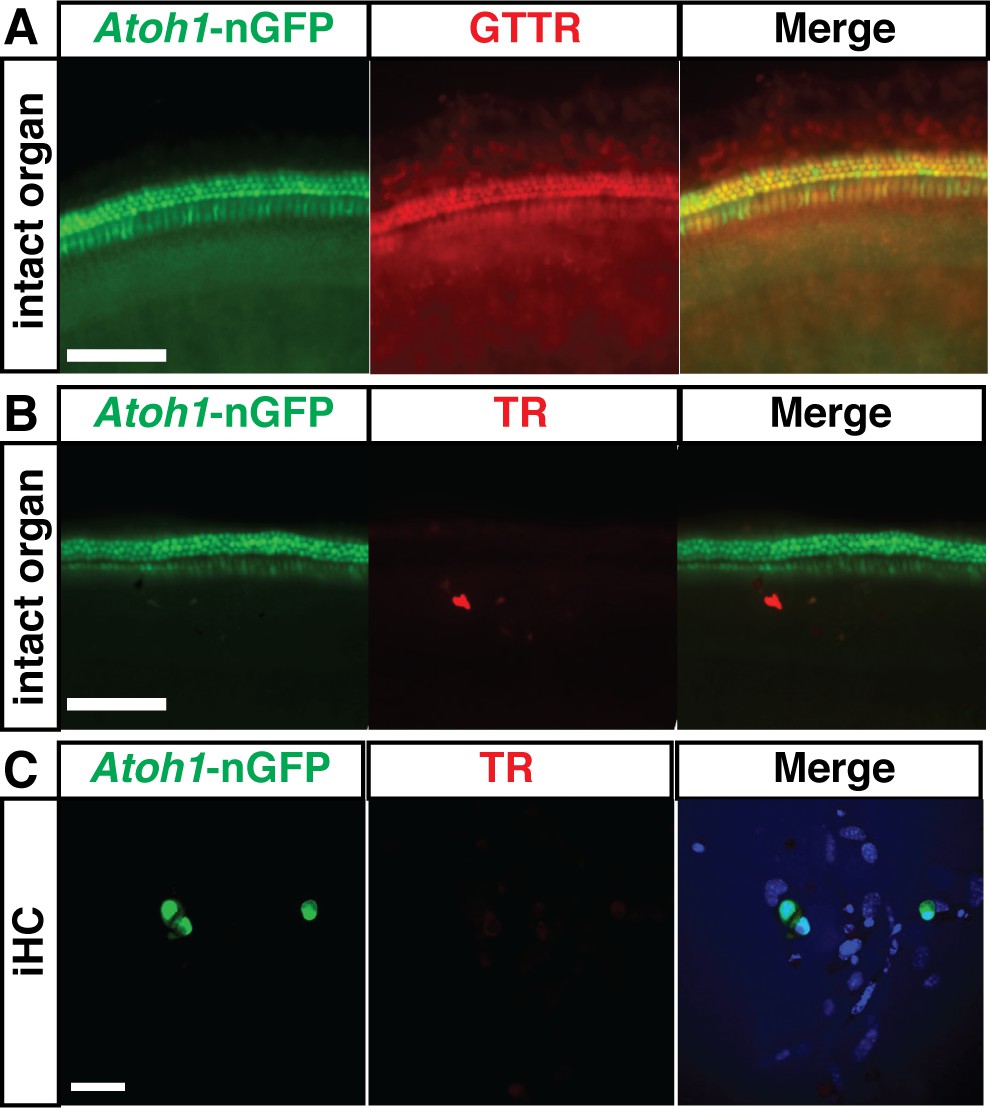
Induced hair cells recapitulate susceptibility to a known ototoxin, Gentamicin.
(A) Organ of Corti explants from Atoh1-nGFP transgenic mice accumulate Gentamicin-Texas Red (GTTR) specifically in the hair cells. Organs were treated with 0.5 mM GTTR for 3 hr. Scale bar represents 100 um. (B) Organ of Corti explants from Atoh1-nGFP transgenic mice do not accumulate Texas Red (TR) alone. Organs were treated with 0.5 mM TR for 3 hr. Scale bar represents 100 um. (C) Induced hair cells (iHCs) do not accumulate Texas Red alone. iHCs were treated with 0.5 mM TR for 3 hr. Merged image includes Hoechst nuclear stain. Scale bar represents 50 um.
Author response image 1
Additional files
Download links
A two-part list of links to download the article, or parts of the article, in various formats.
Downloads (link to download the article as PDF)
Open citations (links to open the citations from this article in various online reference manager services)
Cite this article (links to download the citations from this article in formats compatible with various reference manager tools)
Generation of inner ear hair cells by direct lineage conversion of primary somatic cells
eLife 9:e55249.
https://doi.org/10.7554/eLife.55249


