A muscle-epidermis-glia signaling axis sustains synaptic specificity during allometric growth in Caenorhabditis elegans
- Department of Neurosurgery, the State Key Laboratory of Medical Neurobiology and MOE Frontiers Center for Brain Science, the Institutes of Brain Science, and Zhongshan Hospital, Fudan University Shanghai, China
- State Key Laboratory of Genetic Engineering, Department of Biochemistry, School of Life Sciences, Fudan University, China
- Program in Cellular Neuroscience, Neurodegeneration and Repair, Department of Neuroscience and Department of Cell Biology, Yale University School of Medicine, United States
- Instituto de Neurobiología, Recinto de Ciencias Médicas, Universidad de Puerto Rico, Puerto Rico
Figures
Figure 1 with 1 supplement
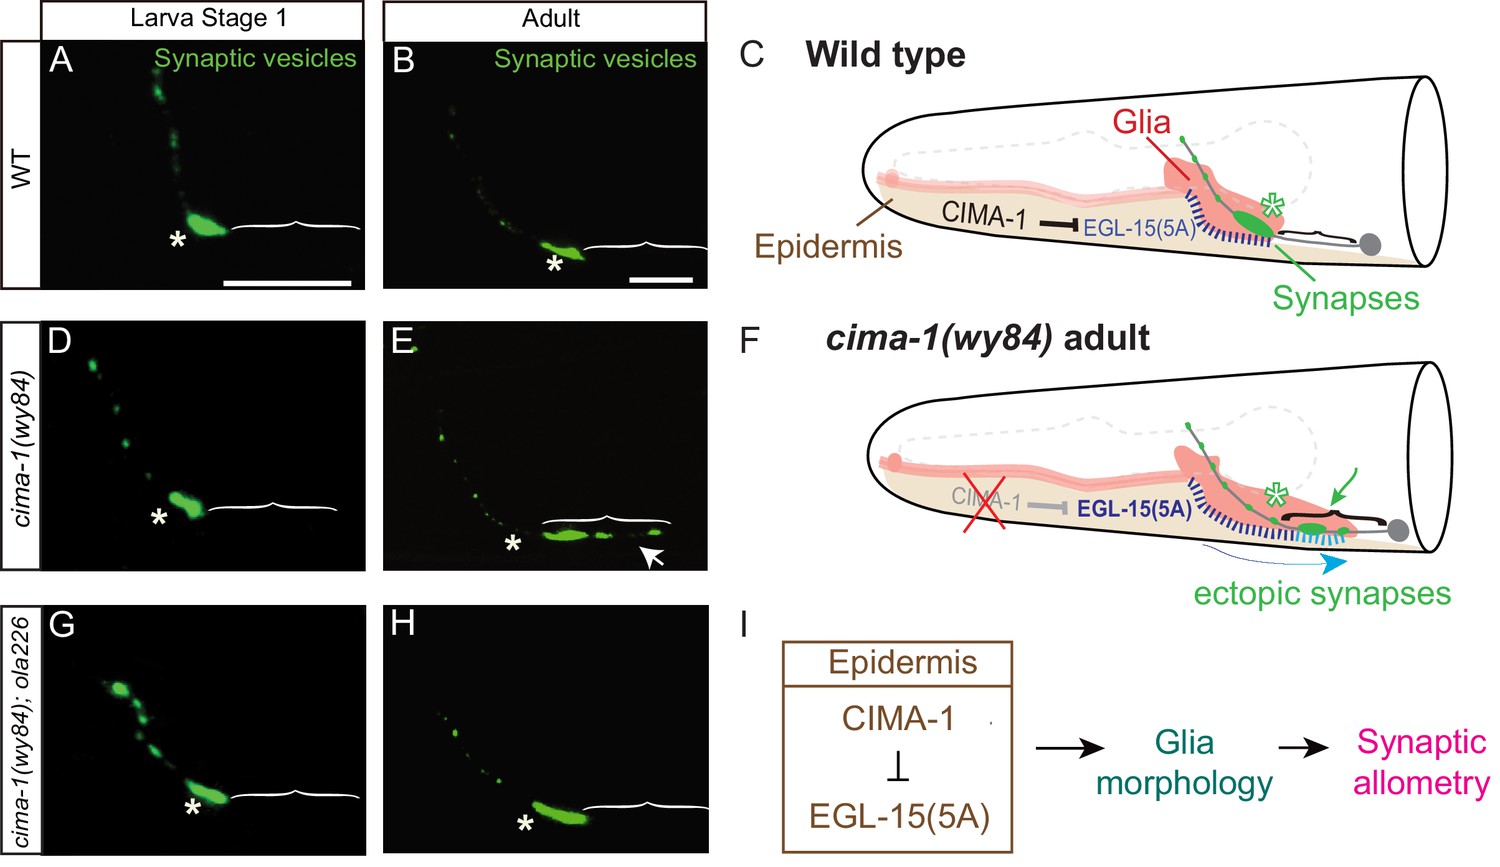
Synaptic allometry in AIY neurons.
(A–C) Distribution of AIY synapses in wild-type animals, and model. (A–B) Confocal micrograph images of AIY presynaptic sites labeled with the synaptic vesicle marker mCherry::RAB-3 (pseudo-colored green) in wild-type larval stage 1 (L1) animals (A) and adult animals (B). Note that although animals grow (scale bars in A and B both correspond to 10 μm), in wild-type animals the synaptic pattern is sustained from L1 to adults. Asterisks indicate the synaptic-rich Zone 2 and brackets indicate the asynaptic Zone 1 regions of AIY (see Figure 2A). (C) Graphical abstract of the findings of Shao et al. (2013). In wild-type animals, CIMA-1 acts in epidermal cells to suppress the epidermally derived FGF Receptor/EGL-15, which in turn maintains VCSC glia morphology, which likely mediates adhesion between the epidermal cell and glia. In cartoon, epidermal cells in beige, glia in red, AIY neuron in grey, synapses in green, Zone 2 region indicated by asterisk and stitches represent contact sites between the epidermis and glia. Also outlined in grey dashed lines, the position of the pharynx for reference. (D–F) As (A–C), but for cima-1(wy84) loss-of-function mutants. In cima-1 loss-of-function mutants, EGL-15(5A)/FGF Receptor protein levels are upregulated, and this promotes adhesion of epidermis to glia and causes glia position and morphology defects during growth (F). This in turn extends the glia-AIY contact site to the asynaptic Zone 1 region, causing ectopic synapse formation in Zone 1 (see also Figure 1—figure supplement 1C–F). Blue arrow in (F) represent the changes in glia position and morphology due to increased interaction with epidermal cells, and green arrow marks ectopic synapses in Zone 1 (brackets). (G–H) As in (A–B), but in cima-1(wy84);ola226 double mutants. Note that the cima-1 synaptic phenotype (E) is suppressed in the cima-1(wy84);ola226 double mutant (H). (I) Schematic model of the multi-tissue CIMA-1 regulation of synaptic allometry in AIY. The scale bars in (A) apply to (D and G), and scale bars in (B) apply to (E and H). Both are 10 μm.
Figure 1—figure supplement 1
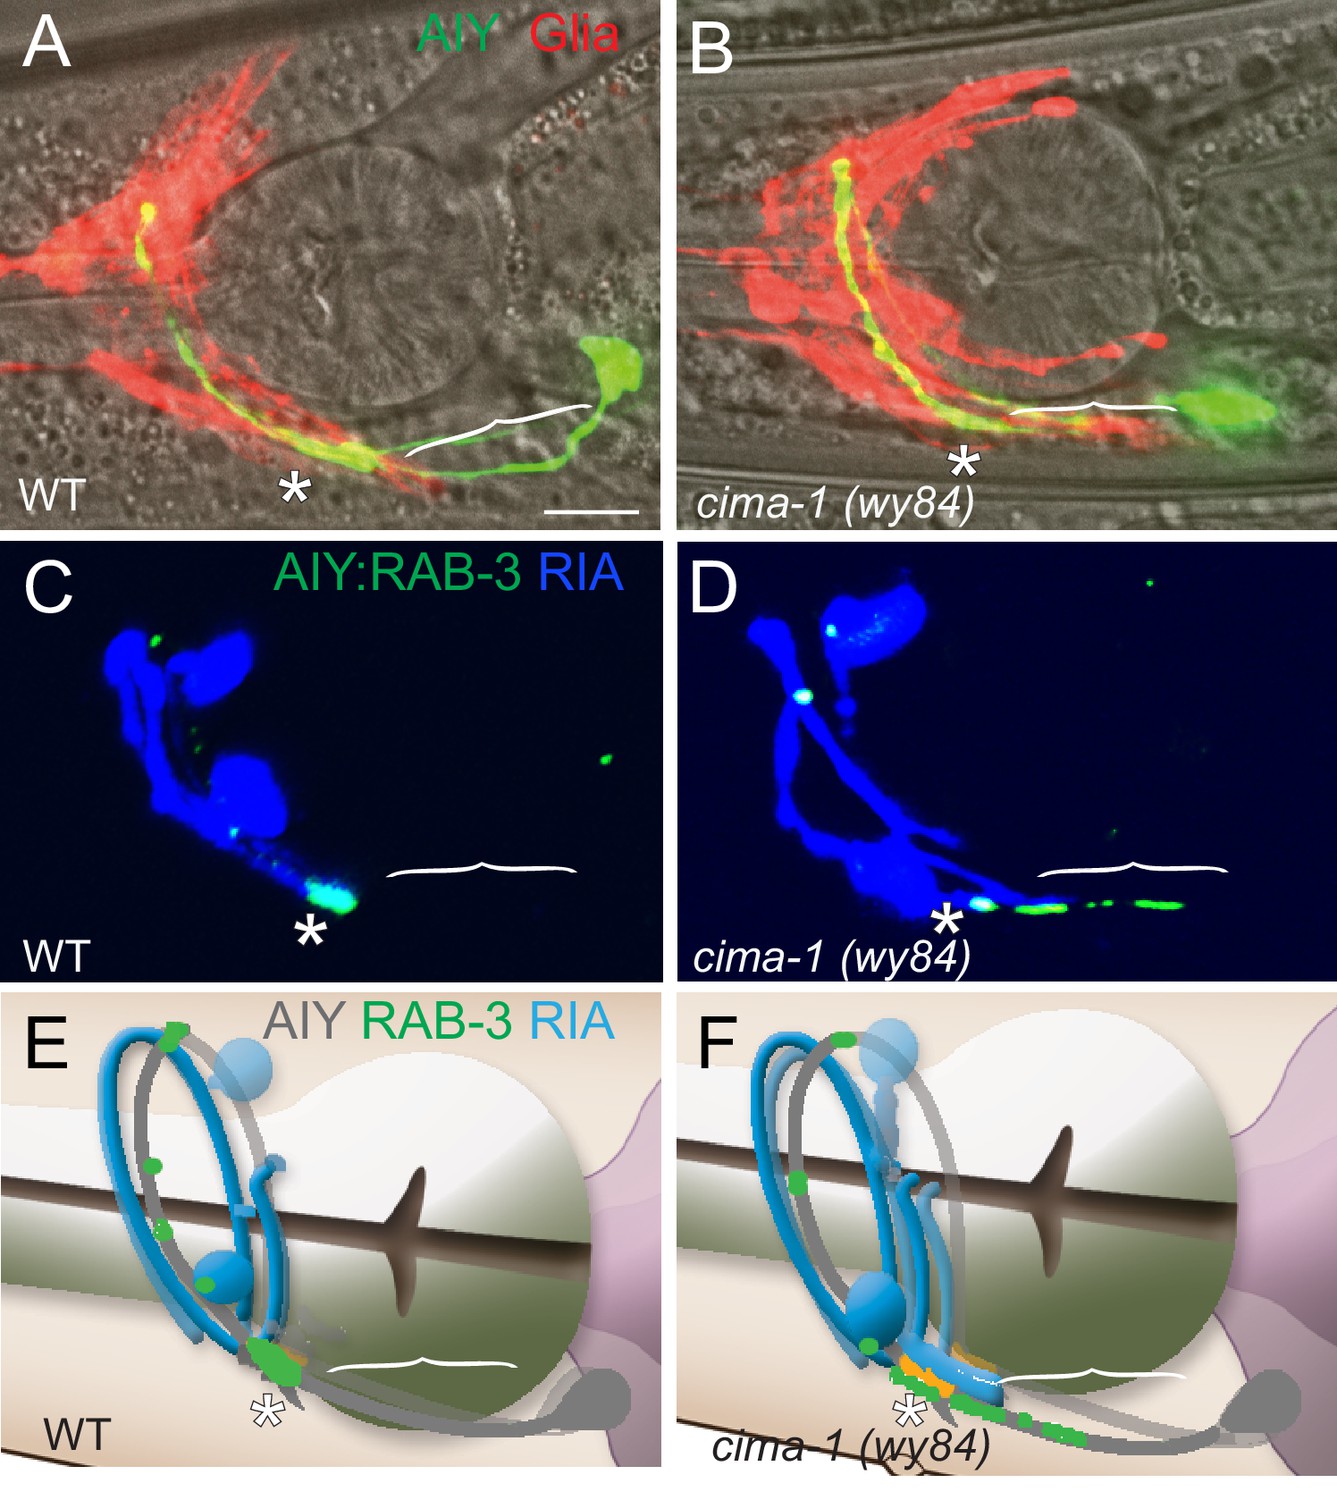
Model of CIMA-1 site of action.
(A–B) Confocal micrographs of AIY cytoplasmic GFP (green) and VCSC glia cytoplasmic mCherry (red) merged with bright field (with pharynx visible for reference) in wild type (A) and cima-1(wy84) (B) adults. (C–D) Confocal micrographs of postsynaptic neuron RIA (cytoplasmic mCherry, pseudocolored blue) and AIY synapses (GFP::RAB-3, green) in wild type (C) and cima-1(wy84) (D) adults. Note that in cima-1(wy84) mutants, the ectopic presynaptic sites in Zone 1 do not correspond to sites where postsynaptic RIA is present. The scale bar (in (A)), 10 μm, applies to all images. (E–F) Cartoon diagrams (derived from WormAtlas.org) describing the anatomical relation between presynaptic AIY neurons (gray) and postsynaptic RIA neurons (blue) of wild type and cima-1(wy84) mutants corresponding to (C) and (D). Brackets indicate the AIY Zone 1 region, asterisks mark the Zone 2 region.
Figure 2 with 1 supplement

Mutant allele ola226 suppresses cima-1 (wy84) synaptic allometry defects in AIY.
(A) Cartoon diagram of the distribution of presynaptic sites in the AIY interneurons of the nematode C. elegans. The head of C. elegans (solid black lines) and the pharynx (dashed grey line) are outlined. A single AIY interneuron is depicted in gray, an oval represents the cell body and a solid gray line represents the neurite. Presynaptic puncta are green. The AIY neurites can be subdivided into three zones: an asynaptic region proximal to the cell body called Zone 1, a synapse-rich region called Zone 2 (asterisk) and a region with sparse synapses, called Zone 3. The red (b) and blue (a) dashed lines represent synaptic distribution and correspond to Zone 2 and 3 (respectively) in wild-type animals. The dotted box represents the region of the head imaged in B-D’. (B–D’’) Confocal micrograph images of AIY presynaptic sites labeled with the synaptic vesicle marker mCherry::RAB-3 (pseudo-colored green, B–D) and active zone protein GFP::SYD-1 (pseudo-colored red, (B’–D’) for wild type (B, B’, B’’), cima-1(wy84) mutants (C, C’, C’’) or cima-1(wy84);ola226 (D, D’, D’’). Merged images display co-localization of synaptic vesicle marker mCherry::RAB-3 and active zone protein GFP::SYD-1 in (B”–D”). Schematic diagrams of the observations are depicted in (B’’’–D’’’). Scale bar in (B) applies to all images, 10 μm. Asterisk: Zone 2 region; Arrows: ectopic synapses in Zone 1 region (see also Figure 1—figure supplement 1C–F). (E) Quantification of the percentage of animals displaying ectopic AIY presynaptic sites in the Zone 1 region for indicated genotypes. (F) Quantification of the ratio of ventral synaptic length (see red (b) to total synaptic region (sum of the length of blue (a) and red (b) in schematic in (A and B’’’–D’’’)). The total number of animals (N) and the number of times scored (n) are indicated in each bar for each genotype as N/n. Error bars represent SEM. Statistical analyses are based on one-way ANOVA by Tukey’s multiple comparison test, ****p<0.0001 as compared to wild type (if on top of bar graph), unless brackets are used between two compared genotypes.
Figure 2—figure supplement 1
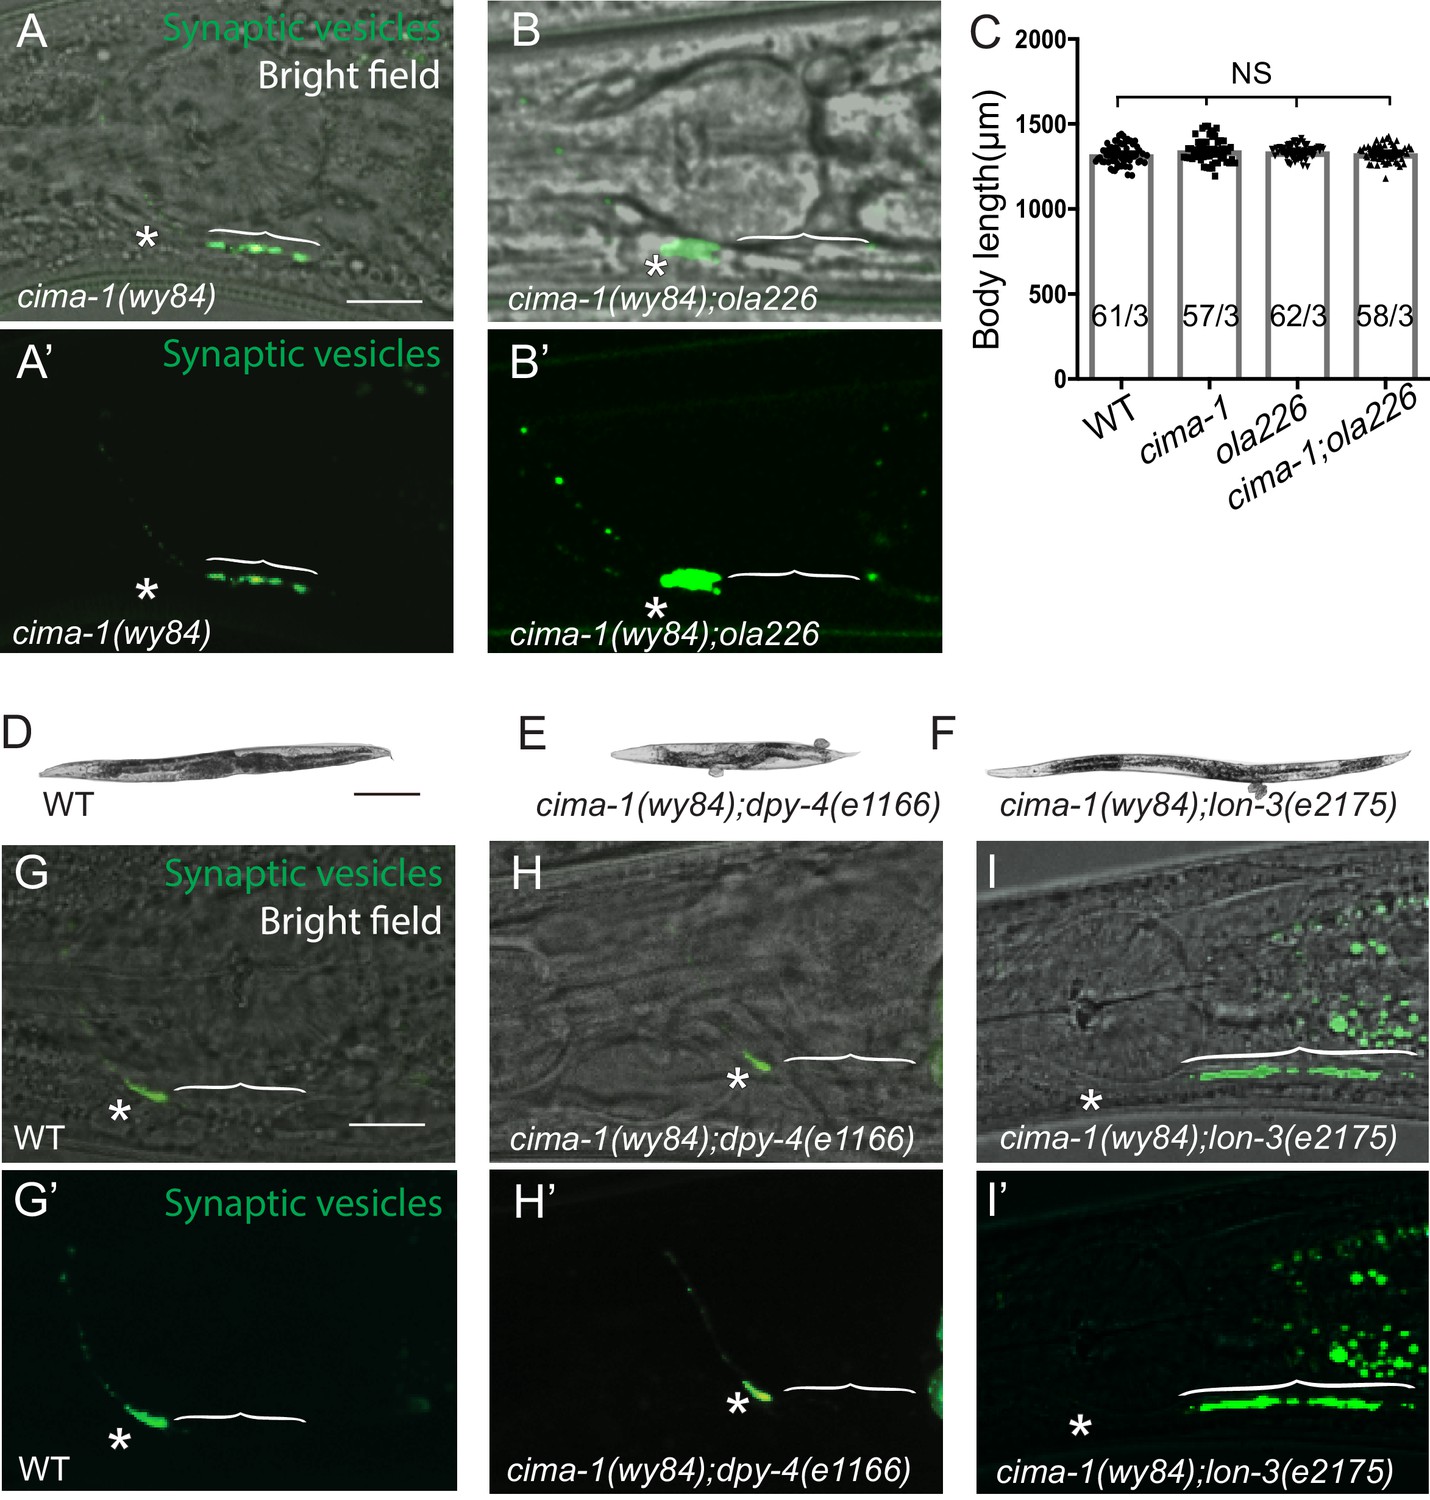
Relationship between body size and synaptic allometry in cima-1(wy84) mutants and the ola226 allele.
(A–B’) Confocal micrographs of GFP::RAB-3 in cima-1(wy84) (A, A’) and cima-1(wy84);ola226 (B, B’) with bright field (A,B) displaying the position of the pharynx second bulb for reference, or without bright field (A’, B’). Brackets indicate the AIY Zone 1 region; asterisks indicate the Zone 2 region, and scale bar in (A) corresponds to 10 μm and applies to (A–B’). (C) Quantification of the total animal length of wild type, cima-1(wy84), ola226 and cima-1(wy84);ola226 mutants. In the graph, the total number of animals (N) and the number of times scored (n) are indicated in each bar for each genotype as N/n. Error bars represent SEM. Statistical analyses are based on one-way ANOVA by Tukey’s multiple comparison test, N.S.: not significant or p>0.05. Note that although ola226 suppresses the ectopic synapses in cima-1(wy84), the length of ola226 or cima-1(wy84);ola226 is similar to that of wild type or cima-1(wy84) animals, indicating that the effects of ola226 in the cima-1(wy84) phenotype is through mechanisms distinct from those regulating the general size of the animal during development. (D–F) Images of wild type (D), cima-1(wy84);dpy-4(e1166) (E) and cima-1(wy84);lon-3 (e2175) (F) mutant animals. The dumpy or long mutants are ~25% shorter or longer than wild type animals, respectively. (G–I’) Confocal micrographs of the AIY presynaptic sites (visualized with GFP::RAB-3, green) in adult wild type (G, G’), cima-1(wy84);dpy-4(e1166) (H, H’), cima-1(wy84);lon-3(e2175) (I, I’) with bright field (G–I) or without bright field (G’–I’). Note that the length of the adult animal, which varies between dumpy or long mutants, alters the expressivity of the cima-1(wy84) synaptic defect. Therefore growth, and the size of the animal, affect the expressivity of the allometry phenotypes in cima-1(wy84) mutants. Yet, we note that the suppression of cima-1(wy84) synaptic phenotype by ola226 is not due to changes in body size (as shown in C). Brackets indicate the AIY Zone 1 region; asterisks indicate the Zone 2 region. Scale bar in (D) is 200 μm and applies to (E) and (F). Scale bar in (G) is 10 μm and applies to (G–I’).
Figure 3 with 1 supplement

Glia morphology is affected in ola226 mutants.
(A) Cartoon diagram of the ventral and dorsal cephalic sheath cell glia (red) in the C. elegans head. The ventral cephalic sheath cell (VCSC) glia, located at the bottom half in the schematic, contacts the AIY synapses in the Zone 2 region. (B–E’) Confocal micrographs of the morphology of VCSC glia and the anterior process (red, labeled with Phlh-17::mCherry, (B–E), or VCSC glia cell body and endfeet (red) with the AIY presynaptic marker (green, GFP::RAB-3, (B’–E’) in adult wild type (B, B’), cima-1(wy84) mutants (C, C’), cima-1(wy84);ola226 mutants (D, D’), and ola226 mutants (E, E’). Brackets indicate the AIY Zone 1 region, and asterisks mark the AIY Zone 2 region (see Figure 2A). The animals imaged in B-E are not the same as B’-E’. (F–H) Quantification of phenotypes, including the length of glia anterior process (F, indicated in schematic A), the length of ventral endfeet (G, indicated in schematic A) and the percentage of animals displaying overlap between AIY synapses and VCSC glia in Zone 1 (H). The total number of animals (N) and the number of times scored (n) are indicated in each bar for each genotype as N/n. Statistical analyses are based on one-way ANOVA by Tukey’s multiple comparison test. Error bars represent SEM, N.S.: not significant as compared to wild type, ****p<0.0001 as compared to wild type (if on top of bar graph), unless brackets are used between two compared genotypes.
Figure 3—figure supplement 1
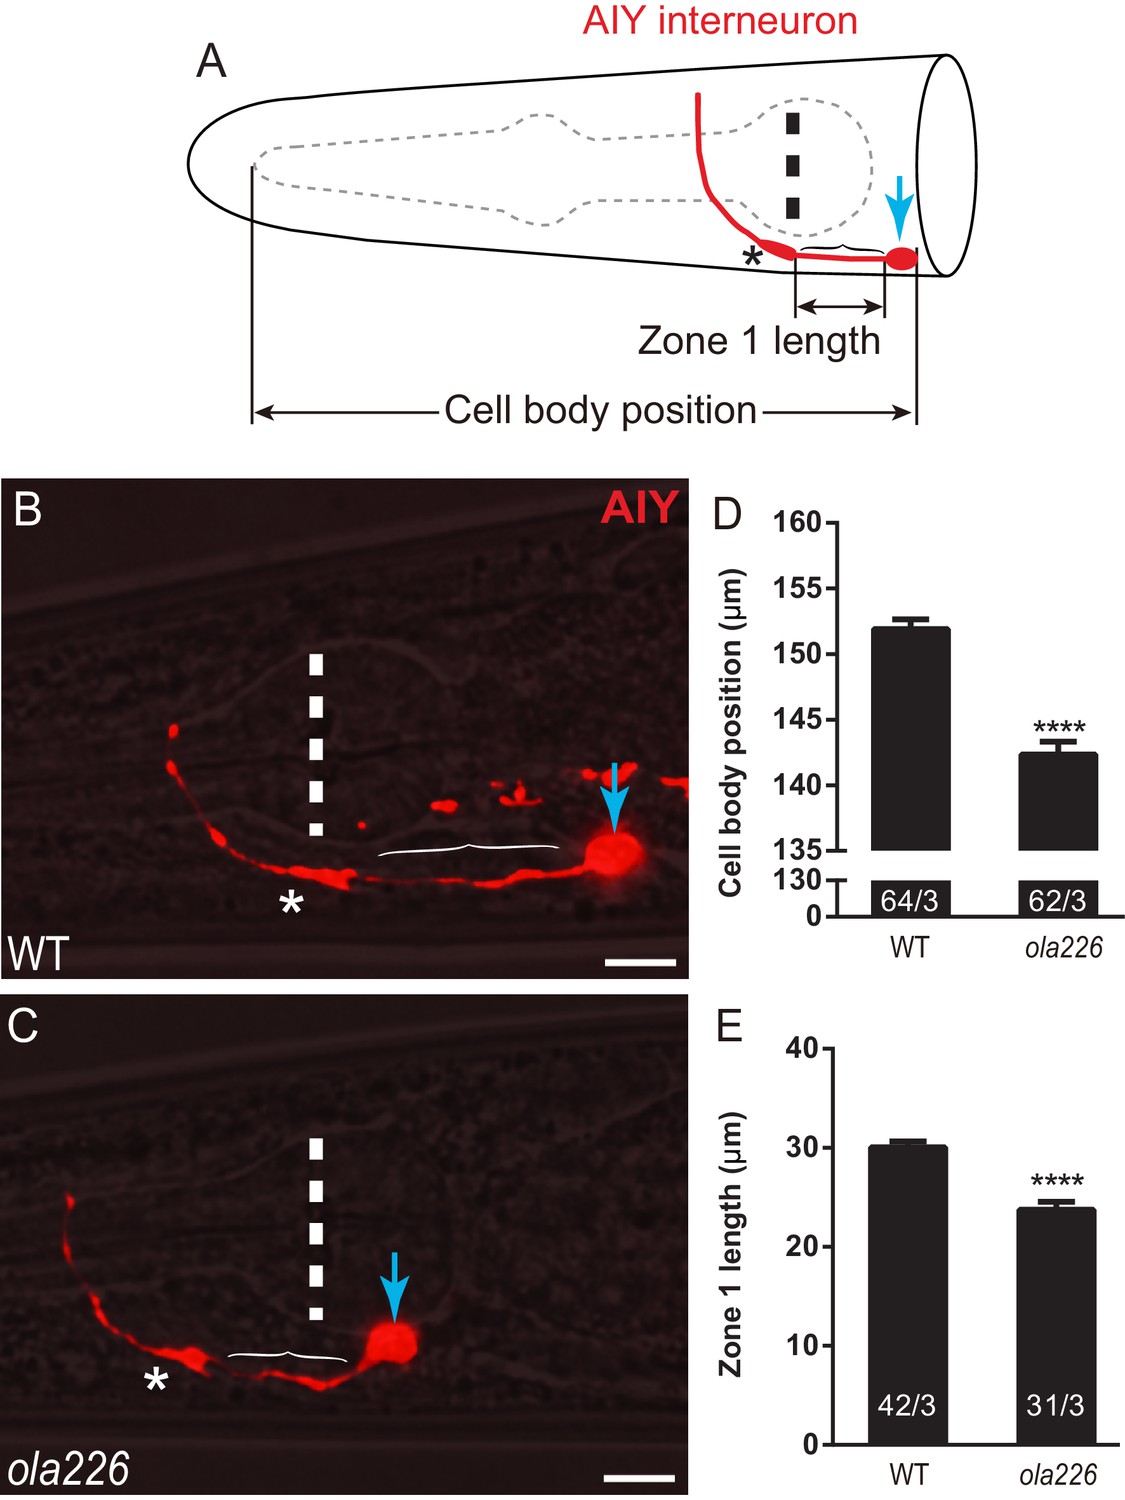
ola226 affects AIY neurite and cell body position.
(A) A cartoon diagram of AIY (red) in the C. elegans head. The blue arrow indicates the cell body, bracket indicates the Zone 1 region, asterisk indicates the Zone 2 region, and vertical dashed line indicates center of pharynx bulb here and in micrographs B and C. Lengths scored for cell body position (graph in D) and Zone 1 length (graph in E) are shown. (B–C) Confocal micrographs of AIY (red) with bright field microscopy for wild type (B) and ola226 mutants (C). In (B), a co-marker used in the study is also visible proximal to AIY. Importantly for the study, while AIYs have the same shape in the inspected genotypes, note the differences in the AIY neurite and cell body positions between these two genotypes compared to the pharynx bulb (visible with bright field). (D–E) Quantification of the position of AIY (length between the tip of pharynx and the AIY cell body, as indicated in the schematic in (A)) in (D). Quantification of the length of Zone 1 (E) in wild type and ola226 mutant animals. The AIY position is quantified by measuring the distance between the tip of the pharynx and the center of AIY soma. Although the length of pharynx of mig-17 mutants is increased, the length indicating the AIY position is decreased, suggesting that the change of the AIY position is not a second effect of the pharynx defect. In the graph, the total number of animals (N) and the number of times scored (n) are indicated in each bar for each genotype as N/n. Error bars represent SEM. Statistical analyses are based on two-tailed student’s t-test, ****p<0.0001.
Figure 4 with 2 supplements

ola226 is a lesion in the mig-17 gene.
(A) Schematic diagram of the mig-17 gene and corresponding protein domains coded by the exons (colored) and genetic lesions for the alleles used in this study. (B–G) Confocal micrographs of the AIY synaptic vesicle marker GFP::RAB-3 (green) in adult wild type (B), cima-1(wy84) (C), cima-1(wy84);mig-17(ola226) (D), cima-1(wy84);mig-17(k113) (E), cima-1(wy84);mig-17(k174) (F), and cima-1(wy84);mig-17(ola226) animals expressing a wild-type copy of the mig-17 gene (Pmig-17::mig-17(genomic)) (G). Brackets indicate the AIY Zone 1 region. Asterisks indicate the Zone 2 region. Scale bar in (B) applies to all images, 10 μm. (H) Quantification of the percentage of animals with ectopic synapses in the AIY Zone 1 region for the indicated genotypes. The total number of animals (N) and the number of times scored (n1) are indicated in each bar for each genotype and for the transgenic lines created, the number of transgenic lines (n2) examined (all using the convention N/n1/n2). Statistical analyses are based on one-way ANOVA by Tukey’s multiple comparison test. Error bars represent SEM, **p<0.01, ****p<0.0001 as compared to cima-1 (wy84) (if on top of bar graph), unless brackets are used between two compared genotypes.
Figure 4—figure supplement 1
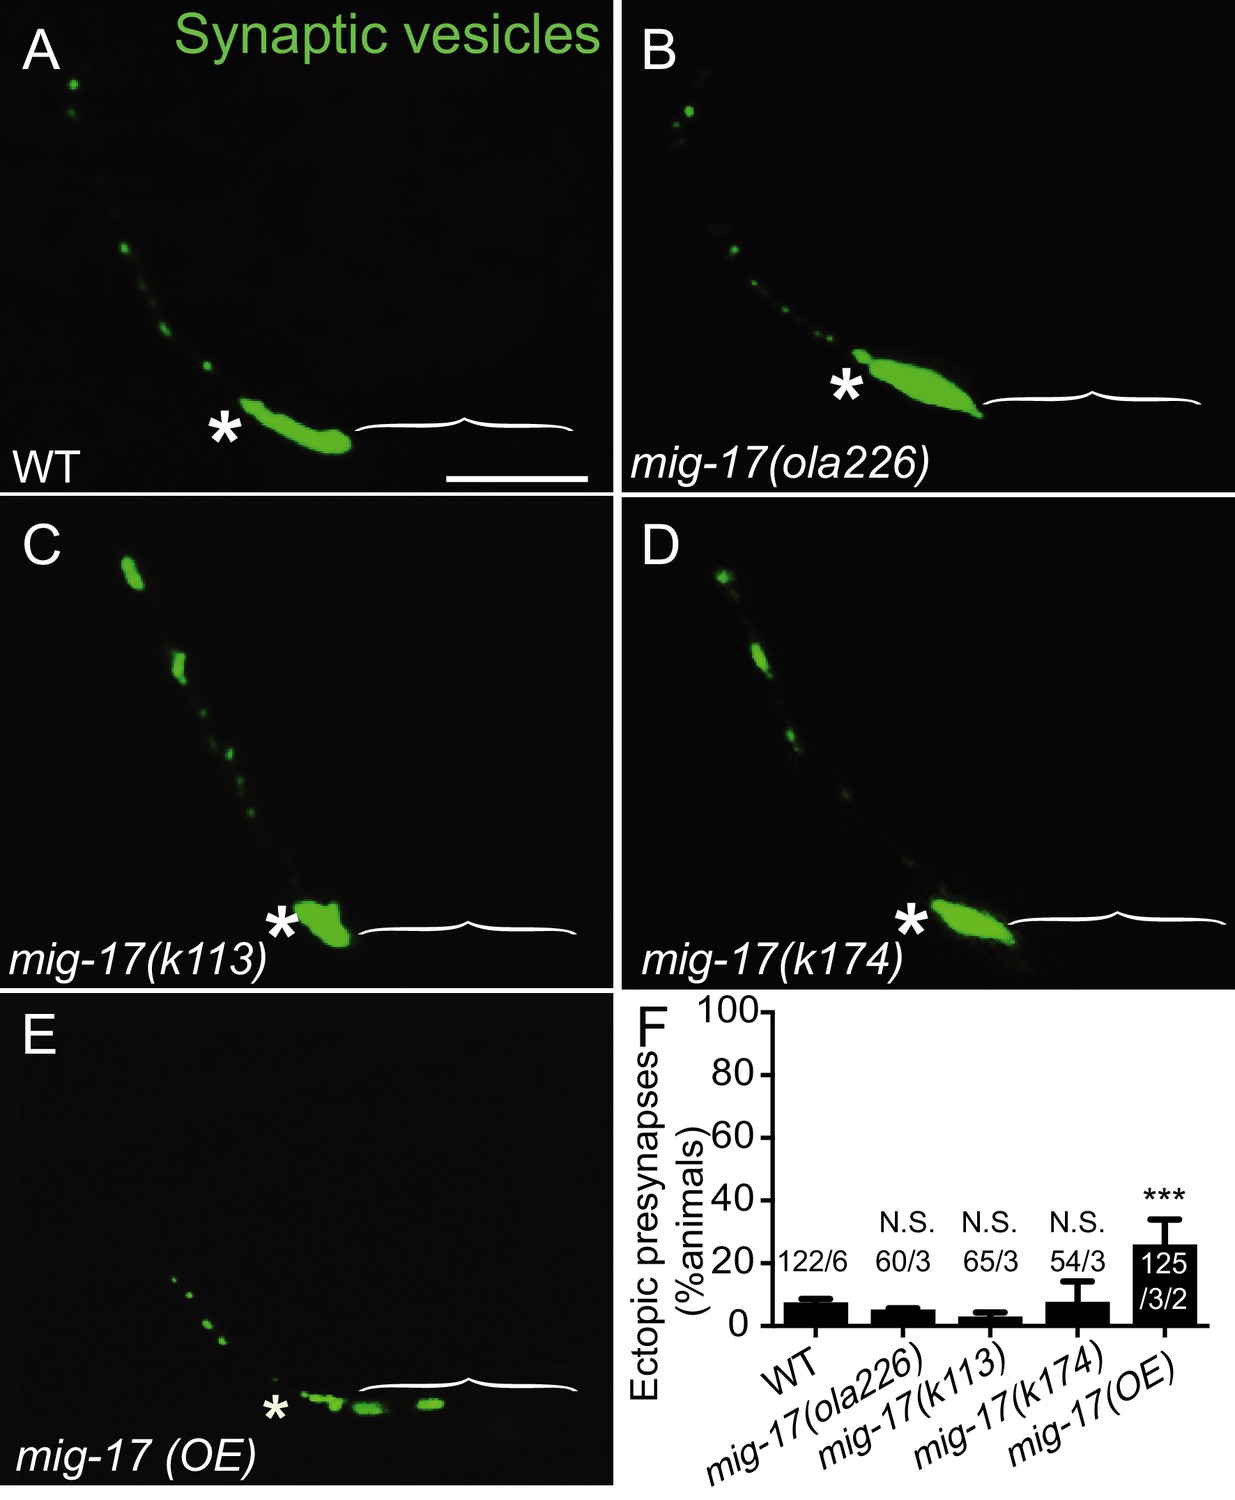
Synaptic phenotypes in mig-17 alleles.
(A–E) Confocal micrographs of the AIY synaptic vesicle marker GFP::RAB-3 (green) in the wild type (A), mig-17(ola226) (B), mig-17(k113) (C), mig-17(k174) (D) and mig-17 overexpression in wild-type background (mig-17(OE)) (E). The scale bar in (A) is 10 μm and applies to all panels. Brackets mark the Zone 1 region, and asterisks indicate the Zone 2 region. (F) Quantification of the percentage of adult animals with ectopic synapses in the AIY Zone 1 region for the indicated genotypes. In the graph, the total number of animals (N) and the number of times scored (n) are indicated in each bar for each genotype as N/n. Note that over-expressing mig-17 in wild type animals (E) resulted in mild but significant phenotype of ectopic synapses in the Zone 1 region of AIY (F). The data demonstrate that overexpression of mig-17 phenocopies cima-1(wy84) loss-of-function allele, in support of our model that the mig-17 acts in opposition to cima-1. Statistical analyses are based on one-way ANOVA by Tukey’s multiple comparison. Error bars represent SEM, N.S.: not significant or p>0.05, ***p<0.001.
Figure 4—figure supplement 2
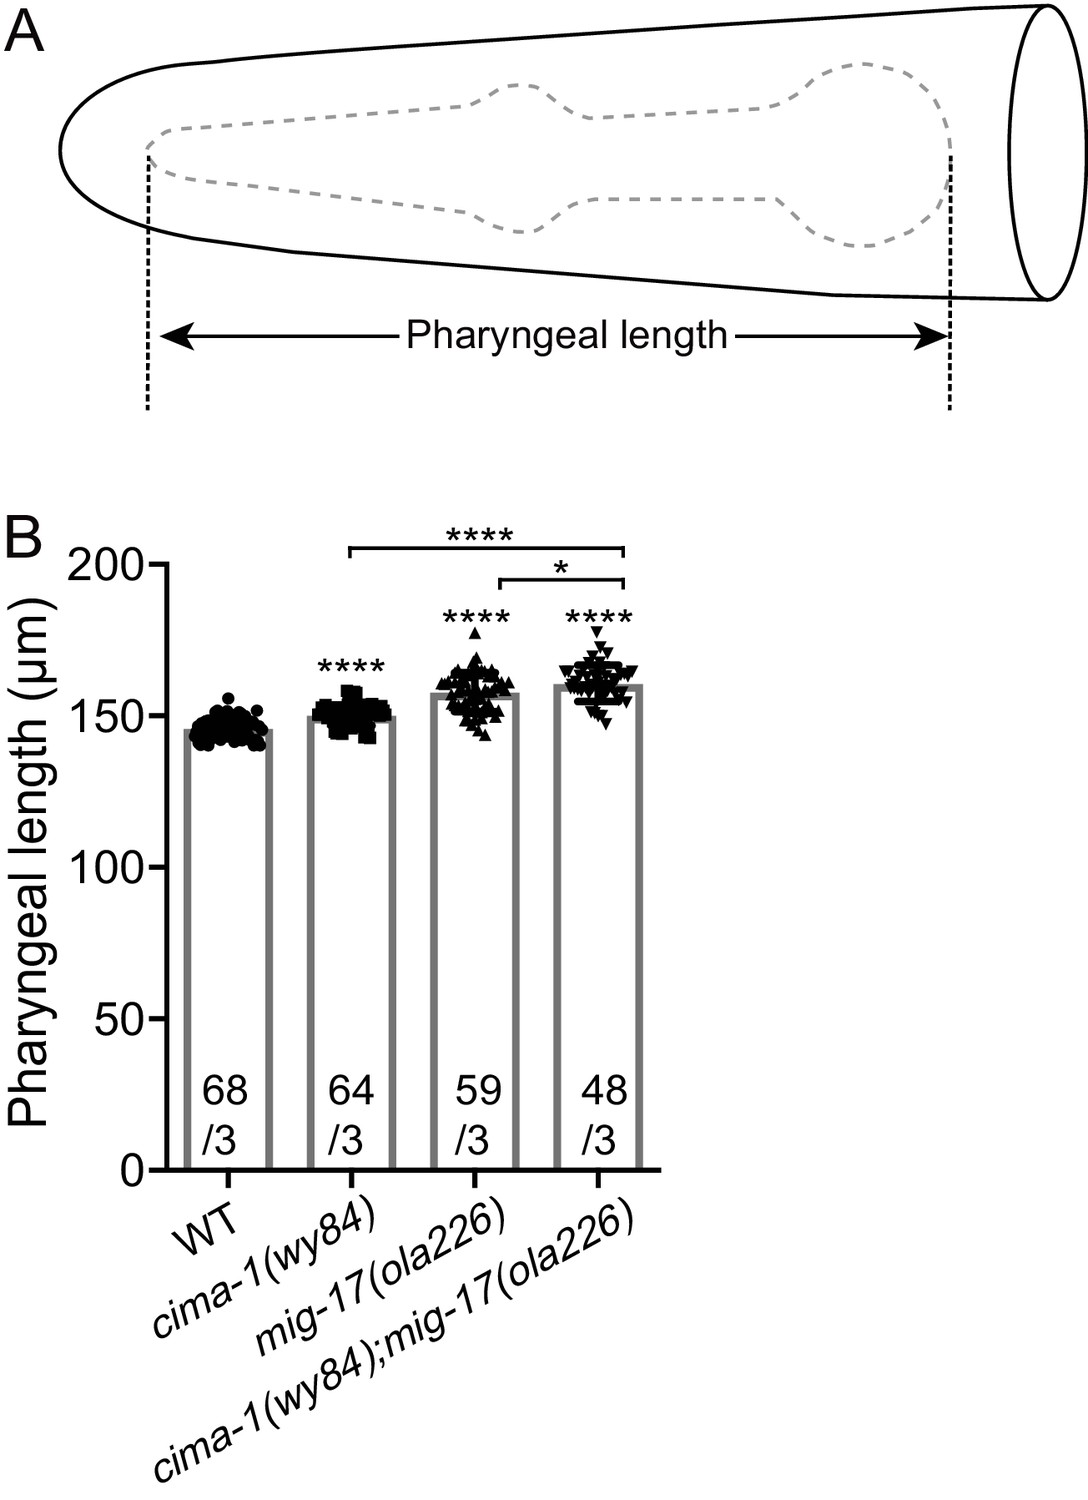
mig-17(ola226) and cima-1(wy84) phenotypes in pharyngeal length.
(A) A cartoon diagram of the pharynx in the C. elegans head. The pharynx is outlined with a dashed grey line, and the length quantified in (B) is shown. (B) Quantification of pharyngeal length of wild type, cima-1(wy84), mig-17(ola226) and cima-1(wy84);mig-17(ola226) double mutants. The data indicate that both cima-1(wy84) and mig-17(ola226) significantly increase the pharyngeal length, consistent with (Shibata et al., 2016), and that the double mutant enhances the single mutant effects. The data indicate that unlike the AIY presynaptic phenotype, mig-17(ola226) and cima-1(wy84) cooperate, rather than antagonize each other, in regulating pharyngeal length. In the graph, the total number of animals (N) and the number of times scored (n) are indicated in each bar for each genotype as N/n. Statistical analyses are based on one-way ANOVA by Tukey’s multiple comparison test. Error bars represent SEM, *p<0.05, ****p<0.0001 compared to wild type or between indicated genotypes.
Figure 5 with 1 supplement
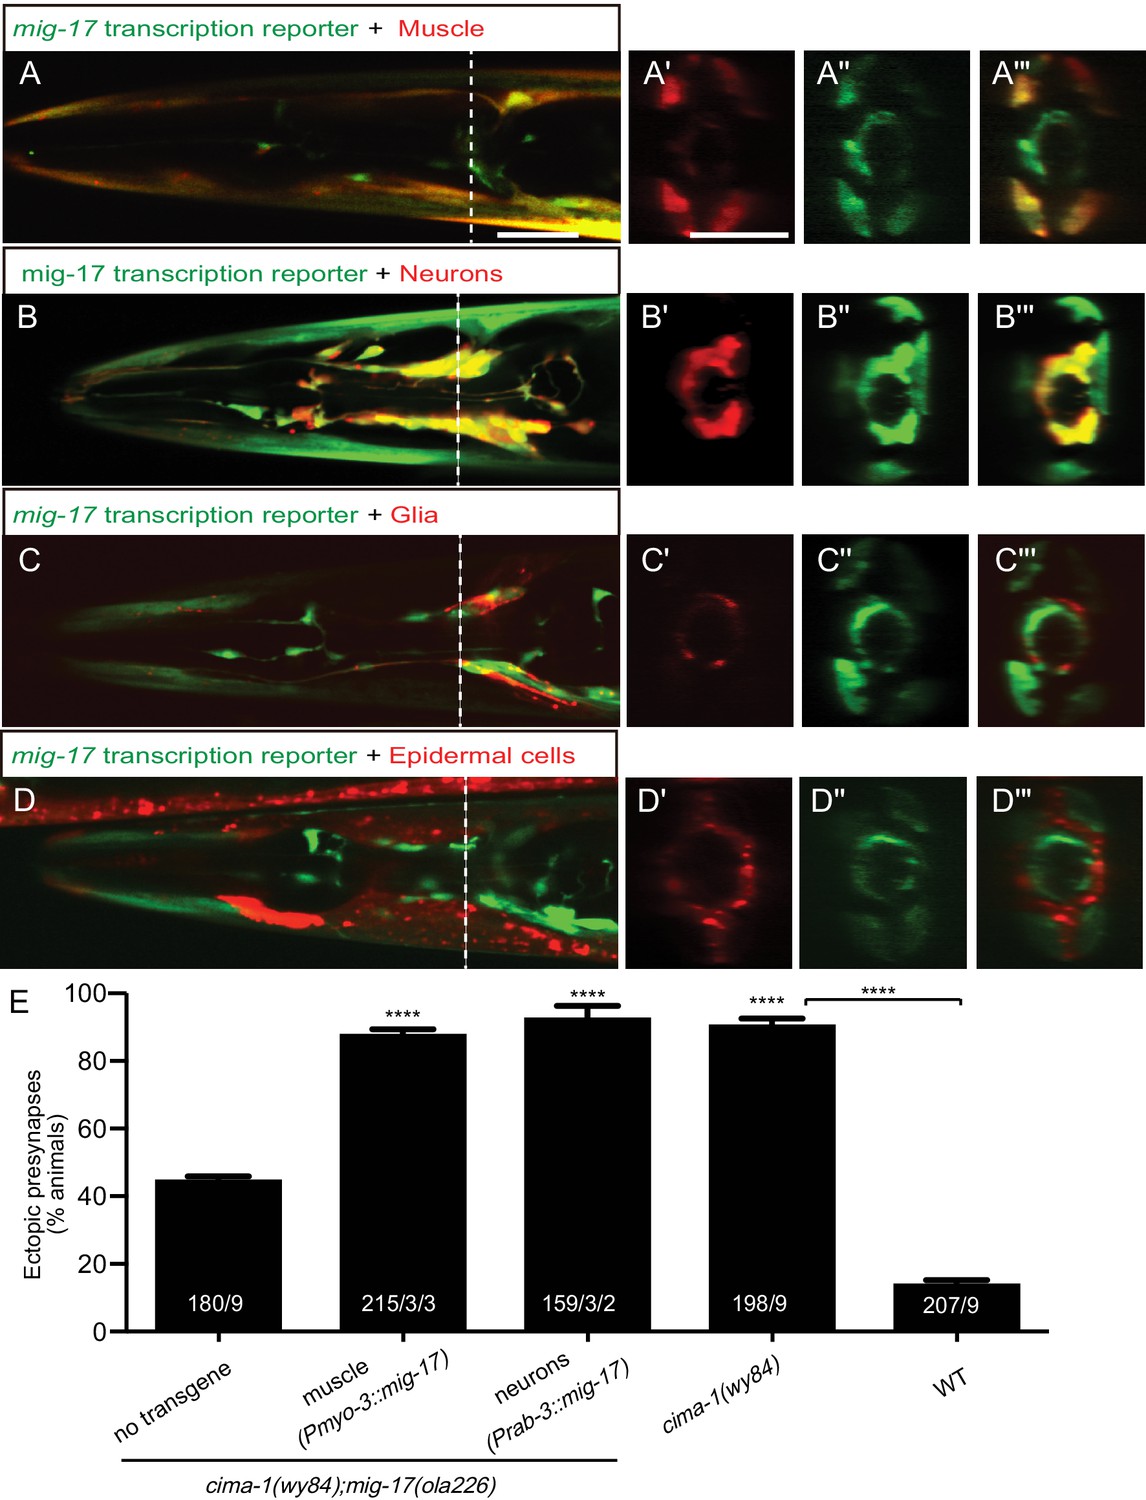
MIG-17 is a secreted molecule that regulates synaptic allometry.
(A–D”’) Confocal micrographs of adult animals expressing the transcriptional reporter mig-17(genomic)::SL2::GFP (green) with reporters that co-label body wall muscles (Pmyo-3::mCherry (A–A”’)), neurons (Prab-3::mCherry (B–B”’)), VCSC glia (Phlh-17::mCherry (C–C”’)), epidermal cells (Pdpy-4::mCherry (D–D”’)). Images (A’–D”’) correspond to a transverse cross-section of the confocal micrographs, specifically for the region corresponding to the dashed line in (A–D). The scale bar in (A) applies to (B, C, D), and in (A’) applies all transverse cross-section images, and both scale bars are 10 μm. (E) Quantification of the percentage of adult animals with ectopic synapses in the AIY Zone 1 region of the indicated genotypes and rescue experiments. The total number of animals (N) and the number of times scored (n1) are indicated in each bar for each genotype, as are, for the transgenic lines created, the number of transgenic lines (n2) examined (all using the convention N/n1/n2). See also Figure 5—figure supplement 1 for additional rescue experiments. Statistical analyses are based on one-way ANOVA by Tukey’s multiple comparison test. Error bars represent SEM, N.S.: not significant, ****p<0.0001 compared to the no-transgene control (if on top of bar graph), unless brackets are used between two compared genotypes.
Figure 5—figure supplement 1
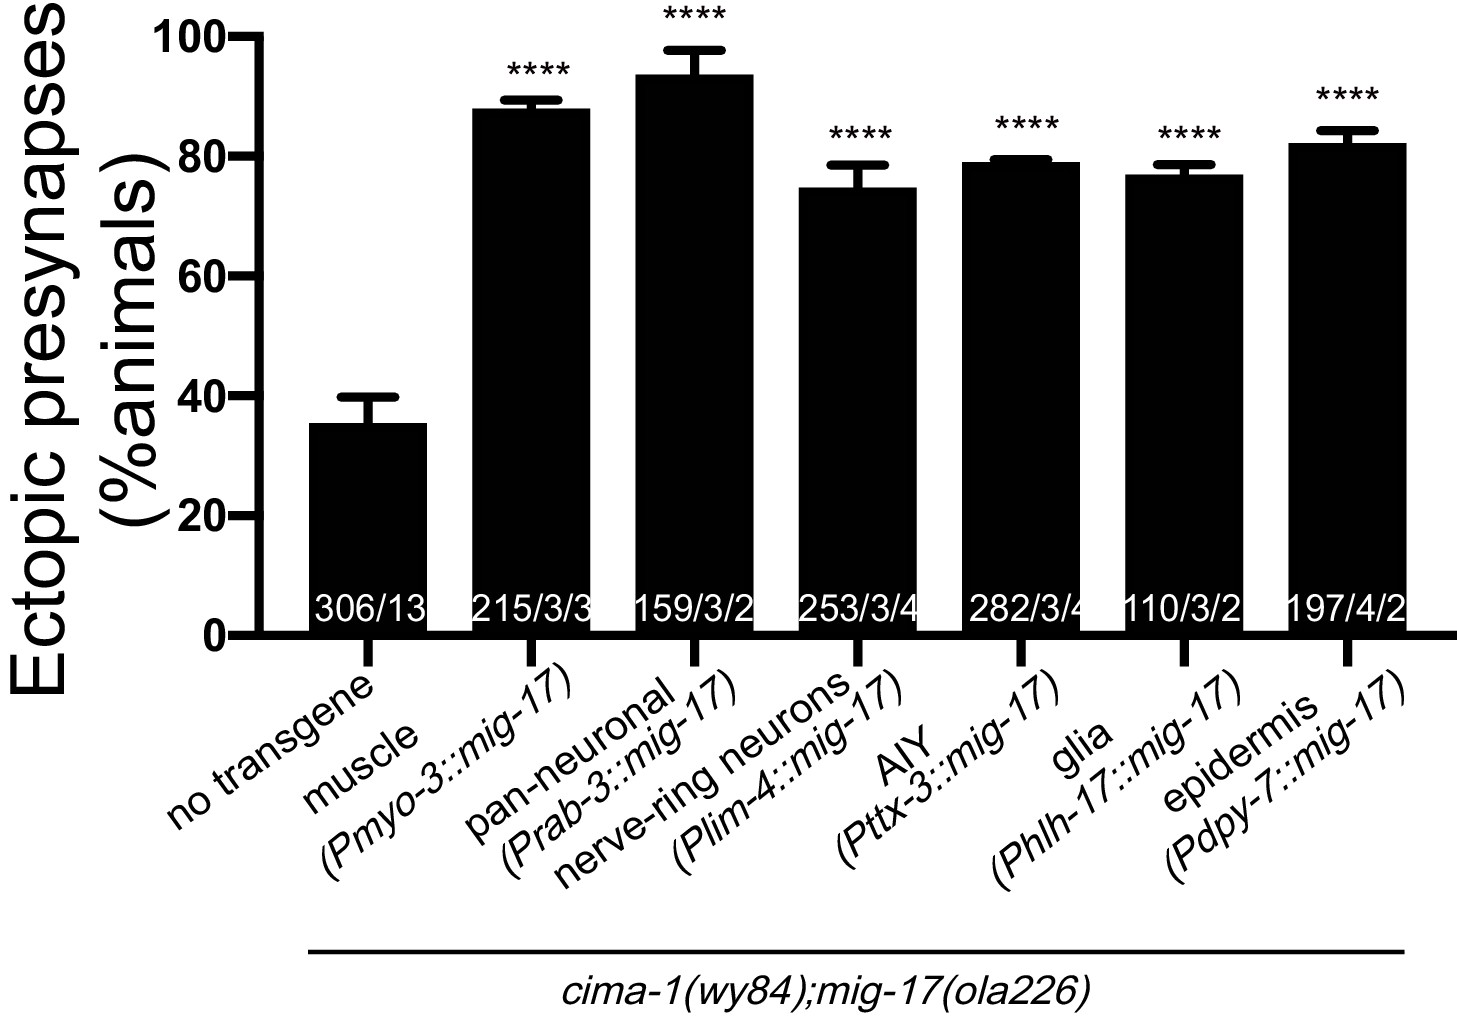
Cell-specific expression of mig-17 in multiple tissues rescues the mig-17 suppression in mig-17(ola226);cima-1(wy84) mutants.
Quantification of the percentage of adult animals with ectopic synapses in the AIY Zone 1 region in the indicated genotypes. The body wall muscle rescue and the pan-neuronal rescue are the same as in Figure 5E. In the graph, the total number of animals (N) and the number of times scored (n1) are indicated in each bar for each genotype, as are, for the transgenic lines created, the number of transgenic lines (n2) examined (all using the convention N/n1/n2). Statistical analyses are based on one-way ANOVA by Tukey’s multiple comparison test. Error bars represent SEM. ****p<0.0001 as compared to the no-transgene control.
Figure 6 with 1 supplement
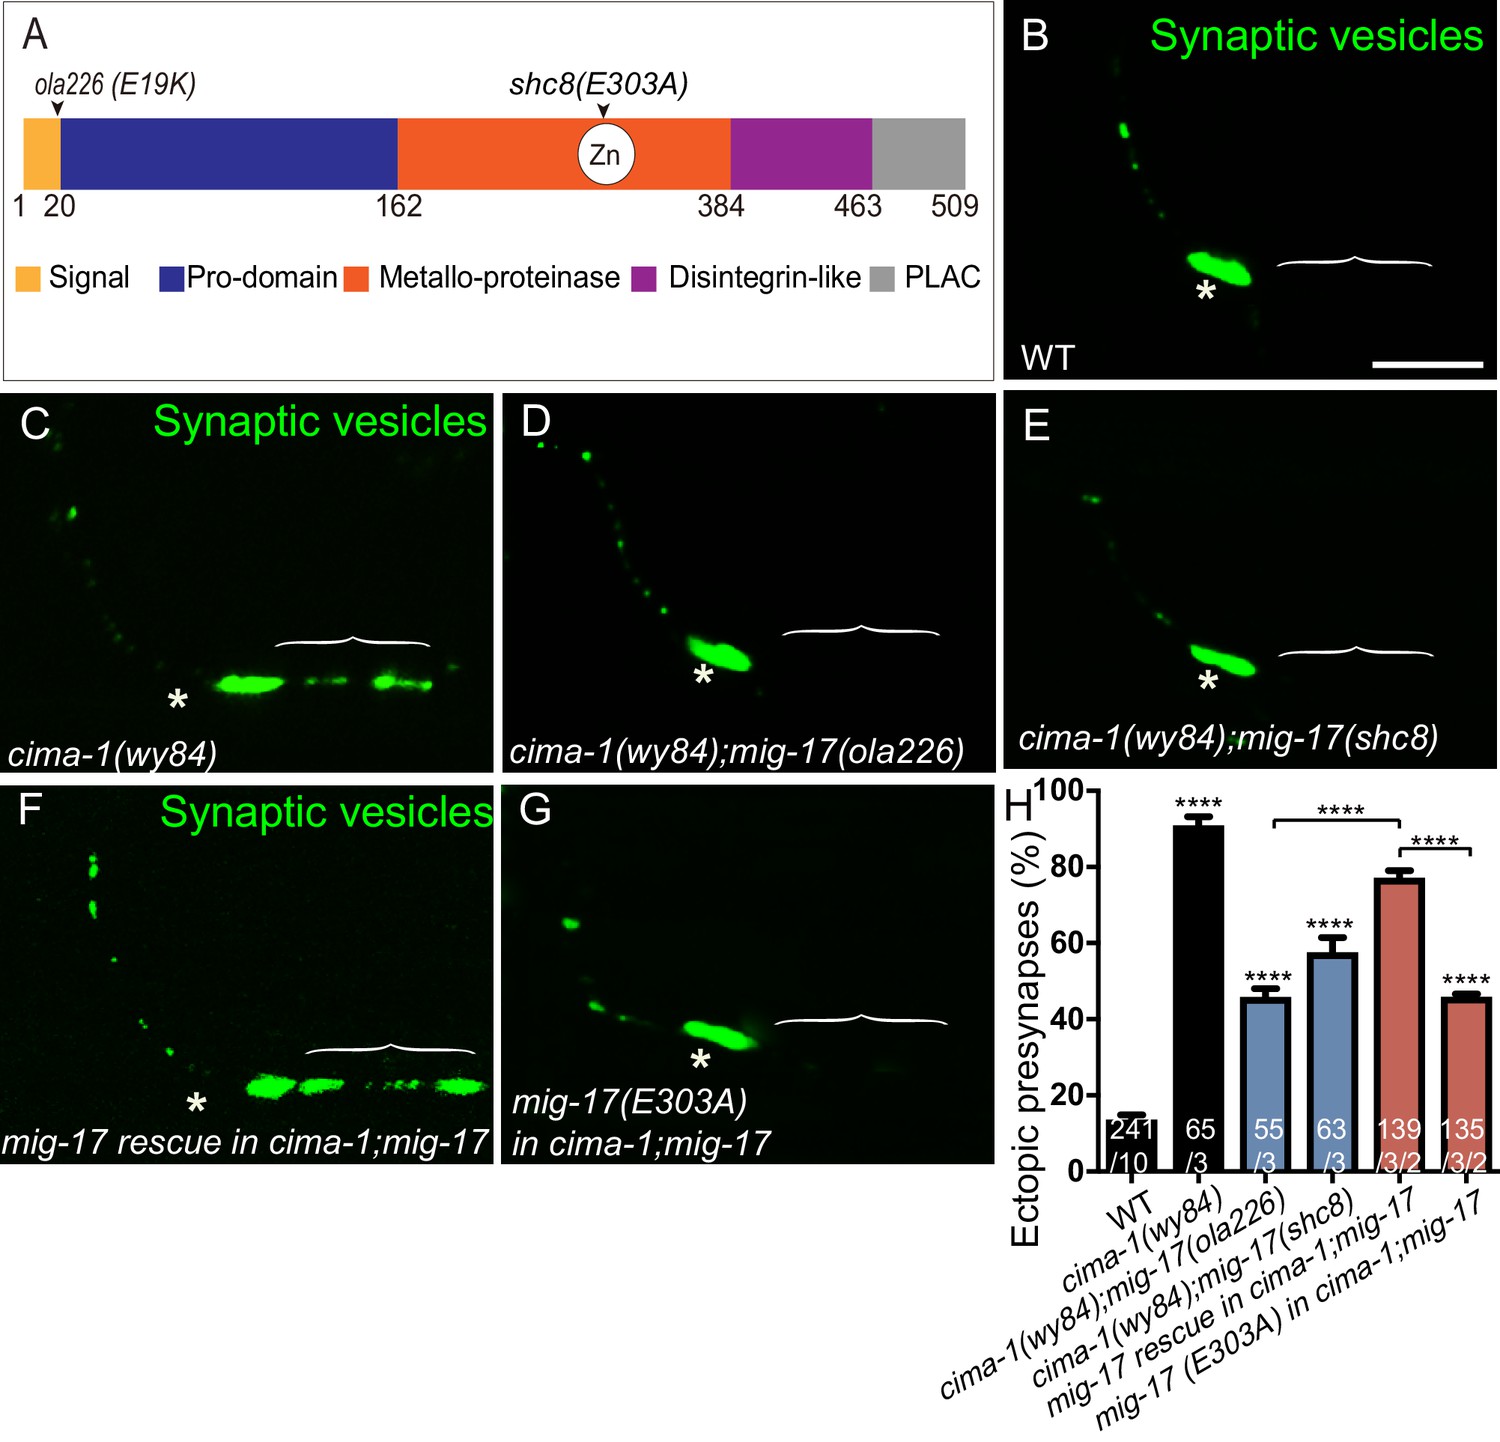
The metalloprotease activity of MIG-17 is required to suppress the formation of ectopic synapses in cima-1(wy84) mutants.
(A) Schematic diagram of the MIG-17 protein, corresponding conserved protein domains (colored) and genetic lesions for the alleles used in this study. (B–G) Confocal micrographs of the AIY presynaptic sites labeled with the synaptic vesicle marker GFP::RAB-3 (pseudo-colored green) in adult wild type (B), cima-1(wy84) (C), cima-1(wy84);mig-17(ola226) (D), cima-1(wy84);mig-17(shc8) (E), cima-1(wy84);mig-17(ola226) animals expressing a wild type copy of the mig-17 genomic DNA (Pmig-17::mig-17) (F), and cima-1(wy84);mig-17(ola226) animals expressing a copy of the mig-17 genomic DNA with a point mutation in the metalloprotease domain (Pmig-17::mig-17(E303A)) (G). Brackets indicate the AIY Zone 1 region, and asterisks indicate the Zone 2 region. The scale bar in (B) is 10 μm and applies to all images. (H) Quantification of the percentage of animals with ectopic synapses in the AIY Zone 1 region in the indicated genotypes. In the graph, the transgene rescue with wild type copy of the mig-17 genomic DNA control data is the same as in Figure 4H. The total number of animals (N) and the number of times scored (n1) are indicated in each bar for each genotype, as are, for the transgenic lines created, the number of transgenic lines (n2) examined (all using the convention N/n1/n2). Bars are pseudocolored by experiments, with controls in black, comparisons across mig-17 alleles in blue and rescue experiments in red. Statistical analyses are based on one-way ANOVA by Tukey’s multiple comparison test. Error bars represent SEM, N.S.: not significant, ****p<0.0001 compared to wild type (if on top of bar graph), unless brackets are used between two compared genotypes.
Figure 6—figure supplement 1
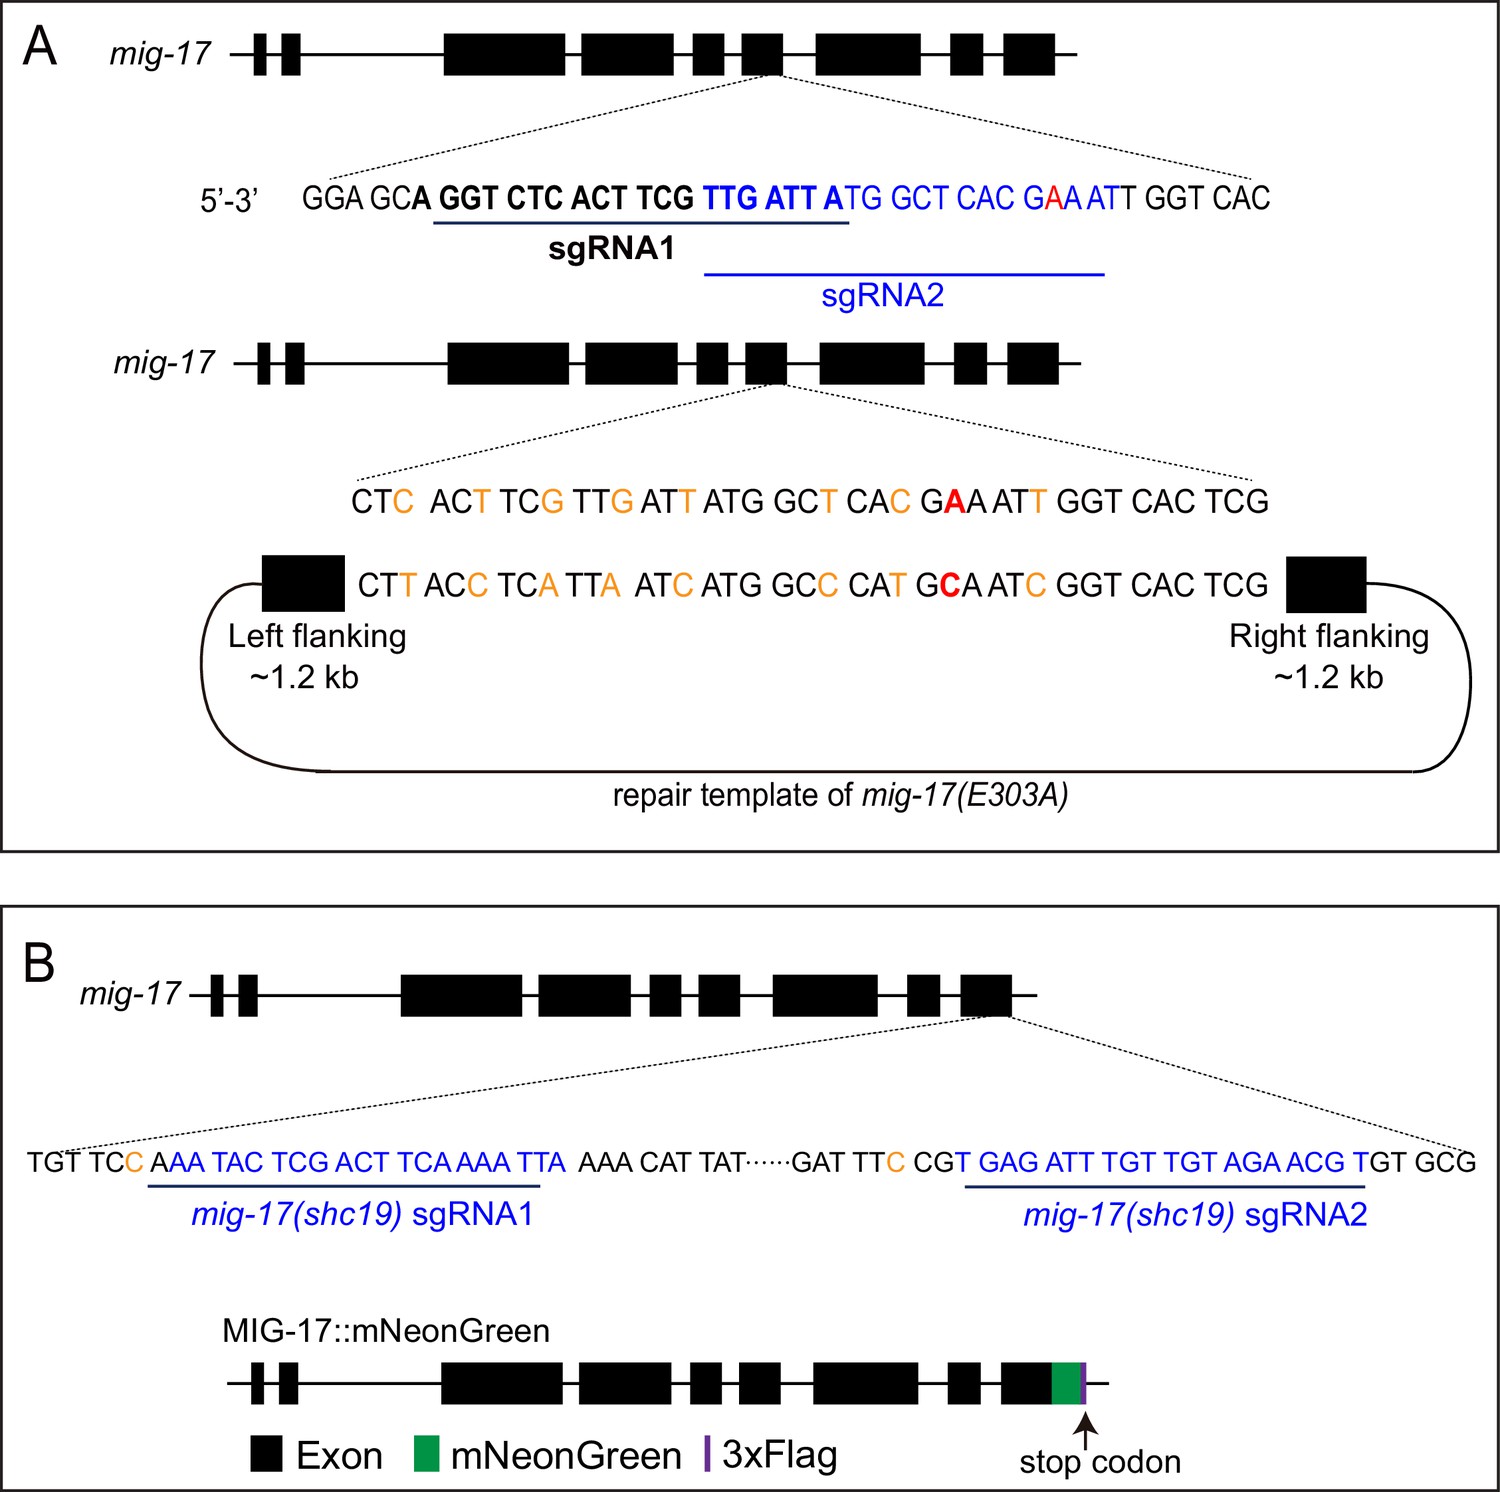
CRISPR strategies to generate the mig-17(shc8) allele and the endogenous MIG-17::mNeonGreen.
(A) Schematic of the strategy used to change E303 at MIG-17 and generate the mig-17(shc8) allele. The location for the two sgRNAs used (black bolded and blue) and the shc8 (E303A) repair template are indicated. The repair template comprised of 1.2 kb upstream and 1.2 kb downstream genomic sequence flanking the enzymatic active site E303. The Glutamic acid (GAA) at the 303 was changed into Alanine (GCA) (red). Eight synonymous mutations were made to prevent Cas9 from cutting the repair template (orange). sgRNA design is based on sgRNA design tool (http://crispr.mit.edu). (B) Schematic of the strategy used to fuse to the C-terminus of the endogenous genomic mig-17 locus with mNeonGreen (Dickinson et al., 2013). Briefly and as indicated, two sgRNAs (blue) were used to insert mNeonGreen::3 × Flag into the MIG-17 C-terminus via CRISPR. The mig-17 exons are indicated in the schematic by black boxes; the green and purple boxes represent mNeonGreen and 3xflag tags. Two synonymous mutations at the PAM sites were made on the repair templates (orange) to avoid cutting by Cas9. We examined the glia morphology and gonad defect in mig-17::mNeonGreen knock-in animals, and observed that they behave as wild type, suggesting that MIG-17::neonGreen does not compromise MIG-17 function (data not shown).
Figure 7 with 1 supplement
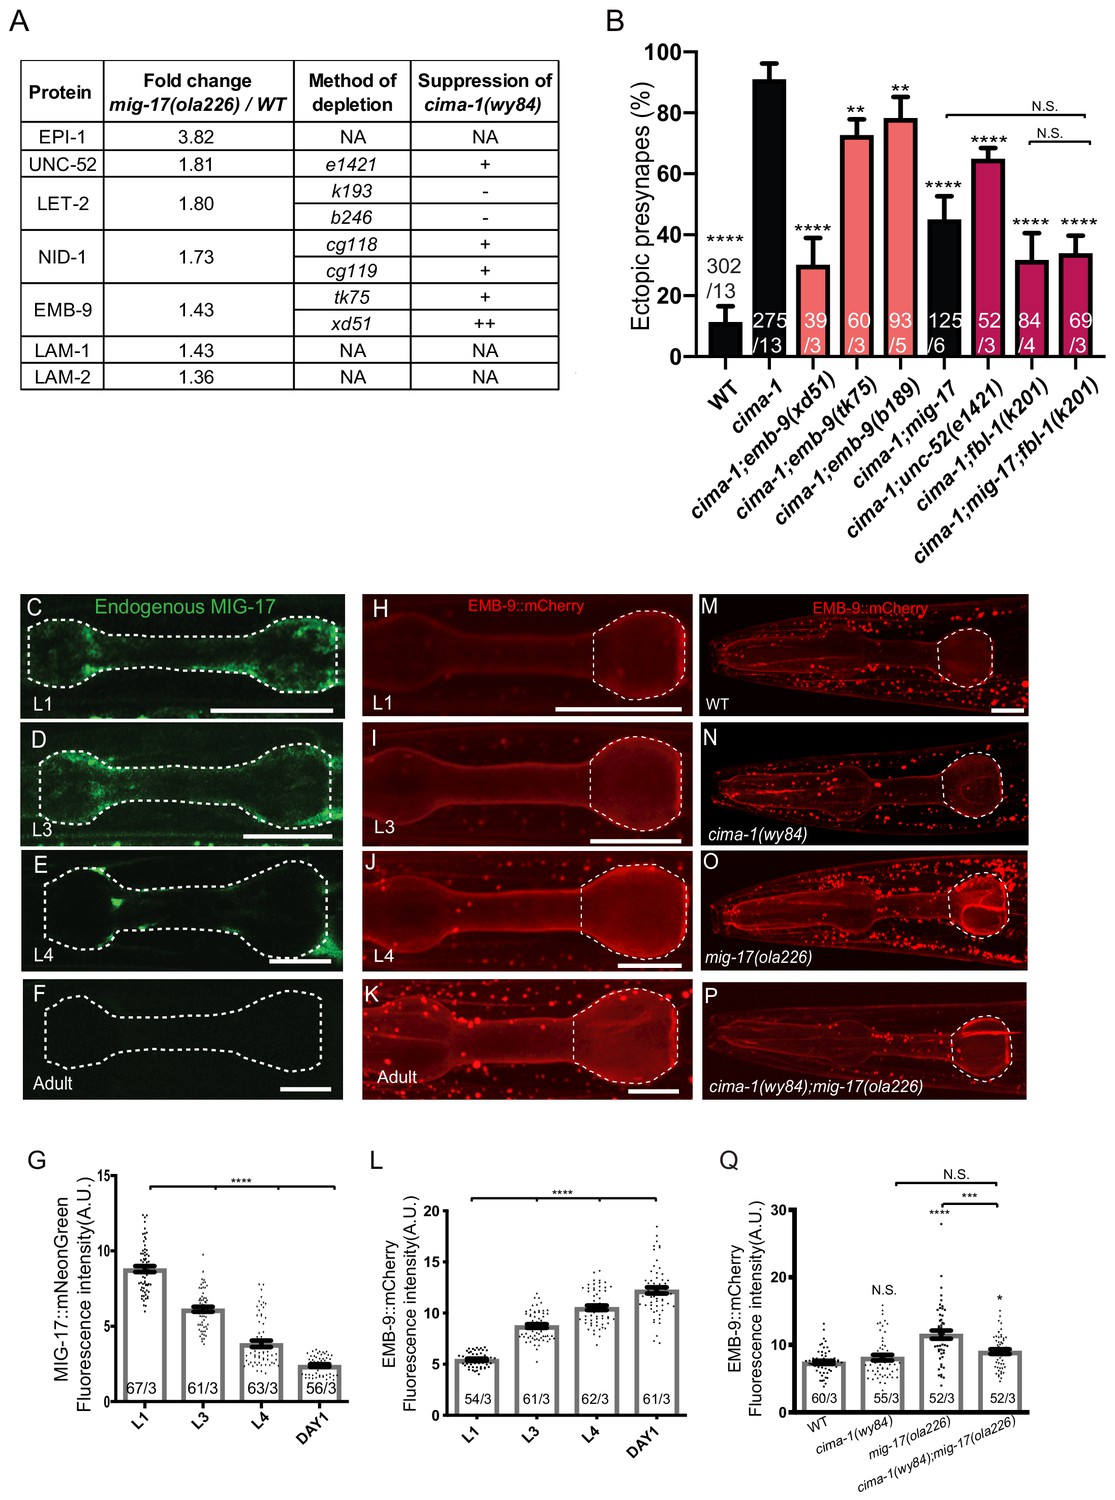
MIG-17 modulates synaptic allometry through the regulation of the basement membrane.
(A) List of basement membrane components upregulated in the mass spectrometry analyses (see also Supplementary file 1), and alleles tested with cima-1 for their capacity to suppress the synaptic allometry phenotypes in adult worms. (B) Quantification of the percentage of animals with ectopic synapses in the Zone 1 region of AIY for the indicated the genotypes. Bars are pseudocolored by experiment, with black bars corresponding to controls, light pink bars corresponding to emb-9 alleles, and red bars corresponding to alleles for genes known to regulate emb-9, such as unc-52 and fbl-1. (C–F) Confocal micrographs of the pharynx (dashed line) of animals with a CRISPR-engineered MIG-17::mNeonGreen imaged at larva stage 1 (C), larva stage 3 (D), larva stage 4 (E) and 1 day-old adults (F) in wild-type animals. (G) Quantification of the average MIG-17::mNeonGreen intensity in the pharyngeal area (outlined with dashed lines in C-F) at the indicated developmental stages. (H–L) As (C–G), but imaging an integrated EMB-9::mCherry strain (a gift from David Sherwood) in wild type animals. (M–Q) As (H–K) but in adults of wild type (M); cima-1(wy84) (N); mig-17(ola226) (O); cima-1(wy84);mig-17(ola226) (P) and quantified in (Q). The statistics are based on one-way ANOVA by Tukey’s multiple comparison test. In the graphs, the total number of animals (N) and the number of times scored (n) are indicated in each bar for each genotype as N/n. Error bars represent SEM, N.S.: not significant, **p<0.01, ***p<0.001, ****p<0.0001 for indicated comparison. For all images, scale bars are 10 μm. The scale bar in (M) applies to (N–P).
Figure 7—figure supplement 1
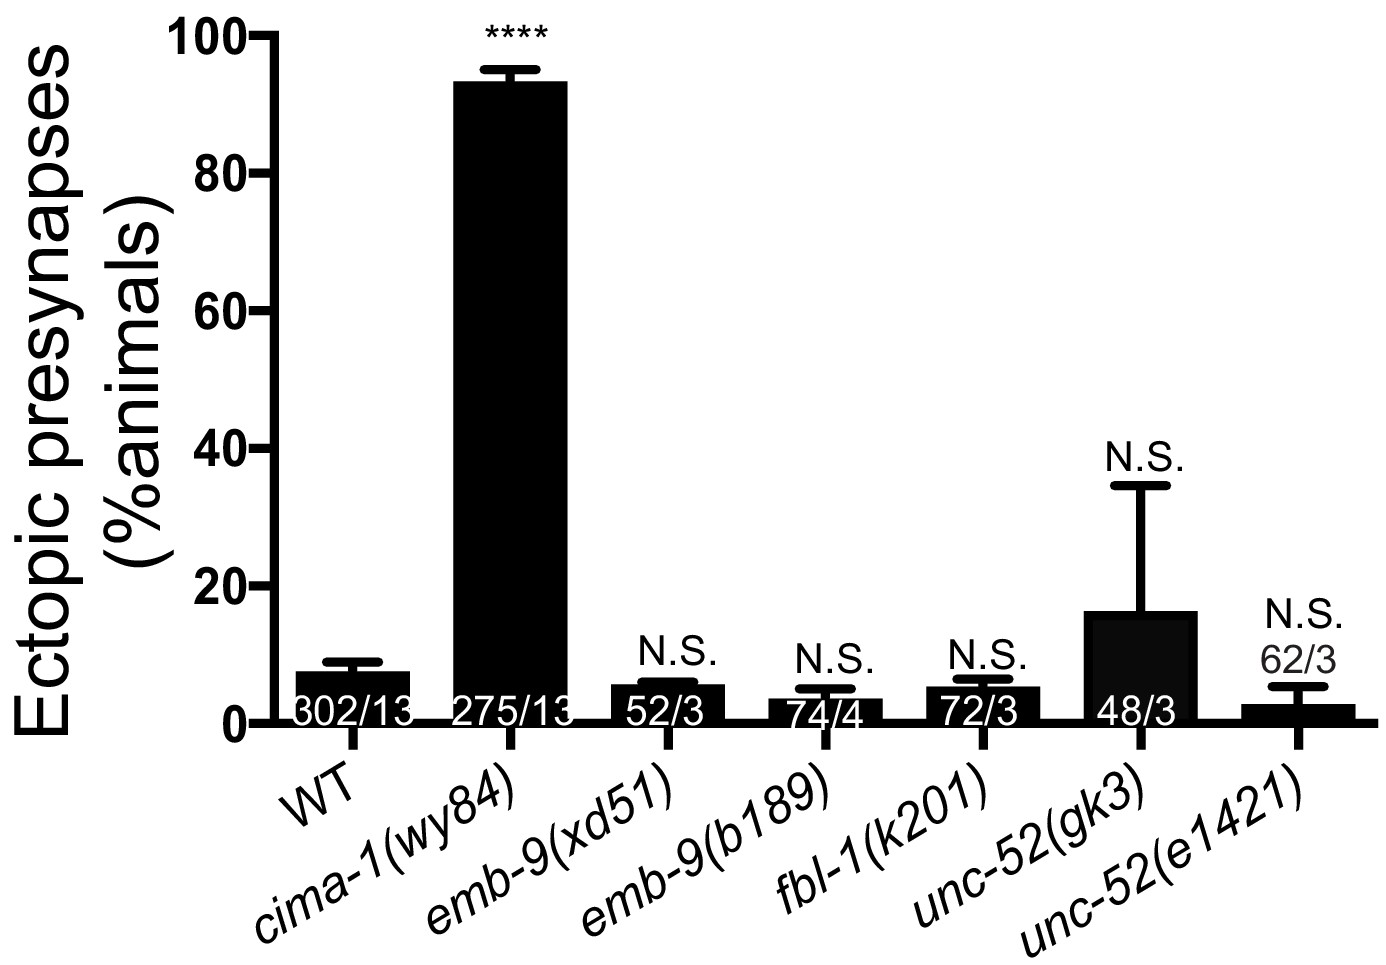
Phenotypes in AIY synapses of alleles affecting basement membrane proteins.
Quantification of the percentage of adult animals with ectopic synapses in the AIY Zone 1 region in wild type (WT), cima-1(wy84), emb-9(xd51), emb-9(b189), fbl-1(k201), unc-52(gk3) and unc-52(e1421) mutants. In the graph, the total number of animals (N) and the number of times scored (n) are indicated in each bar for each genotype as N/n. Statistical analyses are based on one-way ANOVA by Tukey’s multiple comparison test. Error bars represent SEM. NS: not significant or p>0.05.
Figure 8
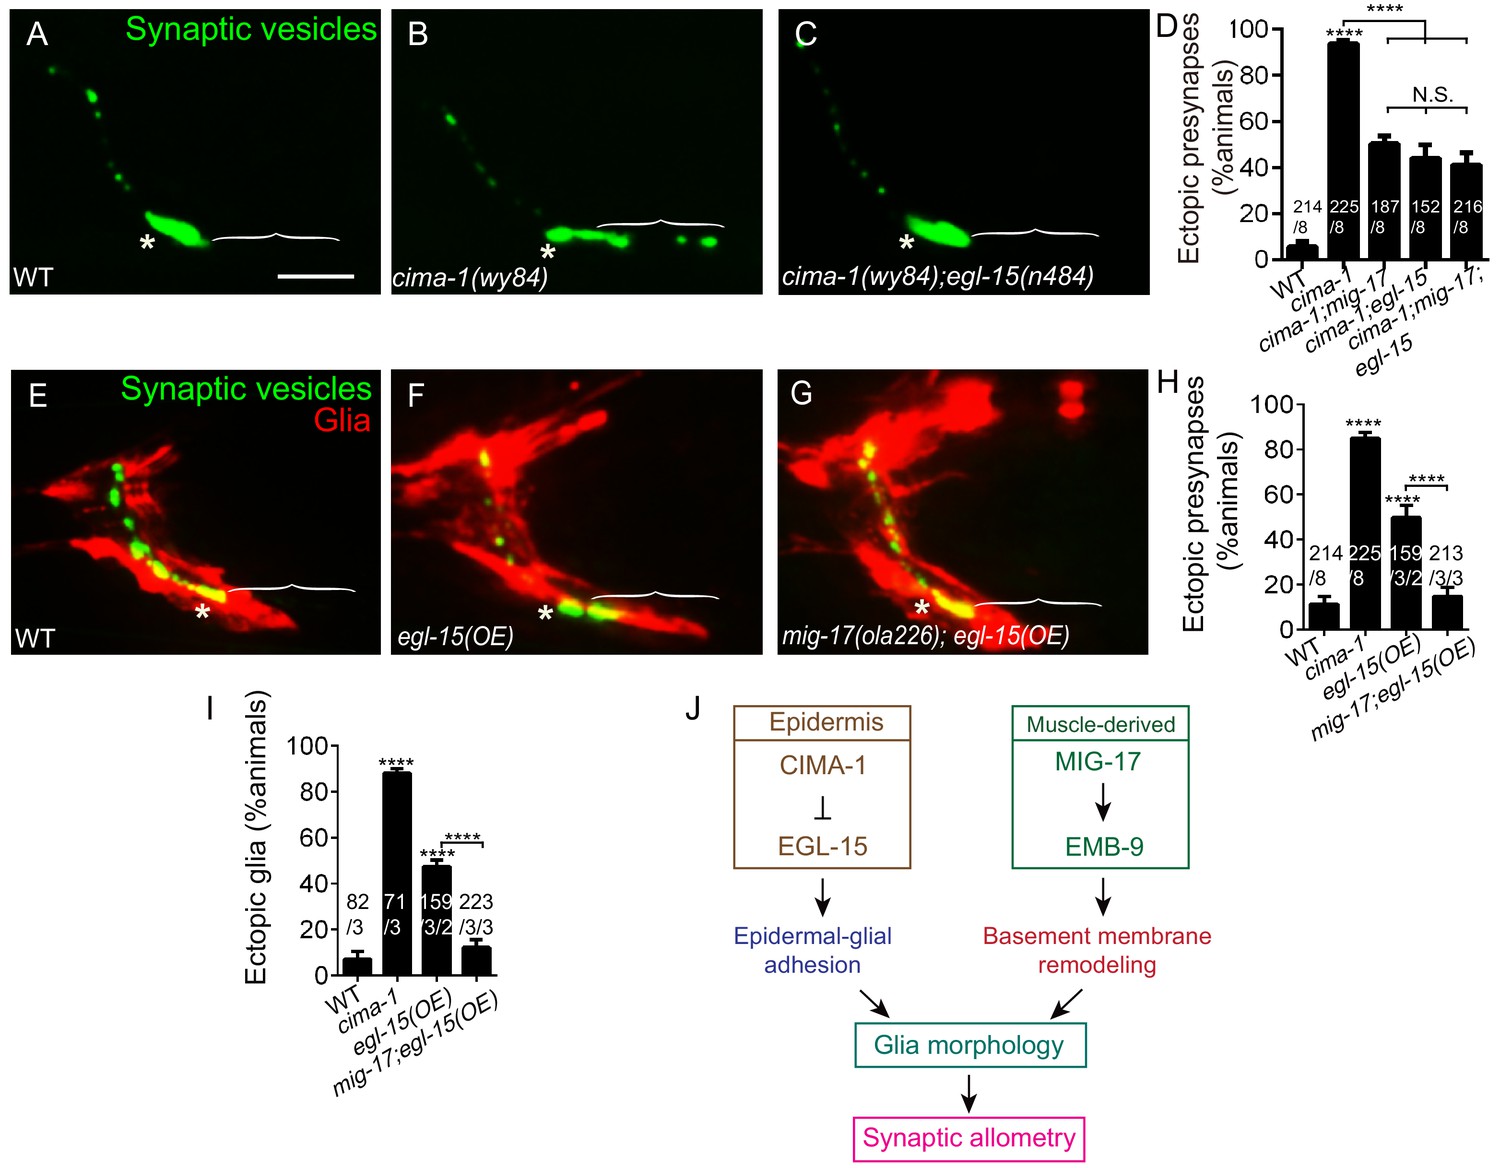
MIG-17 genetically interacts with EGL-15/Fibroblast Growth Factor Receptor to regulate synaptic allometry.
(A–C) Confocal micrographs of the AIY synaptic vesicle marker GFP::RAB-3 (green) in adult wild type (A), cima-1(wy84) (B), cima-1(wy84);egl-15(n484) (C). (D) Quantification of percentage of animals with ectopic synapses in the indicated genotypes. (E–G) Confocal micrographs of AIY synaptic vesicle marker GFP::RAB-3 (green) and VCSC glia (red) in adult wild type (E), wild-type animals overexpressing EGL-15(isoform 5A) in epidermal cells by using Pdpy-7::egl-15(5A) (F) and mig-17(ola226) overexpressing EGL-15(isoform 5A) in epidermal cells by using Pdpy-7::egl-15(5A) (G). (H–I) Quantification of percentage of animals with ectopic synapses (H) or ectopic glia (I) in the indicated genotypes. (J) Schematic model of the multi-tissue regulation of synaptic allometry in AIY, as in Figure 1I, but with the new findings on mig-17. In all images (A–C, E–G), brackets indicate the AIY Zone 1 region, asterisks mark the Zone 2 region. Scale bar in (A), 10 μm, applies to all images. In the graphs (D, H, I), the total number of animals (N), the number of times scored (n1) are indicated in each bar for each genotype, as are, for the transgenic lines created, the number of transgenic lines (n2) examined (all using the convention N/n1/n2). Statistical analyses are based on one-way ANOVA by Tukey’s multiple comparison test. Error bars represent SEM, N.S.: not significant, **p<0.01, ***p<0.001, ****p<0.0001 as compared to wild type (if on top of bar graph), unless brackets are used between two compared genotypes.
Figure 9 with 1 supplement
Glia maintain synaptic allometry by bridging epidermal-derived growth signals with the muscle-secreted basement membrane.
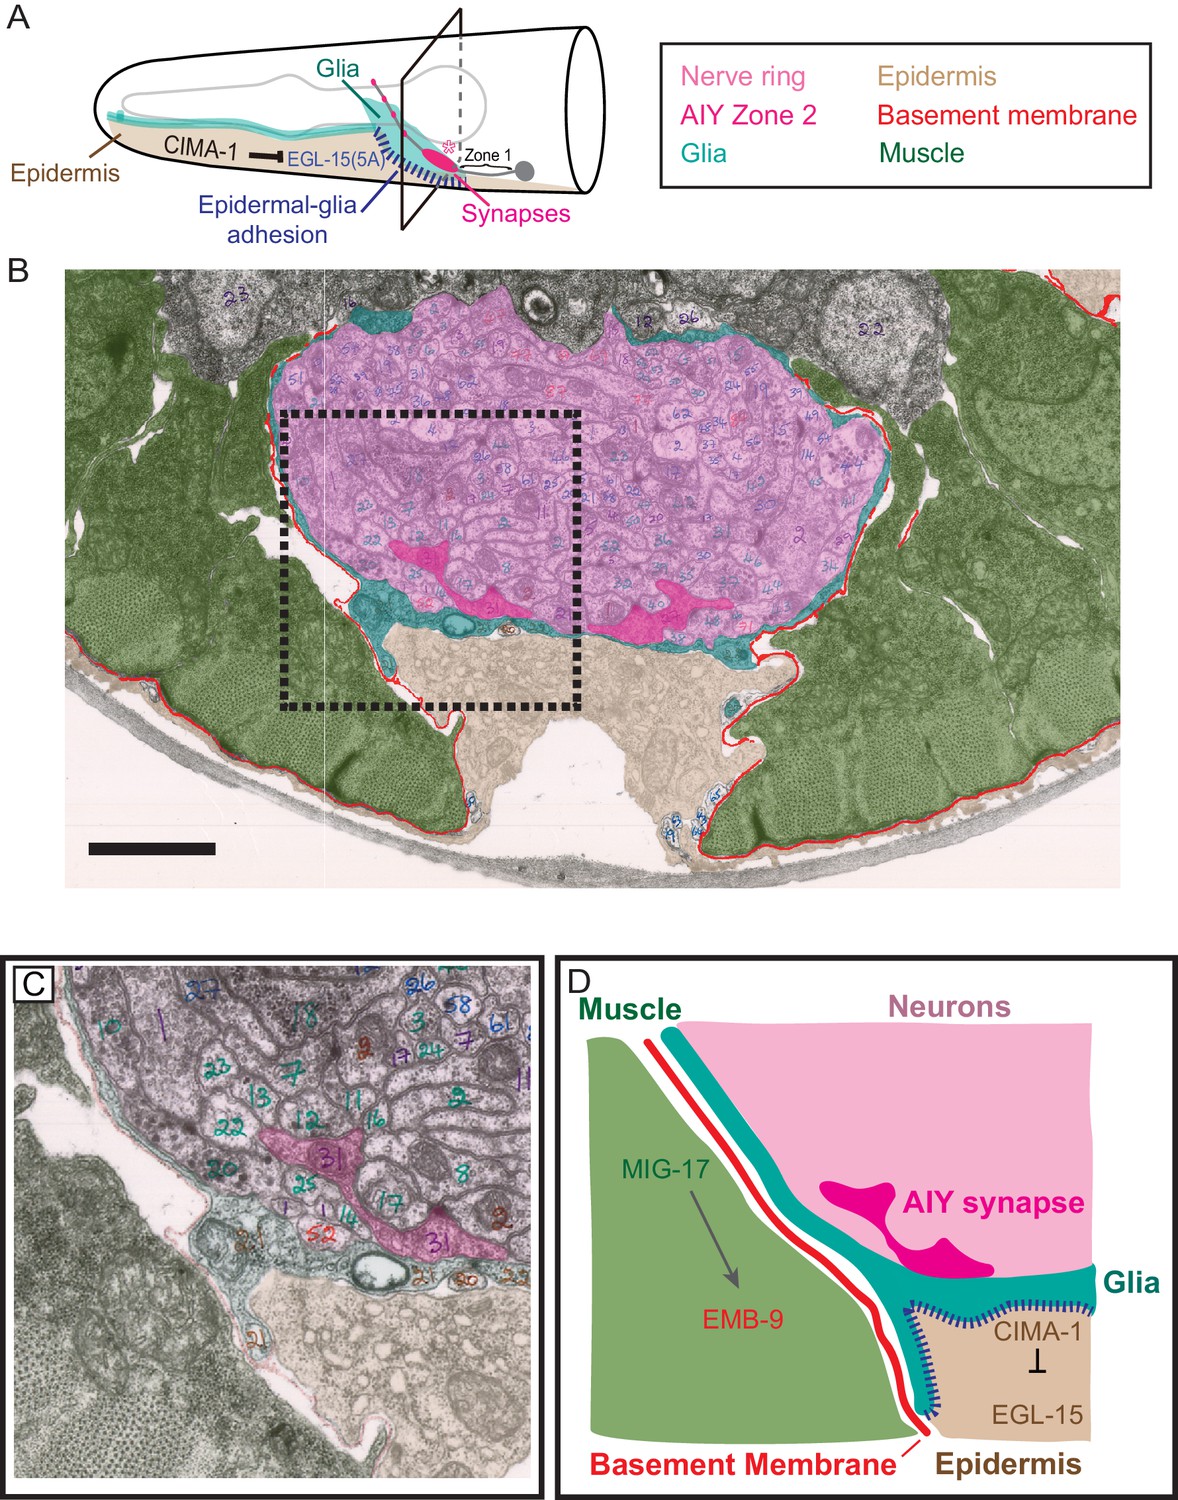
(A) Schematic of the head of C. elegans, as in Figure 1C, with indicated tissues pseudocolored. Box corresponds to cross sections examined in (B–D). (B) Segmented electron micrograph from a wild type animal (JSH236 from White et al., 1986). The EM corresponds to the Zone 2 region of AIY with muscles (pseudo-colored green), basement membrane (BM, pseudo-colored red), VCSC glia (pseudo-colored teal), epidermal cell (pseudo-colored beige) and the ventral bundle of the nerve ring (pseudo-colored pink, including AIY Zone two pseudo-colored dark pink). (C) Zoom-in of the dashed-boxed region in (B). The pseudo-coloring opacity is decreased as to show that the basement membrane is specifically observed between muscle and VCSC glia, but not between glia and epidermal cells or between glia and neurons. (D) A cartoon diagram depicting the cross-section of the C. elegans nerve ring as shown in (C) (modified from WormAtlas.org), and represented as a molecular and cellular model of our in vivo data regarding the role of non-neuronal cells in glia position and morphology to regulate synaptic allometry during growth. As illustrated in the cartoon and the EM image, body wall muscle (green), the nerve ring (pink) and glia (teal) are proximal to the epidermal cells (beige). The nerve ring bundle is surrounded by VCSC glia, which contact it directly. At the other side of the glia cell, it faces the pseudocoelum and interacts with muscle-derived basement membrane (red) and epidermal cells (beige).
Figure 9—figure supplement 1
Localization of basement membrane near the nerve ring.
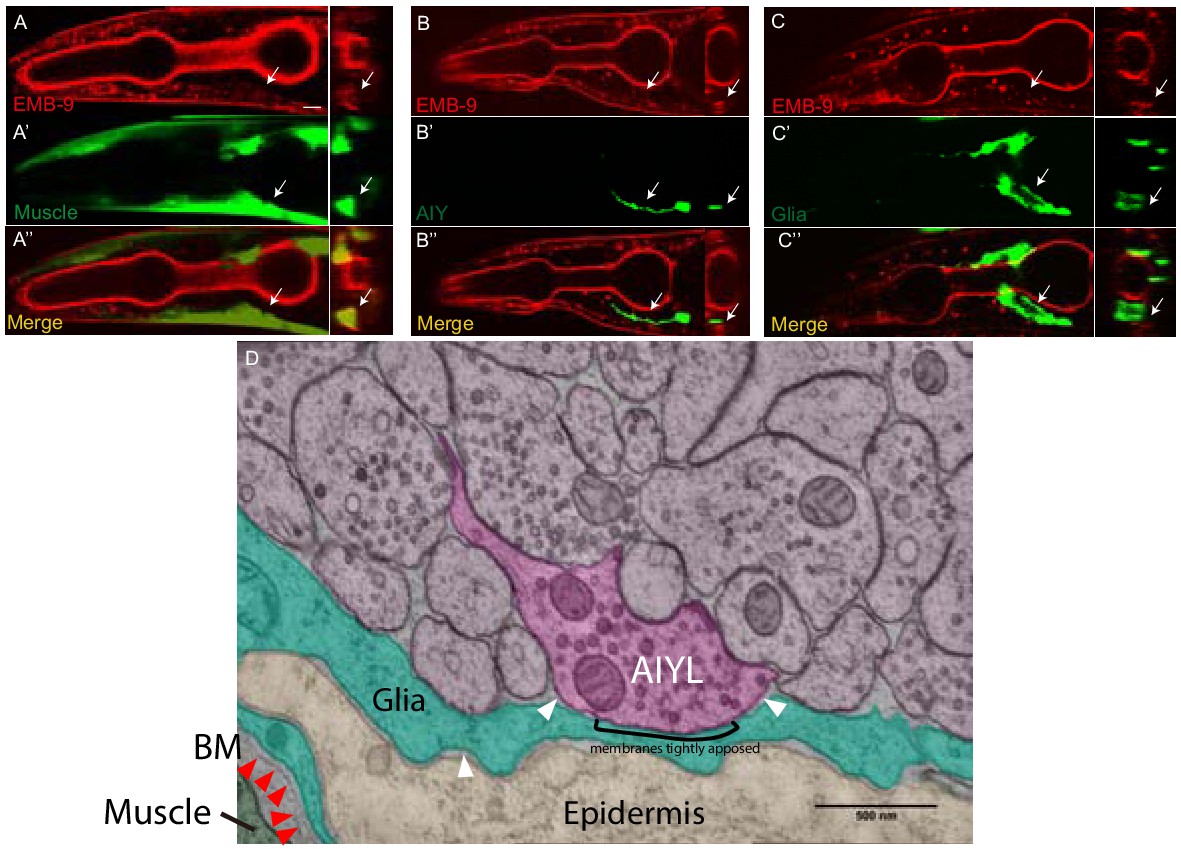
(A–C’’) Confocal micrographs of the basement membrane marker EMB-9 (red) (A, B and C) with VCSC glia (green) (A’–A’’), AIY neuron (green) (B’–B’’) and body wall muscle (green) (C’–C’’). Panels on the right hand side of each column represent cross sections (in the area of the arrows in A, (B and C). The scale bar in (A) is 10 μm and applies to all panels. Notice how basement membrane marker EMB-9 localizes to muscles in the pharynx, and body wall muscles (arrows in A), proximal to the glia (C), but away from neurons in nerve ring such as AIY (B), consistent with EM (Figure 9 and D). These findings are consistent with the basement membrane being an organized extracellular matrix structure of 30–70 nm not present between neurons of the nerve ring neuropil, similar to reports for neurons in the CNS for other organisms (Heikkinen et al., 2014; Krishnaswamy et al., 2019). Our findings, however, can not exclude the possibility that basement membrane proteins can be expressed by neurons in the nerve ring. (D) High-magnification electron micrograph of tissue near AIY Zone 2 synapses, pseudocolored to show neuropil (pink), AIY (dark pink), glia (teal), epidermis (beige), and muscle (dark green). Basement membrane is visible between muscle and glia (red arrowheads), but not between glia and epidermis or glia and neuropil (white arrowheads). AIY and glial membranes appear tightly apposed at some regions. Scale bar 500 nm.
Additional files
-
Supplementary file 1
Protein levels altered in mig-17(ola226) as detected by LS/MS proteomic analyses.
Proteins upregulated (>1.2 fold) or downregulated (<0.8 fold) are listed in the spreadsheet. Note that mig-17(ola226) was isolated from forward genetic screen, which would introduce other background mutations. Further analyses are required to determine if the protein level changes are due specifically to the mig-17(ola226) mutation.
- https://cdn.elifesciences.org/articles/55890/elife-55890-supp1-v2.pdf
-
Supplementary file 2
Strains used in this study List of strains and the corresponding genotypes used in this study.
- https://cdn.elifesciences.org/articles/55890/elife-55890-supp2-v2.pdf
-
Supplementary file 3
Constructs used in this study.
The name of constructs, the primers and the vectors (for building the constructs). Detailed cloning information is available upon request.
- https://cdn.elifesciences.org/articles/55890/elife-55890-supp3-v2.xlsx
-
Supplementary file 4
Key Resources Table.
- https://cdn.elifesciences.org/articles/55890/elife-55890-supp4-v2.docx
-
Transparent reporting form
- https://cdn.elifesciences.org/articles/55890/elife-55890-transrepform-v2.docx
Download links
A two-part list of links to download the article, or parts of the article, in various formats.
Downloads (link to download the article as PDF)
Open citations (links to open the citations from this article in various online reference manager services)
Cite this article (links to download the citations from this article in formats compatible with various reference manager tools)
A muscle-epidermis-glia signaling axis sustains synaptic specificity during allometric growth in Caenorhabditis elegans
eLife 9:e55890.
https://doi.org/10.7554/eLife.55890


