Targeted surveillance strategies for efficient detection of novel antibiotic resistance variants
- Department of Immunology and Infectious Diseases, Harvard T.H. Chan School of Public Health, United States
- Department of Microbiology and Immunology, The University of Melbourne at The Peter Doherty Institute for Infection and Immunity, Australia
- Center for Communicable Disease Dynamics, Department of Epidemiology, Harvard T.H. Chan School of Public Health, United States
- Division of Infectious Diseases, Department of Medicine, Brigham and Women’s Hospital, Harvard Medical School, United States
Figures
Figure 1 with 1 supplement
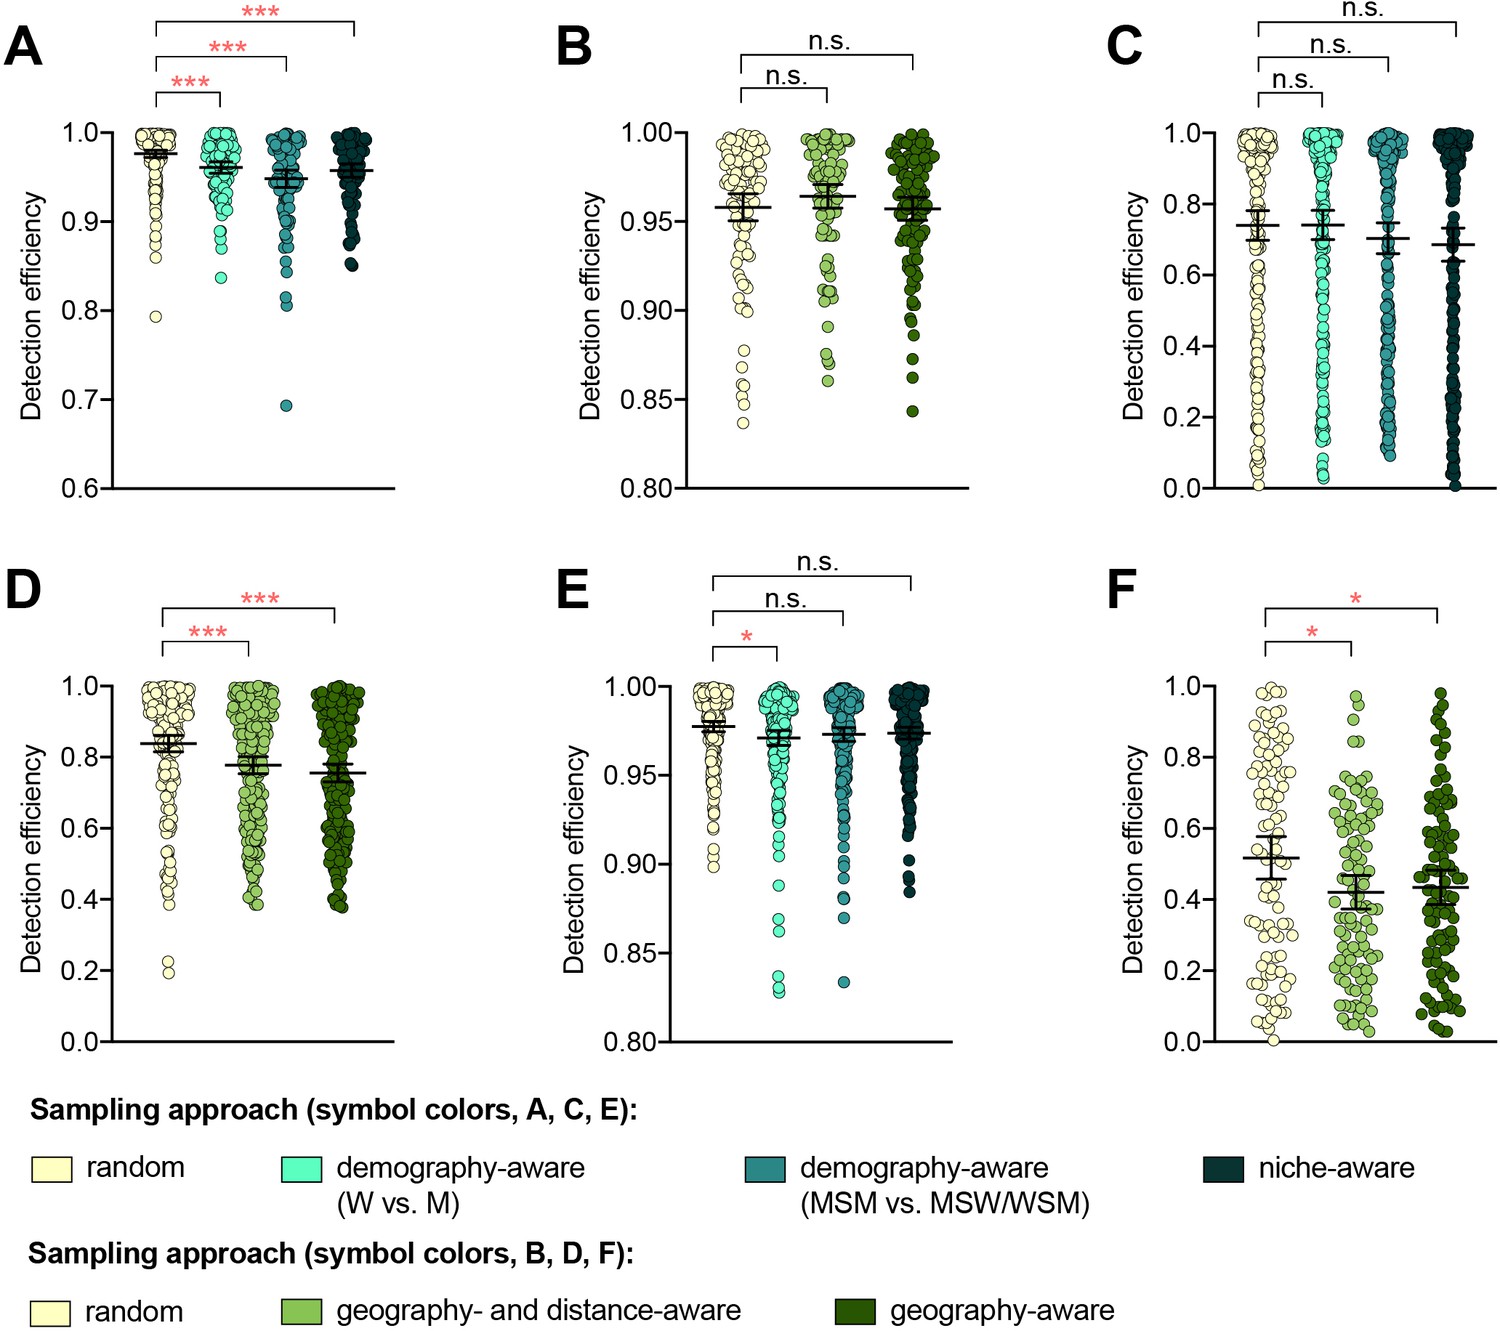
The impact of demography-, niche-, and geography-aware sampling on the detection efficiency of genetic resistance variants.
Dot plots showing the detection efficiency (with lines indicating the mean and 95% confidence intervals from 100 simulations) for resistance variants RplD G70D (A–B), 23S rRNA C2611T (C–D), and penA XXXIV (E–F) in datasets 1 and 2. In datasets 1 and 2, targeted sampling was informed by demographic (gender and sexual behavior) and anatomical site of isolate collection (niche) information (A, C, and E), and in datasets 3 and 4, targeted sampling was informed by country or prefecture of sample collection (B, D, and F). Dot colors indicate the sampling approach, and asterisks indicate a significant difference (p<0.05 by Mann-Whitney U test) in detection efficiency between the demography-, niche- or geography-aware approach compared to random sampling (*p<0.05, **p<0.01, ***p<0.001; red asterisks indicate significantly lower detection efficiency of demography- or geography-aware approaches compared to random sampling). Note that sampling simulations were not performed for RplD G70D in datasets 1 and 4 or for penA XXXIV in dataset 3 as prevalence of the variants in these datasets was >10%. n.s., not significant at α = 0.05; M, men; W, women; MSM, men who have sex with men; MSW, men who have sex with women; WSM, women who have sex with men.
Figure 1—figure supplement 1
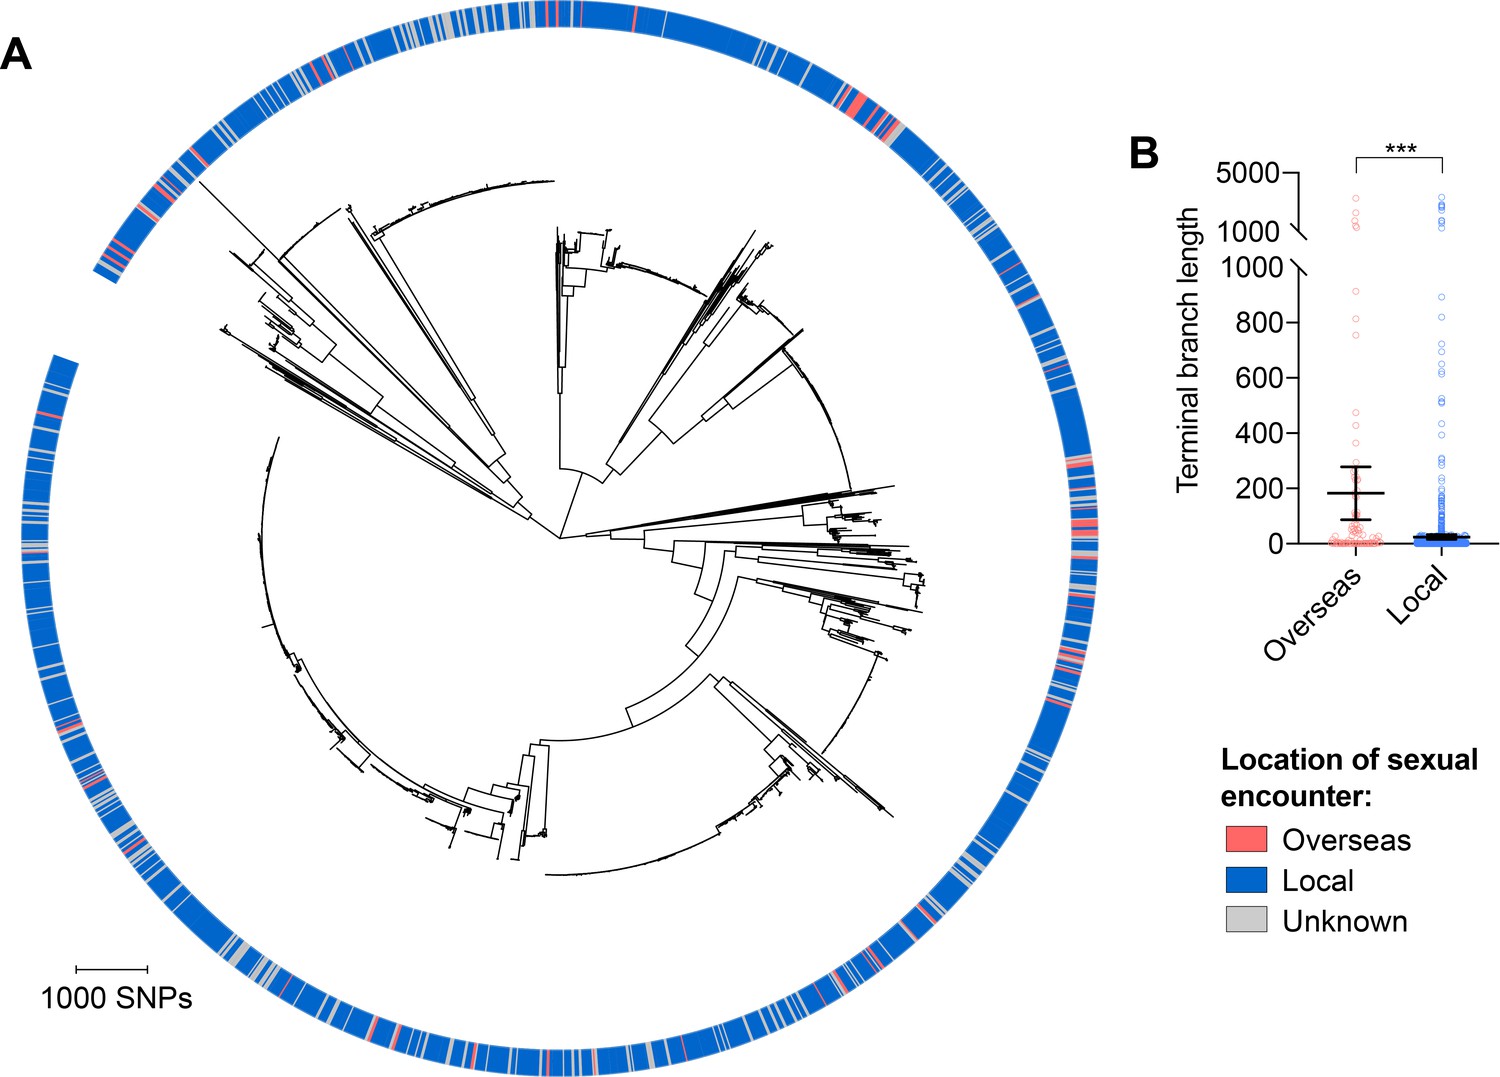
Isolates from patients with travel-associated gonorrhea are associated with longer terminal branches compared to patients with locally-acquired gonorrhea.
Maximum-likelihood phylogeny produced from the pseudogenome alignment (with predicted regions of recombination removed) of isolates from dataset 2 (A). Patient travel history is indicated by the colored ring in A. Scatter dot plots showing the terminal branch lengths (with lines indicating the mean and 95% confidence intervals) associated with isolates from patients with travel-associated gonorrhea compared to patients with locally-acquired gonorrhea with asterisks indicating a significant difference (p<0.001 by Mann-Whitney U test) in terminal branch lengths between the two groups (B).
Figure 2 with 1 supplement
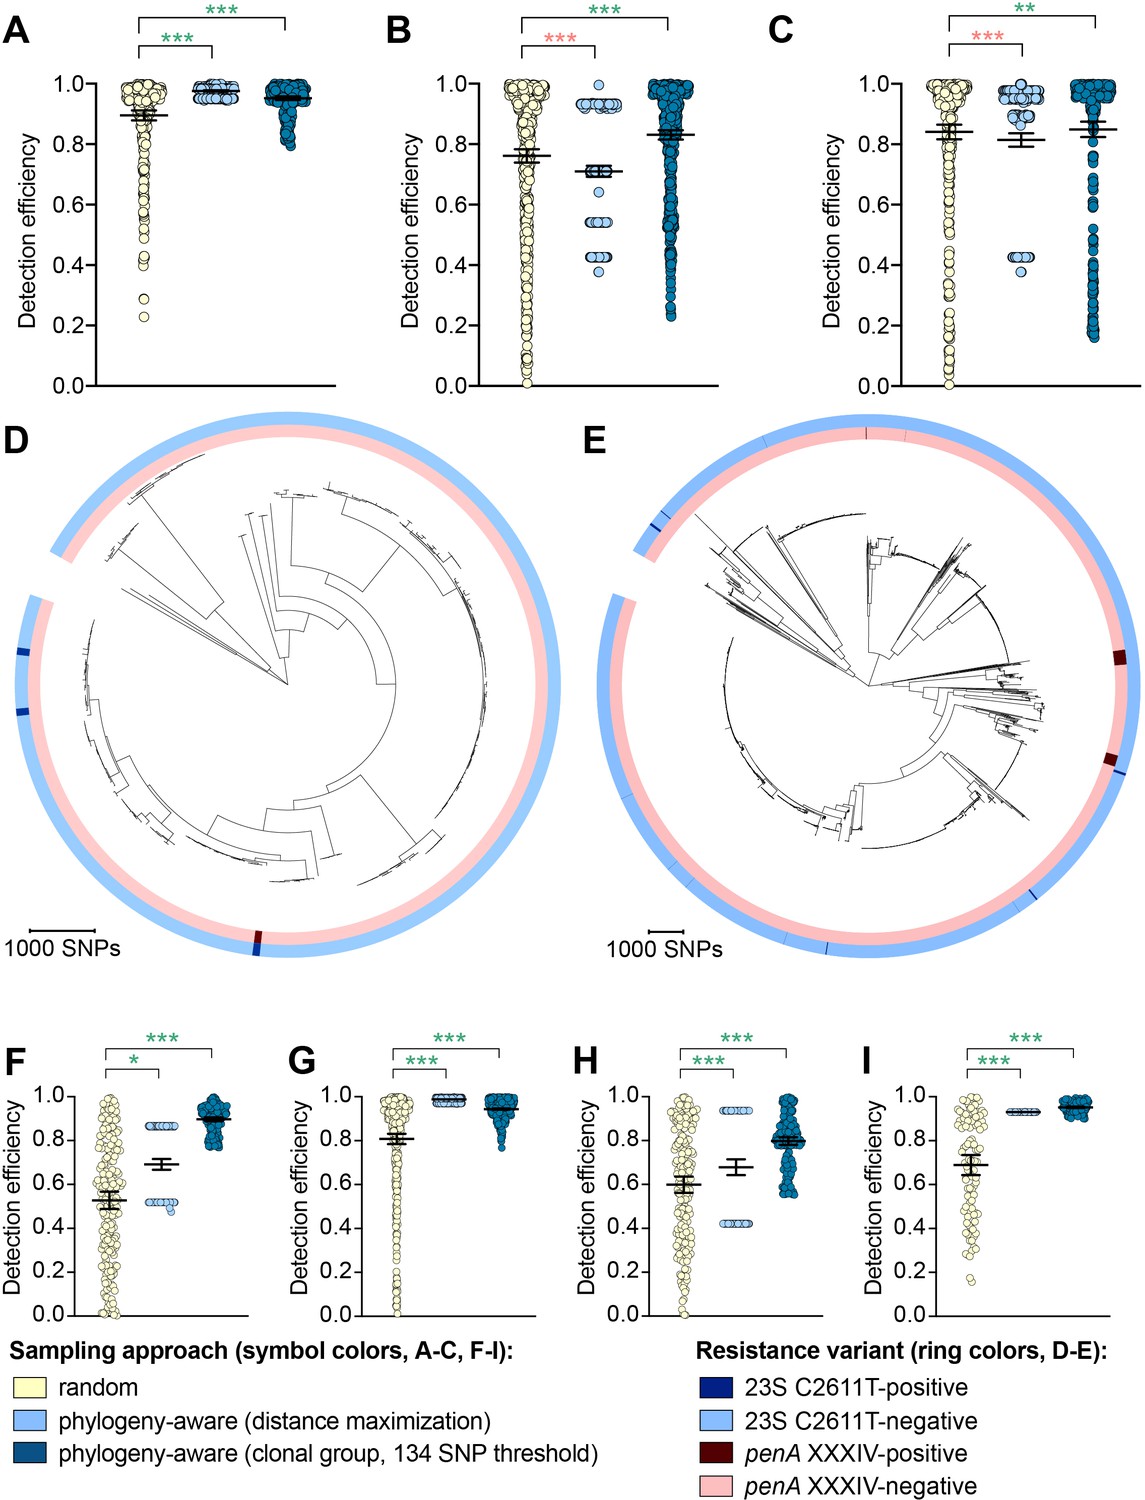
The impact of phylogeny-aware sampling on the detection efficiency of genetic resistance and diagnostic escape variants.
Scatter dot plots showing the detection efficiency (with lines indicating the mean and 95% confidence intervals from 100 simulations) for resistance variants RplD G70D (A), 23S rRNA C2611T (B), and penA XXXIV (C) in datasets 1–5. Note that sampling simulations were not performed for RplD G70D in datasets 1 and 4 or for penA XXXIV in dataset 3 as prevalence of the variants in these datasets was >10%. Maximum-likelihood phylogenies produced from pseudogenome alignments (with predicted regions of recombination removed) of isolates from dataset 4 (D) and dataset 2 (E). Presence or absence of the 23S rRNA C2611T mutation (in at least 2/4 alleles) and the mosaic penA XXXIV allele is indicated by colored rings. Scatter dot plots showing the detection efficiency (with lines indicating the mean and 95% confidence intervals from 100 simulations) for diagnostic-associated variants 16S rRNA C1209A (F), N. meningitidis-like porA (G), cppB deletion (H), and DR-9A G168A (I) in all datasets in which the variant was present. Dot colors in A–C) and F–I) indicate the sampling approach, and asterisks indicate a significant difference (p<0.05 by Mann-Whitney U test) in detection efficiency between the phylogeny-aware approach compared to random sampling (*p<0.05, **p<0.01, ***p<0.001; red asterisks indicate significantly lower detection efficiency of the phylogeny-aware approach compared to random sampling, and green asterisks indicate significantly higher detection efficiency of the phylogeny-aware approach compared to random sampling). n.s., not significant at α = 0.05.
Figure 2—figure supplement 1
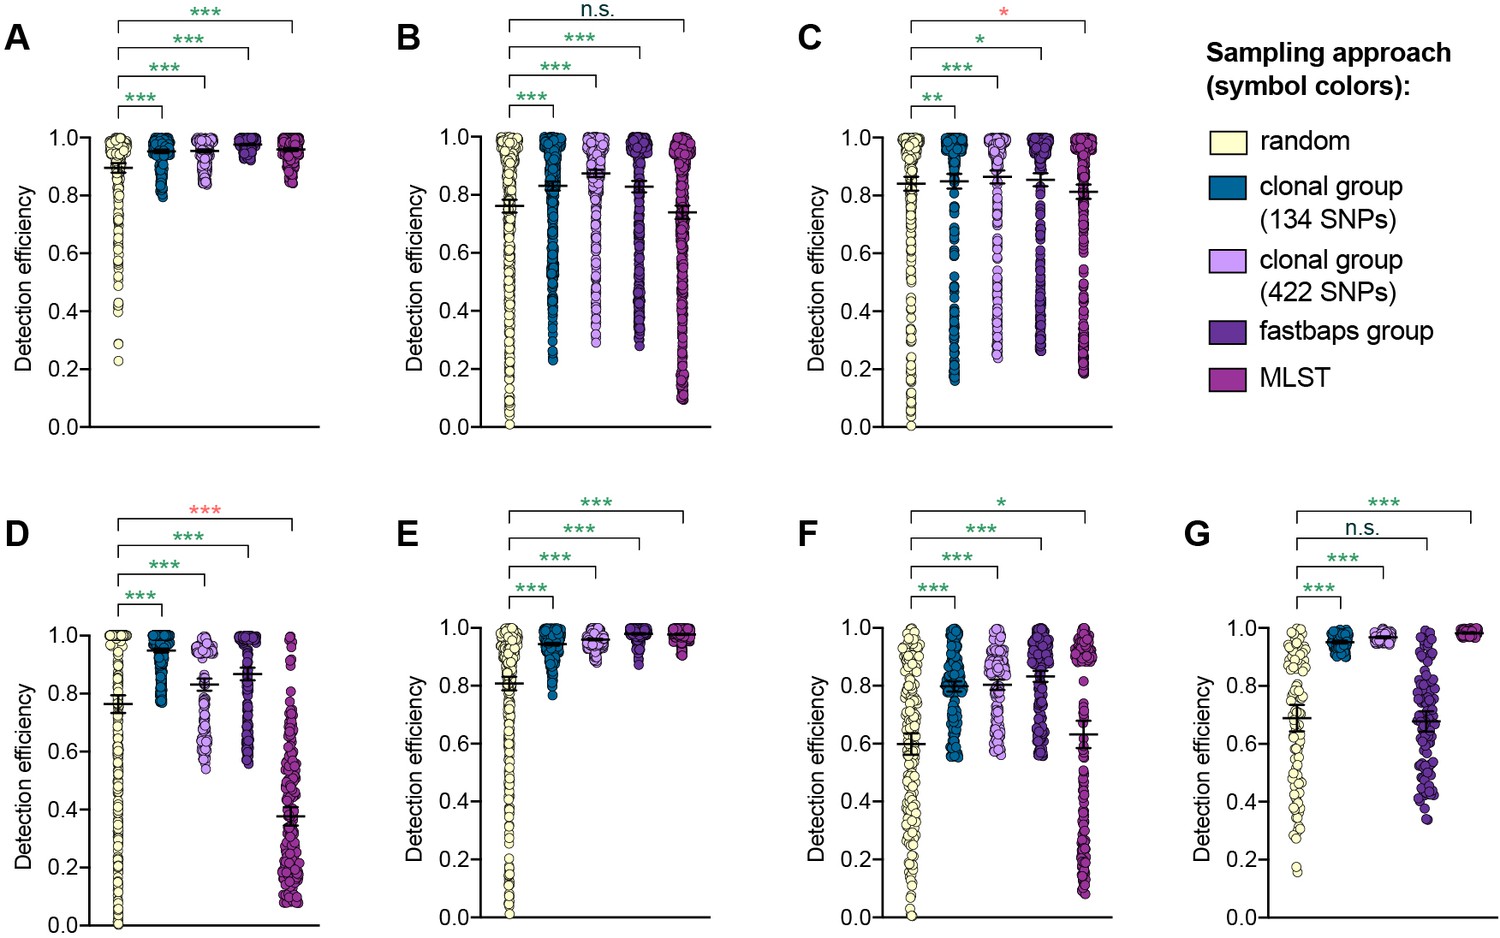
Detection efficiency of clonal group sampling across different similarity thresholds.
Scatter dot plots showing the detection efficiency (with lines indicating the mean and 95% confidence intervals from 100 simulations) for resistance variants RplD G70D (A), 23S rRNA C2611T (B), and penA XXXIV (C) in datasets 1–5 and for diagnostic-associated variants 16S rRNA C1209A (D), N. meningitidis-like porA (E), cppB deletion (F), and DR-9A G168A (G) in all datasets in which the variant was present. Note that sampling simulations were not performed for RplD G70D in datasets 1 and 4 or for penA XXXIV in dataset 3 as prevalence of the variants in these datasets was >10%. Dot colors indicate the sampling approach, and asterisks indicate a significant difference (p<0.05 by Mann-Whitney U test) in detection efficiency between the phylogeny-aware approach compared to random sampling (*p<0.05, **p<0.01, ***p<0.001; red asterisks indicate significantly lower detection efficiency of the phylogeny-aware approach compared to random sampling, and green asterisks indicate significantly higher detection efficiency of the phylogeny-aware approach compared to random sampling). n.s., not significant at α = 0.05.
Figure 3
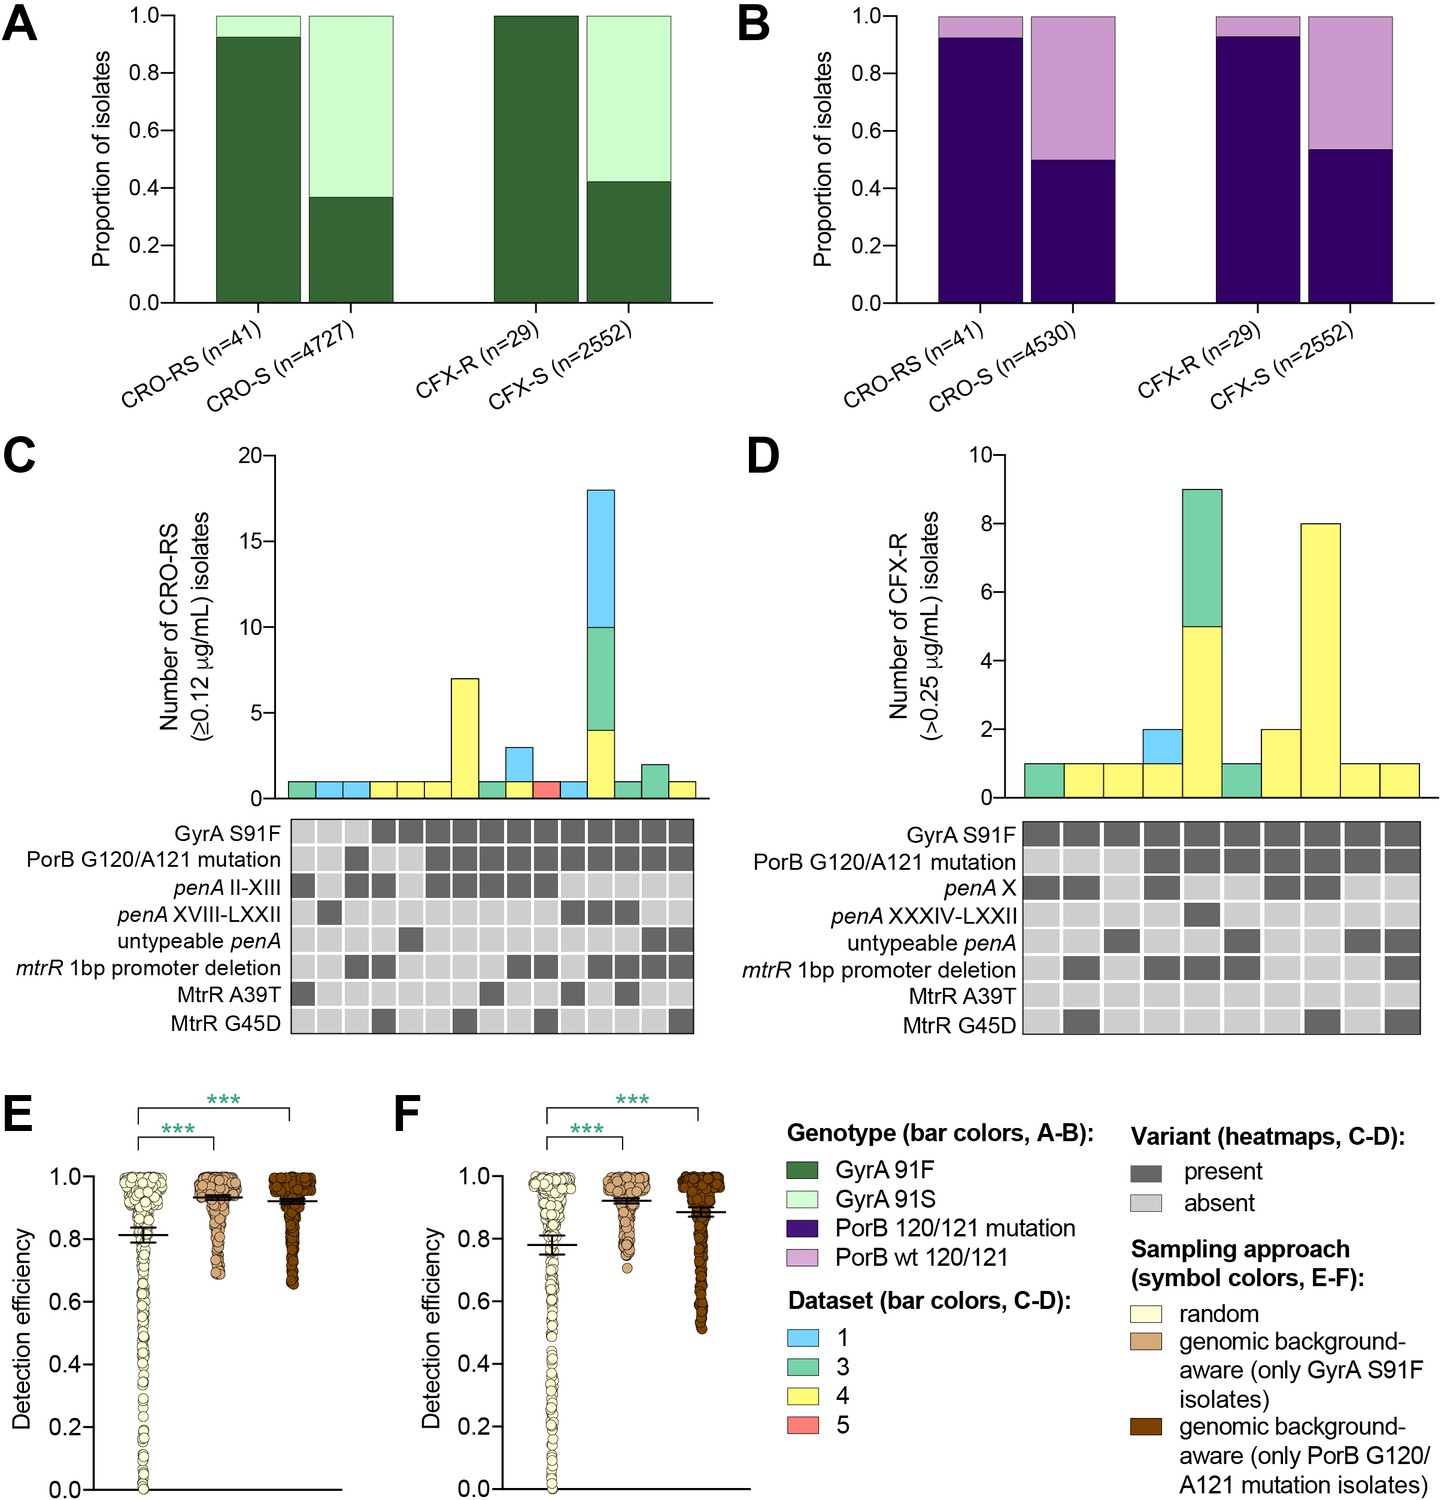
The impact of genomic background-aware sampling on the detection efficiency of phenotypic resistance variants.
Bar charts showing the proportions of ceftriaxone reduced susceptibility (CRO-RS) isolates, ceftriaxone susceptible (CRO-S) isolates, cefixime resistant (CFX-R) isolates, and cefixime susceptible (CFX-S) isolates with GyrA S91F and GyrA S91 wild-type alleles (A) and with PorB G120 and/or A121 mutations and PorB G120 and A121 wild-type alleles (B) across datasets 1–5. Bar charts showing the number of (C) CRO-RS and (D) CFX-R isolates with each haplotype, along with heatmaps showing the presence or absence of the GyrA S19F mutation, the PorB G120 and/or A121 mutations, and other alleles at loci previously associated with extended spectrum cephalosporin resistance. Bar colors in (C) and (D) indicate the dataset from which the isolates were derived. Scatter dot plots showing the detection efficiency (with lines indicating the mean and 95% confidence intervals from 100 simulations) for CRO-RS (E) and CFX-R (F) in all datasets in which the variant was present. Dot colors in E–F) indicate the sampling approach, and asterisks indicate a significant difference (p<0.05 by Mann-Whitney U test) in detection efficiency between the phylogeny-aware approach compared to random sampling (*p<0.05, **p<0.01, ***p<0.001; green asterisks indicate significantly higher detection efficiency of the genomic background-aware approach compared to random sampling).
Tables
Table 1
Summary of datasets.
| Dataset | Temporal range | Nisolates | Geographic range | Metadata available | SRA study ID/Reference |
|---|---|---|---|---|---|
| 1 | 2011–2015 | 896 | New York, NY, US | Gender, sexual behavior, anatomical site of isolation | ERP011192 (Mortimer et al., 2020) |
| 2 | 2016–2017 | 2186 | Victoria, Australia | Gender, sexual behavior, anatomical site of isolation, travel history, sex worker status | SRP185594 (Williamson et al., 2019) |
| 3 | 2013 | 1054 | Europe | Country of sample collection | ERP010312 (Harris et al., 2018) |
| 4 | 2015 | 244 | Japan | Prefecture of sample collection | DRP004052 (Yahara et al., 2018) |
| 5 | 2014–2015 | 398 | New Zealand | N/A | SRP111927 (Lee et al., 2018b) |
Table 2
Summary by dataset of the prevalence and distribution of the genetic markers of resistance and resistance phenotypes tested.
| Variant | Genetic | Phenotypic | ||||
|---|---|---|---|---|---|---|
| RplD G70D | 23S rRNA C2611T (2–4 alleles) | penA XXXIV | CRO-RS (≥0.12 μg/mL) | CFX-R (>0.25 μg/mL) | ||
| Drug | AZM (Grad et al., 2016) | AZM (Lk et al., 2002) | ESCs (Grad et al., 2014) | N/A | N/A | |
| Prevalence of variant in dataset | 1 | 10.04%* | 0.11% | 5.25% | 1.47% | 0.11% |
| 2 | 1.14% | 1.24% | 1.69% | 0% | 0% | |
| 3 | 2.47% | 0.95% | 15.68%* | 1.04% | 0.76% | |
| 4 | 11.07%* | 1.23% | 0.41% | 6.56% | 8.20% | |
| 5 | 0.75% | 0.50% | 2.26% | 0.25% | 0% | |
| Phylogenetic D statistic for variant in dataset | 1 | −0.18 | 17.50 | −0.29 | N/A | N/A |
| 2 | −0.10 | 0.46 | −0.24 | N/A | N/A | |
| 3 | 0.05 | 0.30 | −0.20 | N/A | N/A | |
| 4 | −0.16 | 1.83 | 1.81 | N/A | N/A | |
| 5 | 0.83 | 1.12 | −0.15 | N/A | N/A | |
-
*Given the >10% prevalence of RplD G70D in datasets 1 and 4 and penA XXXIV in dataset 3, these variants were excluded from sampling simulations.
AZM, azithromycin; ESC, extended-spectrum cephalosporin; CRO-RS, ceftriaxone reduced susceptibility; CFX-R, cefixime resistance.
Table 3
Summary of the potential diagnostic escape variants assessed.
| Variant | Diagnostic assay | Documented association with diagnostic failure | Prevalence in dataset | ||||
|---|---|---|---|---|---|---|---|
| 1 | 2 | 3 | 4 | 5 | |||
| 16S rRNA C1209A (four alleles) | Aptima GC Combo | Yes (Guglielmino et al., 2019) | 0.11% | 0.09% | 0% | 0% | 0% |
| N. meningitidis-like porA | In-house (Whiley et al., 2004; Whiley et al., 2005) | Yes (Whiley et al., 2011; Golparian et al., 2012) | 0.11% | 0.05% | 0% | 0% | 0% |
| cppB deletion | In-house (Diemert et al., 2002; Van Dyck et al., 2001) | Yes (Bruisten et al., 2004) | 1.12% | 0.05% | 0.47% | 0% | 7.29% |
| DR-9A G168A | Roche COBAS 4800 CT/NG | No | 0% | 0.09% | 0% | 0% | 0% |
Table 4
Reference information for the genetic variants assessed.
| Variant | Reference accession | Coordinates of genetic locus in reference entry | Position of mutation in reference locus |
|---|---|---|---|
| RplD G70D | NC_011035.1 | 2033052–2033672 | amino acid 70 |
| 23S rRNA C2611T | NC_011035.1 | 1263408–1266305 | nucleotide 2603 |
| penA XXXIV | NZ_LT906440.1 | 1588456–1590201 | N/A (assessed presence/absence of this allele) |
| 16S rRNA C1209A | NC_011035.1 | 1266903–1268450 | nucleotide 1192 |
| N. meningitidis-like porA | NC_011035.1 | 735796–737125 | N/A (assessed nucleotide similarity across the full locus with a threshold of ≤ 90%)* |
| cppB deletion | LT592149.1 | 2912–3553 | N/A (assessed presence/absence of full locus) |
| DR-9A G168A | NC_011035.1 | 530088–530277 | nucleotide 168 |
-
*Isolates with a porA pseudogene with ≤90% similarity to the NC_011035.1 porA pseudogene were called positive for N. meningitidis-like porA. Note that all such isolates were confirmed to have a porA pseudogene that was ≥92% similar to the N. meningitidis porA (GenBank Accession: GQ173789.1), while all other isolates had ≤89% similarity to the N. meningitidis porA.
Additional files
-
Supplementary file 1
Metadata and resistance variant profiles for isolates assessed in this study.
M, men; W, women; MSM, men who have sex with men; MSW, men who have sex with women; WSM, women who have sex with men; CFX-R, cefixime resistance; CRO-RS, ceftriaxone reduced susceptibility; AZM-R, azithromycin resistance.
- https://cdn.elifesciences.org/articles/56367/elife-56367-supp1-v1.xlsx
-
Supplementary file 2
Dataset bias and targeted sampling results.
(A) Demographic and geographic sampling biases in datasets 1–3. (B) Detection efficiency of random, demography-, niche-, and geography-aware sampling approaches for resistance variants. (C) Detection efficiency of random sampling, as well as preferential sampling of patients that had recently engaged in overseas sex or in sex work, for resistance variants in dataset 2. (D) Detection efficiency of random and phylogeny-aware sampling approaches for resistance variants. (E) Detection efficiency of random and phylogeny-aware sampling approaches for variants associated with diagnostic escape. (F) Detection efficiency of random and genomic background-aware sampling approaches for resistance variants.
- https://cdn.elifesciences.org/articles/56367/elife-56367-supp2-v1.docx
-
Transparent reporting form
- https://cdn.elifesciences.org/articles/56367/elife-56367-transrepform-v1.pdf
Download links
A two-part list of links to download the article, or parts of the article, in various formats.
Downloads (link to download the article as PDF)
Open citations (links to open the citations from this article in various online reference manager services)
Cite this article (links to download the citations from this article in formats compatible with various reference manager tools)
Targeted surveillance strategies for efficient detection of novel antibiotic resistance variants
eLife 9:e56367.
https://doi.org/10.7554/eLife.56367


