Dysregulation of sonic hedgehog signaling causes hearing loss in ciliopathy mouse models
- Department of Anatomy, Yonsei University College of Medicine, Republic of Korea
- BK21 PLUS project for Medical Science, Yonsei University College of Medicine, Republic of Korea
- Department of Biochemistry, College of Life Science and Biotechnology, Yonsei University, Republic of Korea
- Department of Otorhinolaryngology, Yonsei University College of Medicine, Republic of Korea
Figures
Figure 1 with 1 supplement
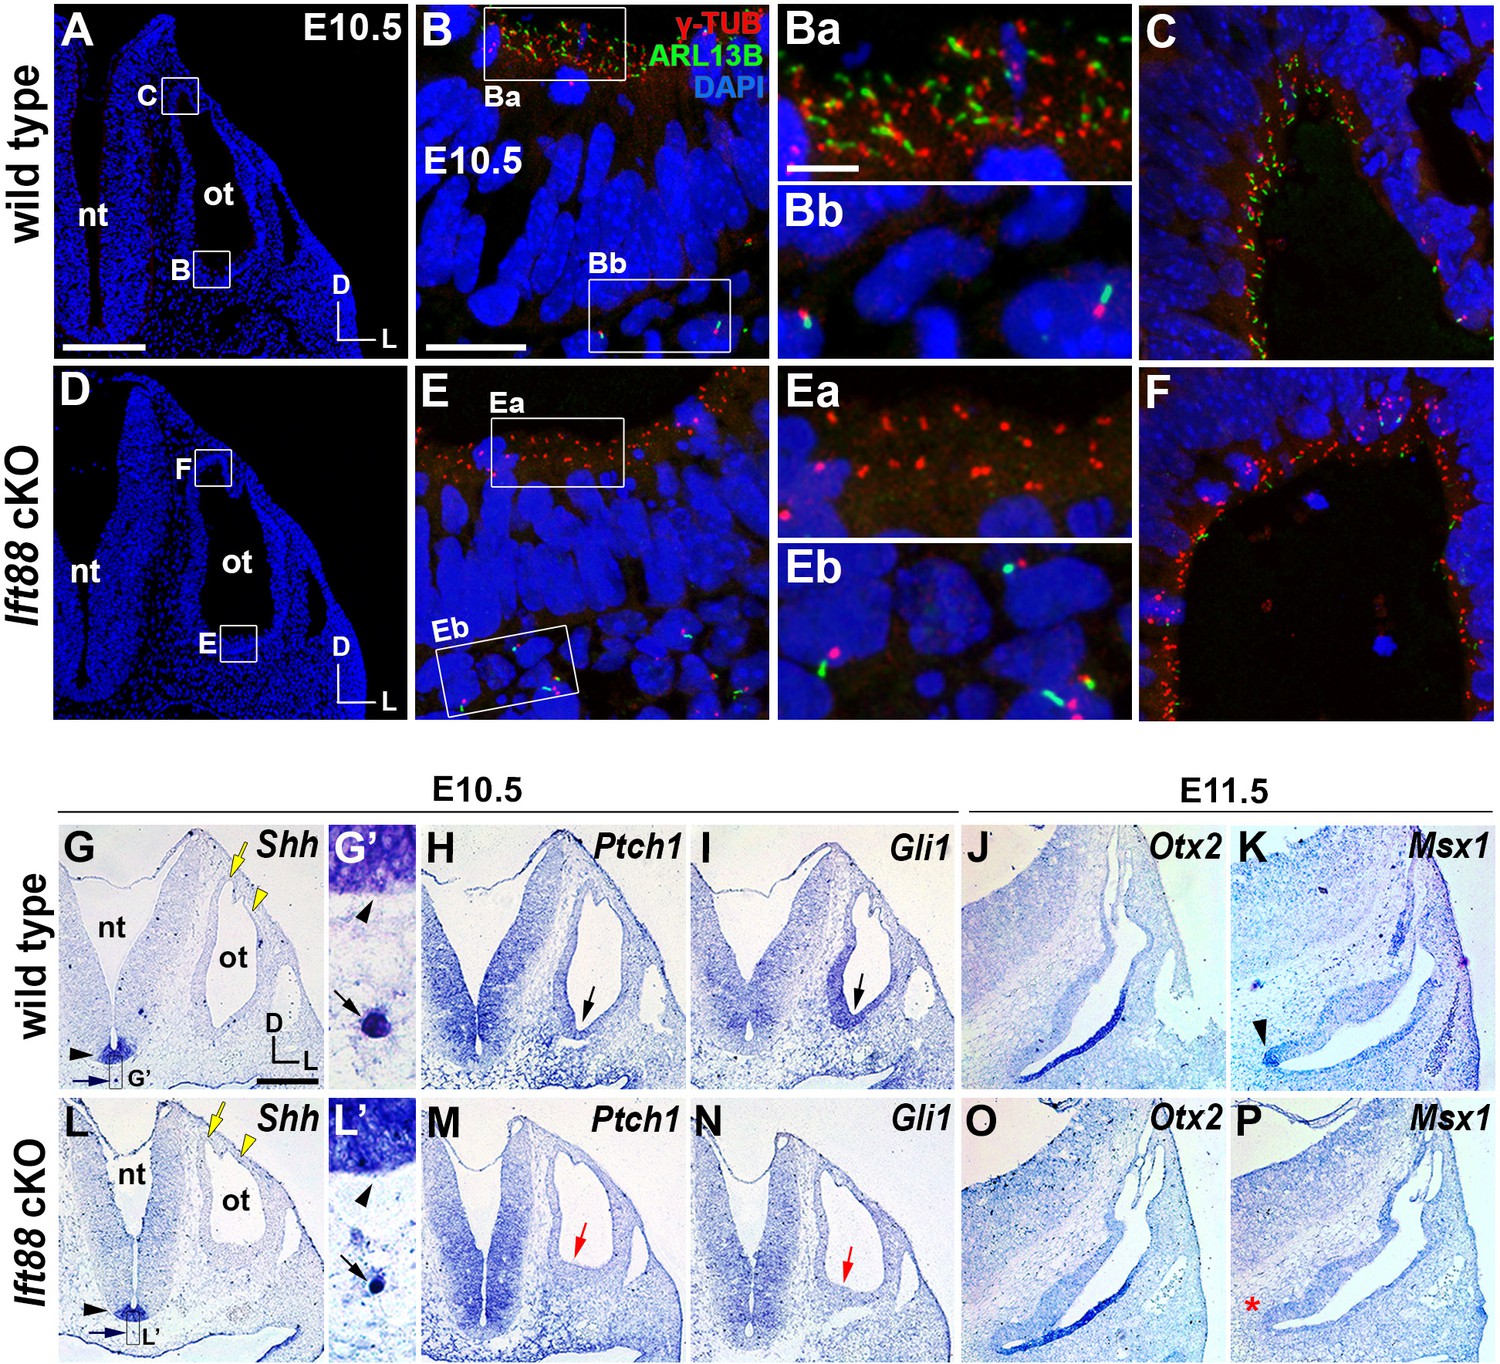
Sonic hedgehog signaling is affected in Ift88 cKO otocysts.
(A–C) In E10.5 wild-type embryos, primary cilia visualized by ARL13B and γ-tubulin immunostaining were observed in the otic epithelium (B, Ba, C) and periotic mesenchyme (Bb). (D–F) In Ift88 cKO embryos, primary cilia were disappeared in the otic epithelium (E, Ea, F) but not in periotic mesenchyme (Eb). (G–I, L–N) Shh is expressed in the floor plate (G, G’, L, L’; black arrowheads) and notochord (G, G’, L, L’; black arrows) in both E10.5 wild-type and Ift88 cKO embryos. Yellow arrows and arrowheads indicate the endolymphatic duct and vertical pouch, respectively. The sonic hedgehog (SHH) target genes, Ptch1 and Gli1, are expressed in a graded pattern, stronger in the ventral and medial regions and weaker in the dorsolateral region of the otocyst in wild-type embryos (H, I), but dramatically decreased in Ift88 cKO embryos (M, N; red arrows). (J, K) In E11.5 wild-type otocysts, Otx2 is expressed in the lateral side of the developing cochlea and Msx1 is expressed in the apical tip of the cochlea (K; arrowhead). (O, P) In Ift88 cKO otocysts, while Otx2 expression appears normal, Msx1 expression is completely downregulated (P; red asterisk). nt, neural tube; ot, otocyst. In all images, dorsal is up and lateral is right. Scale bar in A, 200 μm, also applies to D; scale bar in B, 20 μm, also applies to C, E, F; scale bar in Ba, 3 μm, also applies to Bb, Ea, Eb; scale bar in G, 200 μm, also applies to H–P.
Figure 1—figure supplement 1
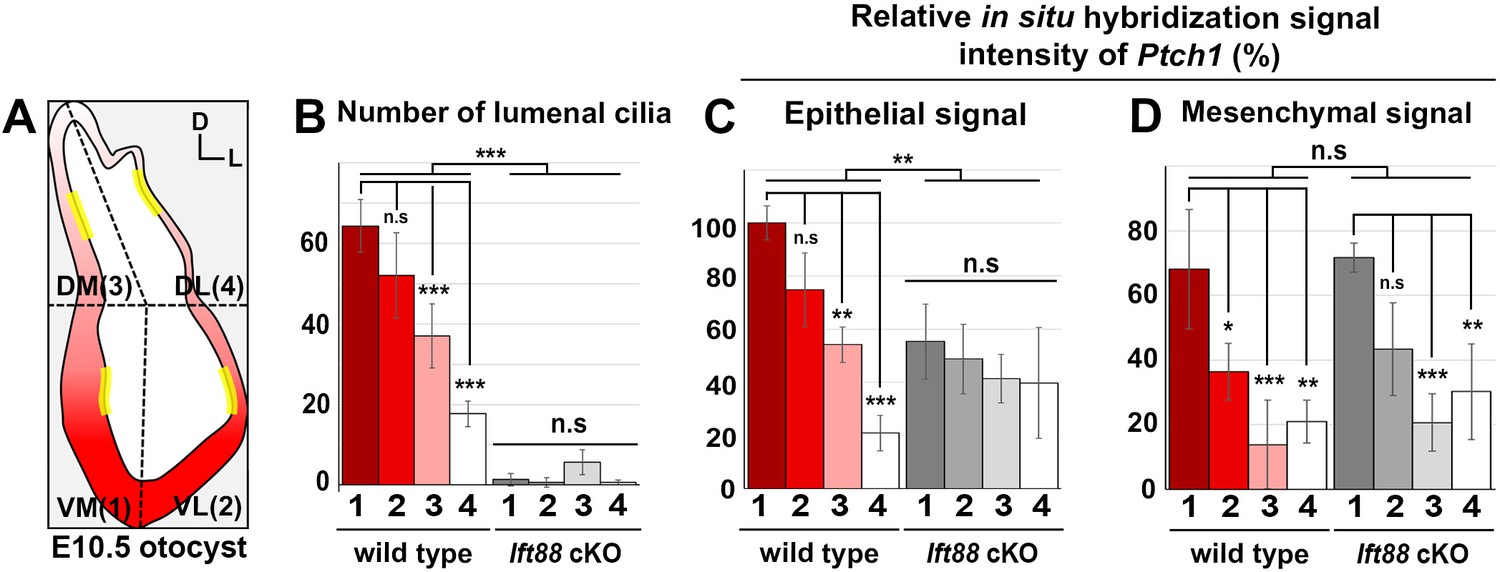
Quantification of cilia number and sonic hedgehog (SHH) target gene expression in the inner ear.
(A) The otocyst is divided into four regions: ventromedial (VM), ventrolateral (VL), dorsomedial (DM), and dorsolateral (DL), which are numbered 1, 2, 3, and 4, respectively. The number of lumenal cilia was counted in the areas indicated by yellow lines (80 µm in length). (B) Quantification of the number of cilia in control and Ift88 cKO otocysts. The number of cilia is higher in the ventral otic regions than the dorsal regions in controls, while nearly no cilia are observed in Ift88 cKO otocysts (n = 3 for wild type, n = 3 for Ift88 cKO). (C,D) Quantification of the signal intensity for in situ hybridization of Ptch1. The strongest intensity among all measurements was set as 100%, and the relative signal intensity of otic epithelium and periotic mesenchyme in each region of wild-type and Ift88 cKO otocysts are plotted (n = 3 for wild types, n = 3 for Ift88 cKO). Values and error bars represent the mean ± standard deviation. Statistical comparisons were made using two-way ANOVA with Bonferroni correction for multiple comparisons (*p<0.05 **p<0.01, ***p<0.001).
-
Figure 1—figure supplement 1—source data 1
Raw data for cilia number and in situ hybridization signal intensity shown in Figure 1—figure supplement 1.
- https://cdn.elifesciences.org/articles/56551/elife-56551-fig1-figsupp1-data1-v2.xlsx
Figure 2 with 3 supplements
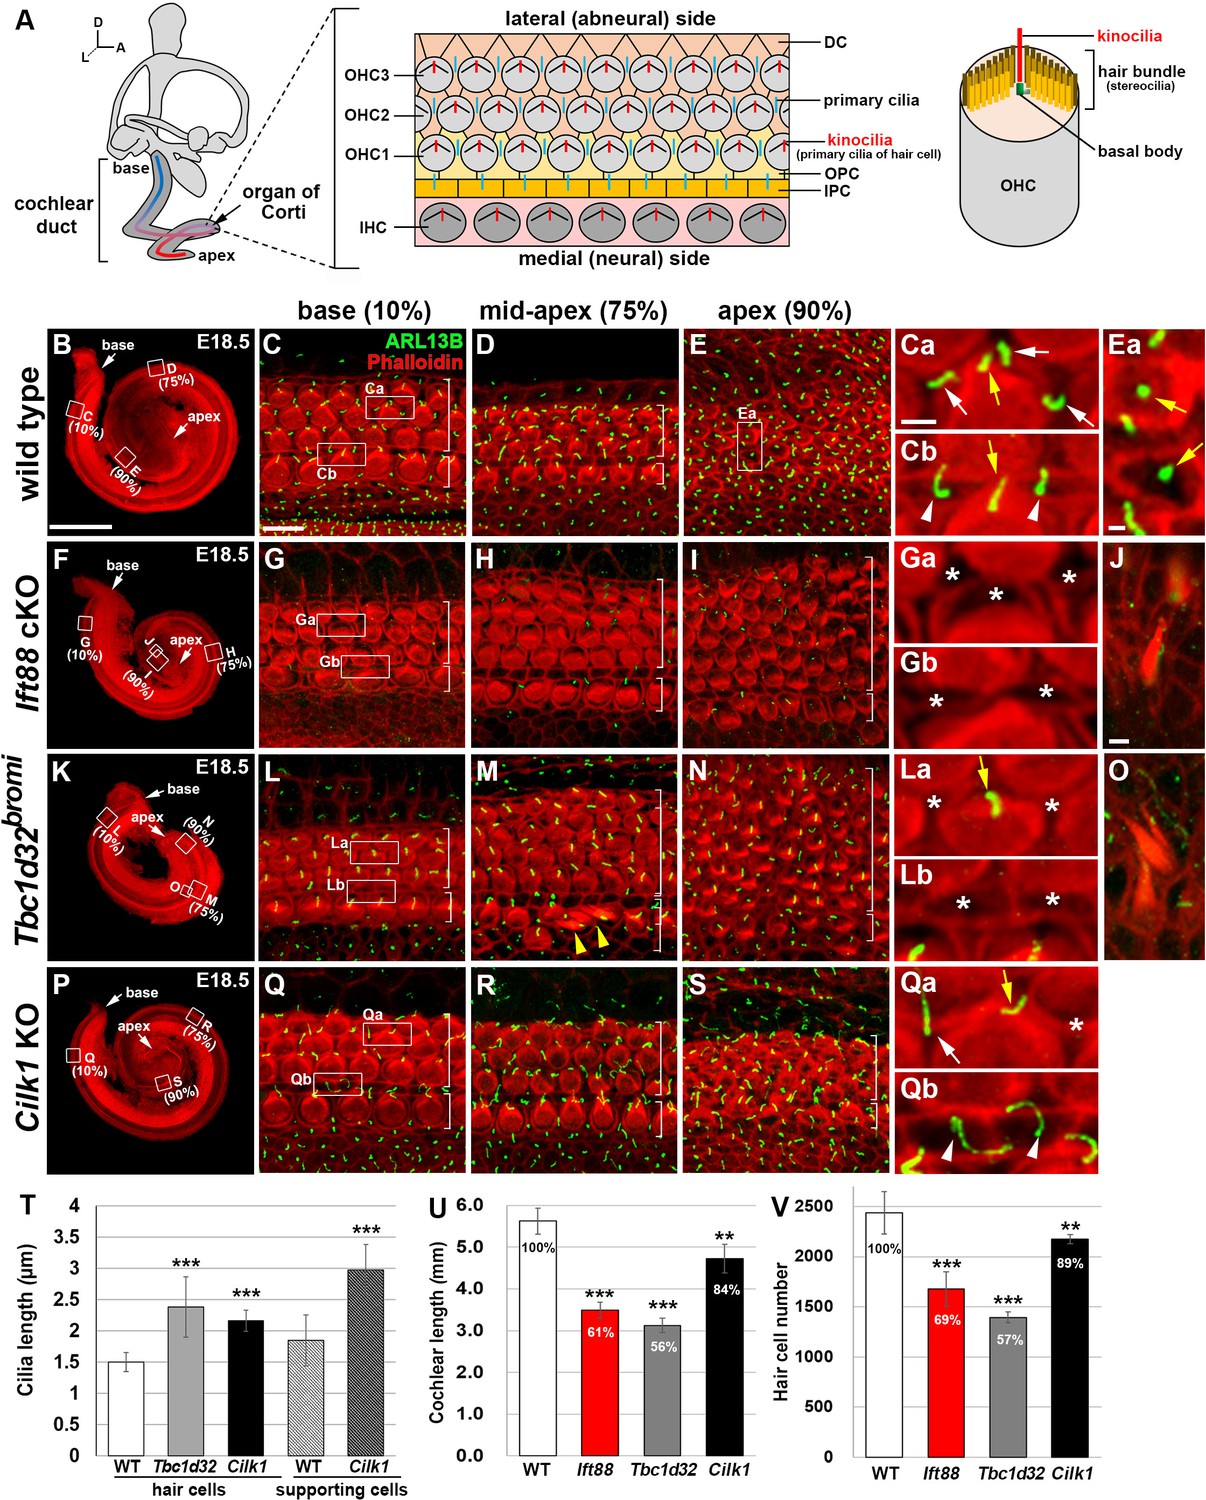
Cochlear phenotypes of three ciliary mutants at E18.5.
(A) Schematic diagram of E18.5 organ of Corti. OHC, outer hair cell; IHC, inner hair cell; DC, Deiter’s cell; OPC, outer pillar cell; IPC, inner pillar cell. (B–E) In E18.5 wild-type cochlea, stereociliary bundles and primary cilia were visualized by staining with phalloidin (red fluorescence) and immunostaining with anti-ARL13B antibody (green fluorescence), respectively. Images of organ of Corti from 10% (base), 75% (mid-apex), and 90% (apex) cochlear positions from the basal end show a progression of HC differentiation from base to apex based on overall organization and stereociliary bundles in the hair cells (HCs). White brackets indicate one row of IHCs and three or more rows of OHCs. Magnified images show kinocilia of OHCs (Ca, Cb, Ea; yellow arrows) and primary cilia of Deiters’ cells (Ca; white arrows) and pillar cells (Cb; white arrowheads). (F–J) In Ift88 cKO mutants, cochlea shows a severe shortening (F), premature HC differentiation (G–I), and multiple extra rows of OHCs in the apex (H, I). Both kinocilia and primary cilia are absent from most HCs and supporting cells (SCs) (Ga, Gb; asterisks). Ectopic vestibule-like HCs are present in the Kölliker’s organ (J). (K–O) In Tbc1d32bromi mutants, cochlea shows a severe shortening (K), premature HC differentiation (L–N), and multiple rows of OHCs in the apex (M, N). Kinocilia of HCs are present (La; yellow arrow) but primary cilia in the SCs are missing (La, Lb; asterisks). Ectopic vestibule-like HCs are present adjacent to inner HCs (M; yellow arrowheads) and in the Kölliker’s organ (O). (P–S) In Cilk1 KO mutants, cochlea shows a slight shortening (P), slightly premature HC differentiation (Q–S), and increased OHCs in the apex (S). Both kinocilia and primary cilia are abnormally elongated (Qa, Qb) and primary cilia are often absent from SCs (Qa; asterisk). Scale bar in B, 500 μm, also applies to F, K, P; scale bar in C, 10 μm, also applies to D, E, G–I, L–N, Q–S; scale bar in Ca, 2 μm, also applies to Cb, Ea, Ga, Gb, La, Lb, Qa, Qb; scale bar in J, 2 μm, also applies to O. (T–V) Quantification of ciliary lengths (T; measured from at least 100 cells from three or more embryos for each genotype), cochlear lengths (U; n = 5–7 embryos for each genotype), and HC numbers (V; n = 3–5 embryos for each genotype). Values and error bars represent the mean ± standard deviation. Statistical comparisons were made using the two-tailed Student’s t-test (**p<0.01, ***p<0.001).
-
Figure 2—source data 1
Raw data for cilia length, cochlear length, and HC number shown in Figure 2.
- https://cdn.elifesciences.org/articles/56551/elife-56551-fig2-data1-v2.xlsx
Figure 2—figure supplement 1
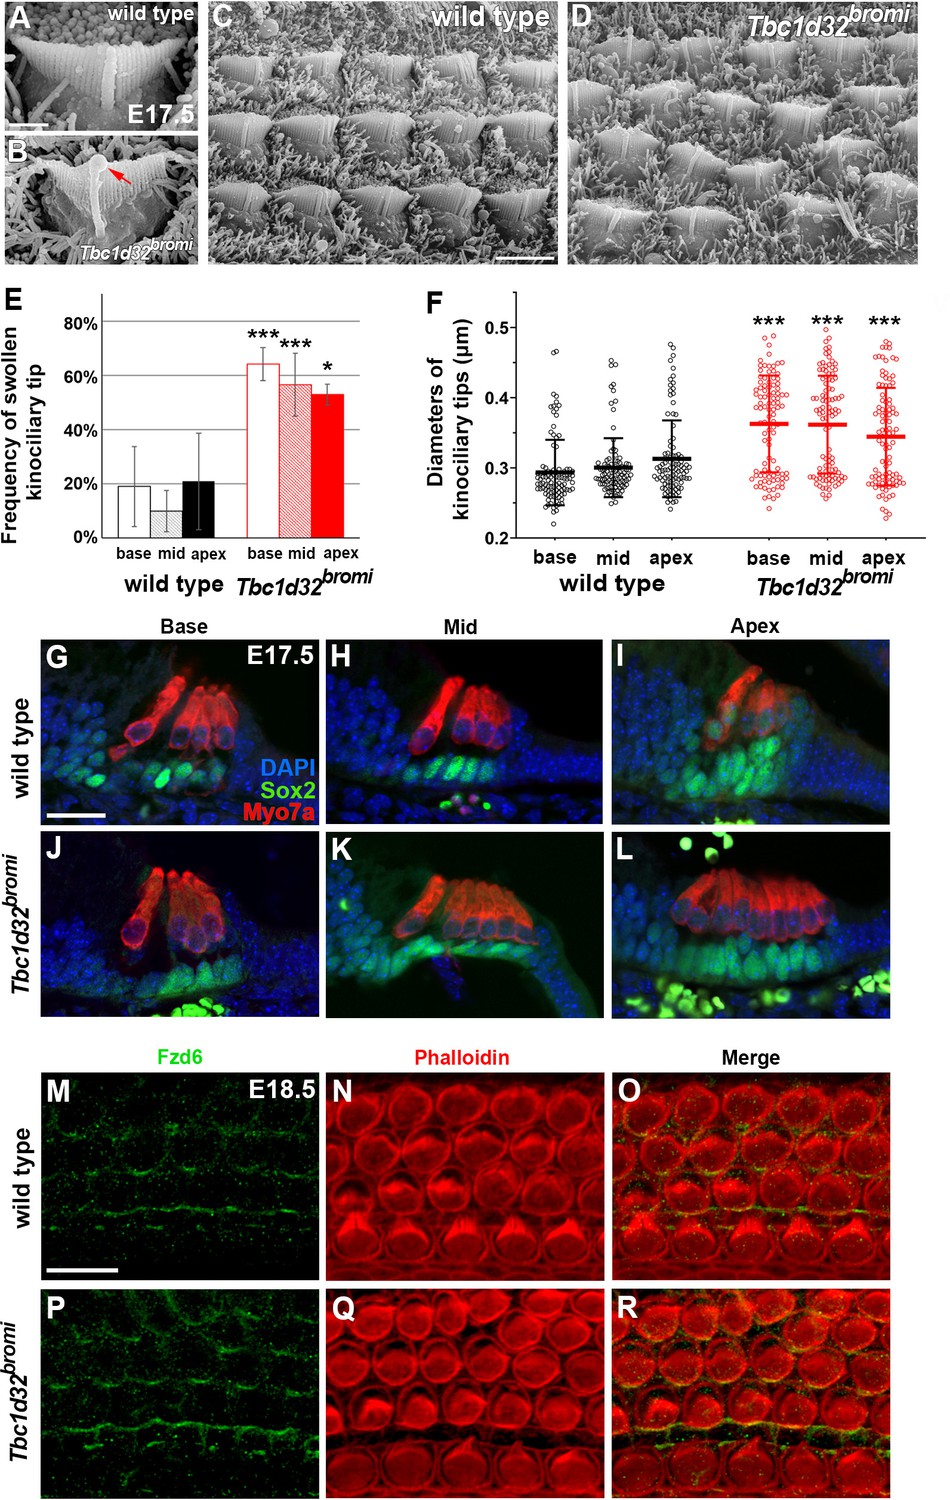
SEM and immunofluorescent images of hair cells (HCs) of Tbc1d32bromi mutants.
(A–D) Scanning electron micrographs of OHCs of wild-type and Tbc1d32bromi mutants at E17.5. Tbc1d32bromi mutants exhibit abnormally elongated kinocilia with swollen tips more frequently compared to wild types (B; red arrow). (E, F) The frequency of swollen kinociliary tips and their diameters are quantified from at least 100 HCs in each region of wild-type (n = 3) and Tbc1d32bromi mutants (n = 3). Values and error bars represent the mean ± standard deviation. Statistical comparisons were made using the two-way ANOVA with Bonferroni correction for multiple comparisons (**p<0.01, ***p<0.001). (G–L) Section immunofluorescent images of the organ of Corti of E17.5 wild-type and Tbc1d32bromi cochleae. HCs are stained with anti-MYO7A antibody (red) and supporting cells (SCs) are stained with anti-SOX2 antibody (green). Extra rows of HCs and SCs are displayed in the middle and apical cochlear section of Tbc1d32bromi mutants. (M–R) Whole mount immunofluorescent images of the organ of Corti of E18.5 wild-type and Tbc1d32bromi cochleae, stained with phalloidin and anti-FZD6 antibody. Scale bar in A, 1 μm, also applies to B; scale bar in C, 4 μm, also applies to D; scale bar in G, 20 μm, also applies to H–L; scale bar in M, 10 μm, also applies to N–R.
-
Figure 2—figure supplement 1—source data 1
Raw data for quantification of abnormal cilia shown in Figure 2—figure supplement 1.
- https://cdn.elifesciences.org/articles/56551/elife-56551-fig2-figsupp1-data1-v2.xlsx
Figure 2—figure supplement 2
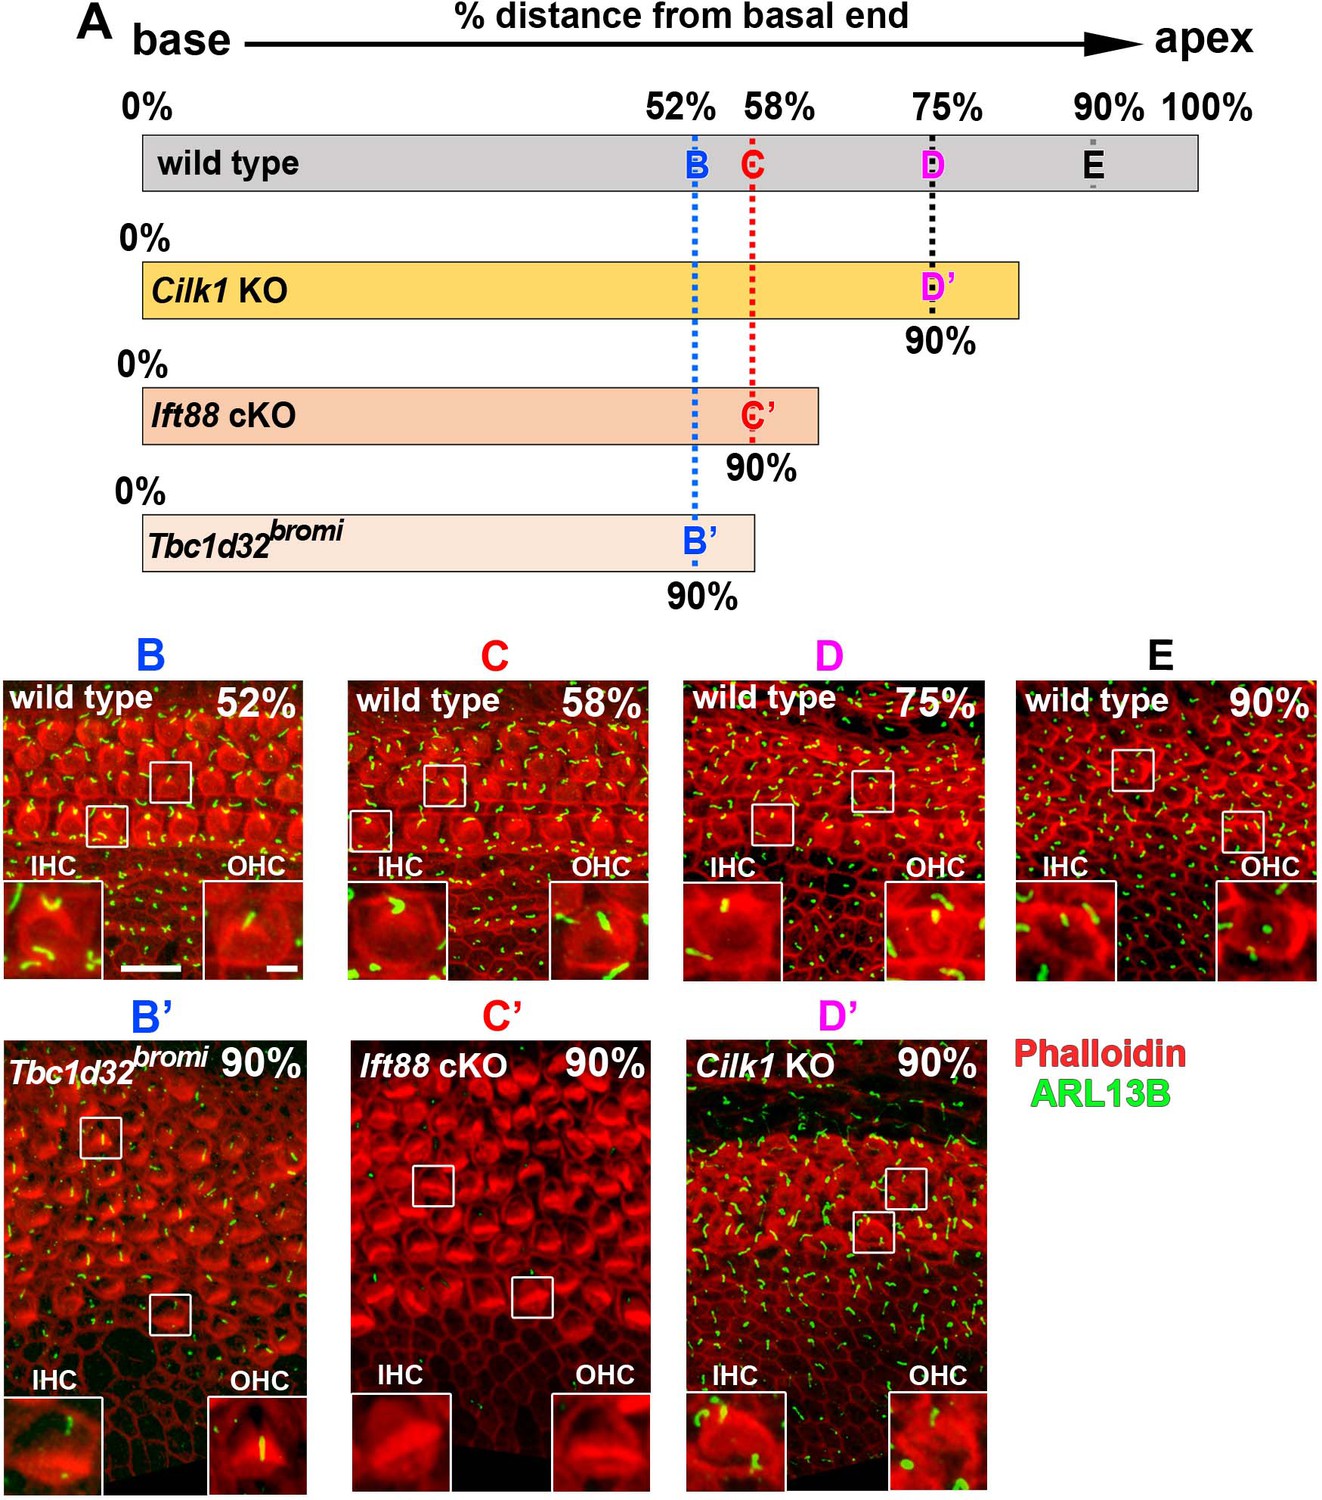
Comparison of hair cells (HCs) located at the same distance from the basal end of wild-type and ciliary mutant cochlea.
(A) Schematic diagram showing the relative cochlear lengths of wild-type and ciliary mutant cochlea. The basal cochlear end is set to 0%, and the apical end is set to 100%. The absolute distance of the 90% position of Tbc1d32bromi, Ift88, or Cilk1 mutant cochlea corresponds to 52%, 58%, or 75% of wild-type cochlea. (B–E) Stereocilia and primary cilia were visualized by staining with phalloidin (red fluorescence) and immunostaining with anti-ARL13B antibody (green fluorescence). HCs located at 90% position of Tbc1d32bromi (B, B’), Ift88 (C, C’), or Cilk1 (D, D’) mutant cochlea were compared with wild-type HCs located at the same distance from the base. Scale bar in B, 10 μm, also applies to all panels; scale bar in the inset in B, 2 μm, also applies to all insets.
Figure 2—figure supplement 3

Premature hair cell differentiation in ciliary mutant cochlea.
(A, B) Atoh1 and Pou4f3 are expressed in the base, mid-base, and mid-apex (black arrows), but not in the apex (asterisks), of wild-type cochlea at E17.5. (C–H) Atoh1 and Pou4f3 are expressed in the entire cochlear duct including the apex (red arrows) in E17.5 ciliary mutants. Scale bar in B, 200 μm, also applies to A–G.
Figure 3 with 1 supplement
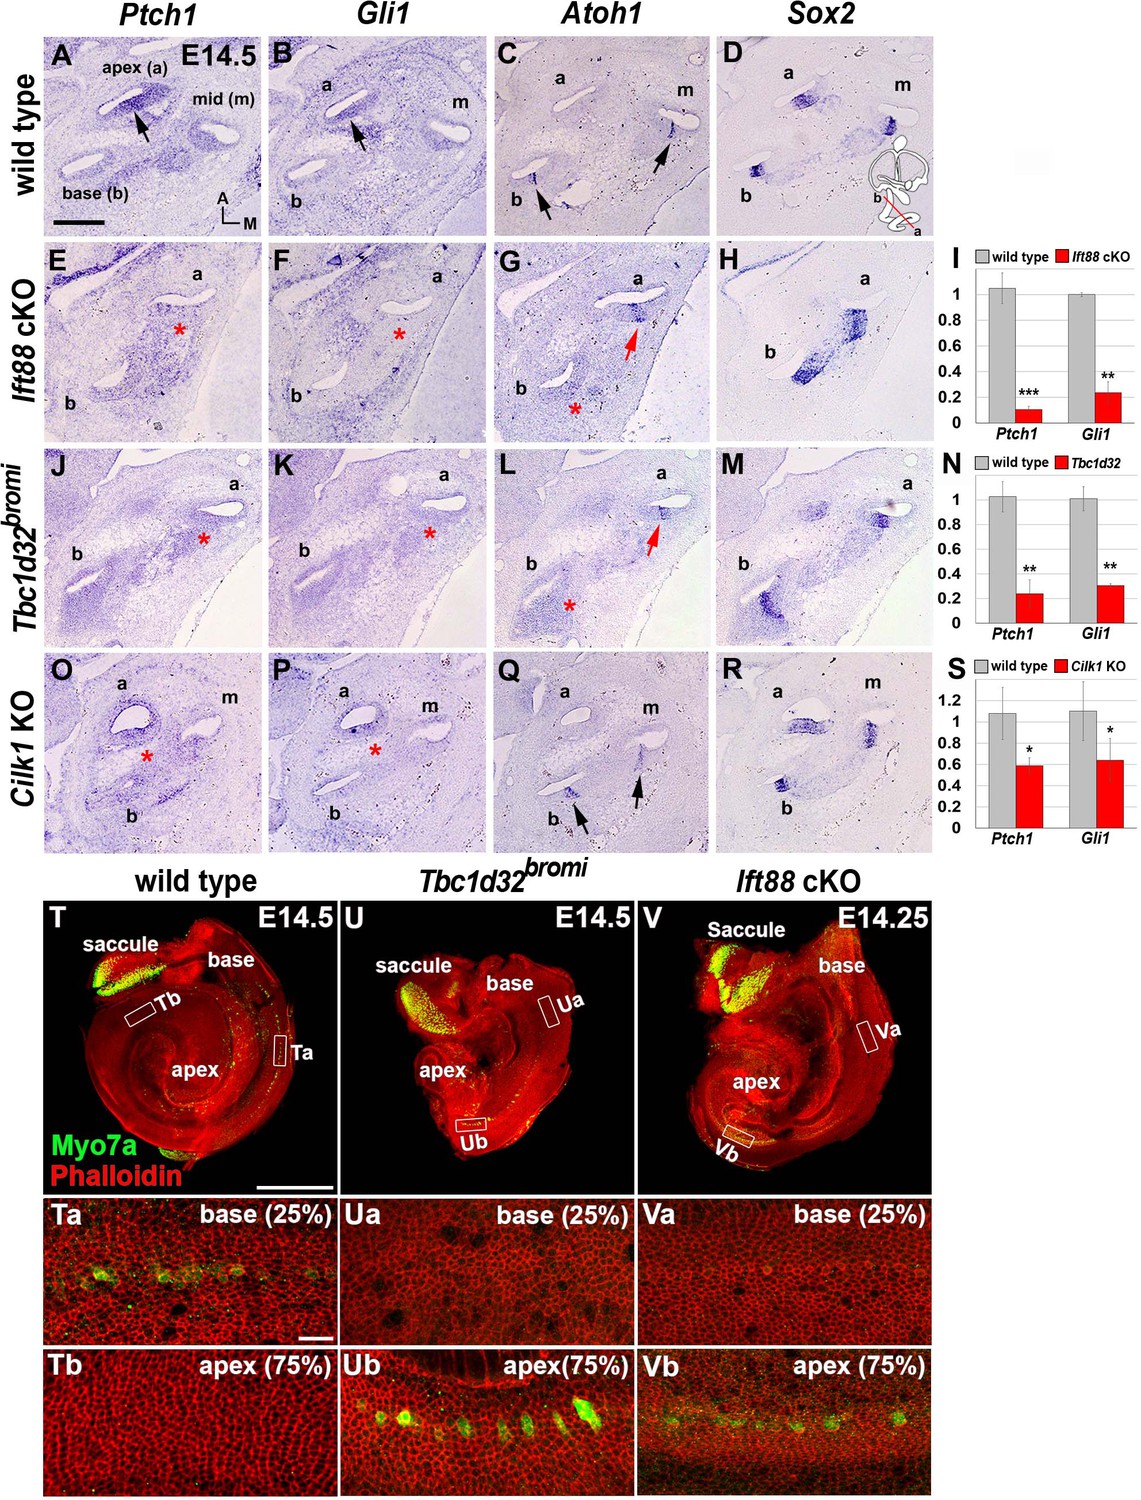
Impaired sonic hedgehog (SHH) signaling and reversed wave of HC differentiation in ciliary mutant cochleae.
(A–D) In E14.5 wild-type cochlea, SHH target genes Ptch1 and Gli1 are expressed in a graded pattern of stronger in the apex (A, B; arrows) and weaker toward the base. Atoh1 expression representing HC differentiation is observed in the base and middle cochlear turns but not in the apical turn (C; arrows), whereas Sox2 expression representing prosensory domain is observed in all cochlear turns (D). (E–H) In Ift88 cKO cochlea, Ptch1 and Gli1 are greatly downregulated (E, F; asterisks). Atoh1 is ectopically expressed in the apex (G; red arrow) but not in the base (G; red asterisk). (J–M) In Tbc1d32bromi mutant cochlea, Ptch1 and Gli1 are greatly downregulated (J, K; asterisks). Atoh1 is ectopically expressed in the apex (L; red arrow) but not in the base (L; red asterisk). (O–R) In Cilk1 KO cochlea, Ptch1 and Gli1 are downregulated (O, P; asterisks). Unlike Ift88 cKO and Tbc1d32bromi mutants, Atoh1 is expressed in the base and middle turns (Q; arrows). (I, N, S) Quantitative real-time PCR analyses to determine expression levels of Ptch1 and Gli1 in the cochleae of Ift88 cKO (n = 4), Tbc1d32bromi (n = 3), and Cilk1 KO (n = 4) mutants relative to wild-type controls (n = 3). Values and error bars represent the mean ± standard error. Statistical comparisons were made using two-tailed Student’s t-test (*p<0.05, **p<0.01). (T–V) E14.5 whole cochlear images stained with phalloidin and anti-MYO7A antibody. In wild-type controls, MYO7A immunofluorescence is detected in the basal cochlea region (T, Ta; 25% from basal end) but not in the apical region (Tb; 75% from basal end). In Tbc1d32bromi and Ift88 cKO mutants, MYO7A immunofluorescence is detected in the apical cochlear region (Ub, Vb; 75% from basal end) but not in the basal region (Ua, Va; 25% from basal end). Scale bar in A, 100 μm, also applies to B–R; scale bar in T, 500 μm, also applies to U and V; scale bar in Ta, 20 μm, also applies to Tb, Ua, Ub, Va, and Vb.
-
Figure 3—source data 1
Raw data for qRT-PCR assays shown in Figure 3.
- https://cdn.elifesciences.org/articles/56551/elife-56551-fig3-data1-v2.xlsx
Figure 3—figure supplement 1
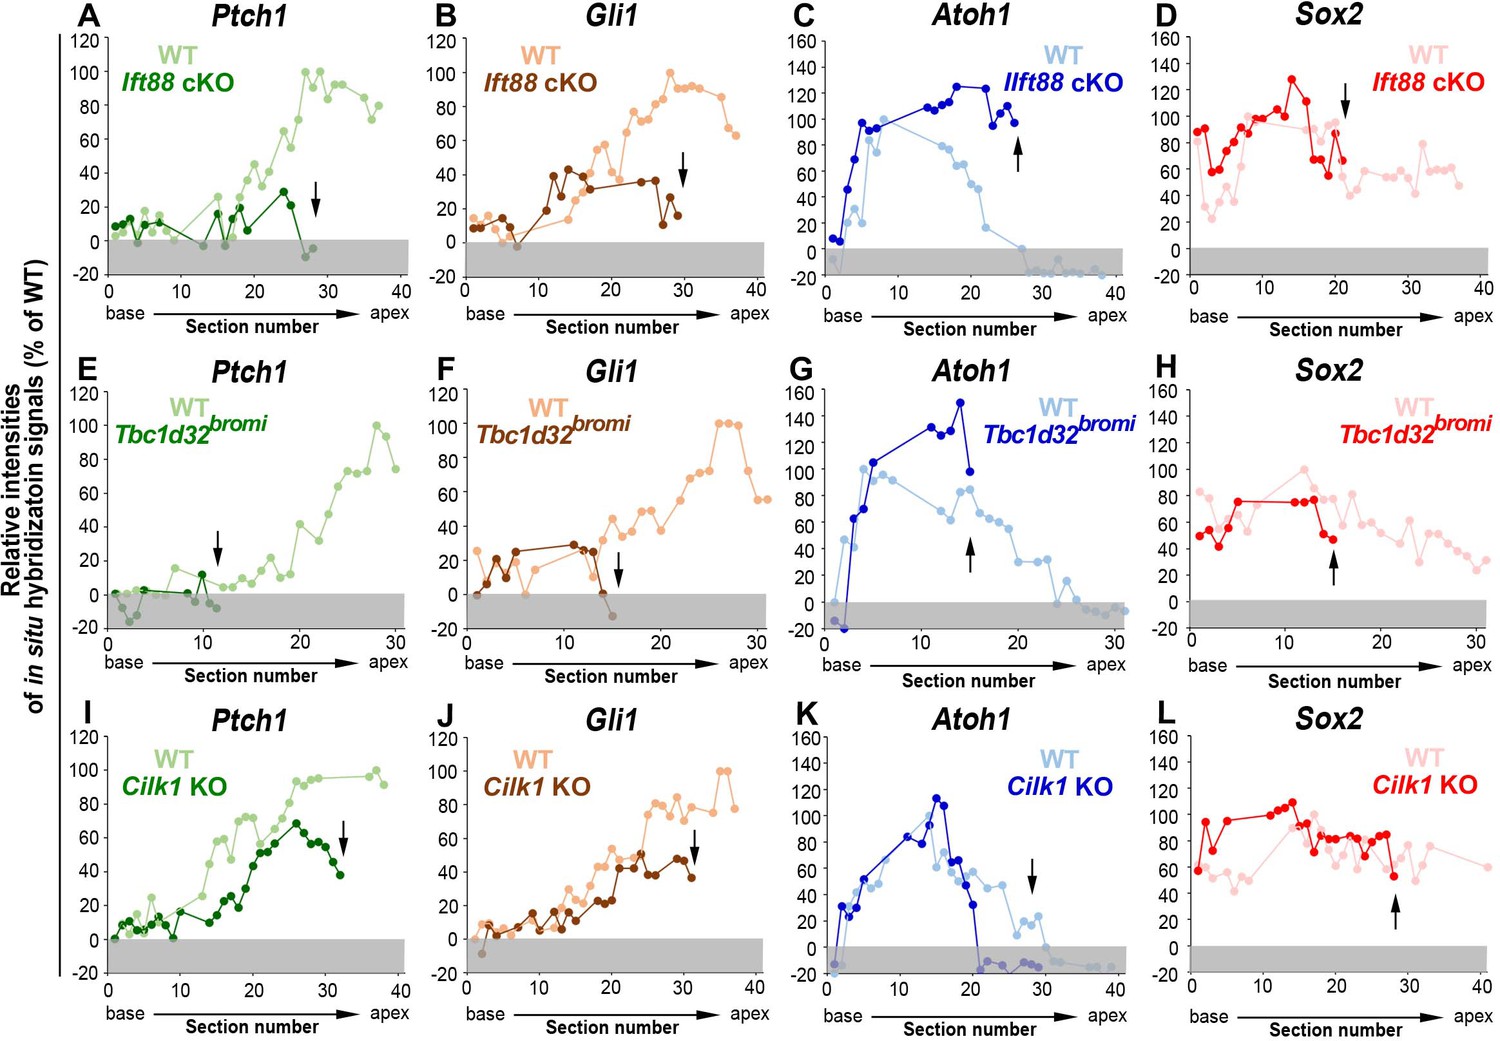
Relative signal intensity of in situ hybridization for Ptch1, Gli1, Atoh1, and Sox2 along the cochlea.
In situ hybridization signal intensity was measured from all cochlear sections of wild-type and ciliary mutant cochlea. For each gene, the strongest signal intensity among all wild-type cochlear sections was set to 100%, and the relative signal intensity (Y-axis) of each cochlear section of wild-type and ciliary mutant cochlea is plotted from the base to apex (X-axis). Arrows indicate the apical end of the shortened cochlear duct of each mutant. Gray boxes below 0% in each graph indicate background signals. Representative measurement graphs from one wild-type and one mutant cochlea for each gene are shown.
-
Figure 3—figure supplement 1—source data 1
Raw data for quantification of in situ hybridization signal intensity of Ift88cKO.
- https://cdn.elifesciences.org/articles/56551/elife-56551-fig3-figsupp1-data1-v2.xlsx
-
Figure 3—figure supplement 1—source data 2
Raw data for quantification of in situ hybridization signal intensity of Tbc1d32bromi.
- https://cdn.elifesciences.org/articles/56551/elife-56551-fig3-figsupp1-data2-v2.xlsx
-
Figure 3—figure supplement 1—source data 3
Raw data for quantification of in situ hybridization signal intensity of Cilk1KO.
- https://cdn.elifesciences.org/articles/56551/elife-56551-fig3-figsupp1-data3-v2.xlsx
Figure 4
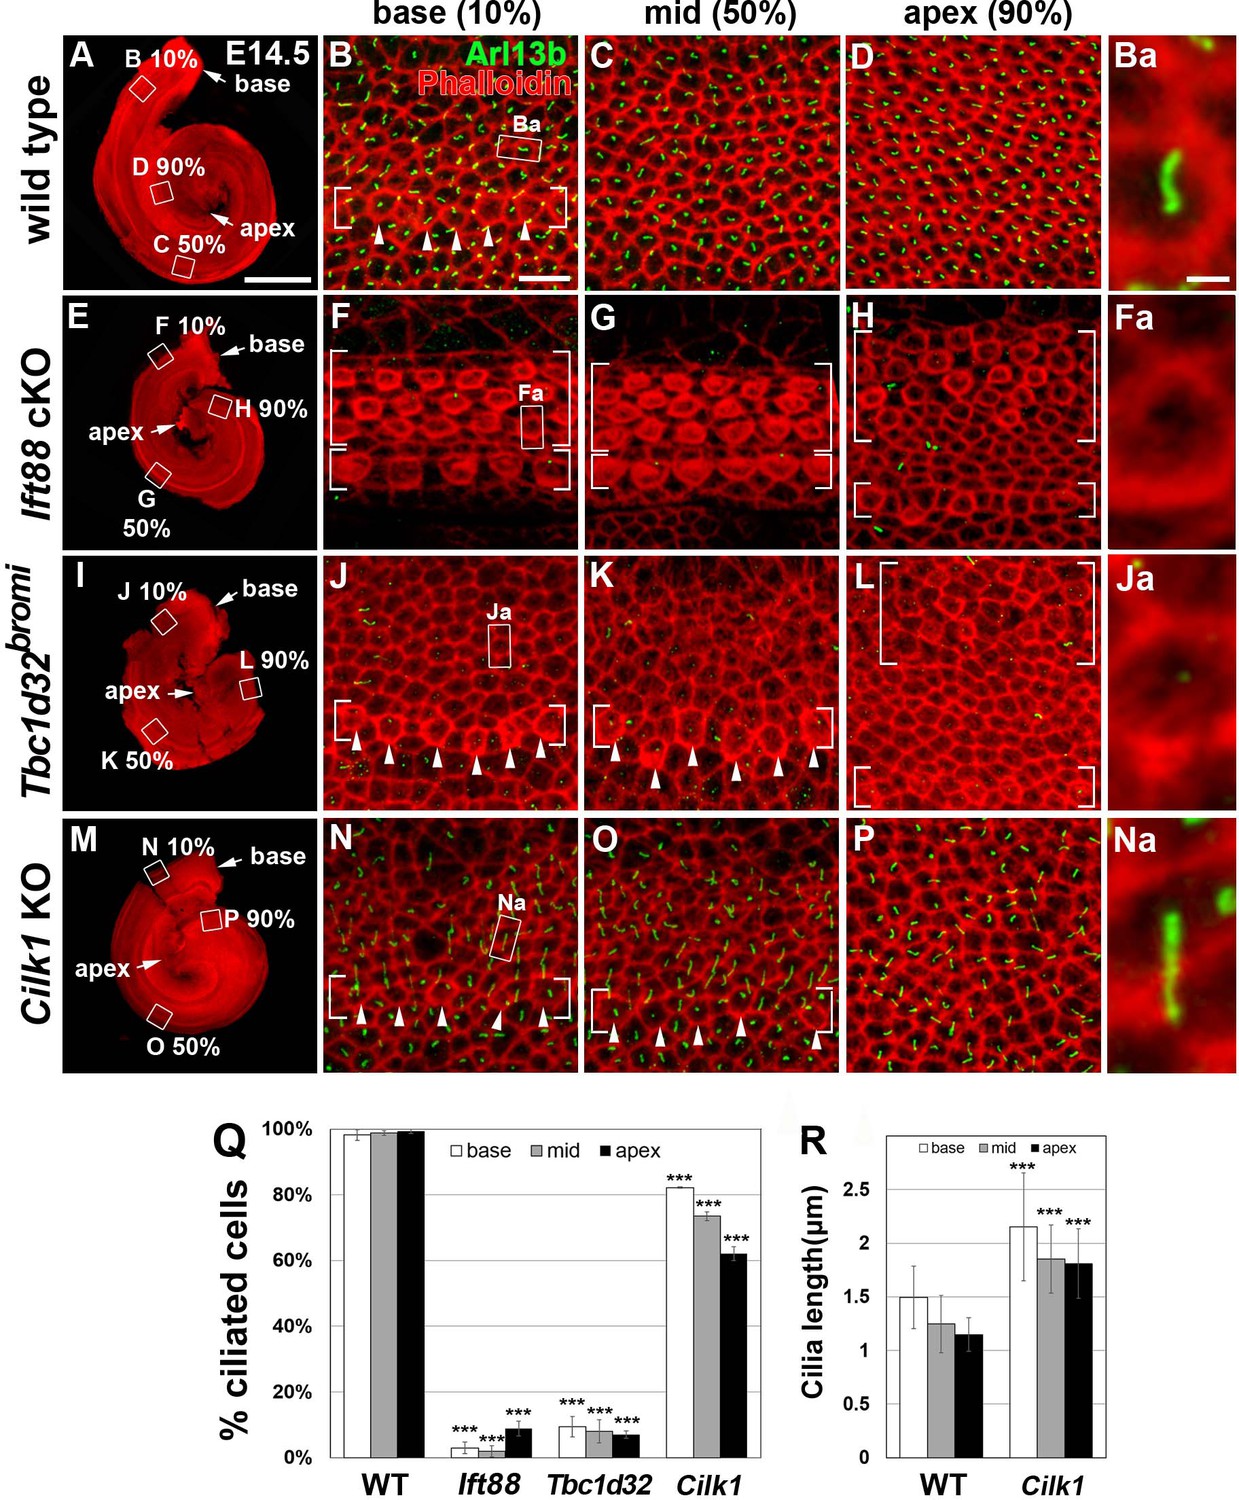
Frequency of ciliated cells in E14.75 ciliary mutant cochleae.
Immunofluorescent staining of primarily cilia with anti-ARL13B antibody (green) and cell boundaries with phalloidin (red) of 14.5 cochleae from wild-type (A–D), Ift88 cKO (E–H), Tbc1d32bromi (I–L), and Cilk1 KO (M–P) mice. Brackets indicate IHC and OHC rows, and arrowheads indicate cells with cortical actin condensation. Higher magnification images showing the lack of abnormally elongated cilia are displayed for each genotype (Ba, Fa, Ja, Na). Scale bar in A, 500 μm, also applies to E, I, and M; scale bar in B, 10 μm, also applies to C, D, F–H, J–L, and N–P. (Q) Percentages of ciliated cells are quantified in basal, middle, and apical regions of the cochlea from each genotype. The presence or absence of primary cilia is determined from at least 150 cells per region (at least 450 cells per embryo) from three different embryos for each genotype embryos. (R) Quantification of ciliary lengths measured from at least 100 cells from wild-type (n = 3) and Cilk1 KO (n = 3) embryos. Values and error bars represent the mean ± standard deviation. Statistical comparisons were made using the two-way ANOVA with Bonferroni correction for multiple comparisons (**p<0.01, ***p<0.001).
-
Figure 4—source data 1
Raw data for cilia frequency and length shown in Figure 4.
- https://cdn.elifesciences.org/articles/56551/elife-56551-fig4-data1-v2.xlsx
Figure 5 with 1 supplement
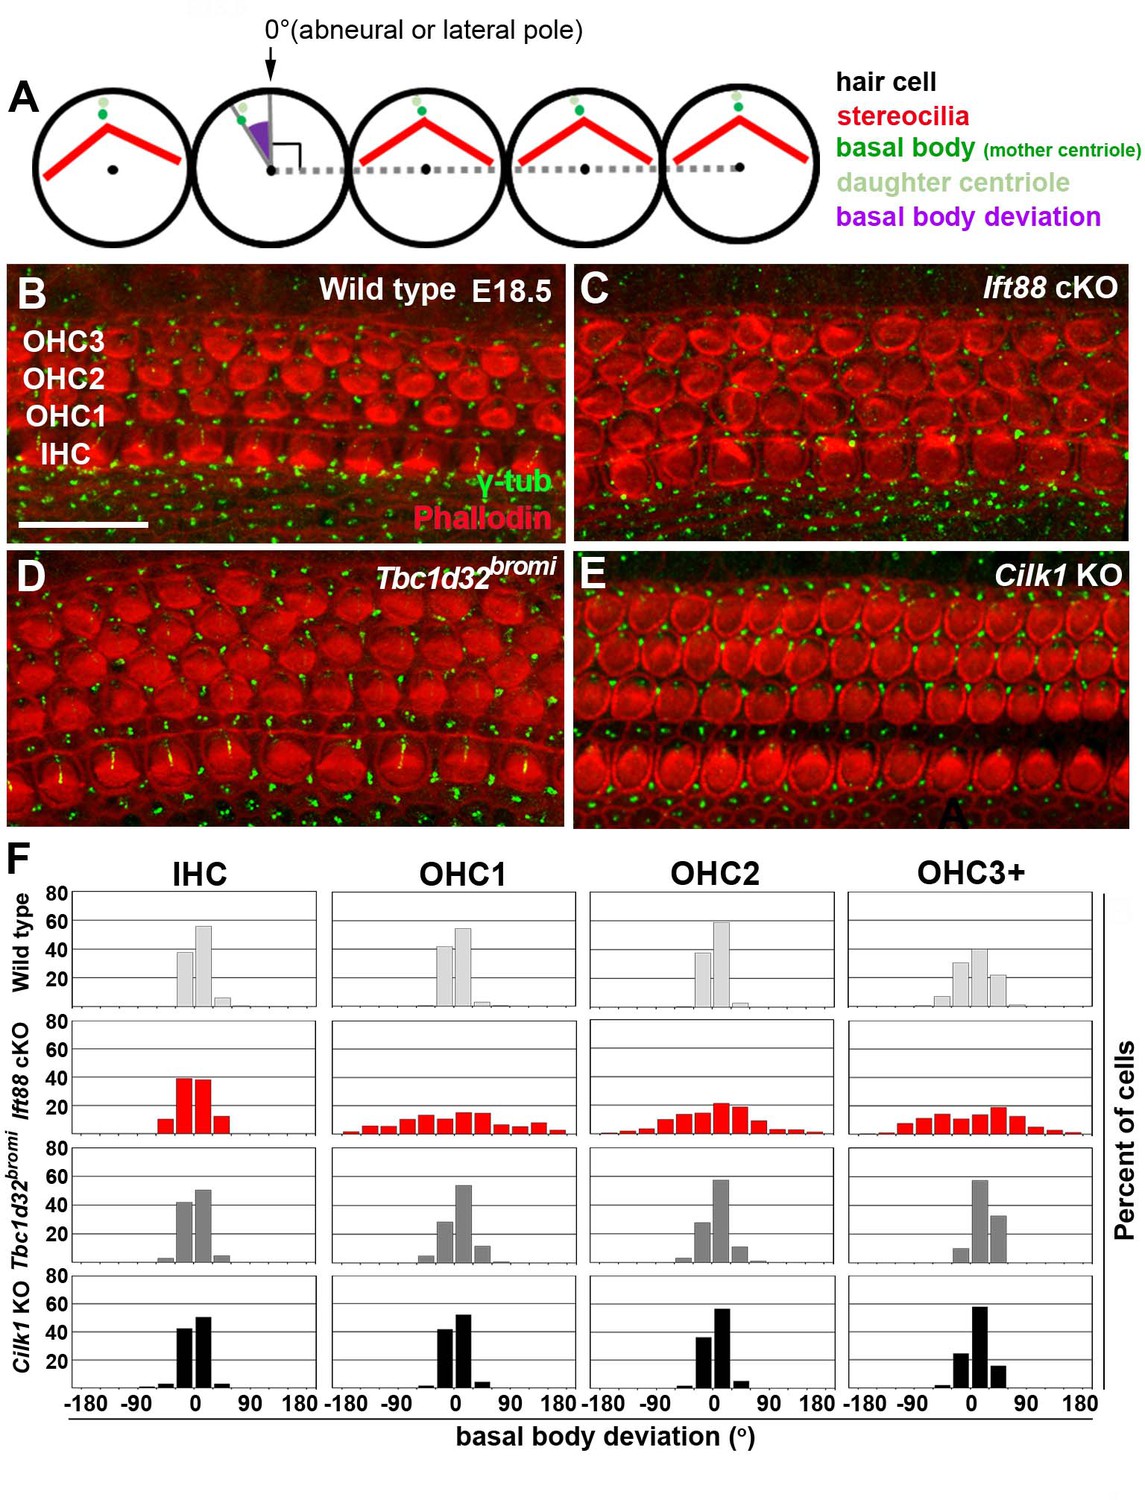
Deviation of basal body positioning in the three ciliary mutants.
(A) Diagram showing how to measure the deviation of basal body position. When the basal body is positioned at the abneural side of HCs, the angle was defined as 0°. The basal position was determined by measuring angles deviated from the abneural side. (B–E) Whole mount cochlear images of WT and the three ciliary mutants stained with phalloidin to visualize F-actin (red) and anti-γ-tubulin antibody to visualize basal bodies (green). (F) Percentages of HCs showing the degrees of basal body deviation in each genotype. Angles are measured from at least 100 hair cells per embryo from at least three different embryos for each genotype. Scale bar in B, 20 μm, also applies to C–E.
-
Figure 5—source data 1
Raw data for basal body positioning shown in Figure 5.
- https://cdn.elifesciences.org/articles/56551/elife-56551-fig5-data1-v2.xlsx
Figure 5—figure supplement 1
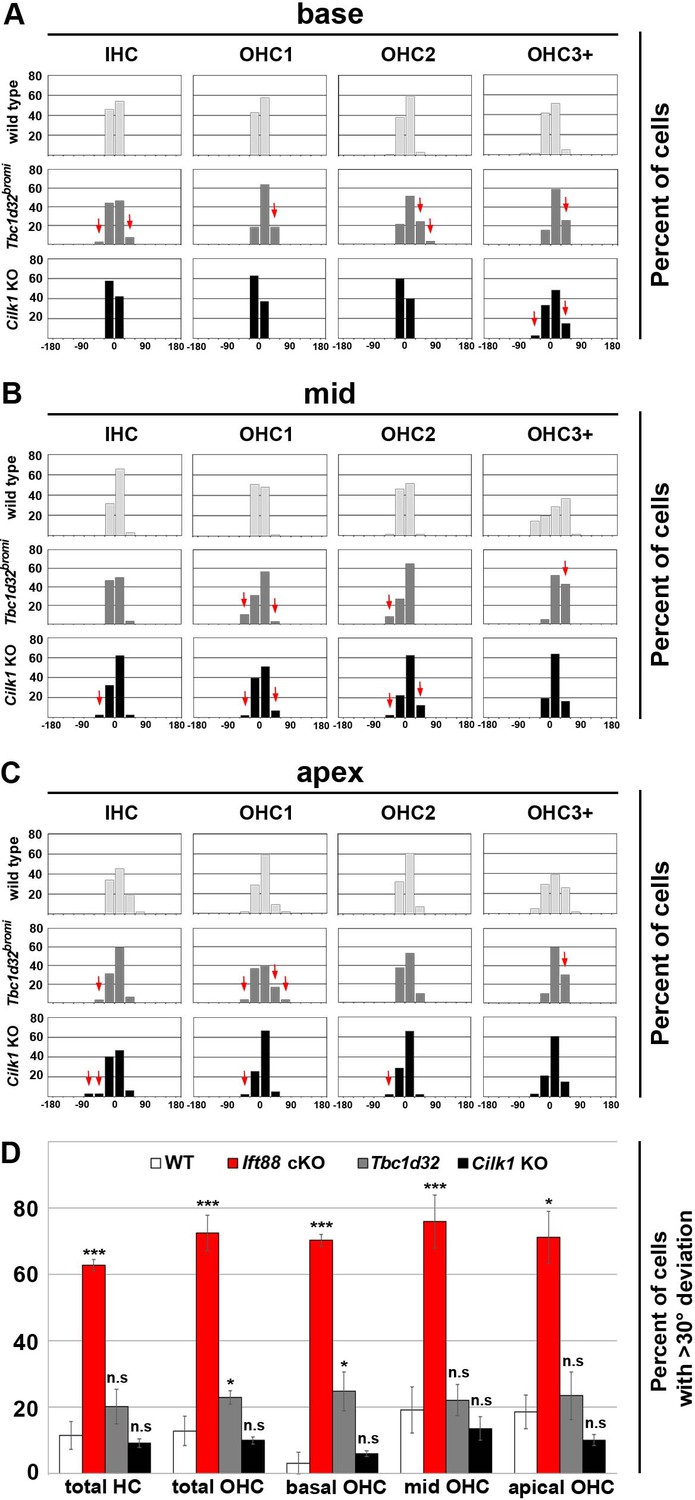
Deviation of basal body positioning in Tbc1d32bromi and Cilk1 KO mutants.
Percentages of HCs showing the angles of basal body position in the base (A), middle (B), and apex (C) of wild-type, Tbc1d32bromi, and Cilk1 KO mutant cochleae. Angles are measured from at least 30 hair cells per region from at least three different embryos for each genotype. Red arrows indicate basal body positioning deviated more than wild types. (D) The percentage of HCs with >30° deviations is significantly higher in all regions in Ift88 cKO mutants, compared to wild-type cochlea. In contrast, Cilk1 and Tbc1d32bromi mutants show no significant difference in all cochlear regions, compared to wild types, except for the basal OHCs in Tbc1d32bromi mutants. Values and error bars represent the mean ± standard deviation. Statistical significance was determined using the unpaired Student’s t-test (n.s. nonsignificant, *p<0.05, ***p<0.001).
-
Figure 5—figure supplement 1—source data 1
Raw data for graphs shown in Figure 5—figure supplement 1A-C.
- https://cdn.elifesciences.org/articles/56551/elife-56551-fig5-figsupp1-data1-v2.xlsx
-
Figure 5—figure supplement 1—source data 2
Raw data for graphs shown in Figure 5—figure supplement 1D.
- https://cdn.elifesciences.org/articles/56551/elife-56551-fig5-figsupp1-data2-v2.xlsx
Figure 6
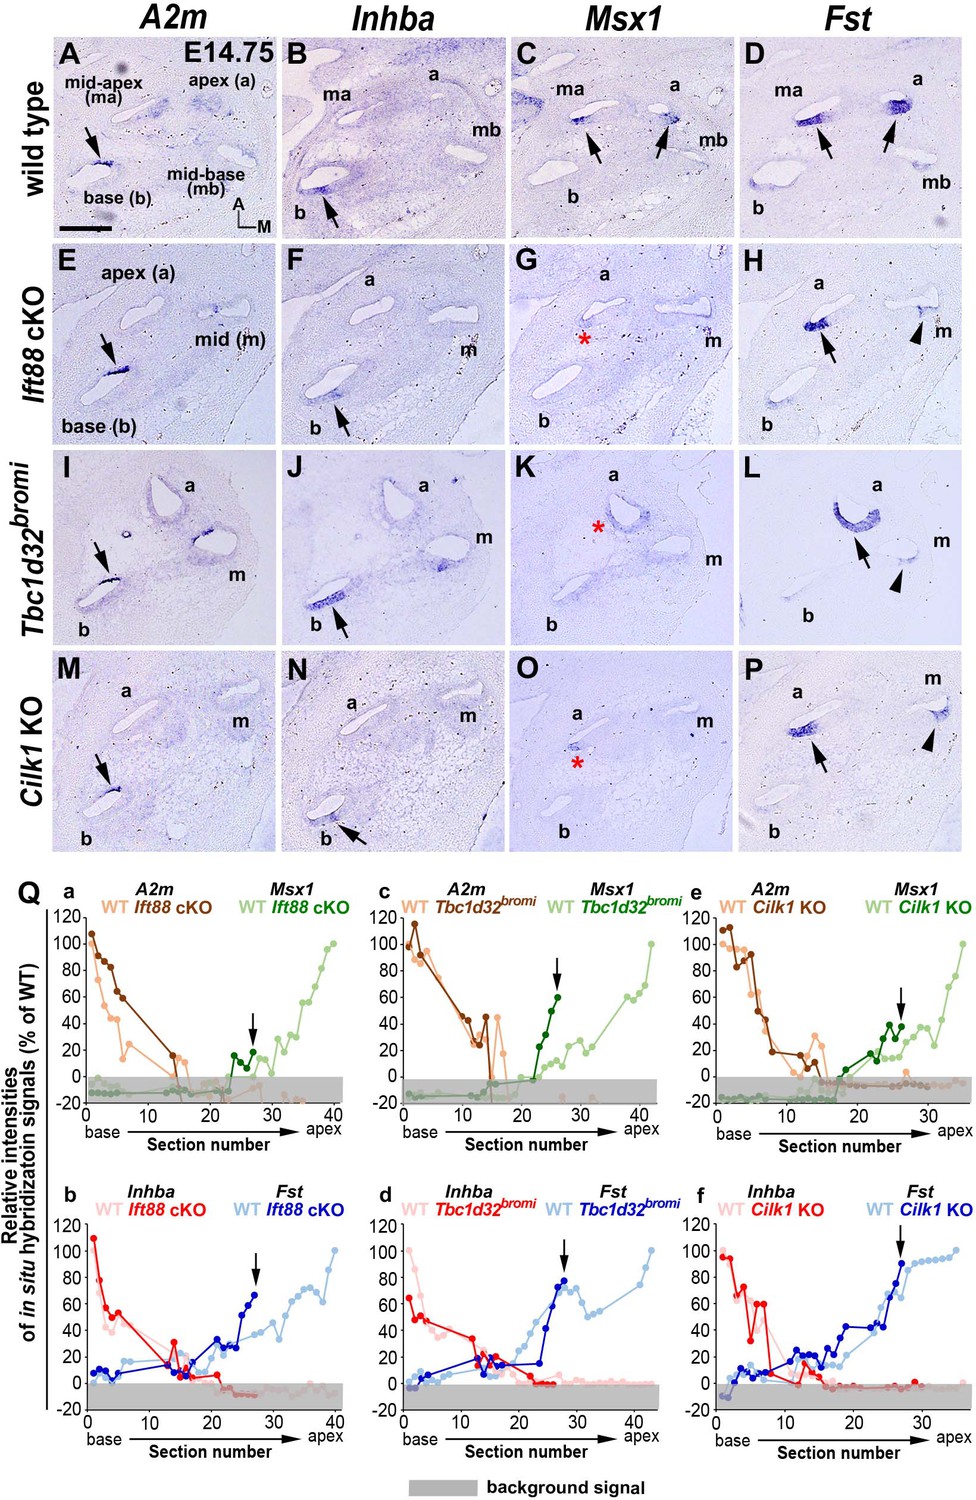
Specification of apical cochlear regional identity is compromised in ciliary mutants.
(A–P) Gene expression patterns of basal cochlear markers (A2m, Inhba) and apical cochlear markers (Msx1, Fst) in cochleae of E14.75 ciliary mutants. (A–D) In wild-type controls, A2m and Inhba are expressed in the basal cochlear turn (A, B; arrows), whereas Msx1 and Fst are expressed in the apical cochlear turns (C, D; arrows). (E–P) In Ift88 cKO, Tbc1d32bromi, and Cilk1 KO mutants, basal genes (A2m and Inhba) are generally unaffected and maintained in the basal cochlear turns (E, F, I, J, M, N; arrows). In contrast, Msx1 is greatly downregulated in apical turns (G, K, O; red asterisks), and Fst is reduced and more restricted in the apical turns (H, L, P; black arrows for strong expression and arrowheads for weak expression). (Q) Relative signal intensity of in situ hybridization for A2m, Inhba, Msx1, and Fst along the cochlear duct of wild-type and ciliary mutants. For each gene, the strongest signal intensity among all wild-type cochlear sections is set to 100%, and the relative signal intensity (Y-axis) of each cochlear section of wild-type and ciliary mutants is plotted from the base to apex (X-axis). Arrows indicate the apical end of the shortened cochlear duct of each mutant. Gray boxes below 0% in each graph indicate background signals. Representative measurement graphs from one wild-type and one mutant cochlea for each gene are shown. Scale bar in A, 100 μm, also applies to B–P.
-
Figure 6—source data 1
Raw data for quantification of in situ hybridization signal intensity shown in Figure 6Q.
- https://cdn.elifesciences.org/articles/56551/elife-56551-fig6-data1-v2.xlsx
Figure 7 with 3 supplements
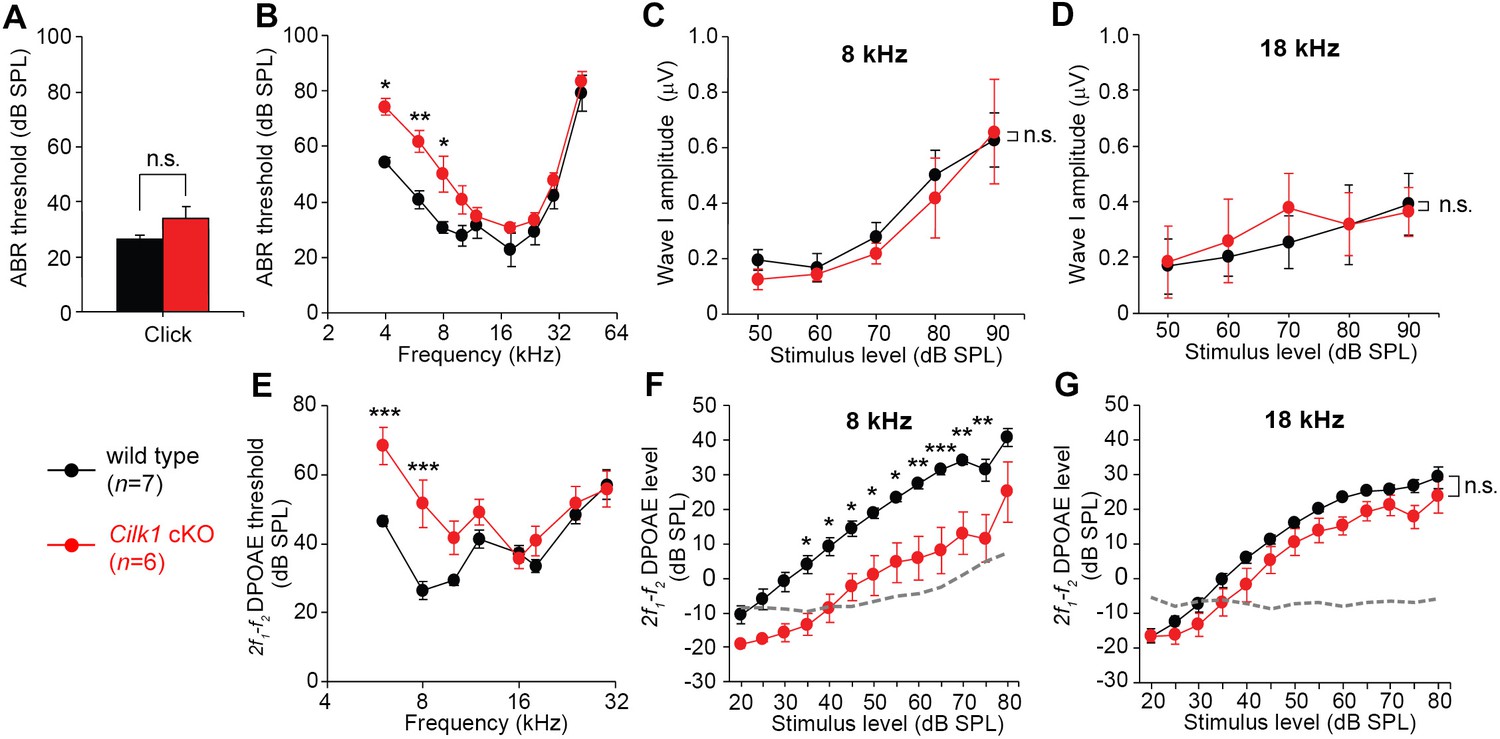
Low frequency hearing loss in 4-week-old Cilk1 cKO mutants.
(A–D) Auditory brainstem response (ABR) thresholds of wild-type and Cilk1 cKO mice are not significantly different in response to click stimuli (A) but are significantly increased in low frequency pure tone stimuli at 4, 6, and 8 kHz but not in higher frequencies in Cilk1 cKO mice (B). Input/output function analyses of wave I amplitudes show no significant differences between wild-type and Cilk1 cKO mice at 8 and 18 kHz (C, D). (E–G) 2f1-f2 distortion product otoacoustic emission (DPOAE) thresholds are significantly increased in low frequencies at 6 and 8 kHz but not in higher frequencies in Cilk1 cKO mice (E). DPOAE input/output function analyses of 2f1-f2 DPOAE levels show a significant reduction at 8 kHz (F) but not at 18 kHz (G) in Cilk1 cKO mice. Values and error bars are mean ± standard error. Statistical comparisons were determined using the two-way ANOVA with Bonferroni correction for multiple comparisons (n.s., non-significant, *p<0.05, **p<0.01, ***p<0.001).
-
Figure 7—source data 1
Raw data for ABR and DPOAE analyses shown in Figure 7.
- https://cdn.elifesciences.org/articles/56551/elife-56551-fig7-data1-v2.xlsx
Figure 7—figure supplement 1
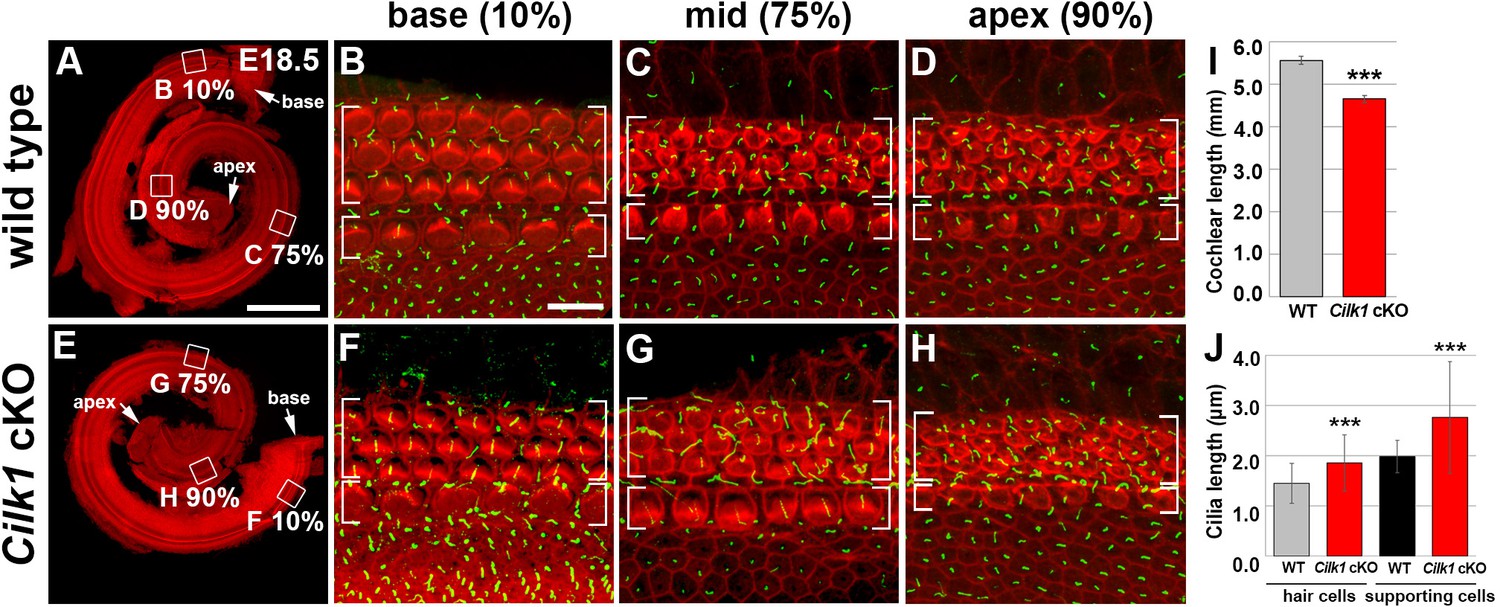
Cochlear phenotypes of Cilk1 cKO mutants at E18.5.
Stereocilia and primary cilia are visualized by staining with phalloidin (red fluorescence) and immunostaining with anti-ARL13B antibody (green fluorescence). In Cilk1 cKO mutants, cochlea exhibits slight shortening (E, I), and both kinocilia in HCs and primary cilia in supporting cells (SCs) are abnormally elongated (F–H, J). Values and error bars (I, J) represent the mean ± standard deviation. Statistical significance was determined using the unpaired Student’s t-test (***p<0.001).
-
Figure 7—figure supplement 1—source data 1
Raw data for quantification of cochlear length and cilia length shown in Figure 7—figure supplement 1.
- https://cdn.elifesciences.org/articles/56551/elife-56551-fig7-figsupp1-data1-v2.xlsx
Figure 7—figure supplement 2
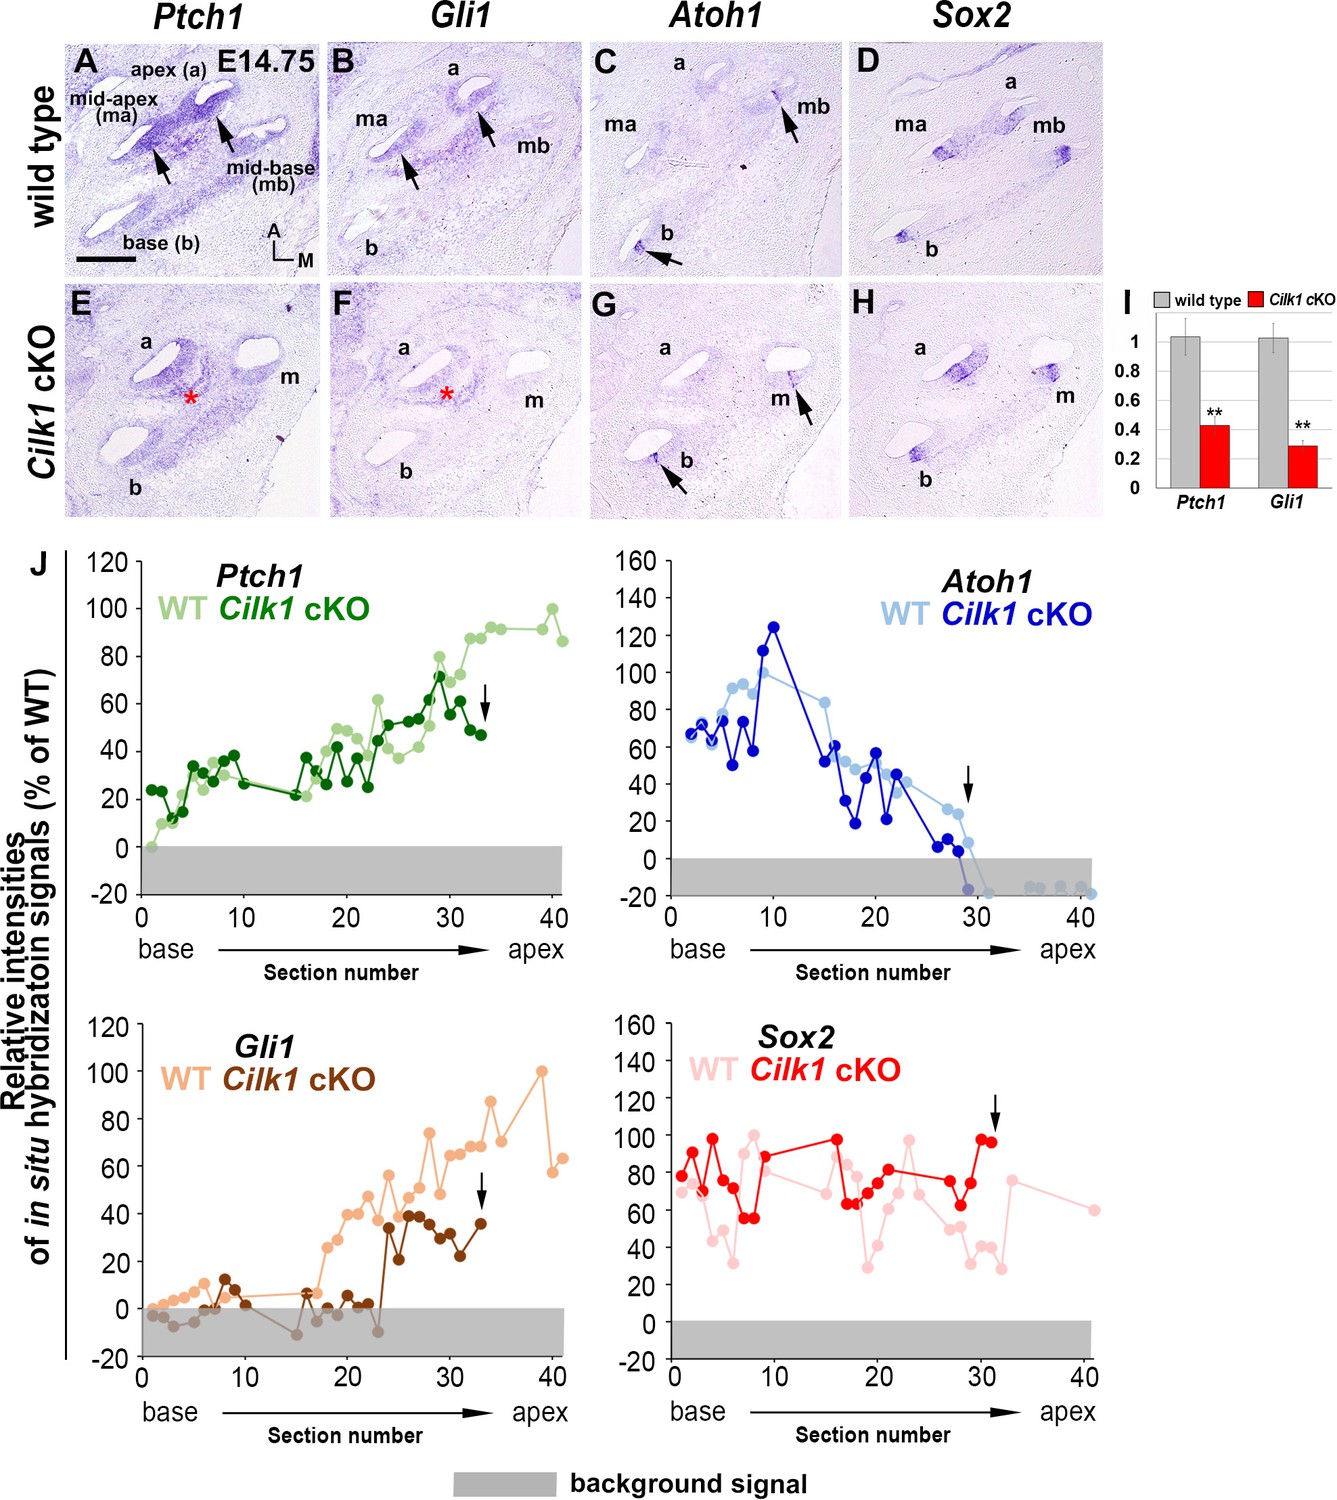
Sonic hedgehog (SHH) signaling is impaired in Cilk1 cKO mutant cochlea.
SHH target genes Ptch1 and Gli1, expressed in a graded pattern in E14.5 wild-type cochlea (A, B), are downregulated in Cilk1 cKO cochlea (E, F). Atoh1 and Sox2 expression patterns are similar between wild-type and Cilk1 cKO mutant cochlea (C, D, G, H). (I) qPCR confirms a significant reduction in Ptch1 and Gli1 in Cilk1 cKO cochlea. Values and error bars (I) represent the mean ± standard error. Statistical significance was determined using the unpaired Student’s t-test (n = 6, **p<0.01, ***p<0.0001). (J) Relative signal intensities of in situ hybridization for Ptch1, Gli1, Atoh1, and Sox2 along the cochlea of wild-type and Cilk1 cKO mutants. Arrows indicate the apical end of Cilk1 cKO cochlea. Gray boxes below 0% in each graph indicate background signals. Representative measurement graphs from one wild-type and one mutant cochlea for each gene are shown. Scale bar in A, 100 μm, also applies to B–H.
-
Figure 7—figure supplement 2—source data 1
Raw data for qRT-PCR assays and quantification of in situ hybridization signal intensity shown in Figure 7—figure supplement 2.
- https://cdn.elifesciences.org/articles/56551/elife-56551-fig7-figsupp2-data1-v2.xlsx
Figure 7—figure supplement 3
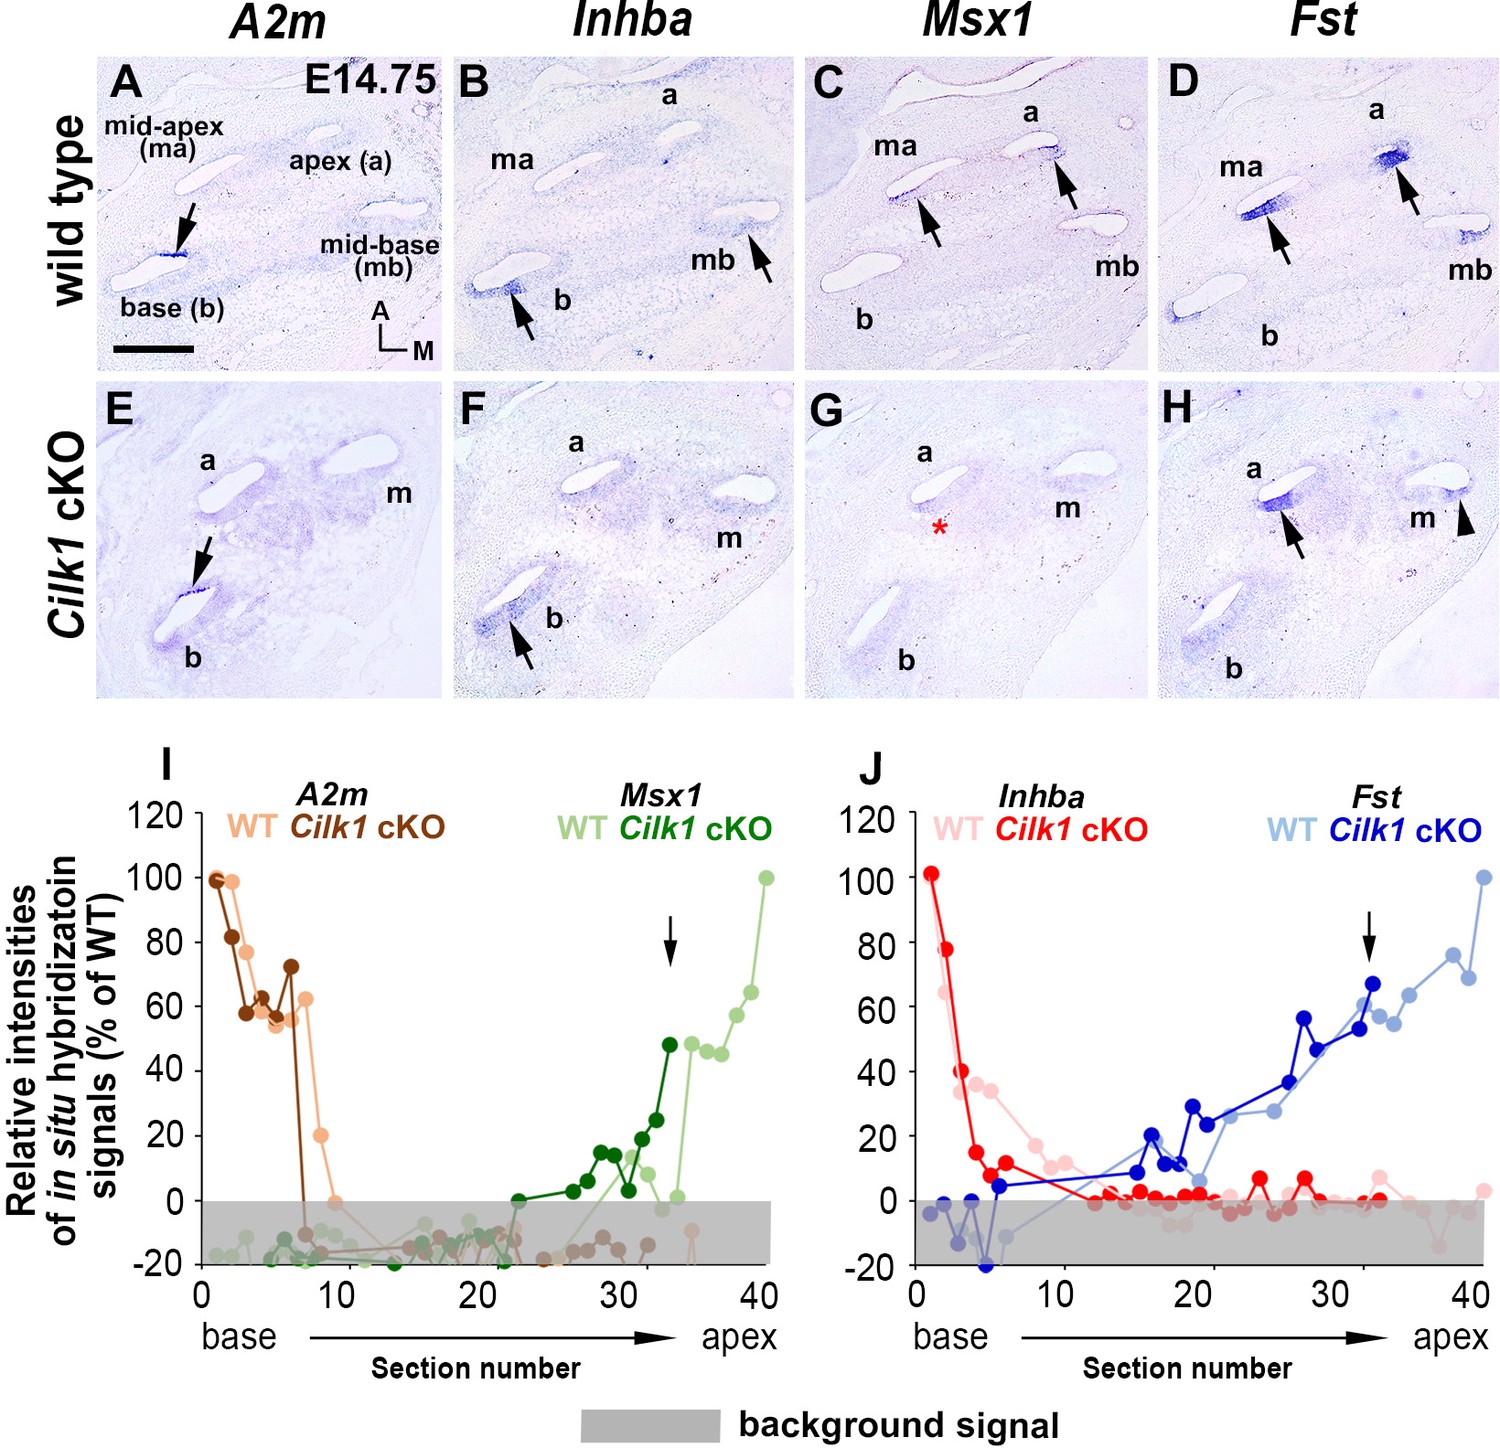
Specification of apical cochlear identity is impaired in Cilk1 cKO mutants.
In Cilk1 cKO mutants, expressions of basal genes (A2m and Inhba) are generally unaffected and maintained in the basal cochlear turns (A, B, E, F; arrows). In contrast, Msx1 expression is severely downregulated in apical turns (C, G; red asterisk), and Fst expression is reduced and more restricted in the apical turn (D, H; black arrows for strong expression and arrowheads for weak expression). (I, J) Relative signal intensity of in situ hybridization for A2m, Inhba, Msx1, and Fst along the ducts of wild-type and Cilk1 cKO mutant cochlea. Scale bar in A, 100 μm, also applies to B–H.
-
Figure 7—figure supplement 3—source data 1
Raw data for quantification of in situ hybridization signal intensity shown in Figure 7—figure supplement 3.
- https://cdn.elifesciences.org/articles/56551/elife-56551-fig7-figsupp3-data1-v2.xlsx
Figure 8 with 1 supplement
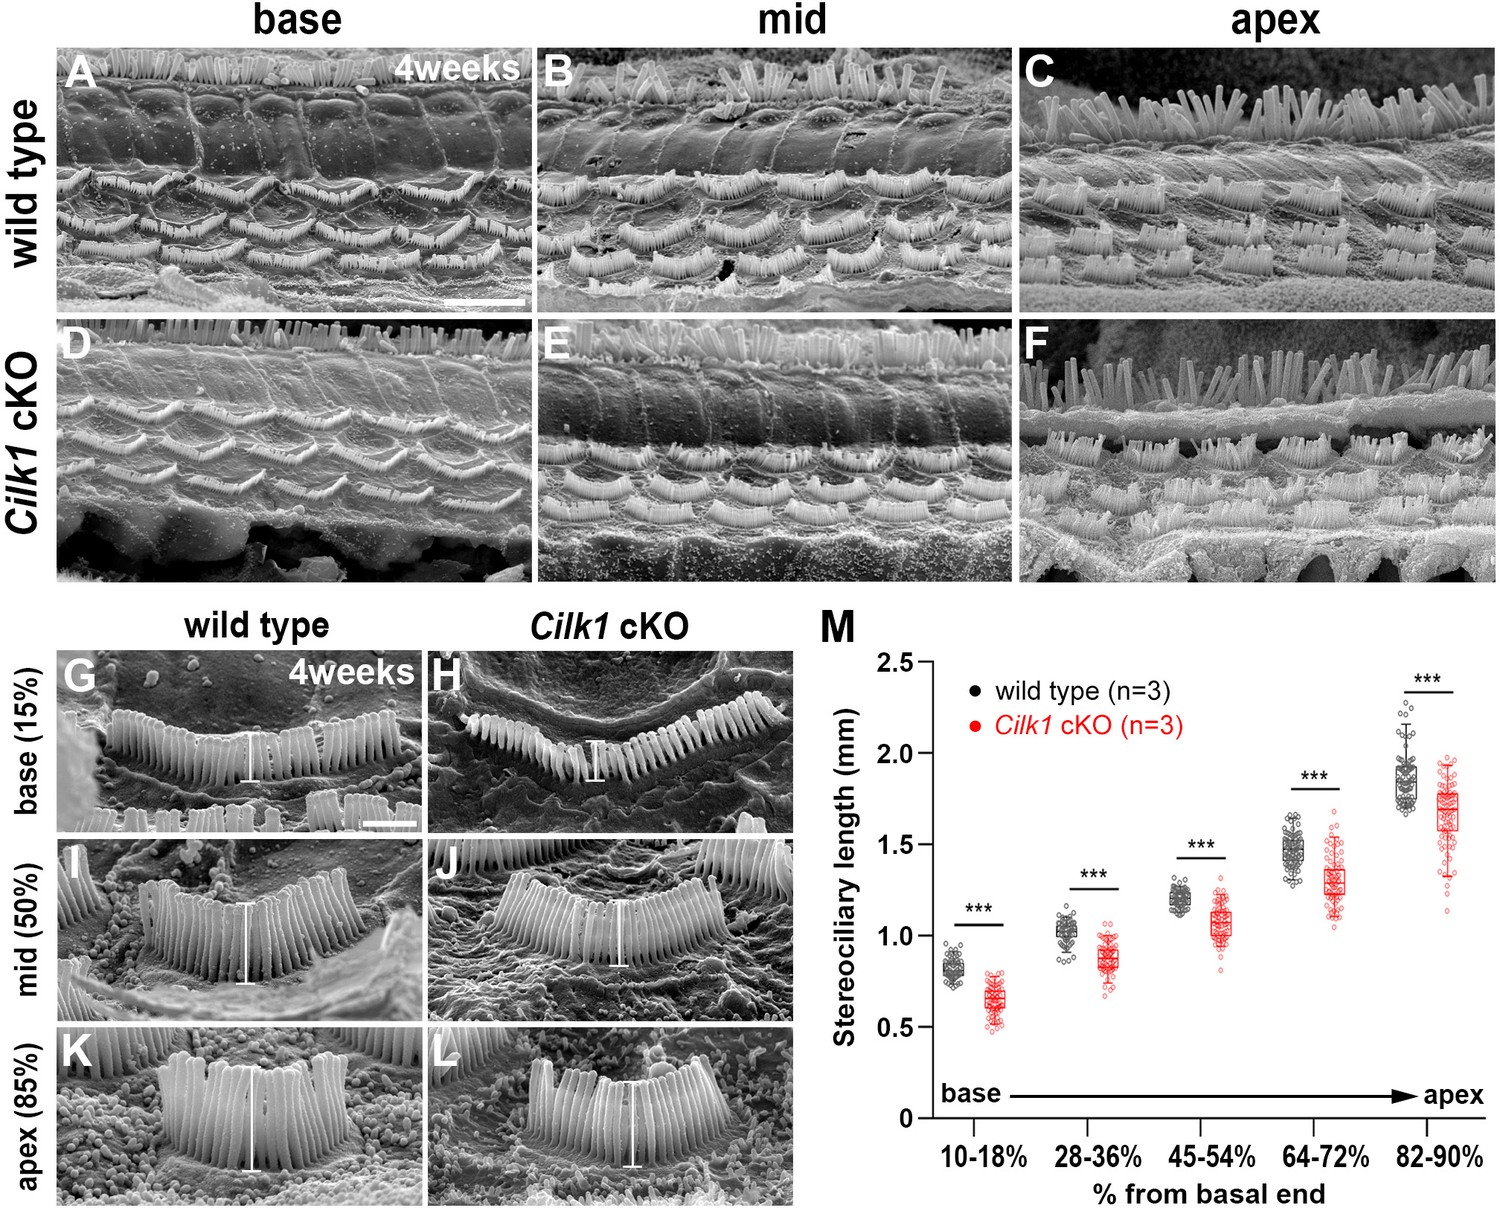
Decreased stereocilia lengths in 4-week-old Cilk1 cKO mutants.
(A–L) Scanning electron micrographs of the organ of Corti of wild-type and Cilk1 cKO mutants. There is no obvious HC degeneration in the base, middle, and apex of the cochlea (A–F). Higher magnification images show that OHC stereociliary lengths are decreased in the basal, middle, and apical cochlea of Cilk1 cKO mutants (G–L; brackets). (M) Quantification of stereociliary lengths of OHCs demonstrate significant decreases along the cochlear duct position in Cilk1 cKO mutants. Stereociliary lengths were measured from at least 30 OHCs per each region from three animals per each genotype. Data are displayed as box plots. Individual dots represent individual data values, the boxes represent a range of 25–75%, the horizontal lines in the boxes represent the median, the whiskers represent the 5% and 95% values, and the points outside the whiskers represent outliers. Scale bar in A, 5 μm, also applies to B–F; scale bar in G, 1 μm, also applies to H–L. ***p<0.001, as determined by two-way ANOVA with Bonferroni correction for multiple comparisons.
-
Figure 8—source data 1
Raw data for quantification of stereociliary length shown in Figure 8.
- https://cdn.elifesciences.org/articles/56551/elife-56551-fig8-data1-v2.xlsx
Figure 8—figure supplement 1
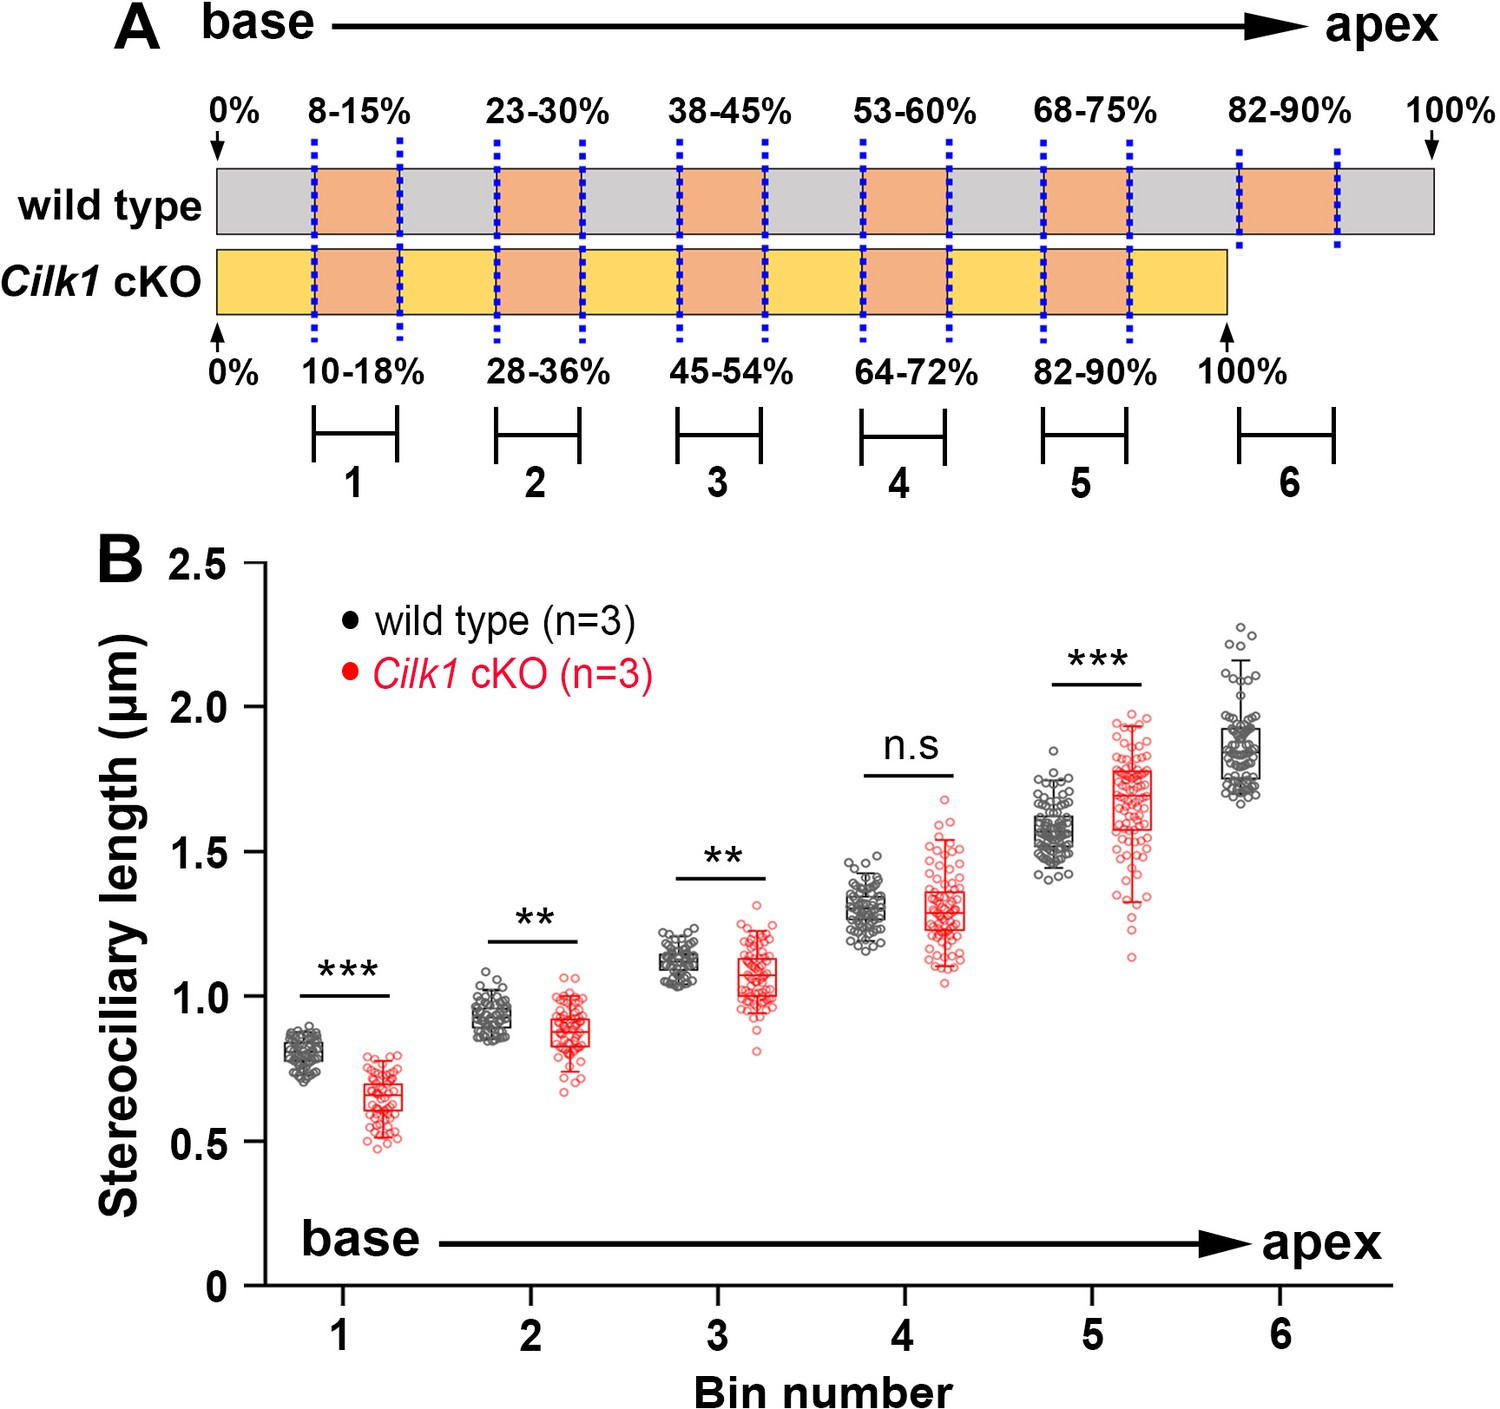
Comparison of OHC stereociliary lengths at the same distance from the basal end of wild-type and Cilk1 cKO mutant cochlea.
(A) Schematic diagram showing the relative lengths of wild-type and Cilk1 cKO mutant cochlea. Numbers 1 through 6 represent locations at the same absolute distance from the basal end in wild-type and Cilk1 cKO mutant cochlea. Since the cochlear length of Cilk1 cKO mutant is shorter than that of wild-type controls, the apical region (82–90%) of Cilk1 cKO mutants corresponds to the mid-apical region (68–75%) of wild-type controls. (B) Quantification of stereociliary lengths of OHCs located at the same distance from the basal end. Stereociliary length was measured from a minimum of 30 OHCs per each region from three animals per each genotype. The data are presented as box plots. Individual dots represent individual data values, boxes represent the 25–75% range, horizontal lines in boxes represent median values, whiskers represent 5% and 95% values, and points outside the whiskers represent outliers. Statistical significance was determined by two-way ANOVA with Bonferroni correction for multiple comparisons (n.s. nonsignificant, **p<0.01, ***p<0.001).
-
Figure 8—figure supplement 1—source data 1
Raw data for stereociliary length shown in Figure 8—figure supplement 1.
- https://cdn.elifesciences.org/articles/56551/elife-56551-fig8-figsupp1-data1-v2.xlsx
Tables
Table 1
Comparisons of cochlear phenotypes of ciliary mutants and sonic hedgehog (SHH) pathway mutants*.
| Impaired SHH signaling | Defective primary cilia | |||||||
|---|---|---|---|---|---|---|---|---|
| Loss of SHH from both midline and ganglion sources1 | Defective GLI2 | Loss of SHH from ganglion source3 | Loss of SMO after cochlear specification4 | All combined | No cilia (Ift88 cKO) | Abnormal morphology (Tbc1d32bromi) | Abnormal length (Cilk1 KO) | |
| Complete loss of cochlea | +++ | − | − | − | +++ | − | − | − |
| Shortened cochlea | n.a. | +++ | +++ | + | +++ | +++ | +++ | + |
| Reduced HC number | n.a. | n.d. | +++ | + | +++ | +++ | +++ | + |
| Premature HC differentiation | n.a. | n.d. | +++ | + | +++ | +++ | +++ | + |
| Multiple rows of HCs in the apex | n.a. | +++ | +++ | − | +++ | +++ | +++ | − |
| Ectopic vestibule-like HCs | n.a. | + | n.d. | n.d. | + | + | + | − |
| Reversed HC differentiation wave | n.a. | n.d. | +++ | − | +++ | +++ | +++ | |
| Defective apical identity | n.a. | + | − | n.d. | + | + | + | + |
| Low-frequency hearing loss | n.a. | +# | n.d. | + | + | n.a. | n.a. | + |
| Impaired SHH signaling | +++ | +++ | +++ | n.d. | +++ | +++ | +++ | ++ |
| Defective hair bundle polarity | n.a. | − | − | − | − | +++ | − | − |
-
*This table summarizes cochlear phenotypes of ciliary mutant mice (this study) and SHH signaling mutant mice (previous reports).
+sign indicates the presence of defective phenotype. ‘+++” indicates that the phenotype is severe, ‘++” intermediate, and ‘+” mild.
-
−sign indicates the absence of defective phenotypes.
n.a. not applicable due to embryonic lethality or structural loss.
-
n.d. not determined.
1(Bok et al., 2007; Brown and Epstein, 2011; Riccomagno et al., 2002).
-
#Hearing data are obtained from human patients with Pallister–Hall syndrome (Driver et al., 2008).
Table 2
Cochlear phenotypes of ciliary mutant mice*.
| Mutants | Primary cilia (kinocilia) in the cochlea | Impaired SHH signaling | Shortened cochlear duct | Multiple rows of HCs | Hair bundle polarity defect | Hair bundle morphology defect | Core PCP protein localization defect | Hearing loss (HL) | Refs. | |
|---|---|---|---|---|---|---|---|---|---|---|
| Ciliopathy models with impaired SHH signaling | Ift88 | Absent | ++ | ++ | ++ | ++ | ++ | − (Vangl2/Fzd3) | n.a. | This study and Jones et al., 2008; May-Simera et al., 2015 |
| Kif3a | Absent | ++# | ++ | ++ | ++ | ++ | − (Dvl2/Fzd3) | n.a. | Huangfu et al., 2003; Sipe and Lu, 2011 | |
| Ift20 | Absent | n.d. | ++ | ++ | ++ | ++ | + (Vangl2) | n.a. | May-Simera et al., 2015 | |
| Ift27 | Present | ++# | + | ++ | − | + | − (Vangl2) | n.a. | Eguether et al., 2018; May-Simera et al., 2015 | |
| Cilk1 (Ick) | Elongated | + | + | − | +/- | +/- | − (Vangl2) | HL (1 month) low freq. | This study and Okamoto et al., 2017 | |
| Tbc1d32 (bromi) | Malformed(HC); absent(SC) | ++ | ++ | ++ | +/- | +/- | n.d. | n.a. | This study | |
| Mks1 | Present | ++# | n.d. | n.d. | + | + | n.d. | n.d. | Cui et al., 2011 Weatherbee et al., 2009 | |
| Cep290 (Nphp6) | Elongated | ++# | n.d. | n.d. | − | − | n.d. | HL (3–4 months) all freq. | Hynes et al., 2014; Rachel et al., 2012 | |
| Ciliopathy models with normal SHH signaling (or unknown) | Alms1 | Present | −# | n.d. | n.d. | ++ | + | n.d. | Normal hearing (1 month); HL (6–8 month) | Chen et al., 2017; Collin et al., 2005; Jagger et al., 2011 |
| Gmap210 (Trip11) | Present | −# | − | − | − | + | − (Vangl2) | n.d. | May-Simera et al., 2015; Smits et al., 2010 | |
| Tmem67 (Mks) | Present(HC); absent(SC) | −# | − | − | ++ | ++ | − (Vangl2) | n.d. | Abdelhamed et al., 2015; Lee et al., 2017; Leightner et al., 2013 | |
| Ift25 (Hspb11) | Present | +(E9.5); −(E10.5)# | − | − | − | − | − (Vangl2) | n.a. | Keady et al., 2012; May-Simera et al., 2015 | |
| Bbs8 (Ttc8) | Present | n.d. | − | n.d. | ++ | ++ | + (Vangl2/Gαi3) | Normal hearing (2 months) | May-Simera et al., 2015 | |
| Bbs4 | n.d. | n.d. | n.d. | n.d. | + | + | n.d. | n.d. | Ross et al., 2005 | |
| Bbs6 (Mkks) | Present or absent | n.d. | n.d. | n.d. | + | + | − (Vangl2); + (Gαi3) | HL (3 months) in ~50% tested | Ezan et al., 2013; May-Simera et al., 2015; Rachel et al., 2012; Ross et al., 2005 |
-
*This table summarizes cochlear phenotypes of ciliary mutant mice from this and previous studies.
+sign indicates the presence of defective phenotype. ‘+” and ‘++” indicate mild and severe phenotypes, respectively.
-
−sign indicates the absence of defective phenotype.
n.a. not applicable due to embryonic lethality.
-
n.d. not determined.
#SHH signaling data are obtained from other tissues (e.g. neural tube, limb) or in vitro assay systems.
Key resources table
| Reagent type (species) or resource | Designation | Source or reference | Identifiers | Additional information |
|---|---|---|---|---|
| Strain, strain background (M. musculus) | Ift88fl (B6.129P2-Ift88tm1Bky/J) | The Jackson Laboratory | 022409; RRID:IMSR_JAX:022409 | |
| Genetic reagent (M. musculus) | Cilk1tm1a/tm1a | Moon et al., 2014 | ||
| Genetic reagent (M. musculus) | Tbc1d32bromi | Ko et al., 2010 | ||
| Genetic reagent (M. musculus) | Pax2-Cre (Tg(Pax2-cre)1Akg/Mmnc) | MMRRC | 10569; RRID:MMRRC_010569-UNC | |
| Genetic reagent (M. musculus) | Foxg1-Cre (129(Cg)-Foxg1tm1(cre)Skm/J) | The Jackson Laboratory | 004337; RRID:IMSR_JAX:004337 | |
| Genetic reagent (M. musculus) | B6;SJL-Tg(ACTFLPe)9205Dym/J | The Jackson Laboratory | 003800; RRID:IMSR_JAX:003800 | |
| Antibody | Anti-ARL13B (Rabbit polyclonal) | This paper | 1:3000 | |
| Antibody | Anti-MyoVIIa (Rabbit polyclonal) | Proteus Biosciences | 25–6790; RRID:AB_10015251 | 1:200 |
| Antibody | Anti-Frizzled6 (Goat polyclonal) | R and D Systems | AF1526; RRID:AB_354842 | 1:200 |
| Antibody | Anti-γ tubulin (Rabbit polyclonal) | Sigma Aldrich | T3195; RRID:AB_261651 | 1:500 |
| Antibody | Anti-Sox2 (Goat polyclonal) | Santa Cruz Biotech | sc-17320; RRID:AB_2286684 | 1:500 |
| F-actin probe | Alexa Fluor568 Phalloidin | Invitrogen | A12380 | 1:80 |
| Chemical compound, drug | DAPI | Invitrogen | D1306; RRID:AB_2629482 | 1 µg/mL |
| Recombinant DNA reagent | Pax2 (Plasmid) | Morsli et al., 1999 | In situ hybridization probe | pBluescript II (KS) backbone |
| Recombinant DNA reagent | Otx2 (Plasmid) | Morsli et al., 1999 | In situ hybridization probe | pBluescript II (KS) backbone |
| Recombinant DNA reagent | Ptch1_243 (plasmid) | Son et al., 2015 | In situ hybridization probe | pBluescript II (KS) backbone |
| Recombinant DNA reagent | Ptch1_617 (plasmid) | Son et al., 2015 | In situ hybridization probe | pBluescript II (KS) backbone |
| Recombinant DNA reagent | Gli1 (plasmid) | Son et al., 2015 | In situ hybridization probe | pBluescript II (KS) backbone |
| Recombinant DNA reagent | Atoh1 (plasmid) | Bok et al., 2013 | In situ hybridization probe | pBluescript II (KS) backbone |
| Recombinant DNA reagent | Sox2 (plasmid) | Son et al., 2015 | In situ hybridization probe | pCRII-TOPO |
| Recombinant DNA reagent | Msx1 (plasmid) | Son et al., 2015 | In situ hybridization probe | pCRII-TOPO |
| Sequence-based reagent | A2m_F | Son et al., 2015 | PCR primers for in situ hybridization probe | TCC AGT CCT CTC TGC AGC AT |
| Sequence-based reagent | A2m_R | Son et al., 2015 | PCR primers for in situ hybridization probe | AGT GAG CCC TTT ACC GGT TT |
| Sequence-based reagent | A2m_T7 | Son et al., 2015 | PCR primers for in situ hybridization probe | TAA TAC GAC TCA CTA TAG GGA GAC TTG GAT CTT GGC ATT CAC A |
| Sequence-based reagent | Inhba_F | This paper | PCR primers for in situ hybridization probe | CCA AGG AAG GCA GTG ACC TG |
| Sequence-based reagent | Inhba_R | This paper | PCR primers for in situ hybridization probe | TGG GTC TCA GCT TGG TGG GC |
| Sequence-based reagent | Inhba_T7 | This paper | PCR primers for in situ hybridization probe | TAA TAC GAC TCA CTA TAG GGA GAG GGG CTG TGA CCC CTC ATG C |
| Sequence-based reagent | Fst_F | Son et al., 2012 | PCR primers for in situ hybridization probe | CCTCCTGCTGCTGCTACTCT |
| Sequence-based reagent | Fst_R | Son et al., 2012 | PCR primers for in situ hybridization probe | GCAGCGGGGTTTATTCTTCT |
| Sequence-based reagent | Fst_T7 | Son et al., 2012 | PCR primers for in situ hybridization probe | TAATACGACTCACTATAGGGAGATTCTTCTTGTTCATTCGACATTTT |
| Sequence-based reagent | Pou4f3_F | This paper | PCR primers for in situ hybridization probe | CGACTTACTTGAGCACATCTCG |
| Sequence-based reagent | Pou4f3_R | This paper | PCR primers for in situ hybridization probe | TTAGGCTCTCCAGGCTCCTC |
| Sequence-based reagent | Pou4f3_T7 | This paper | PCR primers for in situ hybridization probe | TAATACGACTCACTATAGGGAGAGAACCAGACCCTCACCACAT |
| Sequence-based reagent | Gfi1_F | This paper | PCR primers for in situ hybridization probe | TCTGCTCATTCACTCGGACA |
| Sequence-based reagent | Gfi1_R | This paper | PCR primers for in situ hybridization probe | TCCACAGCTTCACCTCCTCT |
| Sequence-based reagent | Gfi1_T7 | This paper | PCR primers for in situ hybridization probe | TAATACGACTCACTATAGGGAGACAGCAGTCTCCCCAGAAGAG |
| Sequence-based reagent | Ptch1_F | PrimerBank | qPCR primers : 6679519a1 | AAAGAACTGCGGCAAGTTTTTG |
| Sequence-based reagent | Ptch1_R | PrimerBank | qPCR primers : 6679519a1 | CTTCTCCTATCTTCTGACGGGT |
| Sequence-based reagent | Gli1_F | PrimerBank | qPCR primers : 6754002a1 | CCAAGCCAACTTTATGTCAGGG |
| Sequence-based reagent | Gli1_R | PrimerBank | qPCR primers : 6754002a1 | AGCCCGCTTCTTTGTTAATTTGA |
| Sequence-based reagent | Pax2-Cre_F | MMRRC | Genotyping primer for ID # 10569 | GCC TGC ATT ACC GGT CGA TGC AAC GA |
| Sequence-based reagent | Pax2-Cre_R | MMRRC | Genotyping primer for ID # 10569 | GTG GCA GAT GGC GCG GCA ACA CCA TT |
| Sequence-based reagent | Ift88 lox_F | The Jackson laboratory | Genotyping primer for ID #16967 | GAC CAC CTT TTT AGC CTC CTG |
| Sequence-based reagent | Ift88 lox_R | The Jackson laboratory | Genotyping primer for ID #16969 | AGG GAA GGG ACT TAG GAA TGA |
| Sequence-based reagent | Cilk1tm1a_F | Moon et al., 2014 | Genotyping primer | CGC GTC GAG AAG TTC CTA TT |
| Sequence-based reagent | Cilk1tm1a_R | Moon et al., 2014 | Genotyping primer | ATC ATC CCG ATC AAG TCA GC |
| Sequence-based reagent | Foxg1-Cre_F | The Jackson Laboratory, | Genotyping primer for ID oIMR1084 | GCG GTC TGG CAG TAA AAA CTA TC |
| Sequence-based reagent | Foxg1-Cre_R | The Jackson Laboratory, | Genotyping primer for ID oIMR1085 | GTG AAA CAG CAT TGC TGT CAC TT |
| Sequence-based reagent | Cilk1 WT_F | This paper | Genotyping primer | GCTGACTTGATCGGGATGAT |
| Sequence-based reagent | Cilk1 WT_R | This paper | Genotyping primer | TGGCCAGGCTGGAACTCACTATA |
| Sequence-based reagent | Cilk1 lox_F | This paper | Genotyping primer | CACTGTGGGCAGAATCACCT |
| Sequence-based reagent | Cilk1 lox_R | This paper | Genotyping primer | CCGCCTACTGCGACTATAGA |
| Sequence-based reagent | Tbc1d32/bromi_F | Ko et al., 2010 | Genotyping primer | AAT TTA GTC TCT GGG CAC AAC AA |
| Sequence-based reagent | Tbc1d32/bromi_R | Ko et al., 2010 | Genotyping primer | TCA TCA GCT TTC ATA GCT TCA CA |
| Software, algorithm | SPSS | SPSS | RRID:SCR_002865 | |
| Software, algorithm | Graphpad Prism 8.0 | Graphpad | RRID:SCR_002798 |
Additional files
Download links
A two-part list of links to download the article, or parts of the article, in various formats.
Downloads (link to download the article as PDF)
Open citations (links to open the citations from this article in various online reference manager services)
Cite this article (links to download the citations from this article in formats compatible with various reference manager tools)
Dysregulation of sonic hedgehog signaling causes hearing loss in ciliopathy mouse models
eLife 9:e56551.
https://doi.org/10.7554/eLife.56551


