Rho1 activation recapitulates early gastrulation events in the ventral, but not dorsal, epithelium of Drosophila embryos
- Department of Molecular Genetics and Cell Biology, University of Chicago, United States
Figures
Figure 1 with 3 supplements
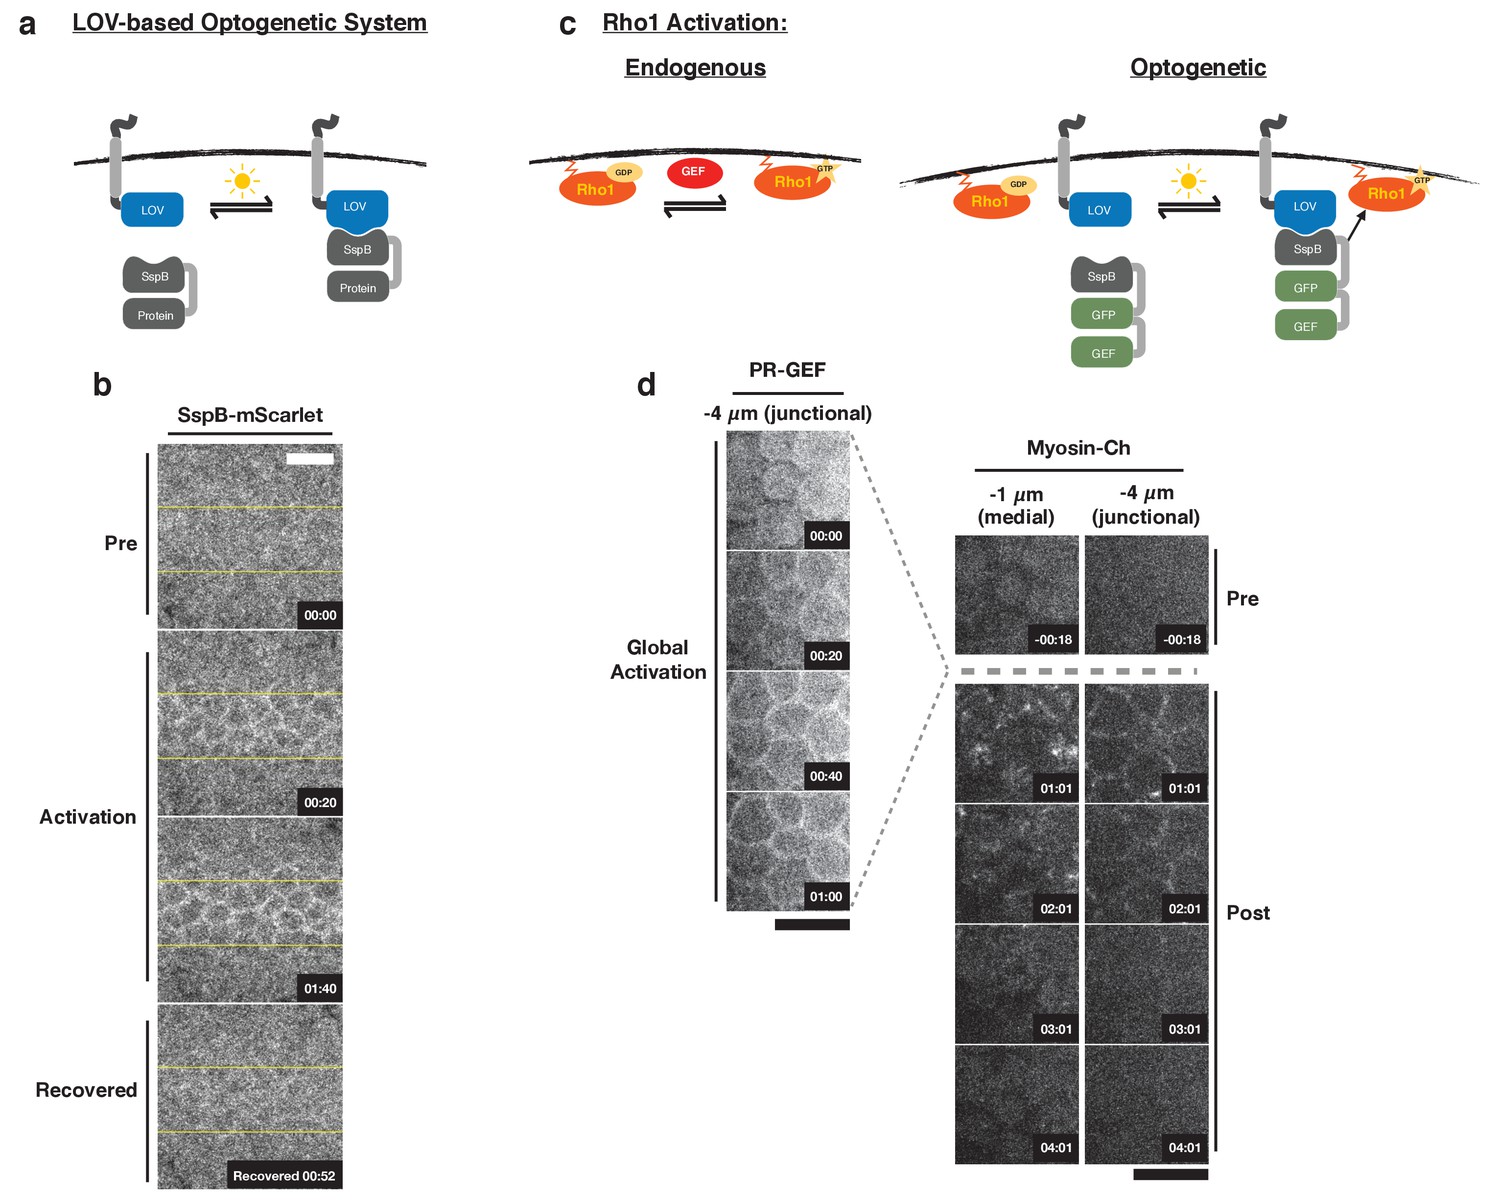
Optogenetic control of Rho1 in Drosophila.
(a) Generic LOV domain-based optogenetic system consisting of a membrane localized LOVSsrA protein and a recruitable SspB protein. SspB can be fused to any protein of interest. Blue light induces a conformational change in the LOV domain, allowing it to recruit SspB fusion proteins to the membrane. (b) Dorsal epithelium of an embryo expressing the membrane-localized LOVSsrA and SspB-mScarlet just after the completion of cellularization before, during, and after photoactivation in the indicated region (yellow box). Data representative of 4/4 embryos. (c) Optogenetic system for activating Rho1: SspB is fused to GFP and the Dbl homology (DH) domain of LARG (PR-GEF). Photoactivation induces recruitment of the PR-GEF to the membrane and Rho1 activation. (d) Dorsal epithelium of an embryo expressing a membrane-localized LOVSsrA and PR-GEF just after the completion of cellularization. The distribution of PR-GEF and myosin are shown before, during, and at the indicated times after global photoactivation. Data representative of 5/5 embryos. Note that the light dose used for global experiments is higher than the light dose used for local activation experiments. Time zero indicates the beginning of photoactivation. Scale bars are 10 µm.
Figure 1—figure supplement 1

Recruitment of PR-GEF activates Rho1 in all tissues tested.
(a) Pupal Notum expressing the optogenetic probes. Myosin-Ch is shown before and after global photoactivation. Yellow arrow indicates the same cell junction over time. Asterisks indicate mitotic cells. Data representative of 2/2 pupae. (b) Egg chambers expressing the optogenetic probes. Myosin-Ch is shown before and after global photoactivation. Nurse cell junctions (red arrow) and the oocyte cortex (yellow arrow) are indicated. Data representative of 4/4 egg chambers. (c–d) Larval wing imaginal discs (c) and larval neuroblast (d) expressing the optogenetic probes. Rho1 was locally photoactivated within the yellow boxes. Myosin-Ch is shown before and during activation. Myosin-Ch accumulates with subcellular precision in the peripodial epithelium, consisting of squamous cells (c, left). Data representative of 5/5 wing discs (c, left), 3/3 wing discs (c, right), and 6/6 neuroblasts from two CNSs (d). Time zero indicates the first pulse of blue light activation. Scale bars are 10 µm.
Figure 1—figure supplement 2
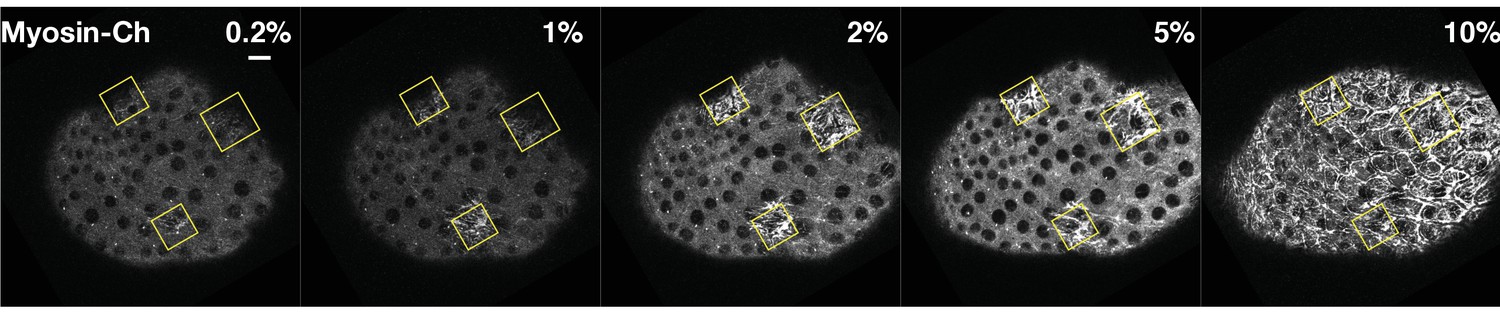
Ectopic Rho1 activation is sensitive to light dose.
Larval wing peripodial epithelia expressing the optogenetic components and Myosin-Ch. Rho1 was optogenetically activated in the yellow boxes. Laser power was attenuated to the indicated percent transmittance using an acousto-optical tunable filter. Ten percent transmittance induces substantial Rho1 activation outside of the activation zone. Lowering the laser transmittance yields decreasing amounts of myosin accumulation. Photoactivation lasted 2 min 20 s for each % transmittance. Data representative of 4/4 wing imaginal discs. Scale bars are 10 µm.
Figure 1—figure supplement 3
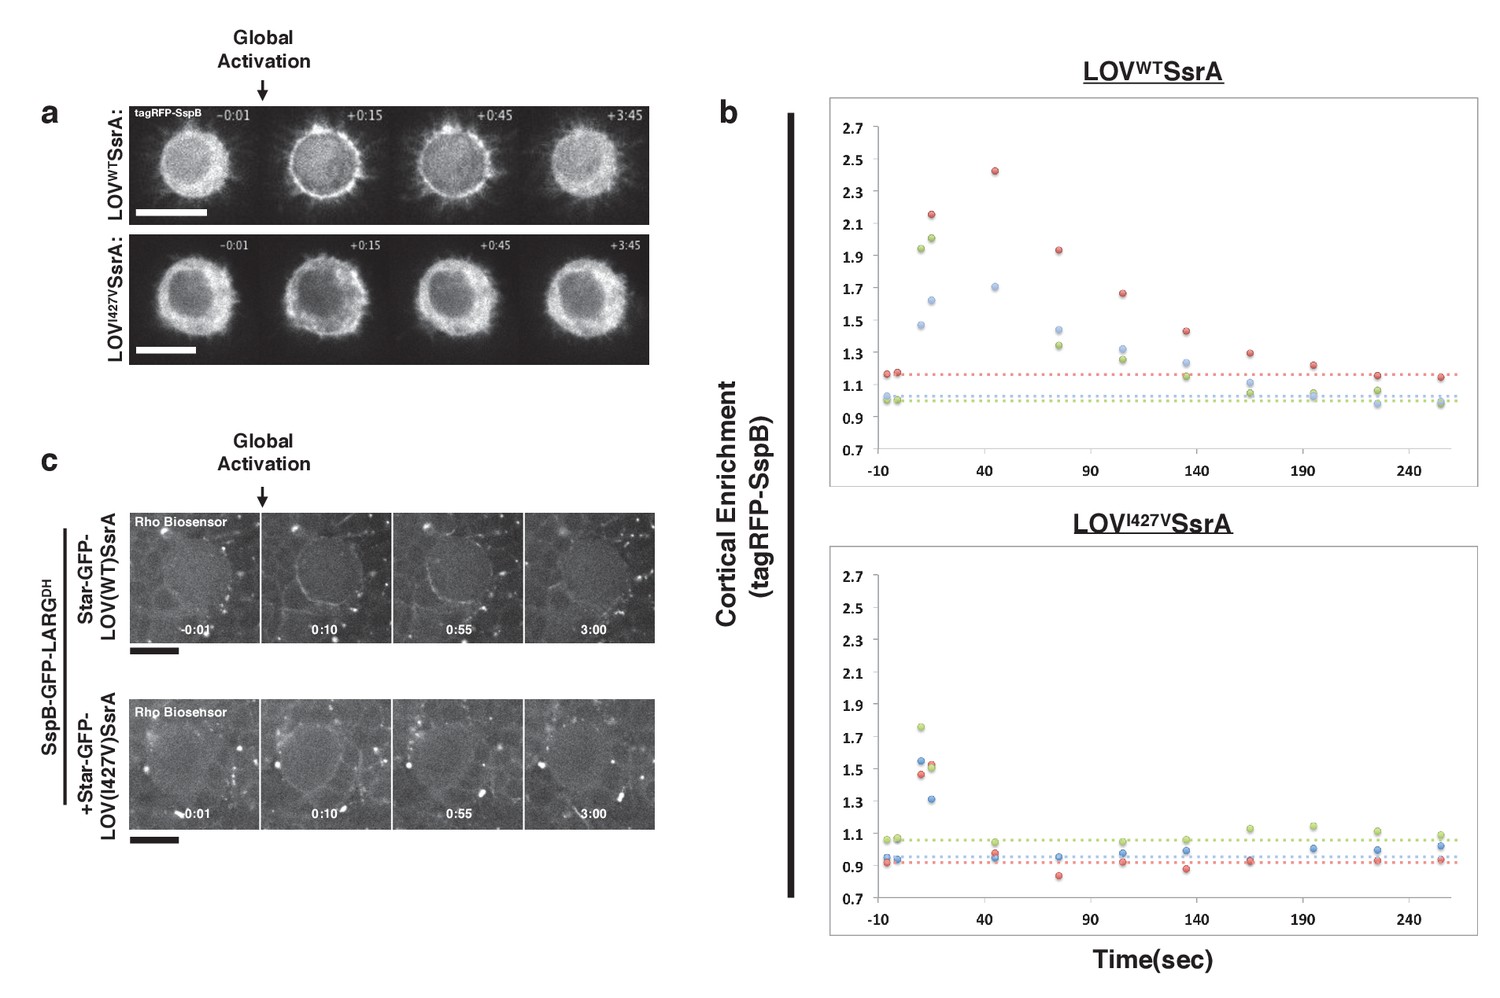
Inactivation kinetics of the LOV domain dictate the off rate of optogenetic-induced Rho1 activity.
(a) S2 cells transiently transfected with recruitable tagRFP-SspB and a membrane localized WT LOV domain (top) or fast-cycling (I427V) LOV domain (bottom). Representative cells are shown before and after global photoactivation. (b) Quantification of the cortical enrichment (membrane/cytoplasm) of SspB-tagRFP following global optogenetic Rho1 activation. (c) Larval neuroblasts expressing PR-GEF, Rho-biosensor, and WT (top) or fast-cycling (bottom) membrane-localized LOV domain shown before and after global photoactivation. Scale bars are 5 µm. Rho-biosensor consists of the Rho-binding domain of Anillin, a RhoA effector, fused to mCherry (Munjal et al., 2015; Piekny and Glotzer, 2008). Data representative of 16 neuroblasts from three brains (top) and 19 neuroblasts from four brains (bottom).
Figure 2 with 2 supplements
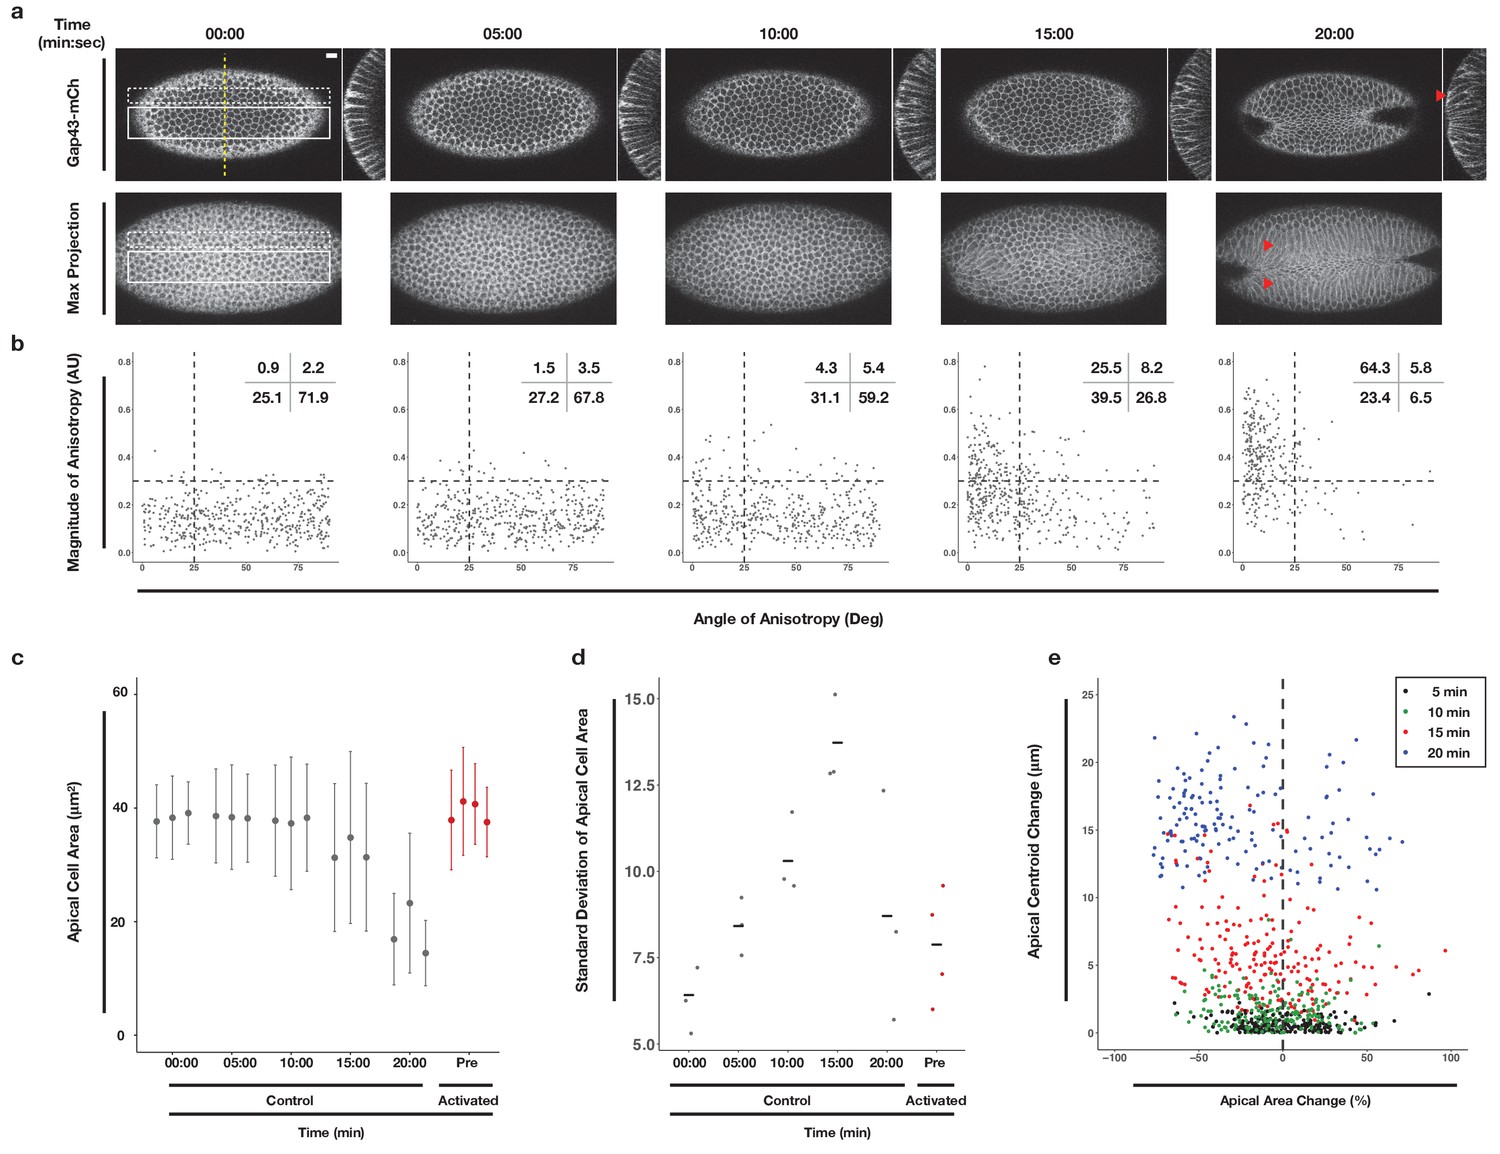
Morphometric analysis of ventral cells during ventral furrow formation.
(a) Ventral epithelium of a Drosophila embryo expressing the optogenetic components and Gap43-Ch but not exposed to activating light before, during, and after the onset of ventral furrow formation. Single planes (top), YZ projections (side), and maximum intensity projections (bottom) are shown. Scale bar is 10 µm. Filled arrowheads indicates long-range bending of these cells. Time zero indicates start of filming. (b) Anisotropy scatter plots: Each dot represents a single cell within the solid white box in (a) at the corresponding time. The magnitude of anisotropy is plotted on the y-axis; the orientation of anisotropy, relative to the anterior-posterior axis of the embryo, is plotted on the x-axis. Dotted lines are provided to facilitate comparisons between plots. Insets show percentage of cells in each quadrant. Cells in the upper left quadrant exhibit highly aligned, anisotropic apical constriction. (c) Quantification of apical cell area for cells within solid white box in (a). Gray columns represent unactivated cells. Red columns represent optogenetically activated cells discussed in Figure 4. (d) Standard deviation of the apical cell areas shown in (c). Gray and red dots represent standard deviation of apical cell areas for each non-activated (gray) or activated (red, see Figure 4) embryo at time point indicated along the X axis. Black crossbars indicate the average standard deviation for a given time point. (e) Quantification of the bending of cells neighboring the ventral midline (white dotted box in a). X axis is the percent apical area change relative to 00:00 min; Y axis is the change in position of the centroid of the apical cell surface along the dorsal-ventral axis relative to 00:00 min. Data in b-d are from 463 cells from three embryos. Data in e are from 203 cells from three embryos.
Figure 2—figure supplement 1
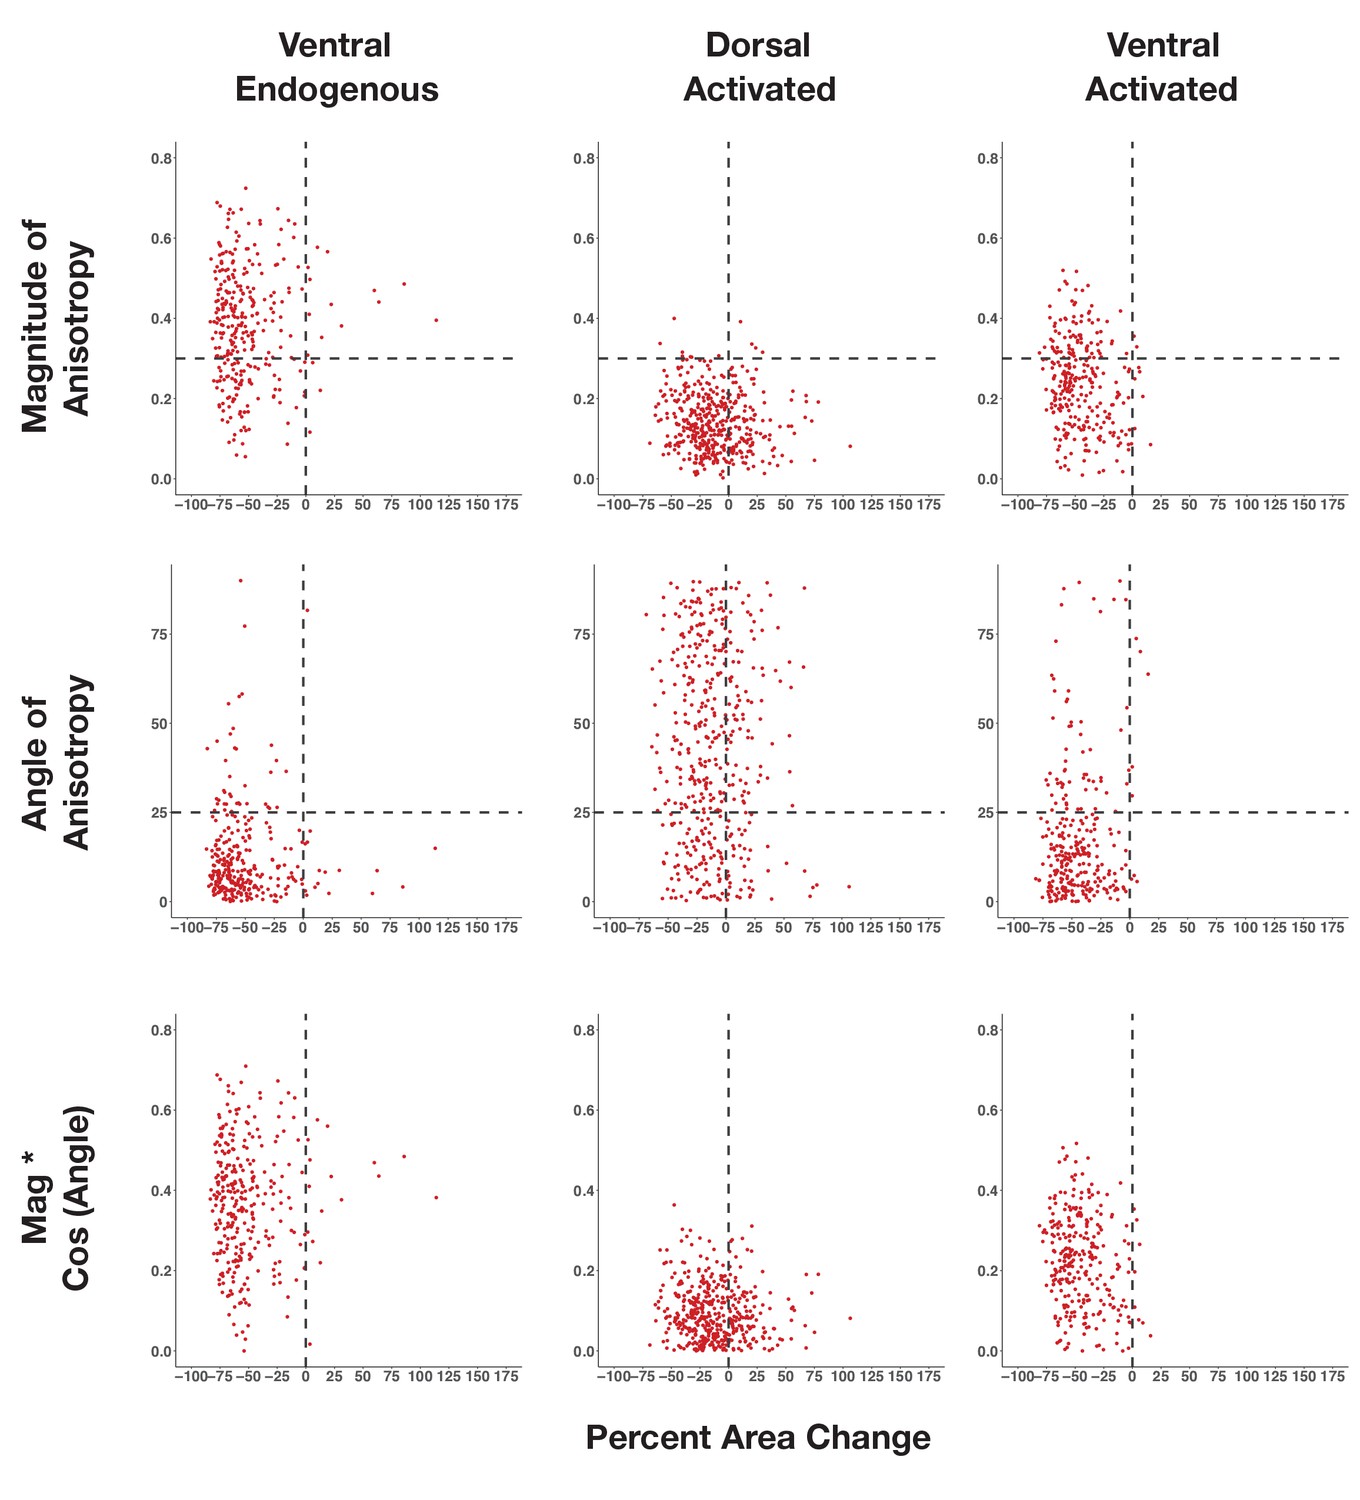
Neither magnitude nor alignment of anisotropy correlates with extent of apical constriction.
Scatter plots of percent area change versus magnitude of anisotropy (top), angle of anisotropy (center), or the product of magnitude and the cosine of angle (bottom) for wild-type non-activated cells (left, cells analyzed in Figure 2), wild-type activated dorsal cells (middle, cells analyzed in Figure 4d -left), or wild-type activated ventral cells (right, cells analyzed in Figure 4d -right).
Figure 2—figure supplement 2
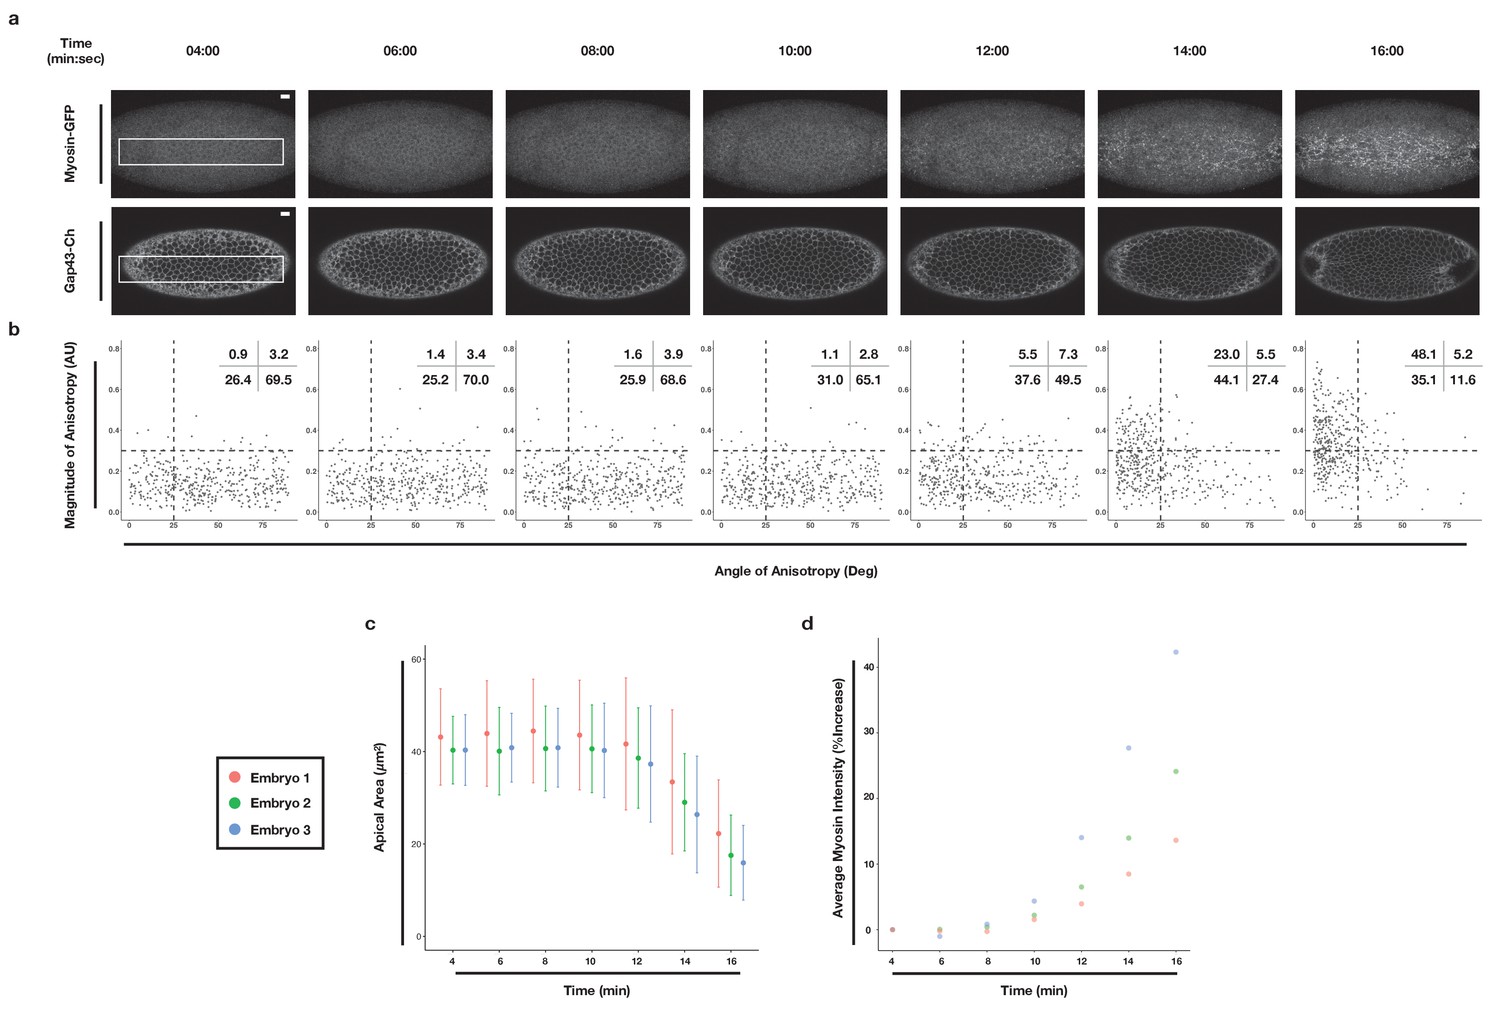
Apical constriction of ventral cells occurs just after the onset of myosin accumulation.
(a) Embryo expressing Myosin-GFP (top) and Gap43-Ch (bottom) at the indicated timepoints, which correspond to the timescale used in Figure 2. Maximum intensity projection is shown for Myosin-GFP; single plane image is shown for Gap43-Ch. (b) Anisotropy plots, as in Figure 2b, for cells inside white box in (a). (c) Plot of mean (dot) and standard deviation (line) of apical cell area at the timepoints indicated on the x-axis. (d) Average myosin intensity of the region within the white box in (a), plotted as % increase relative to 04:00 min, at the timepoints indicated on the x-axis. Timepoints in (c) and (d) correspond to timepoints in (a). Colors in (c) and (d) indicate individual embryos. Data represent 436 cells from three embryos. Scale bar is 10 µm.
Figure 3 with 3 supplements
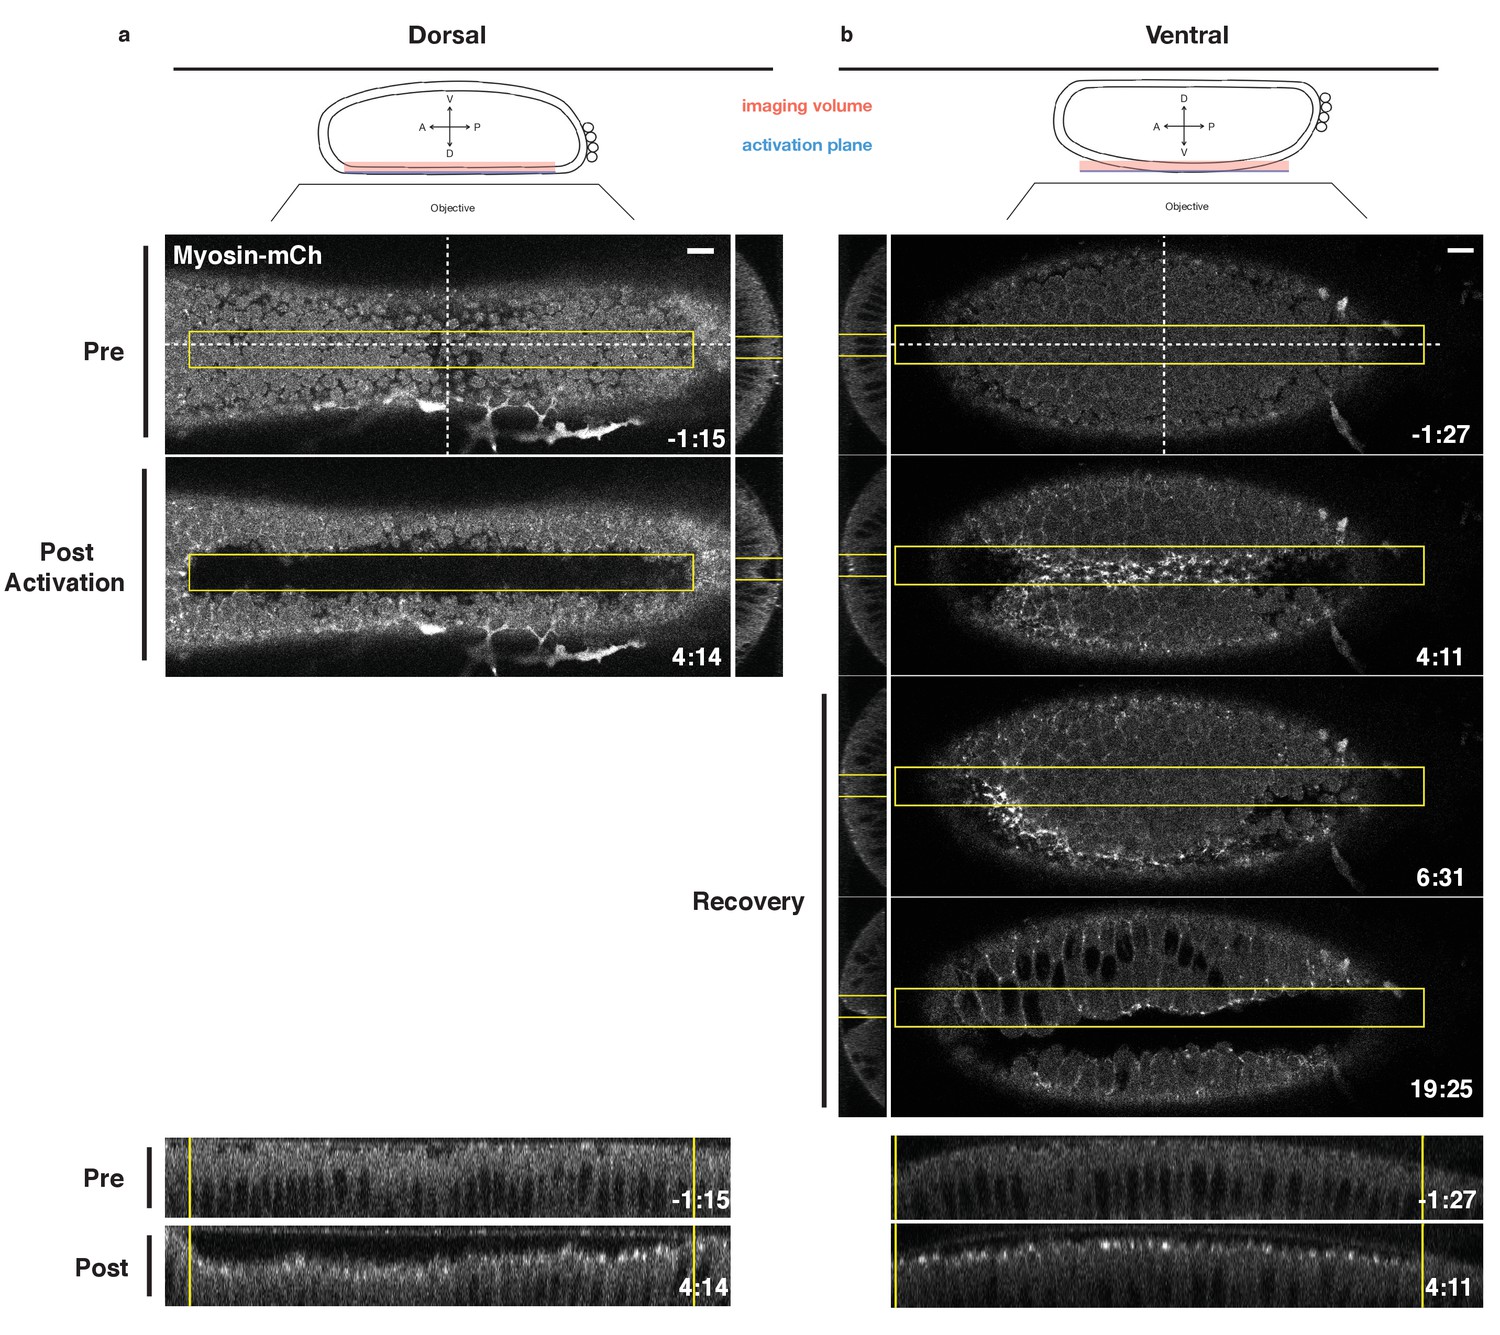
Local Rho1 activation is sufficient to induce ectopic furrows in the embryonic epithelium.
(a,b) Top: Schematic of local activation set up. Bottom: Embryos expressing the optogenetic components and Myosin-Ch prior to the invagination of the endogenous ventral furrow were optogenetically activated in a single apical plane within the yellow box. Ectopic furrows and Myosin-Ch accumulation are shown in the dorsal (a) and ventral (b) epithelium. XZ projections shown in middle, YZ projections shown at bottom. Optogenetic activation of Rho1-induced ectopic furrows in 7/7 dorsal (a) and 5/5 ventral (b) epithelia. Optogenetically-induced furrows recovered in 4/4 ventral epithelia (b). Time zero indicates the first pulse of blue light activation. Scale bars are 10 µm.
Figure 3—figure supplement 1
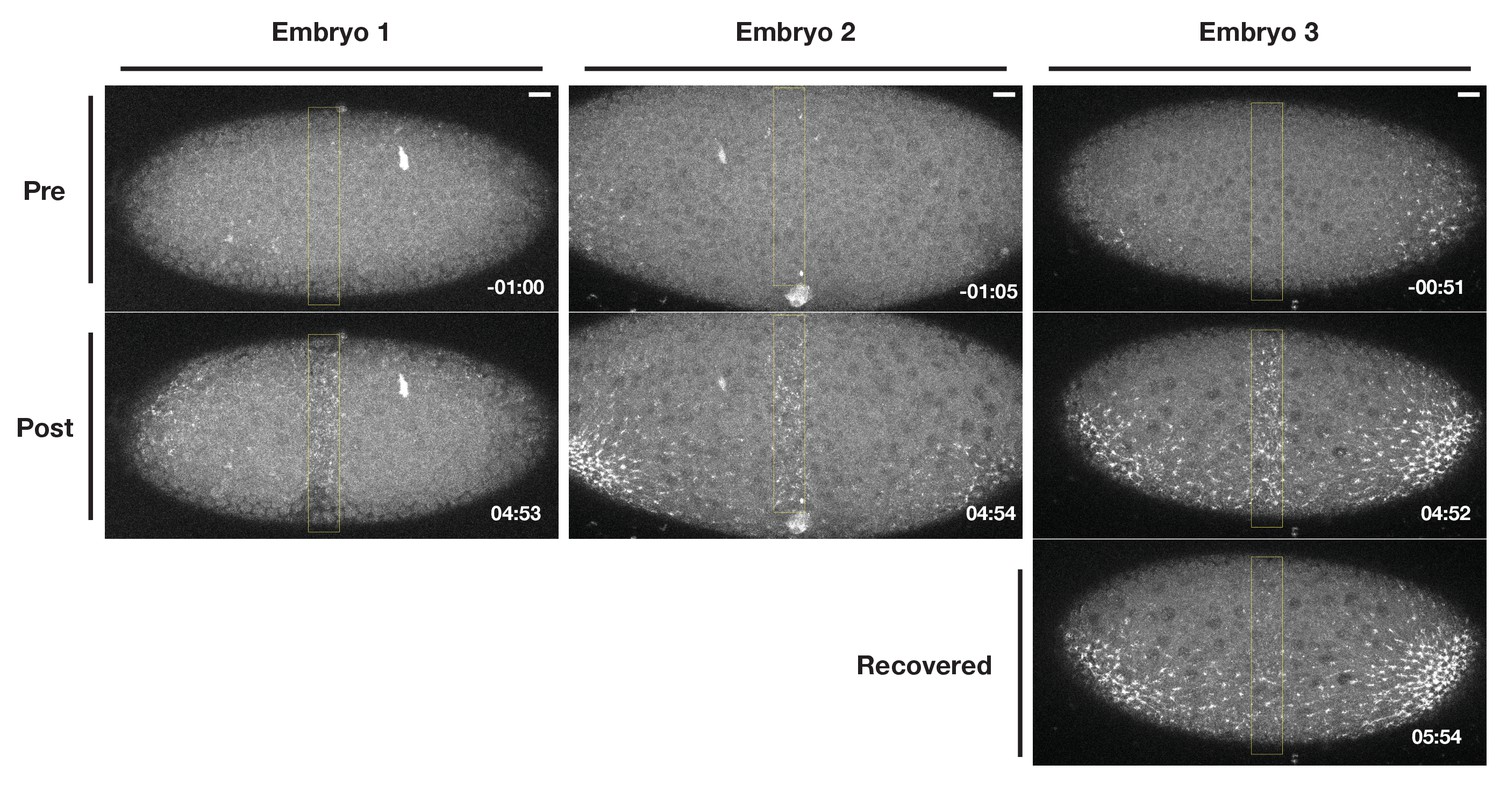
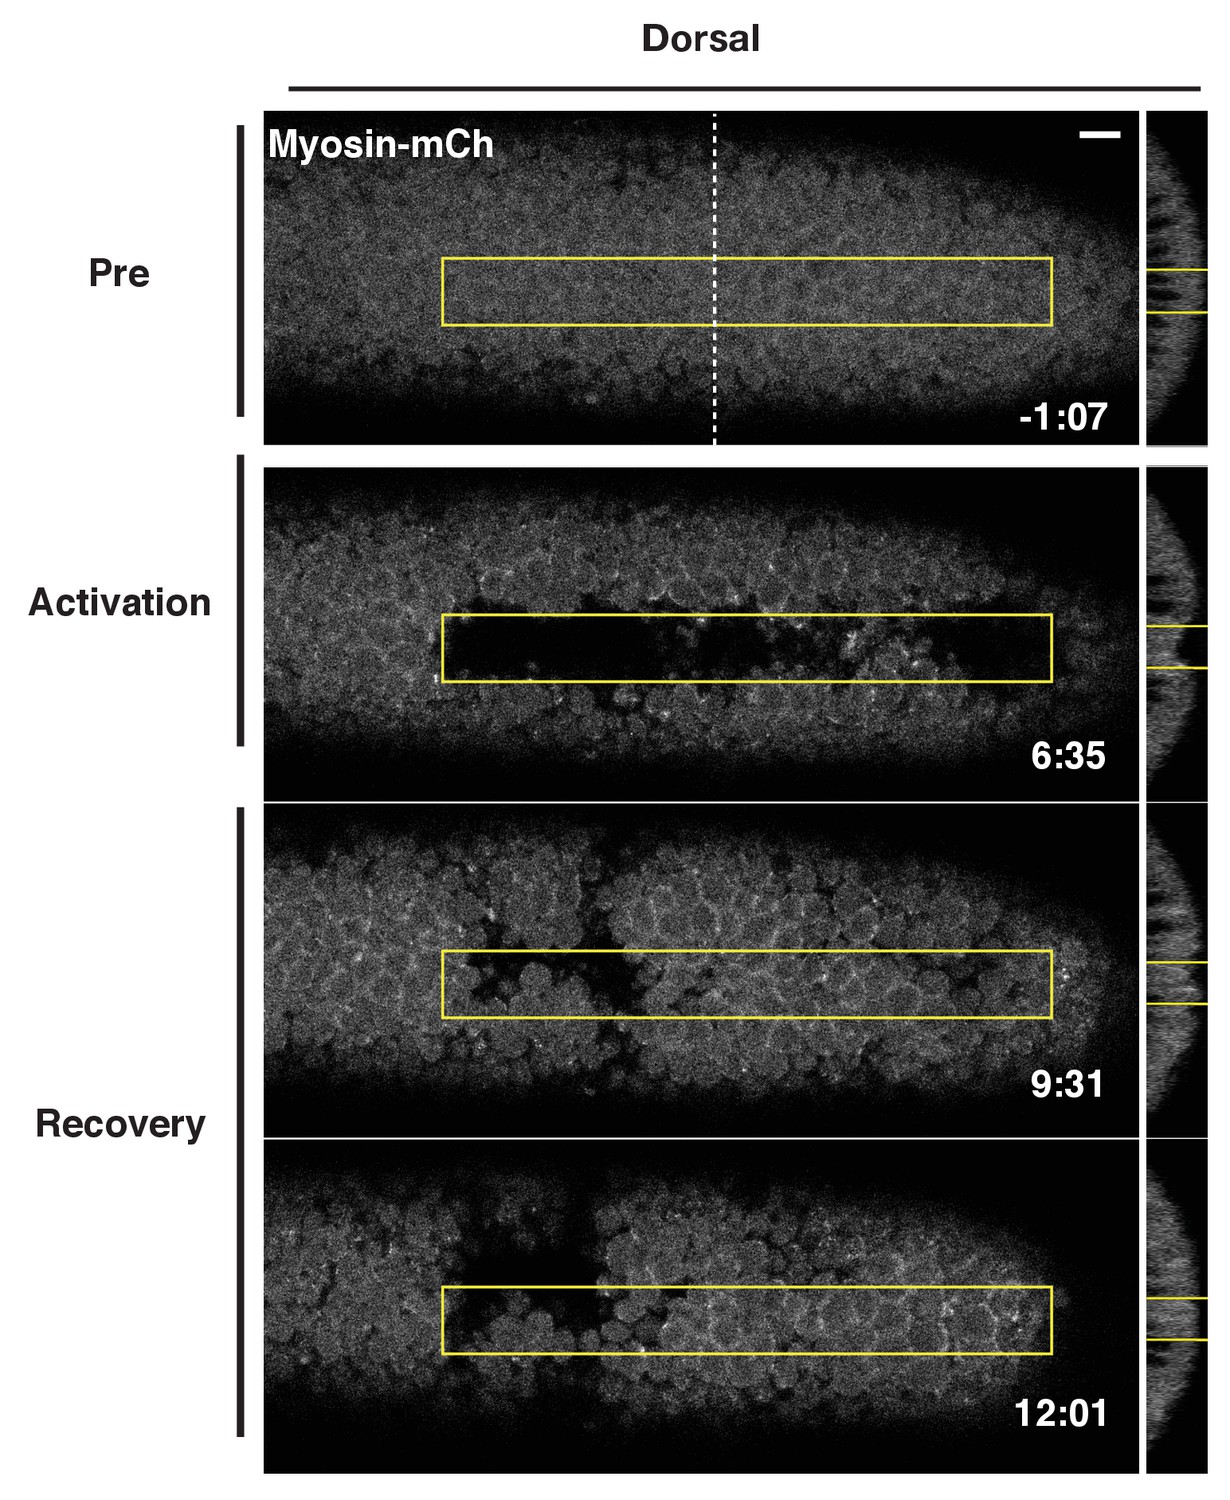
Optogenetic Rho1 activation induces Myosin-Ch accumulation in the ventral epitheium that does not spread outside of the activation region.
Three different examples of embryos expressing the optogenetic components and Myosin-Ch. Rho1 was optogenetically activated in the ventral/ventrolateral epithelium within the yellow box, perpendicular to the eventual location of the endogenous furrow. These embryos were activated at distinct timepoints relative to the onset of endogenous ventral furrow formation. The recovery of the optogenetically-induced Myosin-Ch accumulation is shown in the right-most example. Time zero indicates the start of photoactivation. Scale bars are 10µm.
Figure 3—figure supplement 2
Optogenetically induced furrows in dorsal epithelium revert following cessation of Rho1 activation.
Dorsal epithelium of a Drosophila embryo expressing the optogenetic components and Myosin-Ch before, during, and after local Rho1 activation within the yellow boxes. Note that some cells in the dorsal epithelium remain invaginated after the recovery period. These sustained pockets of invagination are sometimes seen where the dorsal transverse folds form. 4/5 optogenetically induced dorsal furrows reverted. Note: The activation region used in this example is 70% as long as the standard activation region used. Time zero indicates the first pulse of blue light activation. Scale bars are 10 µm.
Figure 3—figure supplement 3
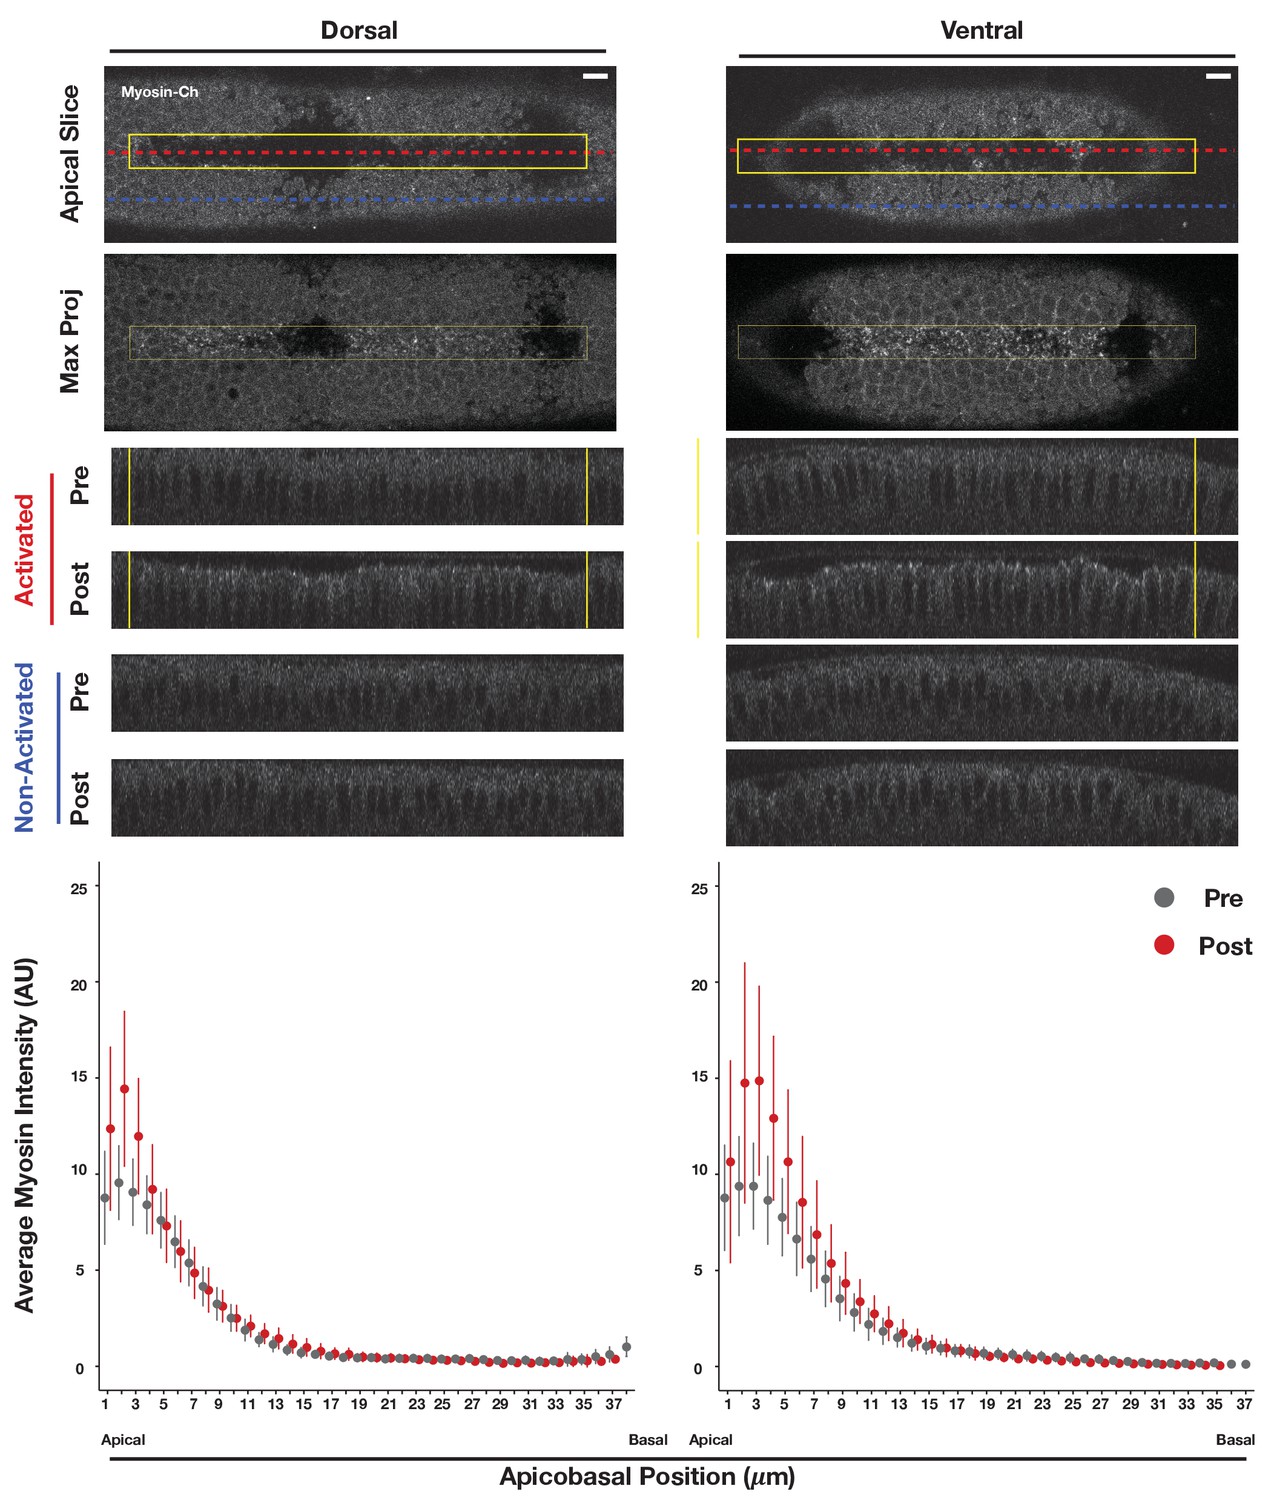
Optogenetic Rho1 activation induces apical myosin accumulation in both dorsal and ventral epithelia.
(top) Dorsal (left) or ventral (right) epithelium of embryos depleted of RhoGEF2 and expressing the optogenetic components and Myosin-Ch after local activation of Rho1 within the yellow box. (a-middle) Maximum intensity projections of the apical-most 3 µm of the activated regions show apical myosin accumulation. XZ projections are shown before and after photoactivation for activated (red dotted lines) and non-activated (blue dotted lines) tissue. (bottom) Plot of average myosin intensity (Y-axis) within the activation zone (yellow box) relative to the the apicobasal position in the embryo (X-axis) before (gray) and after (red) photoactivation. Mean (dot) and standard deviation (line) are plotted. Plots represent the average of four dorsal and five ventral embryos. Scale bars are 10 µm.
Figure 4 with 4 supplements
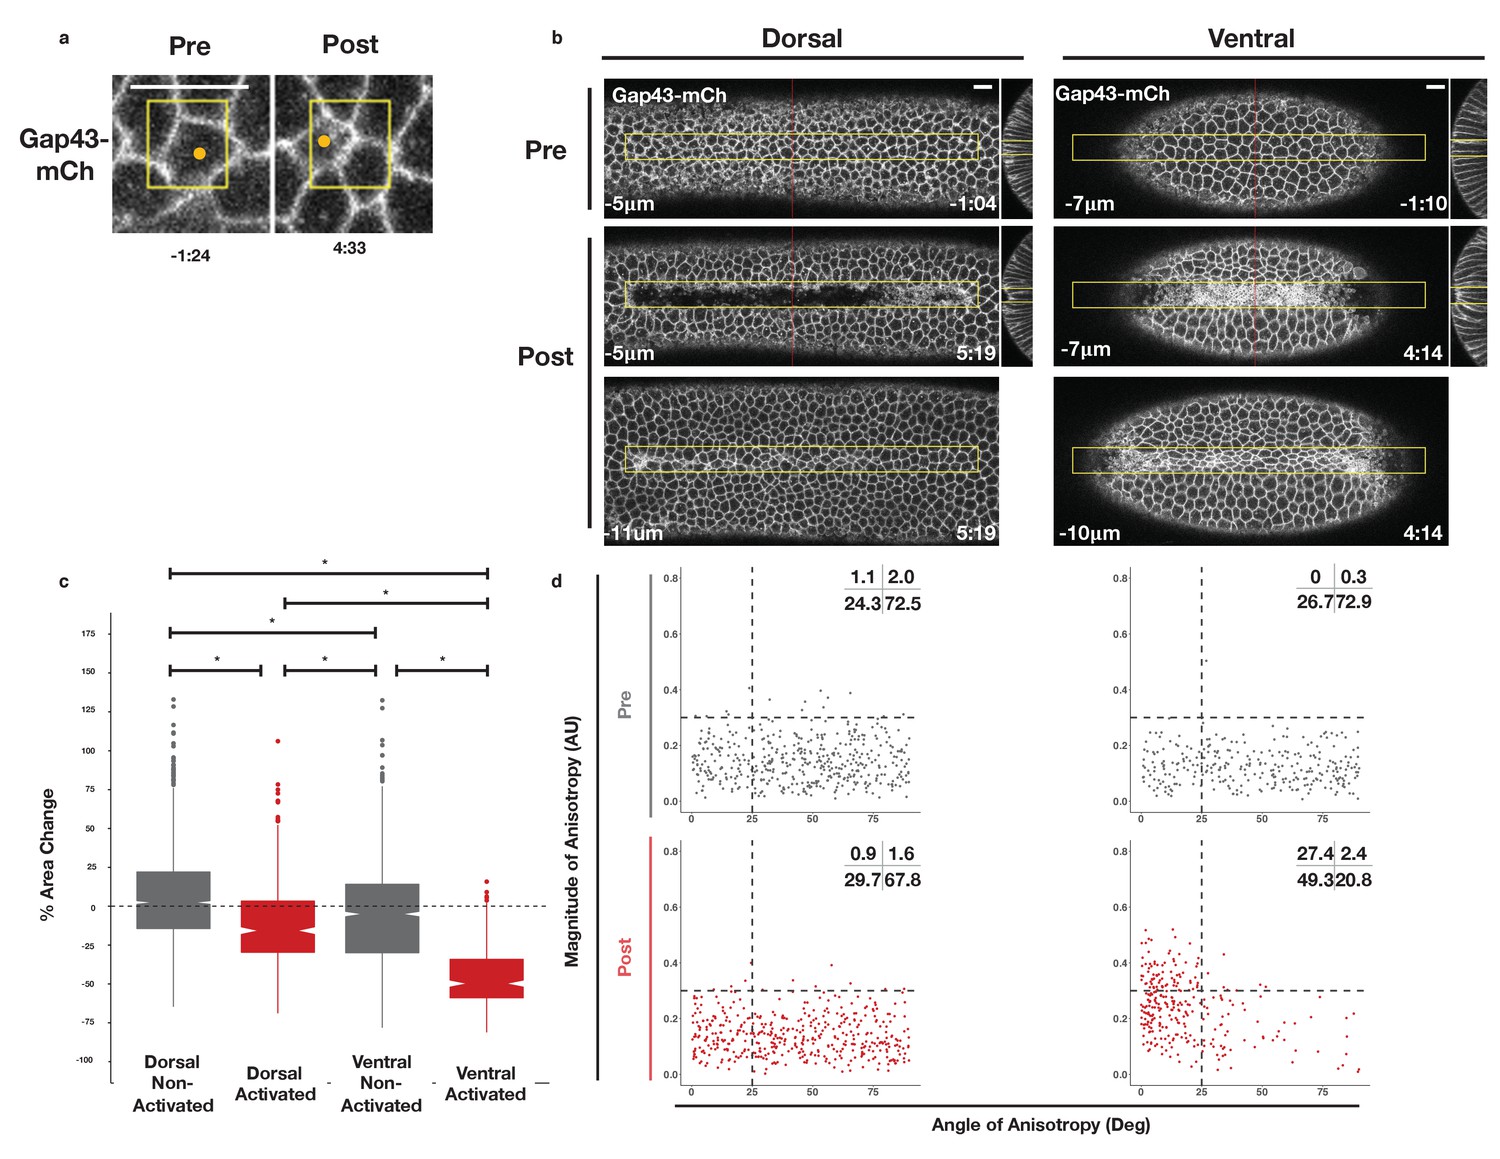
Rho1 activation induces distinct apical constriction in dorsal and ventral epithelial cells.
(a) Dorsal cells from an embryo expressing the optogenetic components and Gap43-mCh before the onset of cell shape changes before and after photoactivation within the yellow box. Z-slices shown represent the apical-most view of the activated cell (orange dot). Data representative of 7/8 cells from two embryos. (b) Dorsal (left) and ventral (right) epithelium of embryos expressing the optogenetic components and Gap43-mCh before the onset of cell shape changes. Rho1 was activated in the yellow box. Images shown in bottom panels were chosen to show the apical surfaces of activated cells. Red lines in (b) indicate position of each YZ slice. Data are representative of 4/4 (a) and 4/4 (b) embryos. Time zero indicates the first pulse of blue light activation. Scale bars are 10 µm. (c) Quantification of apical area change induced by optogenetic Rho1 activation. Gray columns represent non-activated cells (cells outside the yellow box in (b)). Red columns represent activated cells (cells within the yellow box in (b)). Statistical Analysis: Kruskal-Wallis test, Chi2 = 691.6, df = 3, p = 2.2 x 10⁻¹⁶; pairwise comparisons with Wilcoxon signed rank text, using BH method to adjust for multiple comparisons. * indicates p < 0.05. (d) Anisotropy scatter plots as in Figure 2b: Each dot represents an activated dorsal (left) or ventral (right) cell before (top) or after (bottom) optogenetic activation of Rho1. A total of 444 dorsal cells from four embryos and 288 ventral cells from four embryos were analyzed. See Figure 4—figure supplement 1 for plots of the changes in anisotropy of individual cells. See Figure 4—figure supplement 2 for statistical analysis of data in d.
Figure 4—figure supplement 1
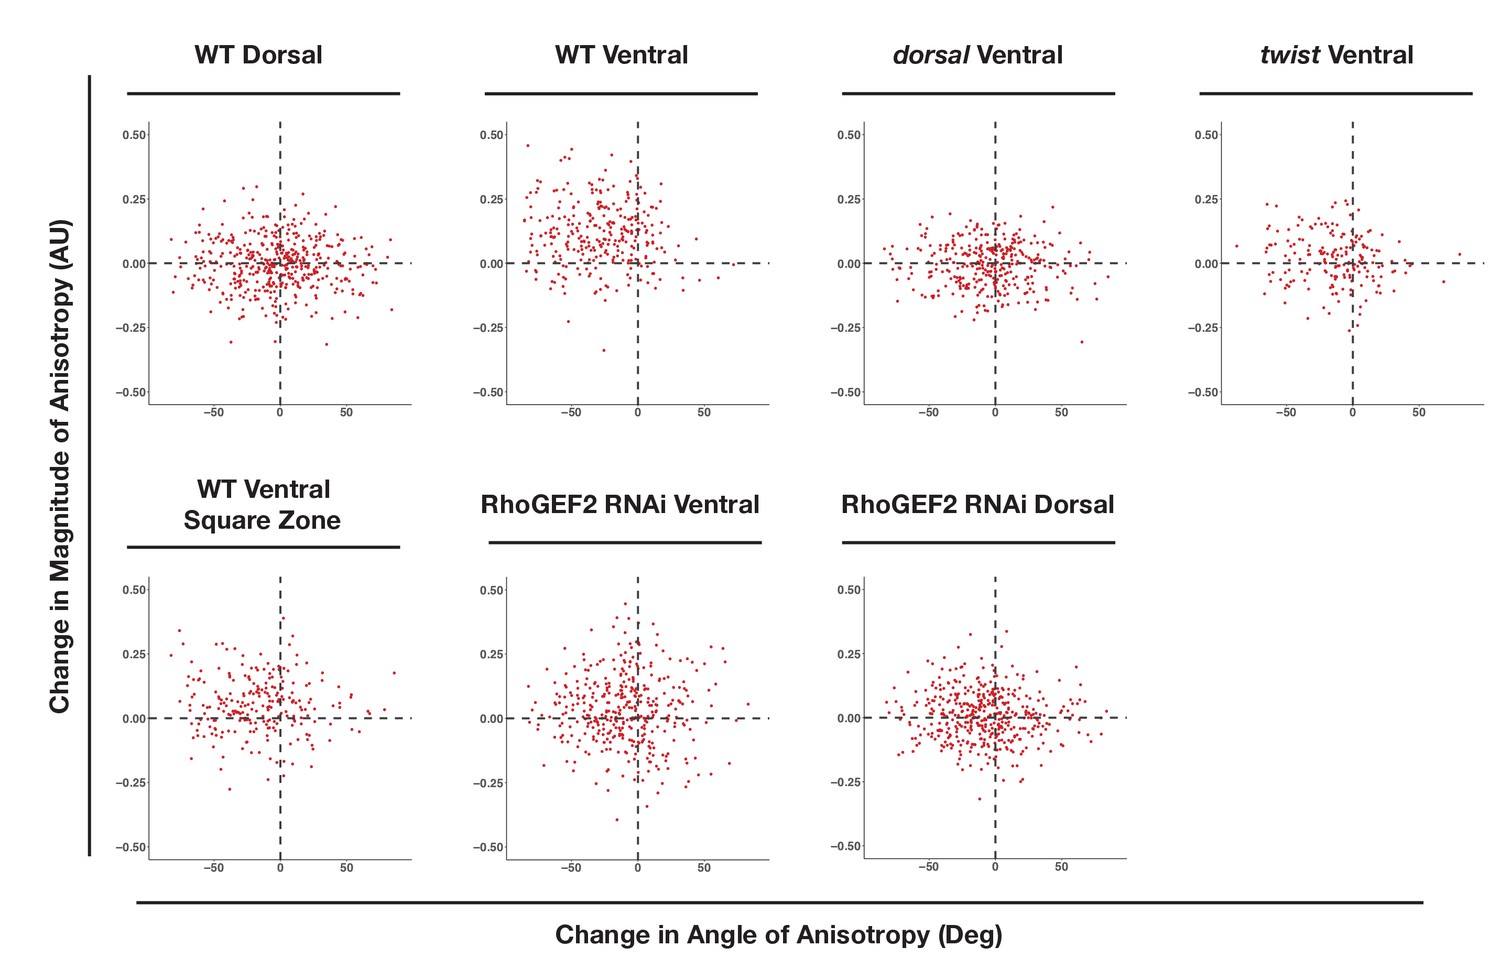
WT ventral, but not dorsal, cells exhibit large changes in the magnitude and alignment of anisotropy in response to Rho1 activation.
X and Y axes show the changes in anisotropy angle (X) and magnitude (Y) for each cell over the course of optogenetic activation. Angle change was calculated as end angle (in degrees) minus start angle (in degrees). Magnitude change was calculated as end magnitude minus start magnitude. 444 cells from four wild-type dorsally oriented, 288 cells from four wild-type ventrally oriented, 343 cells from four dorsal embryos, 189 cells from three twist embryos, 375 cells from five ventrally oriented RhoGEF2 depleted embryos, 436 cells from five dorsally oriented RhoGEF2 depleted embryos, and 239 cells from five square zone embryos were analyzed.
Figure 4—figure supplement 2
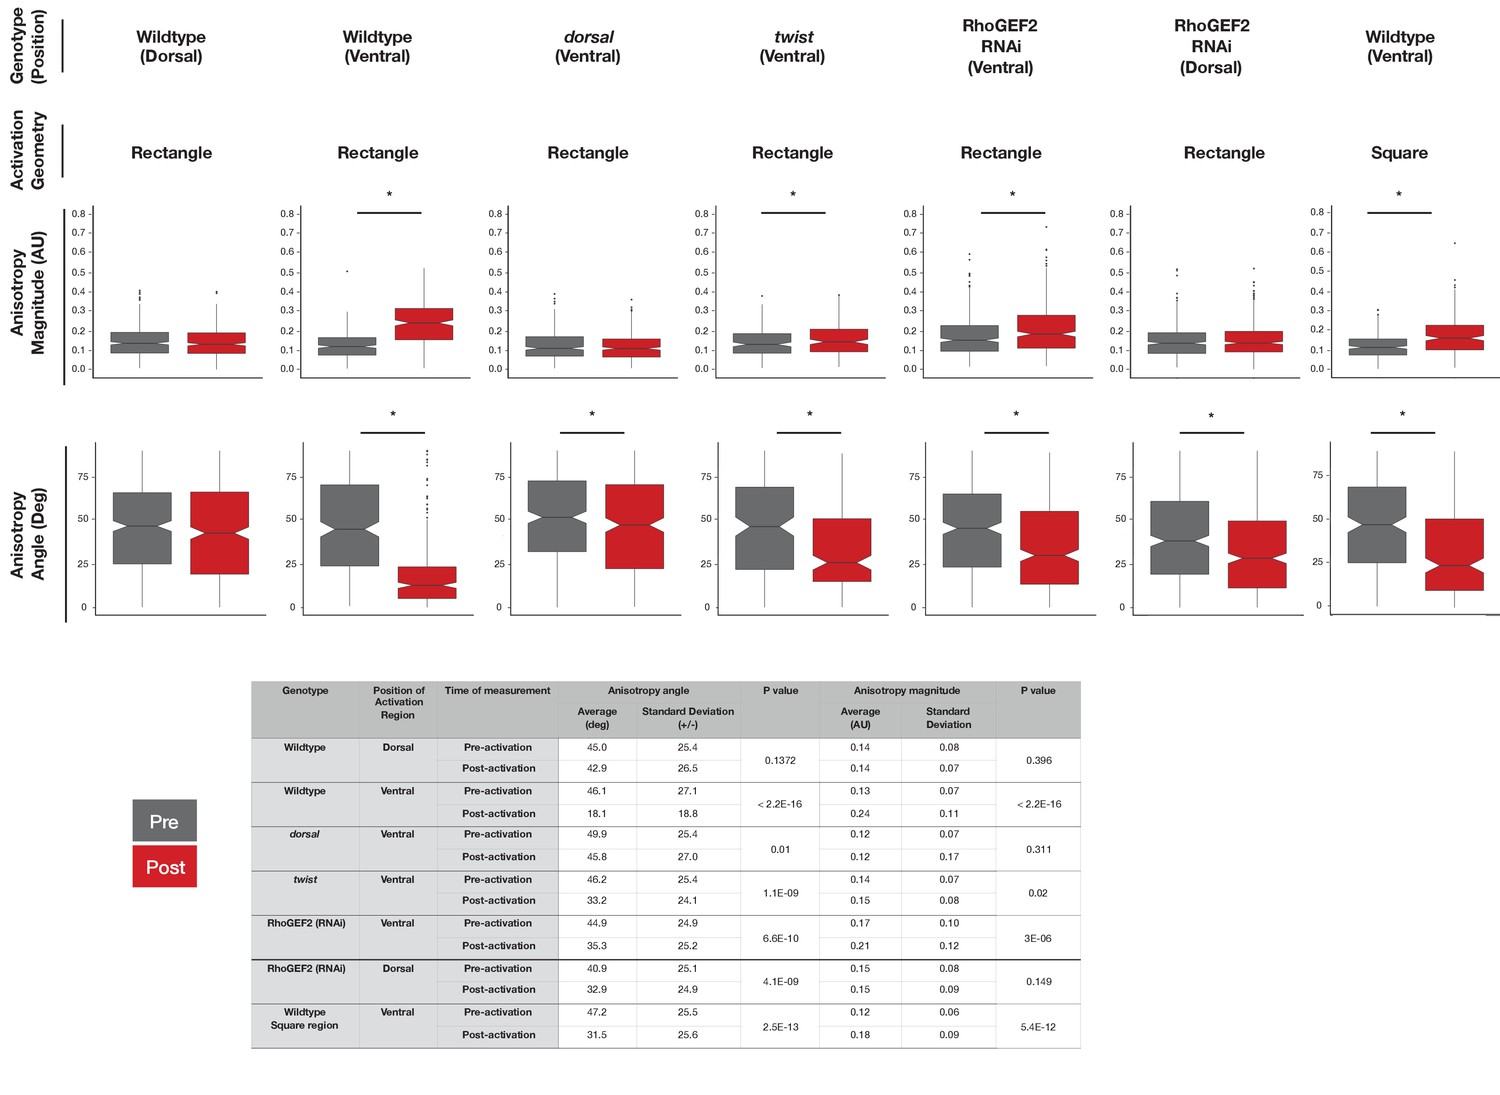
Comparisons of angle and magnitude of anisotropy before and after optogenetic Rho1 activation.
Top: Box plots showing the angle and magnitude of anisotropy before (gray) and after (red) optogenetic Rho1 activation for indicated genotypes. These data correspond to the X and Y axes of the scatter plots shown in Figure 4d and Figure 5c. Statistical analysis: Wilcoxon signed rank test. * indicates p<0.05, indicating a statistically significant change in angle or magnitude in response to optogenetic Rho1 activation. Bottom: Table containing the mean, standard deviation, and p-value for the graphs above.
Figure 4—figure supplement 3

Optogenetic activation of Rho1 induces precocious cell shape changes in the ventral epithelium.
Ventral surface of an embryo expressing the optogenetic components and Gap43-Ch. Rho1 was activated within the yellow box. Zoomed images of activated (yellow) and non-activated (red) cells are shown. Data representative of 4/4 embryos. Scale bars are 10 µm.
Figure 4—figure supplement 4
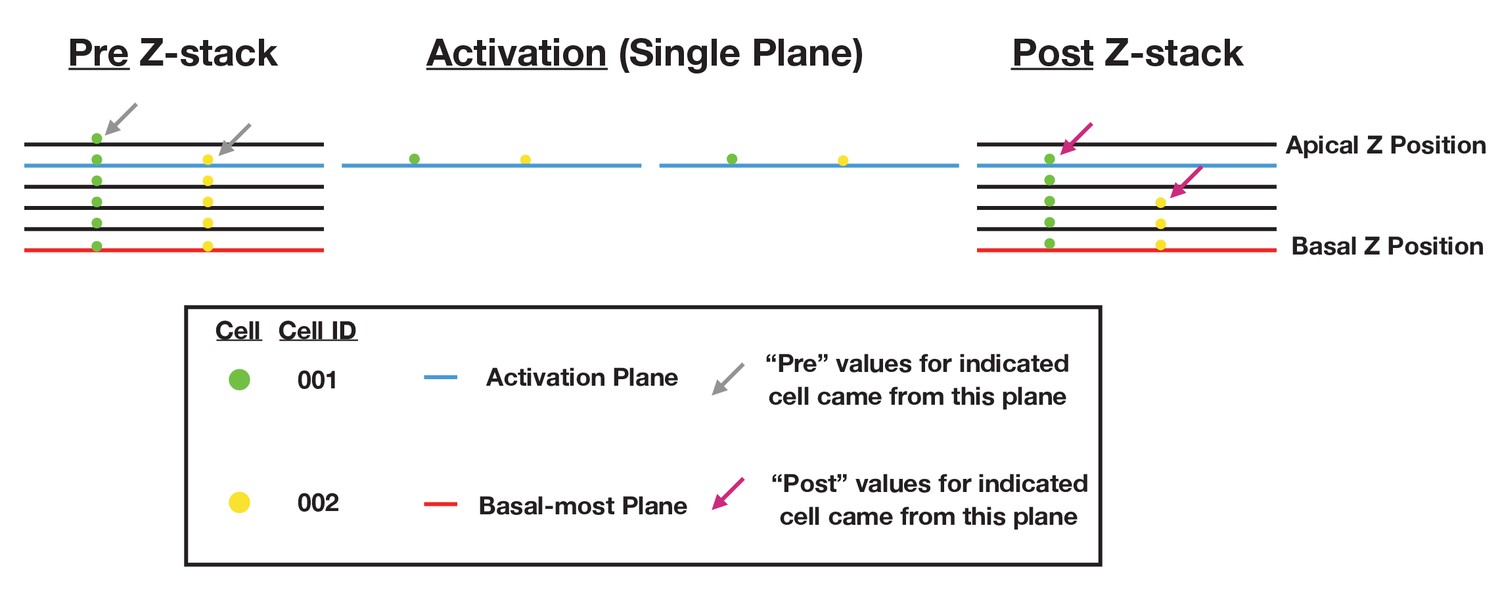
Schematic of data collection and analysis for local activation experiments.
Figure 5 with 1 supplement
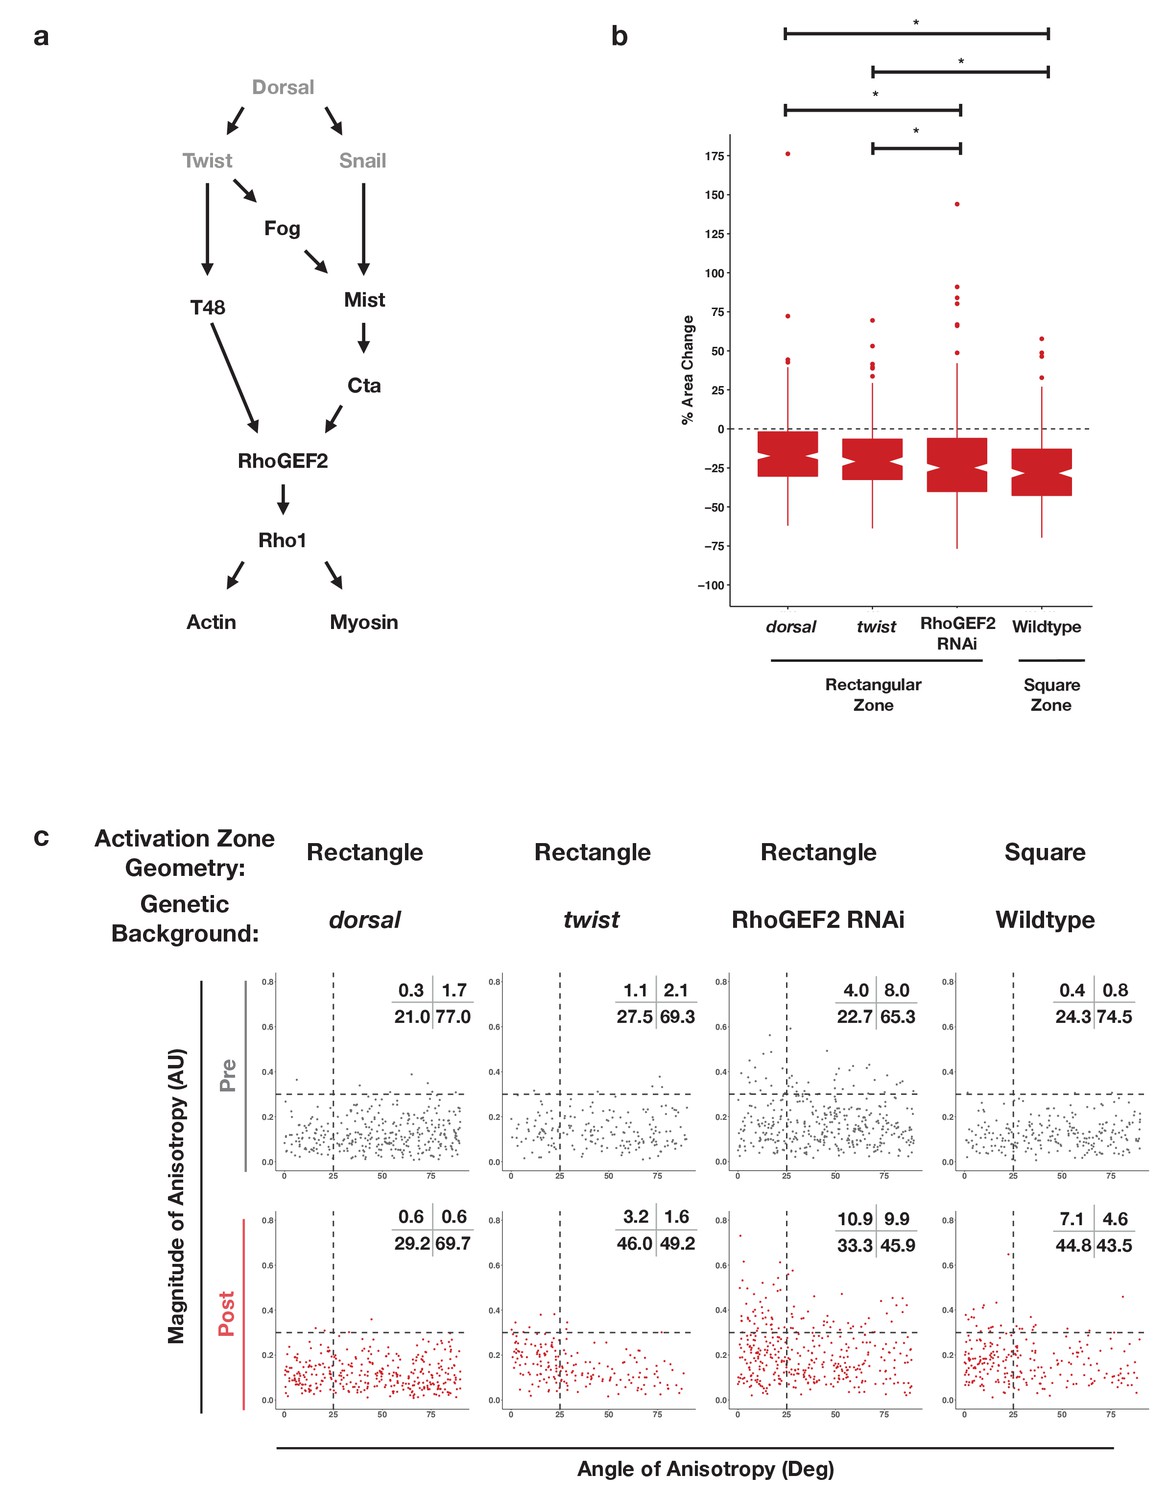
Dorsal is required for and Twist promotes aligned, anisotropic apical constriction in response to ectopic Rho1 activation.
(a) Schematic of genetic logic for ventral cell identity. Gray text indicates transcription factors. (b) Quantification of apical area change induced by optogenetic Rho1 activation in wild-type and mutant backgrounds. Statistical analysis: Kruskal-Wallis test, Chi2 = 37.3, df = 3, p = 4.0 × 10⁻⁸; Pairwise comparisons with Wilcoxon signed rank text, using BH method to adjust for multiple comparisons. * indicates p< 0.05. (c) Anisotropy scatter plots, as in Figure 2b, for wild-type embryos subjected to a square region of ectopic Rho1 activation or specified mutant embryos subjected to a rectangular zone of activation. Insets show percentage of cells in each quadrant. Cells in the upper left quadrant exhibit highly aligned, anisotropic apical constriction. See Figure 5—figure supplement 1 for images of mutant and wild-type embryos following optogenetic activation. See Figure 4—figure supplement 1 for plots of the changes in anisotropy of individual cells. See Figure 4—figure supplement 2 for statistical analysis of data in (c). A total of 343 cells from four dorsal embryos, 189 cells from three twist embryos, 375 from five RhoGEF2 depleted embryos, and 239 cells from five square zone embryos were analyzed.
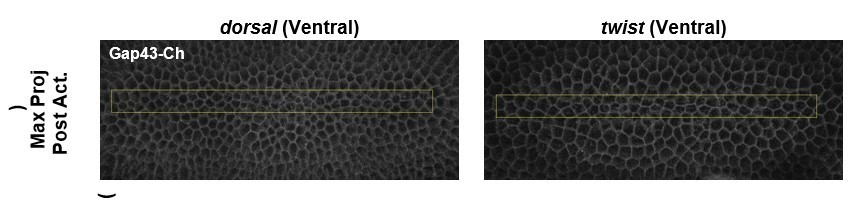
Figure 5—figure supplement 1
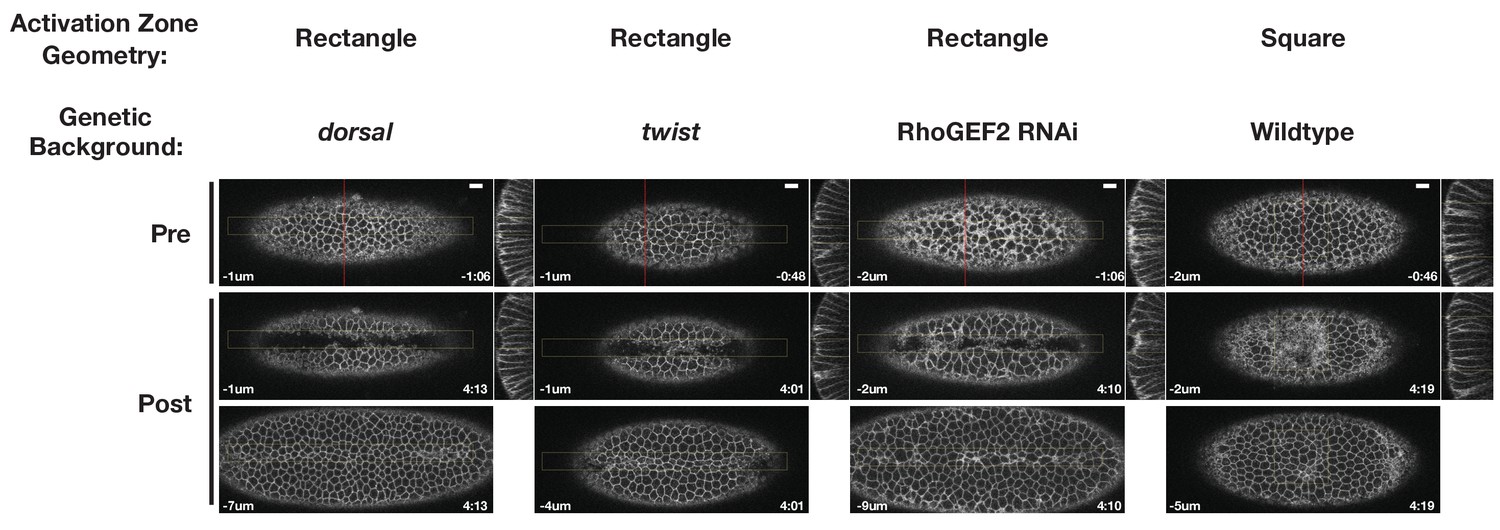
Representative ventral epithelia of embryos expressing the optogenetic components and Gap43-Ch while lacking Dorsal or Twist protein, depleted of RhoGEF2, or subjected to a square zone of Rho1 activation.
These data are quantified in Figure 5. Bottom post-activation images show a selected plane along the apicobasal axis that shows the apical surfaces of activated cells. Scale bars are 10 µm.
Figure 6 with 1 supplement
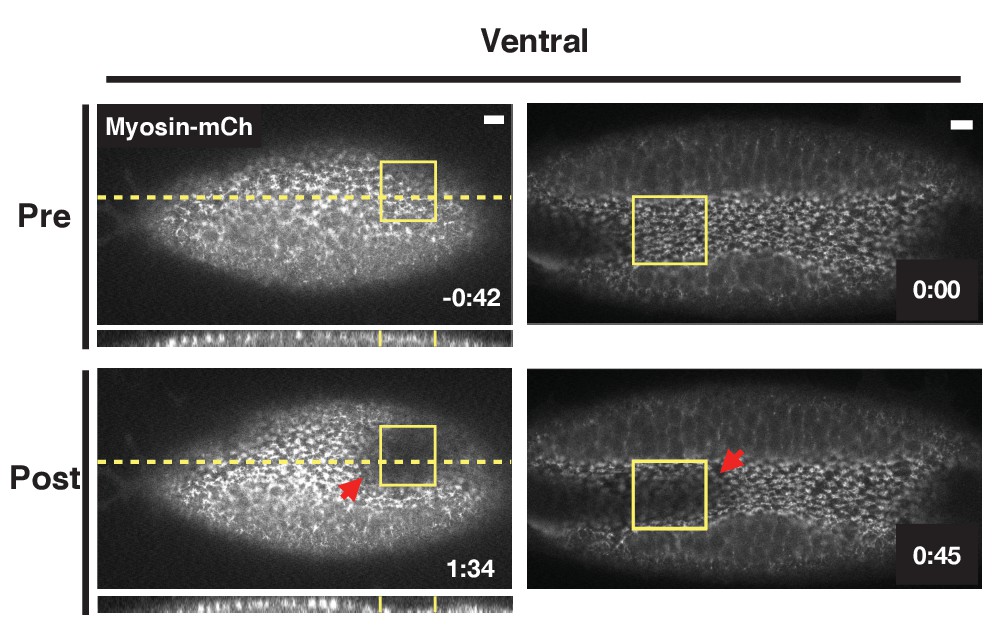
Optogenetic Rho1 activation accelerates the invagination of the endogenous ventral furrow.
Ventral epithelia of two different embryos expressing the optogenetic components and Myosin-Ch and exhibiting an established furrow. Rho1 was activated in the yellow boxes. The acceleration of the invagination of the endogenous ventral furrow extends outside of the zone of optogenetic Rho1 activation (red arrows). Data representative of 3/5 embryos. Scale bars are 10 µm.
Figure 6—video 1
Movie of embryo shown in Figure 6, right panel.
Figure 7
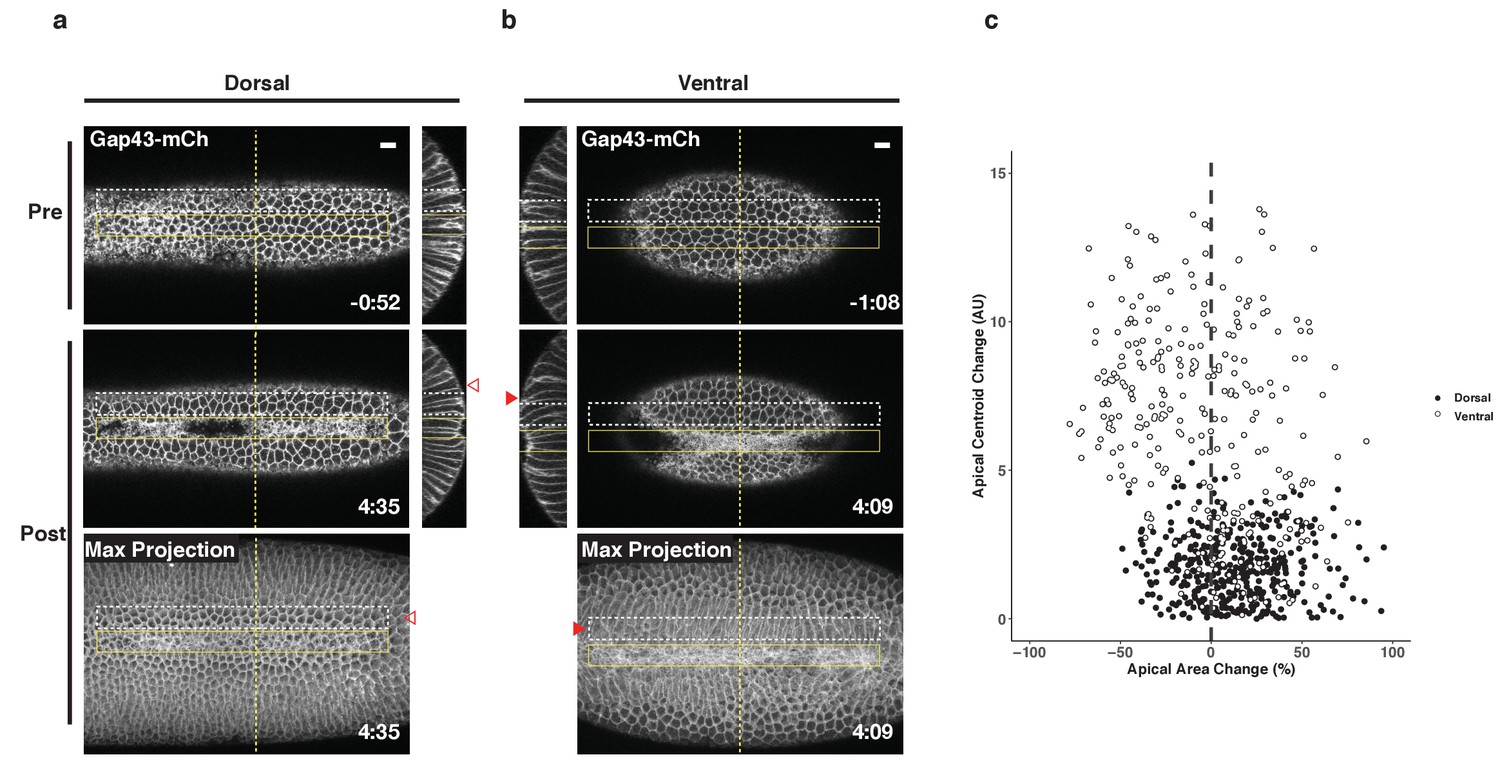
Non-activated cells bend towards ectopic furrows specifically in the ventral epithelium.
(a–b) Dorsal (a) and ventral (b) epithelium of embryos expressing the optogenetic components and Gap43-mCh before the onset of cell shape changes. Local Rho1 activation within the yellow box induces ectopic furrows in both the dorsal and ventral epithelium. Bottom panels: Maximum intensity projections of the indicated time point. Data representative of 4/4 dorsal and 4/4 ventral embryos. (c) Quantification of cell shape changes exhibited by cells neighboring ectopic furrows. X axis is the percent apical area change; Y axis is the change in position of the centroid of the apical cell surface along the dorsal-ventral axis. A total of 407 dorsal cells from four embryos and 298 ventral cells from four embryos were quantified. The white dashed boxes in a and b indicate the 'neighbor' cells that were quantified for these two embryos. Filled arrowheads indicate long-range bending of ventral cells; open arrowheads indicate the corresponding cells in the dorsal epithelium. Dorsal cells at the periphery are not perpendicular to the imaging plane before or after photoactivation and therefore do not appear as hexagons in the maximum intensity projection images. Time zero indicates the first pulse of blue light activation. Scale bars are 10 µm.
Author response image 1
Maximum intensity projections of ventral epithelia of embryos lacking the Dorsal (left) or Twist (right) protein and expressing the optogenetic components and Gap43-Ch.
Rho1 was optogenetically activated in the yellow box.
Tables
Table 1
Recruitable GEF viability tests.
| Cross scored | Possible genotype | Observed | Expected | Chi2 |
|---|---|---|---|---|
| SspB-GFP-LARG(DH)/CyO x SspB-GFP-LARG(DH)/CyO | 1) LARG (DH)/CyO 2) LARG(DH)/LARG(DH) | 379 165 | 362.7 181.3 | 2.198 |
| SspB-GFP-RhoGEF2(DHPH)/CyO x SspB-GFP-RhoGEF2(DHPH)/CyO | 1) RhoGEF2(DHPH)/CyO 2) RhoGEF2(DHPH)/RhoGEF2(DHPH) | 318 54 | 248 124 | 59.27 |
| SspB-GFP-RhoGEF2(DHPH-F1044A,I1046E)/CyO x SspB-GFP-RhoGEF2(DHPH-F1044A,I1046E)/CyO | 1) RhoGEF2(DHPH*)/CyO 2) RhoGEF2(DHPH*)/RhoGEF2(DHPH*) | 430 192 | 414.7 207.3 | 1.694 |
Additional files
-
Supplementary file 1
Plasmids used.
References cited in this file: Guntas et al., 2015; Munjal et al., 2015; Valbuena et al., 2020; Wagner and Glotzer, 2016; Wenzl et al., 2010.
- https://cdn.elifesciences.org/articles/56893/elife-56893-supp1-v2.pdf
-
Supplementary file 2
Genotypes and reproducibility: main figures.
- https://cdn.elifesciences.org/articles/56893/elife-56893-supp2-v2.pdf
-
Supplementary file 3
Genotypes and reproducibility: figure supplements.
- https://cdn.elifesciences.org/articles/56893/elife-56893-supp3-v2.pdf
-
Supplementary file 4
Activation protocols: main figures.
- https://cdn.elifesciences.org/articles/56893/elife-56893-supp4-v2.pdf
-
Supplementary file 5
Activation protocols: figure supplements.
- https://cdn.elifesciences.org/articles/56893/elife-56893-supp5-v2.pdf
-
Transparent reporting form
- https://cdn.elifesciences.org/articles/56893/elife-56893-transrepform-v2.docx
Download links
A two-part list of links to download the article, or parts of the article, in various formats.
Downloads (link to download the article as PDF)
Open citations (links to open the citations from this article in various online reference manager services)
Cite this article (links to download the citations from this article in formats compatible with various reference manager tools)
Rho1 activation recapitulates early gastrulation events in the ventral, but not dorsal, epithelium of Drosophila embryos
eLife 9:e56893.
https://doi.org/10.7554/eLife.56893


