Photosynthetic sea slugs induce protective changes to the light reactions of the chloroplasts they steal from algae
- University of Turku, Department of Biochemistry / Molecular Plant Biology, Finland
Figures
Figure 1
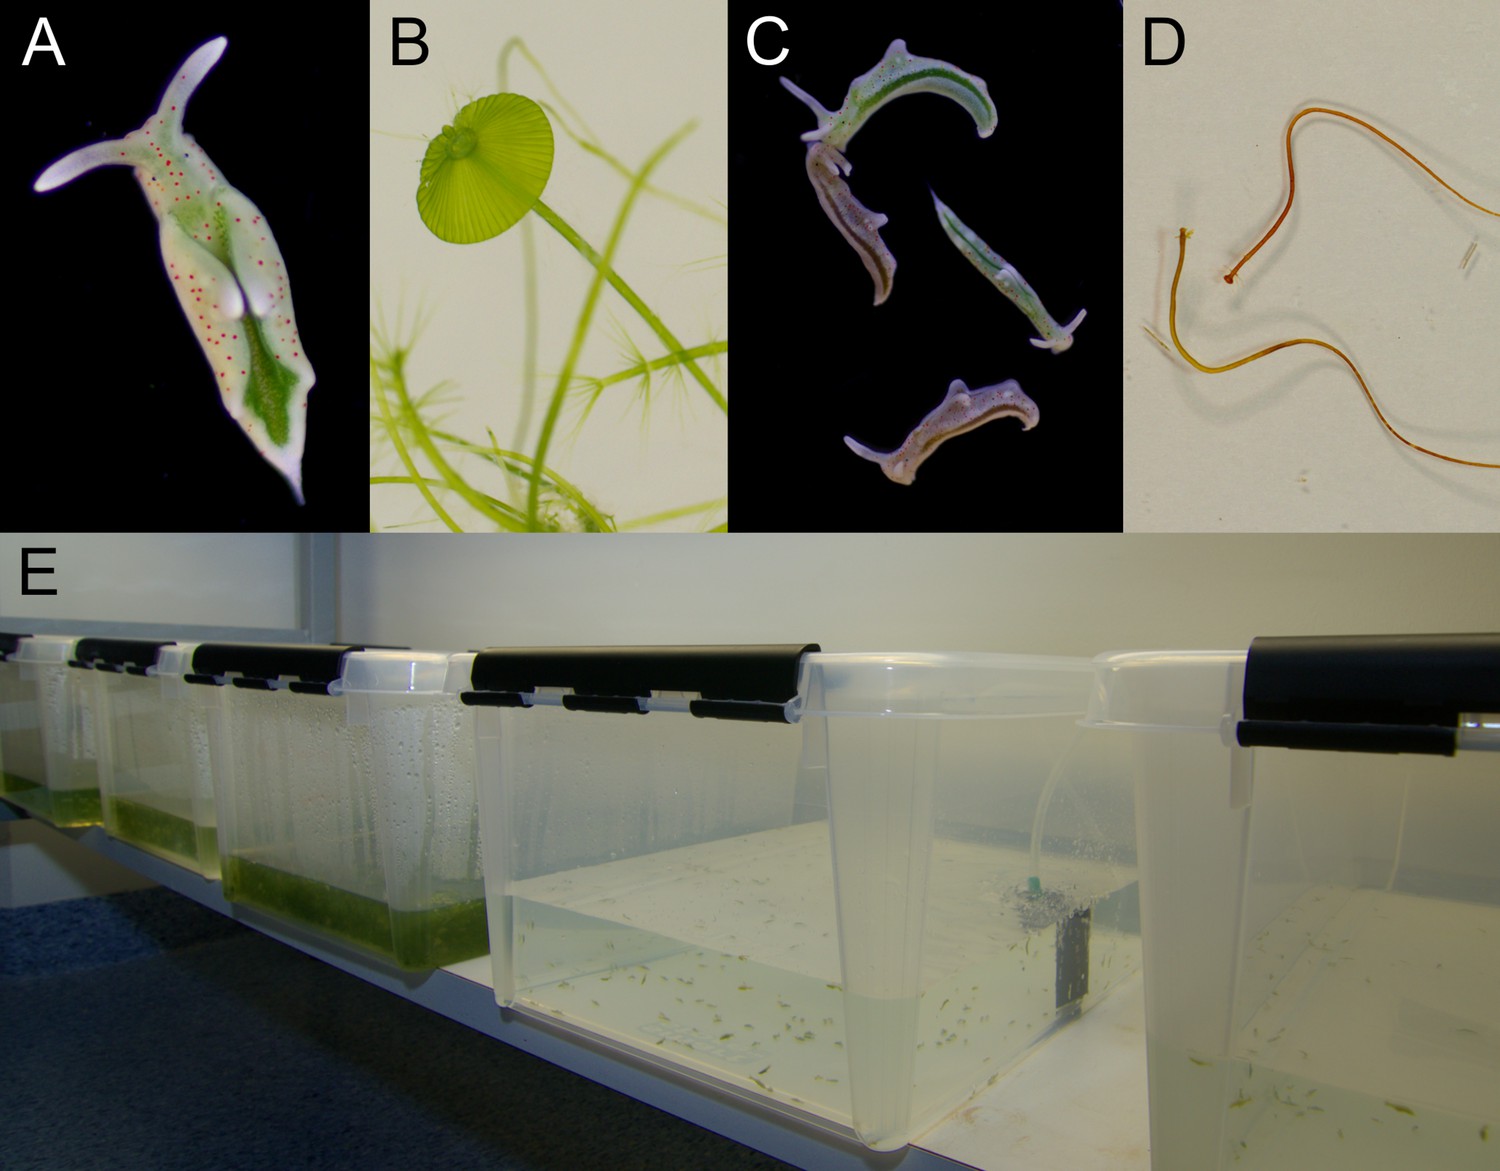
Laboratory cultures of the photosynthetic sea slug E. timida and its prey alga Acetabularia.
(A) A freshly fed adult E. timida individual. The length of an adult slug in our culture conditions is approximately 6 mm. (B) The giant-celled green alga Acetabularia. The cap-like structures are the site of gamete maturation and serve as indicators of the end of the vegetative growth phase of individual Acetabularia cells. The length of an individual Acetabularia cell at the end of the vegetative phase can reach 50 mm. (C) The red morphotype E. timida can be induced by feeding it with red morphotype Acetabularia. Green morphotype E. timida individuals are also shown for reference. (D) Red morphotype Acetabularia can be induced by subjecting the cells to cold temperature and high light (see ‘Materials and methods’ for details). (E) E. timida and Acetabularia can be cultured in transparent plastic tanks. The two tanks in the foreground are E. timida tanks and the three other tanks contain Acetabularia cultures.
Figure 2 with 1 supplement

Differences in QA- reoxidation between E. timida (black) and Acetabularia (red) suggest differences in the redox state of the PQ pool after dark acclimation.
(A–C) Chlorophyll a fluorescence yield decay after a single turnover flash in aerobic conditions without any inhibitors in regular, green morphotypes of E. timida and Acetabularia (A), in aerobic conditions in the presence of 10 µM DCMU (B), and in anaerobic conditions, achieved by a combination of glucose oxidase (eight units/ml), glucose (6 mM) and catalase (800 units/ml), in the absence of inhibitors (C). See Figure 2—figure supplement 1A for details on the anaerobic conditions. (D) Chlorophyll fluorescence decay measured from the red morphotypes of E. timida and Acetabularia in aerobic conditions without any inhibitors. Fluorescence traces were double normalized to their respective minimum (measured prior to the single turnover flash), and maximum fluorescence levels. Curves in (A) are averages from 7 (E. timida) and 5 (Acetabularia) biological replicates, 4 and 5 in (B), and 5 and 5 in (C–D), respectively. The shaded areas around the curves represent SE. All E. timida data are from individuals taken straight from the feeding tanks without an overnight starvation period. See Figure 2—source data 1 for original data.
-
Figure 2—source data 1
Source data of chlorophyll fluorescence measurements shown in Figure 2.
- https://cdn.elifesciences.org/articles/57389/elife-57389-fig2-data1-v2.xlsx
Figure 2—figure supplement 1
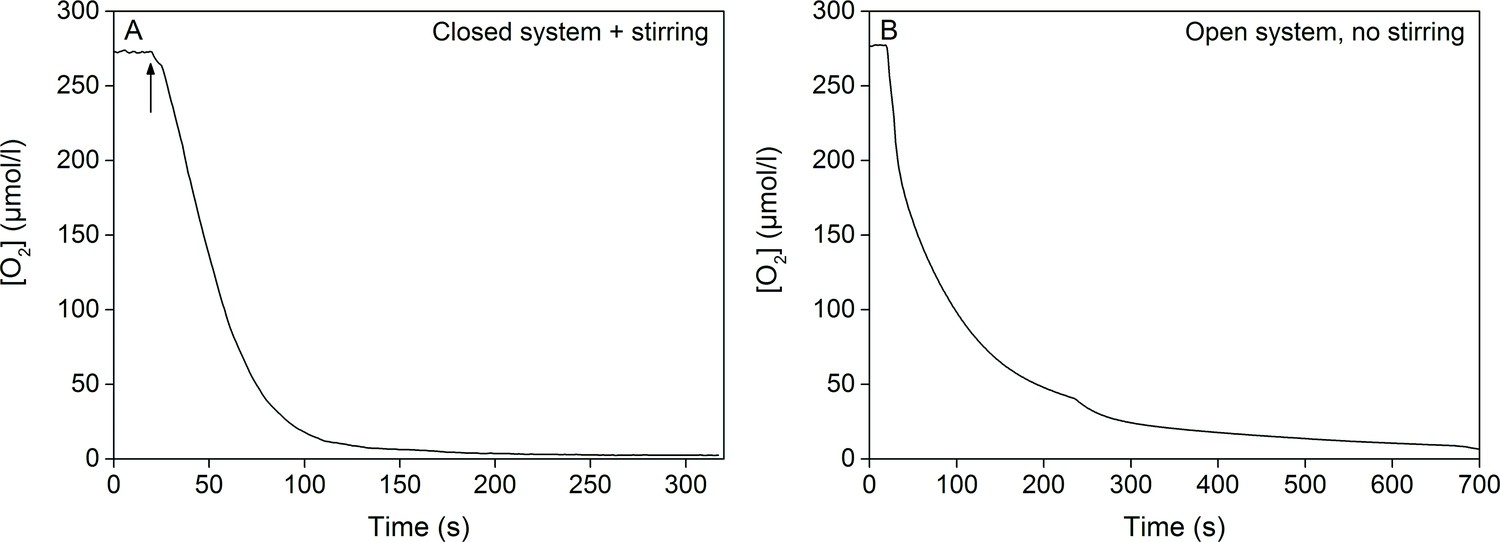
Oxygen consumption by the glucose oxidase system (eight units/ml glucose oxidase, 6 mM glucose and 800 units/ml catalase) in room temperature.
(A) Oxygen concentration in 250 ml of ASW medium inside a sealed bottle with minimal head space, stirred with a magnet, before and after the addition of glucose oxidase. The arrow indicates the point where the last component of the glucose oxidase system (glucose oxidase) was added into the mixture, after which the bottle was sealed. (B) Oxygen concentration in 2 ml of ASW medium in an open cuvette without any stirring. The glucose oxidase system had been activated in a separate, sealed 5 ml vial 5 min prior to pipetting 2 ml of the activated mixture into an empty measuring cuvette. Oxygen concentration in (A) and (B) was measured with an optode-type oxygen meter FireStingO2 (PyroScience GmbH, Aachen, Germany) using optically isolated oxygen sensor spots according to manufacturer’s instructions.
Figure 3 with 1 supplement
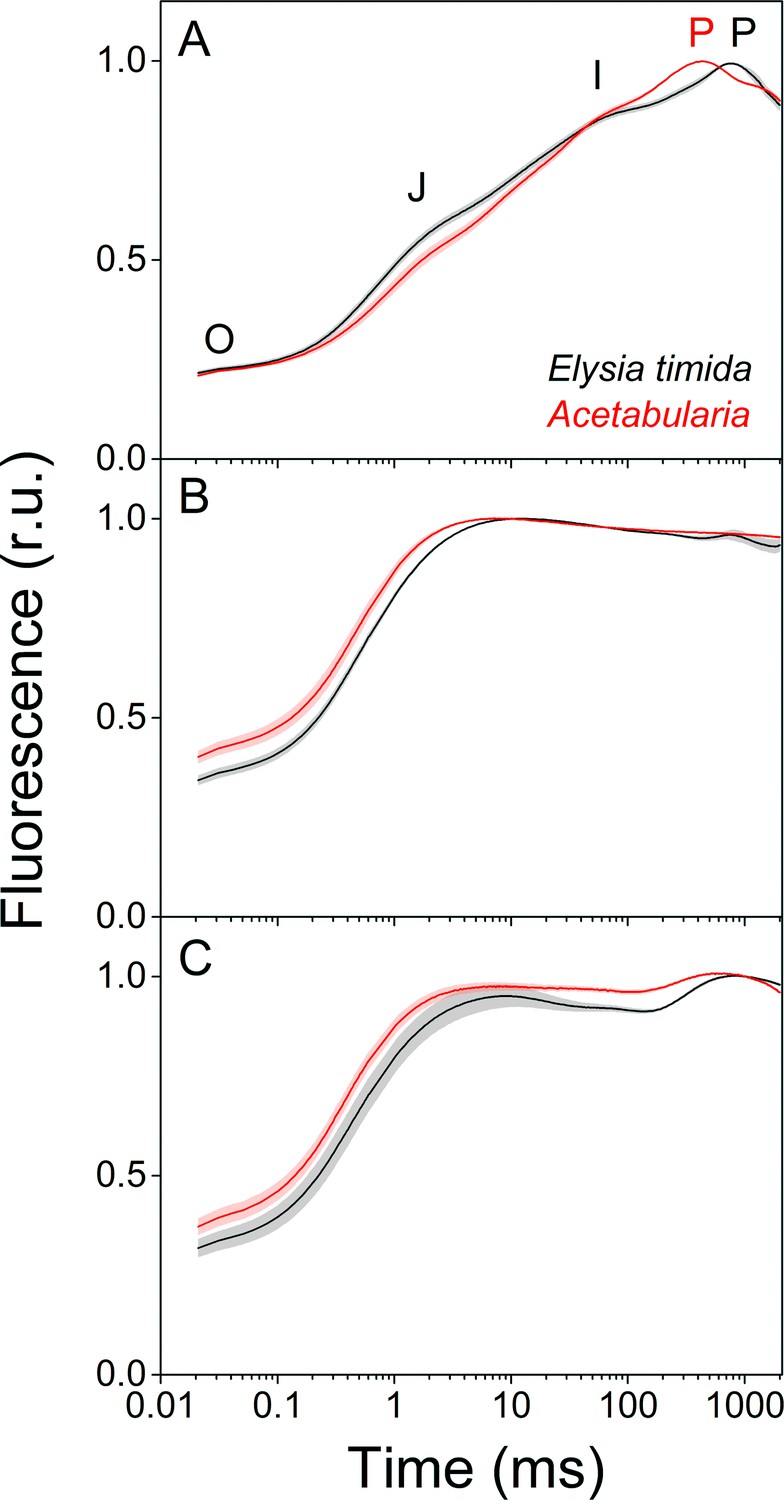
Fluorescence induction kinetics during dark-to-light transition suggest differences in full photochemical reduction of the PQ pool between E. timida (black) and Acetabularia (red).
(A–C) Multiphase chlorophyll a fluorescence induction transient (OJIP) measured from dark acclimated E. timida and Acetabularia in aerobic conditions without any inhibitors (A), in the presence of 10 µM DCMU (B), and in anaerobic conditions, achieved by a combination of glucose oxidase (eight units/ml), glucose (6 mM) and catalase (800 units/ml), without any inhibitors (C). Fluorescence traces were normalized to their respective maximum fluorescence levels. For unnormalized data, see Figure 3—figure supplement 1B. Curves in (A) are averages from 10 (E. timida) and 12 (Acetabularia) biological replicates, 10 and 9 in (B), and 13 and 11 in (C), respectively. The shaded areas around the curves represent SE. All E. timida data are from individuals taken straight from the feeding tanks without an overnight starvation period. See Figure 3—source data 1 for original data.
-
Figure 3—source data 1
Source data of OJIP measurements shown in Figure 3.
- https://cdn.elifesciences.org/articles/57389/elife-57389-fig3-data1-v2.xlsx
Figure 3—figure supplement 1
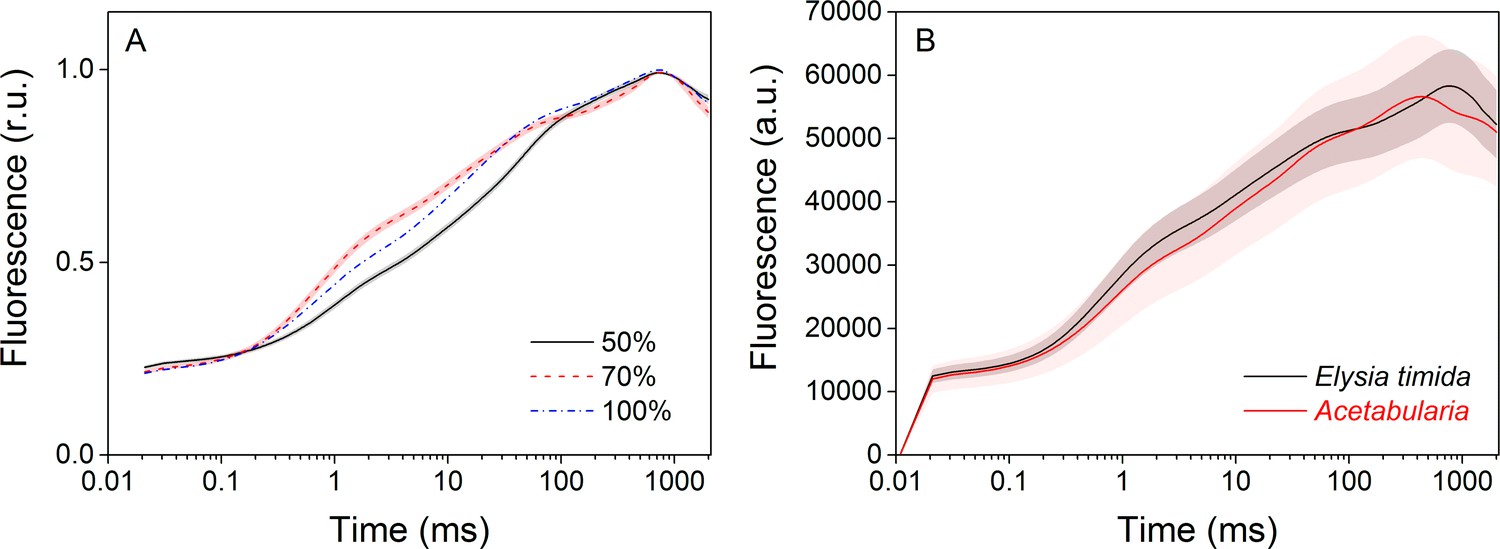
Technical considerations of the OJIP fluorescence induction measurements.
(A) Increasing the saturating pulse intensity from 50% of the maximum (black solid line) to 70% (red dashed line) or 100% (PPFD 3000 µmol m−2s−1; blue dash-dot line) in E. timida measurements alters the O-J-I phases, but the intensity of the saturating pulse does not change the time required to reach maximum fluorescence. The data for the saturating pulse intensity 70% are taken from Figure 3A. The curve for the 50% saturating pulse represents an average from 12 biological replicates, and a representative curve is shown for the 100% intensity measurement, because raising the saturating pulse intensity to > 70% often resulted in oversaturation of the fluorescence signal in E. timida. (B) Original, unnormalized fluorescence traces from the data shown in Figure 3A, representing averages from 10 (E. timida) and 12 (Acetabularia) biological replicates. Shaded areas around the curves represent SE. All E. timida data are from individuals taken straight from the feeding tanks, without an overnight starvation period.
Figure 4 with 1 supplement
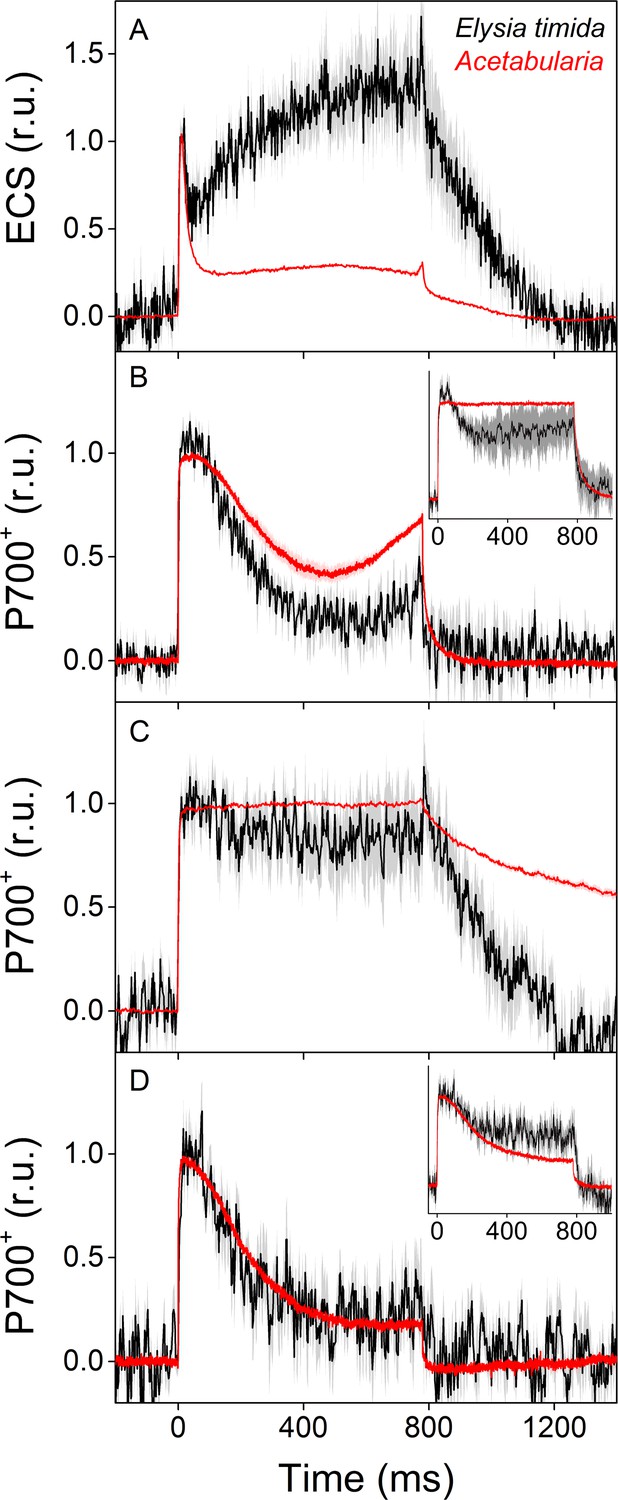
ECS and P700+ measurements indicate differences in proton motive force formation and utilization of alternative electron acceptors of PSI between dark acclimated E. timida (black) and Acetabularia (red) during a 780 ms high-light pulse.
(A) ECS measured from E. timida and Acetabularia upon exposure to a high-light pulse in aerobic conditions. (B) P700 redox kinetics upon exposure to a high-light pulse in aerobic conditions without any inhibitors. The inset shows P700 redox kinetics from the same samples during a second high-light pulse, fired 10 s after the first one. (C) P700 oxidation kinetics in the presence of 10 µM DCMU. (D) P700 oxidation kinetics in the absence of DCMU in anaerobic conditions, achieved by a combination of glucose oxidase (8 units/ml), glucose (6 mM) and catalase (800 units/ml). The inset shows P700 oxidation kinetics from the same samples during the second high-light pulse. ECS and P700+ transients were double normalized to their respective dark levels (measured prior to the onset of the high-light pulse), and to the initial ECS or P700+ peak (measured immediately after the onset of the pulse). Curves in (A) are averages from 13 (E. timida) and 6 (Acetabularia) biological replicates, 7 and 3 in (B), 13 and 4 in (C), and 8 (7 in inset) and three in (D), respectively. The shaded areas around the curves represent SE. All E. timida data are from individuals taken straight from the feeding tanks, without an overnight starvation period. See Figure 4—source data 1 for original data.
-
Figure 4—source data 1
Source data of ECS and P700+ measurements shown in Figure 4.
- https://cdn.elifesciences.org/articles/57389/elife-57389-fig4-data1-v2.xlsx
Figure 4—figure supplement 1
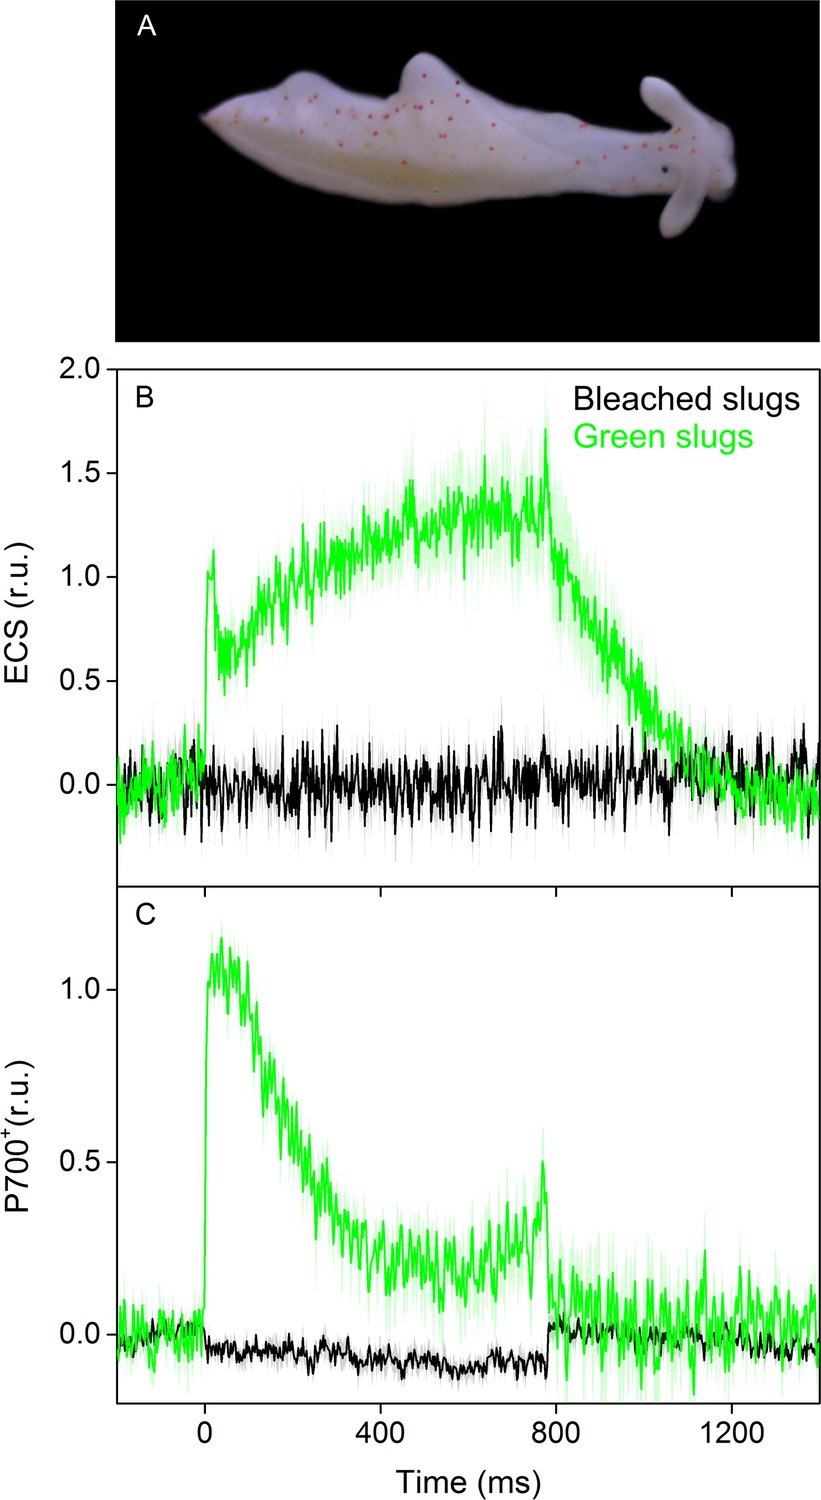
ECS and P700+ signals from bleached E. timida individuals during a 780 ms high light pulse.
(A) Bleached E. timida slugs were created by exposing them to 1 week starvation in high light (Ikea Växer PAR30 E27, 10 W; PPFD > 1000 µmol m−2s−1; 12/12 h day/night cycle) in otherwise normal growth conditions. (B) ECS and (C) P700+ signal from bleached slugs (black), measured using the same protocol as with green slug individuals (green; data from Figure 4A and B are shown for reference). ECS and P700+ transients were double normalized to their respective dark levels (measured prior to the onset of the high-light pulse) and to the maximum signal immediately after the light pulse measured from the green slugs. Each curve from bleached slugs in (B) and (C) represents an average of five biological replicates. The shaded areas around the curves represent SE. See Figure 4—figure supplement 1—source data 1 for original data.
-
Figure 4—figure supplement 1—source data 1
Source data of ECS and P700+ measurements shown in Figure 4—figure supplement 1.
- https://cdn.elifesciences.org/articles/57389/elife-57389-fig4-figsupp1-data1-v2.xlsx
Figure 5 with 1 supplement
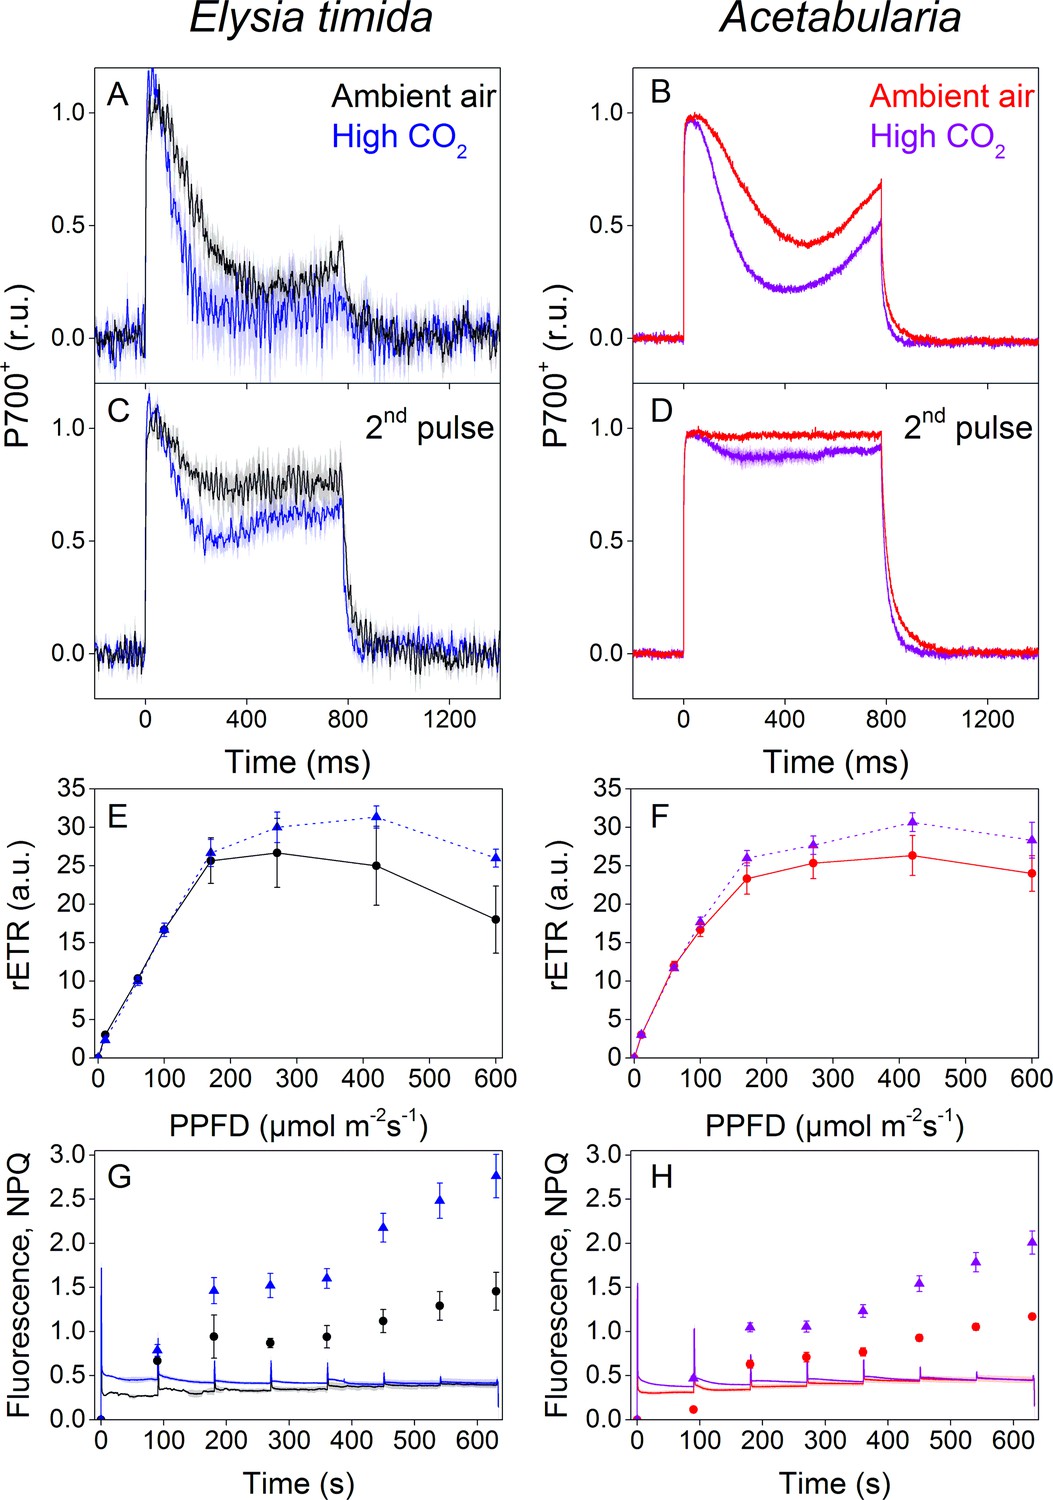
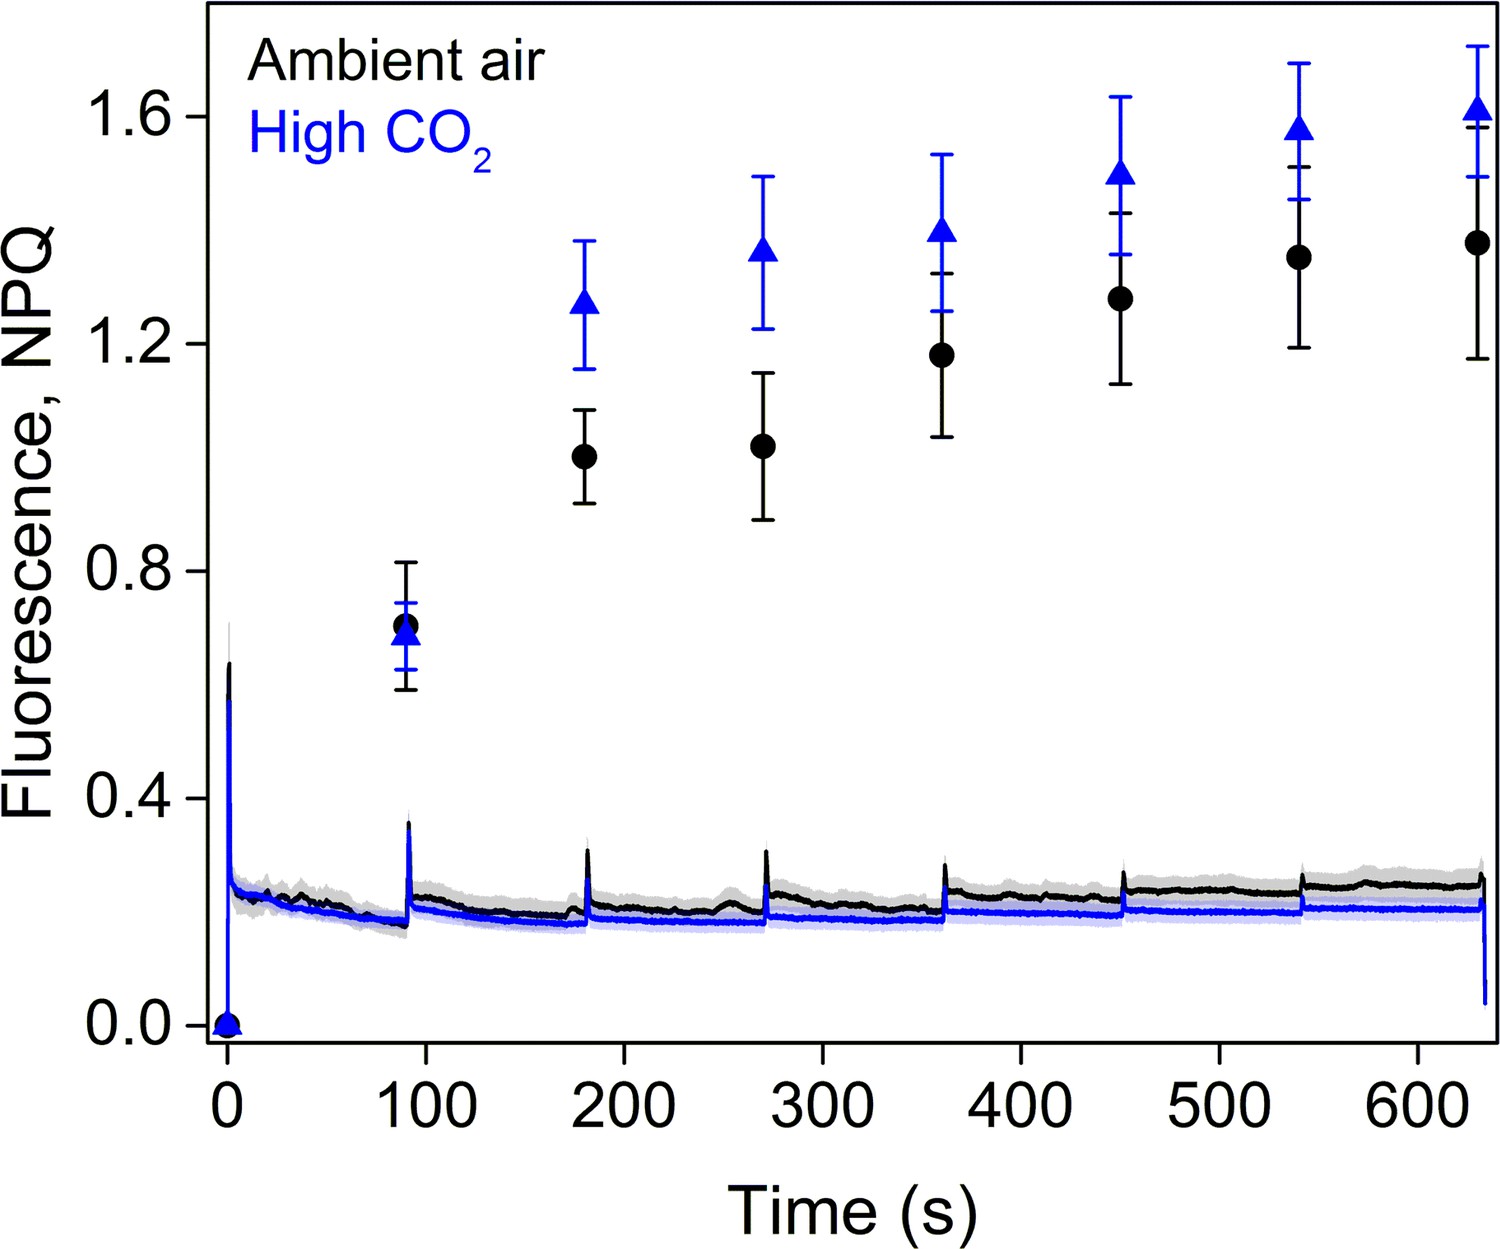
P700 redox kinetics, photosynthetic electron transfer and photoprotective NPQ levels in E. timida kleptoplasts (left panels) are affected by the CO2 acclimation state of its feedstock Acetabularia (right panels).
(A–B) P700 redox kinetics in dark acclimated ambient-air (black) and high-CO2 E. timida (blue) (A) and ambient-air (red) and high-CO2 Acetabularia (purple) (B) upon exposure to a 780 ms high-light pulse. The ambient-air Acetabularia data are the same as in Figure 4B and are shown here for reference. (C–D) P700 redox kinetics during a second light pulse, fired 10 s after the first pulse, shown in panels A-B, in ambient-air and high-CO2 E. timida (C) and ambient-air and high-CO2 Acetabularia (D). The ambient-air Acetabularia data are the same as in Figure 4B inset and are shown here for reference. (E–F) RLC measurements from dark acclimated ambient-air (black solid line) and high-CO2 E. timida (blue dashed line) (E) and ambient-air (red solid line) and high-CO2 Acetabularia (purple dashed line) (F). Illumination at each light intensity (PPFD) was continued for 90 s prior to firing a saturating pulse to determine relative electron transfer rate of PSII (rETR). E. timida individuals used in RLC measurements were fixed in 1% alginate for the measurements (see ‘Materials and methods’ and Figure 5—figure supplement 1 for details). (G–H) Fluorescence traces and NPQ during the RLC measurements from ambient-air and high-CO2 E. timida (G) and ambient-air and high-CO2 Acetabularia (H). P700+ transients were double normalized to their respective dark levels and to the P700+ peak measured immediately after the onset of the pulse. Curves in (A) are averages from 7 (ambient-air E. timida) and 8 (high-CO2 E. timida) biological replicates, 7 and 8 in (C), and 3 and 3 in (E,G), respectively. High-CO2 Acetabularia curves in (B,D) are averages from three biological replicates. Ambient-air and high-CO2 Acetabularia curves in (F,H) are averages from three biological replicates. Shaded areas around the curves and error bars show SE. rETR and NPQ were calculated as described in ‘Materials and methods’. All E. timida individuals used in panels (A,C,E,G) were allowed to incorporate the chloroplasts for an overnight dark period in the absence of Acetabularia prior to the measurements. See Figure 5—source data 1 for original data.
-
Figure 5—source data 1
Source data of P700+ and fluorescence measurements shown in Figure 5.
- https://cdn.elifesciences.org/articles/57389/elife-57389-fig5-data1-v2.xlsx
Figure 5—figure supplement 1
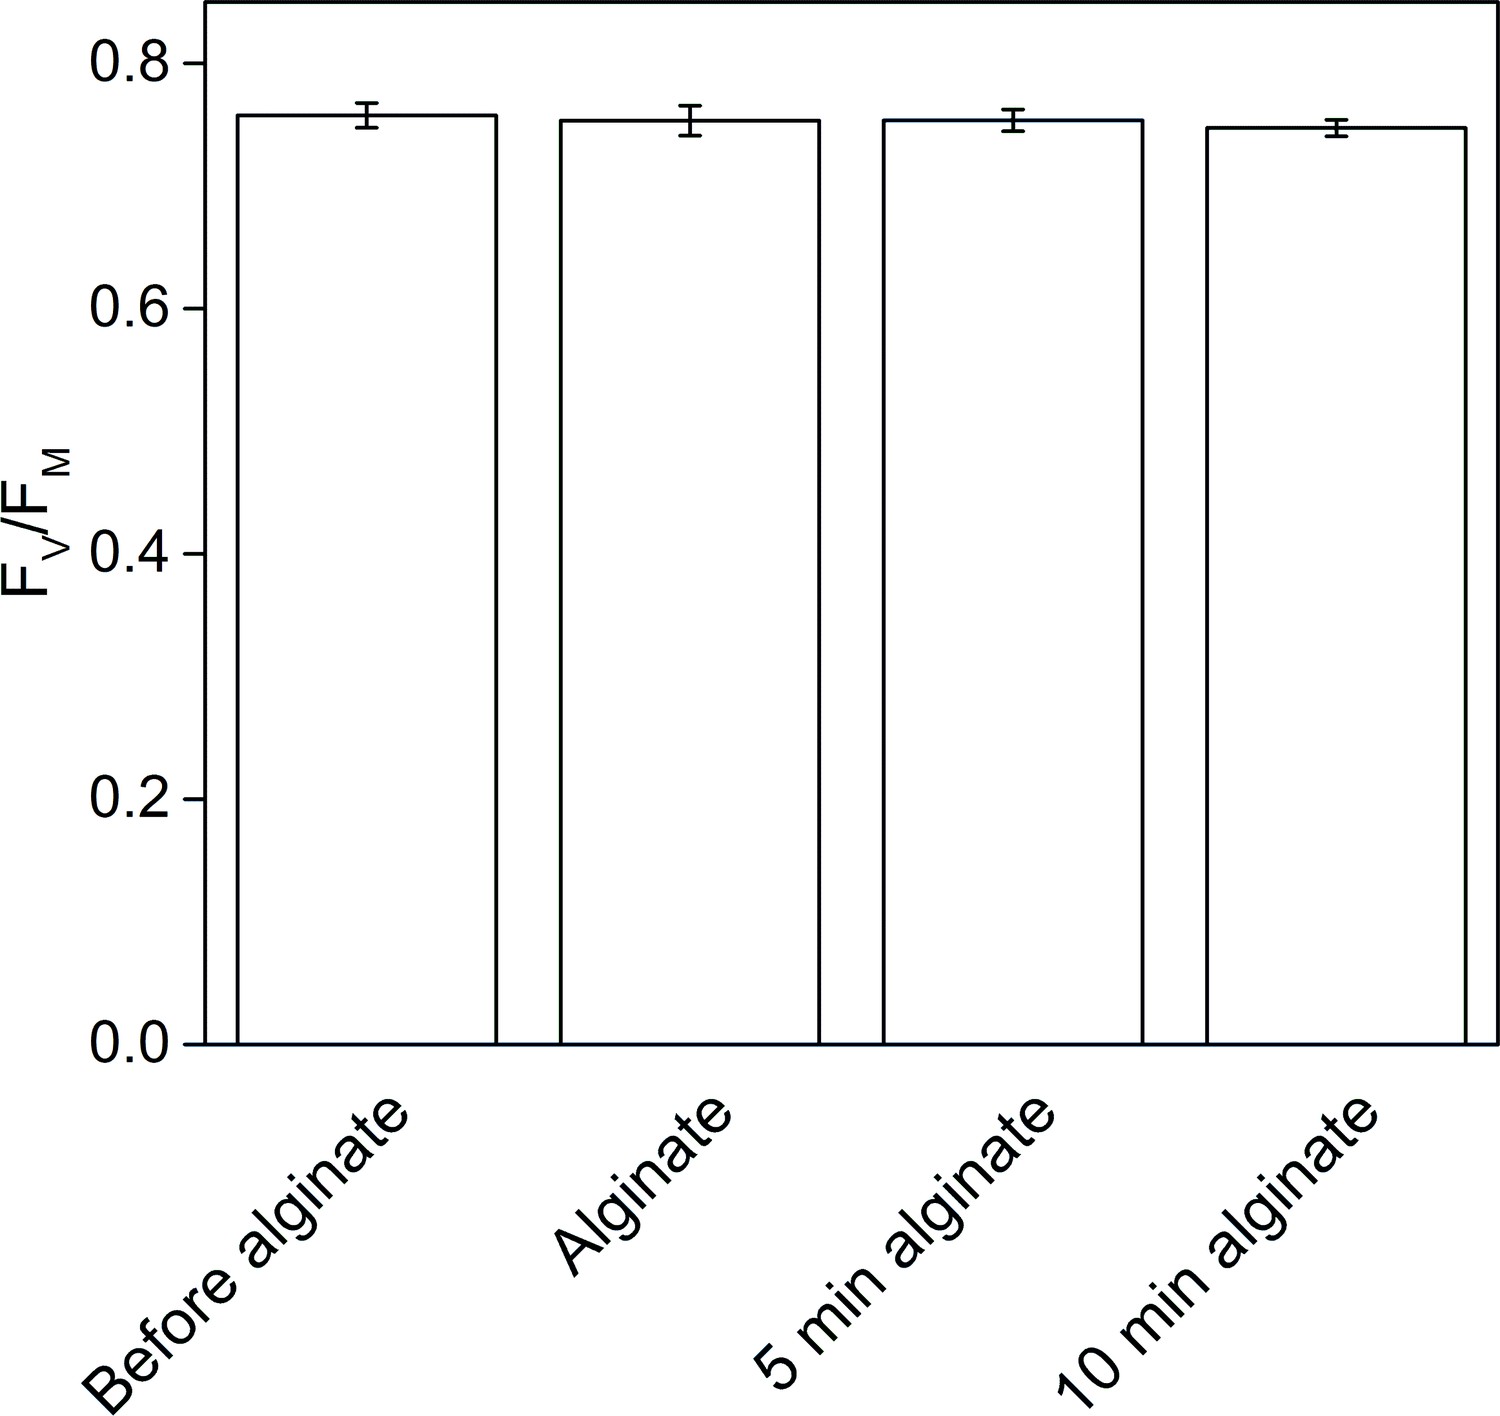
The effect of alginate fixation on the maximum quantum yield of PSII (FV/FM).
Slug individuals were separately fixed in alginate and FV/FM was monitored before the fixation, immediately after the fixation, and after 5 and 10 min in fixation. The slugs had been in the dark for 20 min before the first measurement and another 20 min dark period preceded the alginate fixation. The rest of the measurements were done at 5 min intervals, keeping the samples in the dark between the measurements. All data are averages from three biological replicates, and the error bars indicate SE.
Figure 6
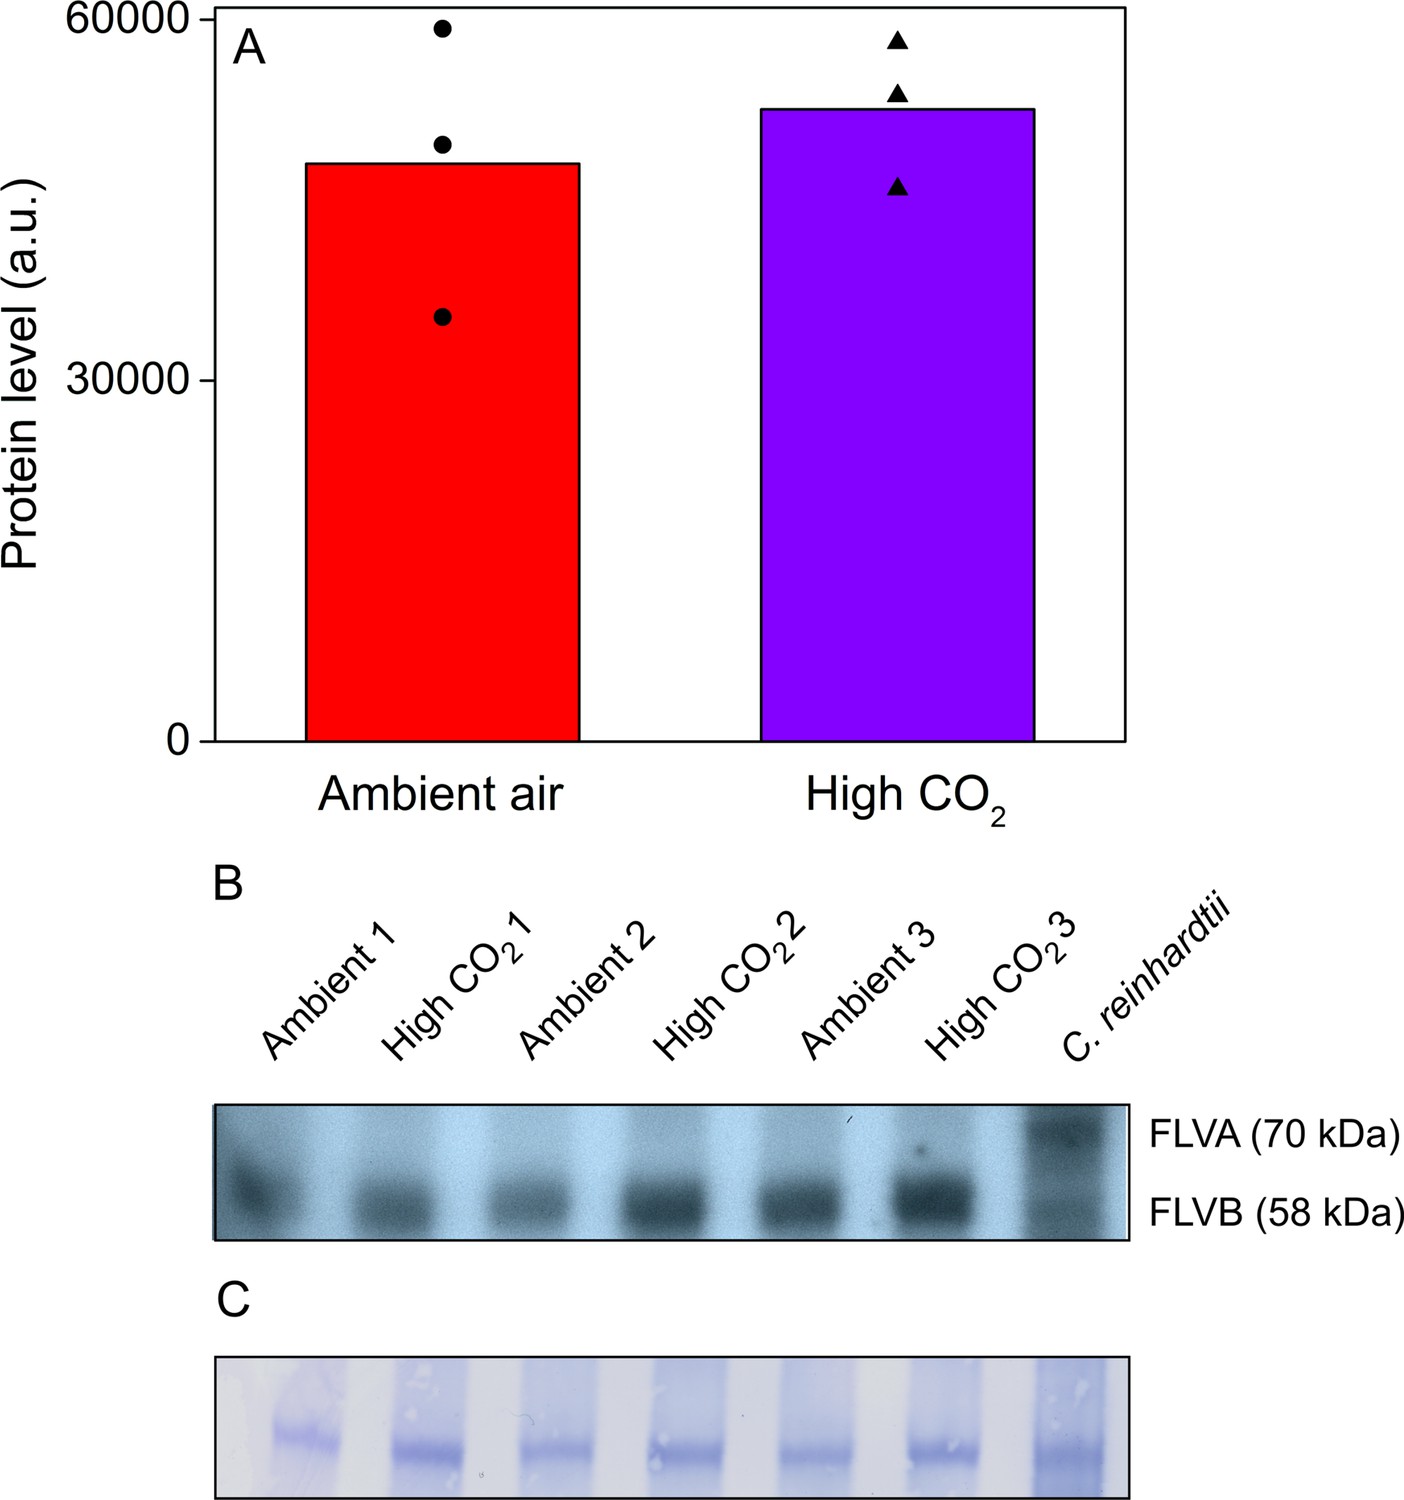
Acetabularia FLV levels in ambient air and high CO2.
(A) Densitometric quantification of immunodetected FLV bands from Acetabularia grown in ambient air and high CO2 conditions. Bars indicate average protein levels and symbols show original data points. Student’s t-test indicated no significant differences between the treatments (p=0.594, n = 3). (B) Western blot used for protein quantification in (A). FLV proteins were detected from total protein extracts using an antibody raised against C. reinhardtii FLVB. The antibody reacts with both FLVA and FLVB proteins of C. reinhardtii (Jokel et al., 2015). Wild-type C. reinhardtii (strain CC406) total protein extract was used as a positive control and FLVA/B bands with their respective sizes are indicated. The lanes in (B) represent separate biological replicates. Samples were loaded on total protein basis (25 µg protein/well). (C) Coomassie-stained membrane from the blot in (B). See Figure 6—source data 1 for original data of (B).
-
Figure 6—source data 1
Original blots and membranes of Figure 6B.
- https://cdn.elifesciences.org/articles/57389/elife-57389-fig6-data1-v2.docx
Figure 7 with 1 supplement
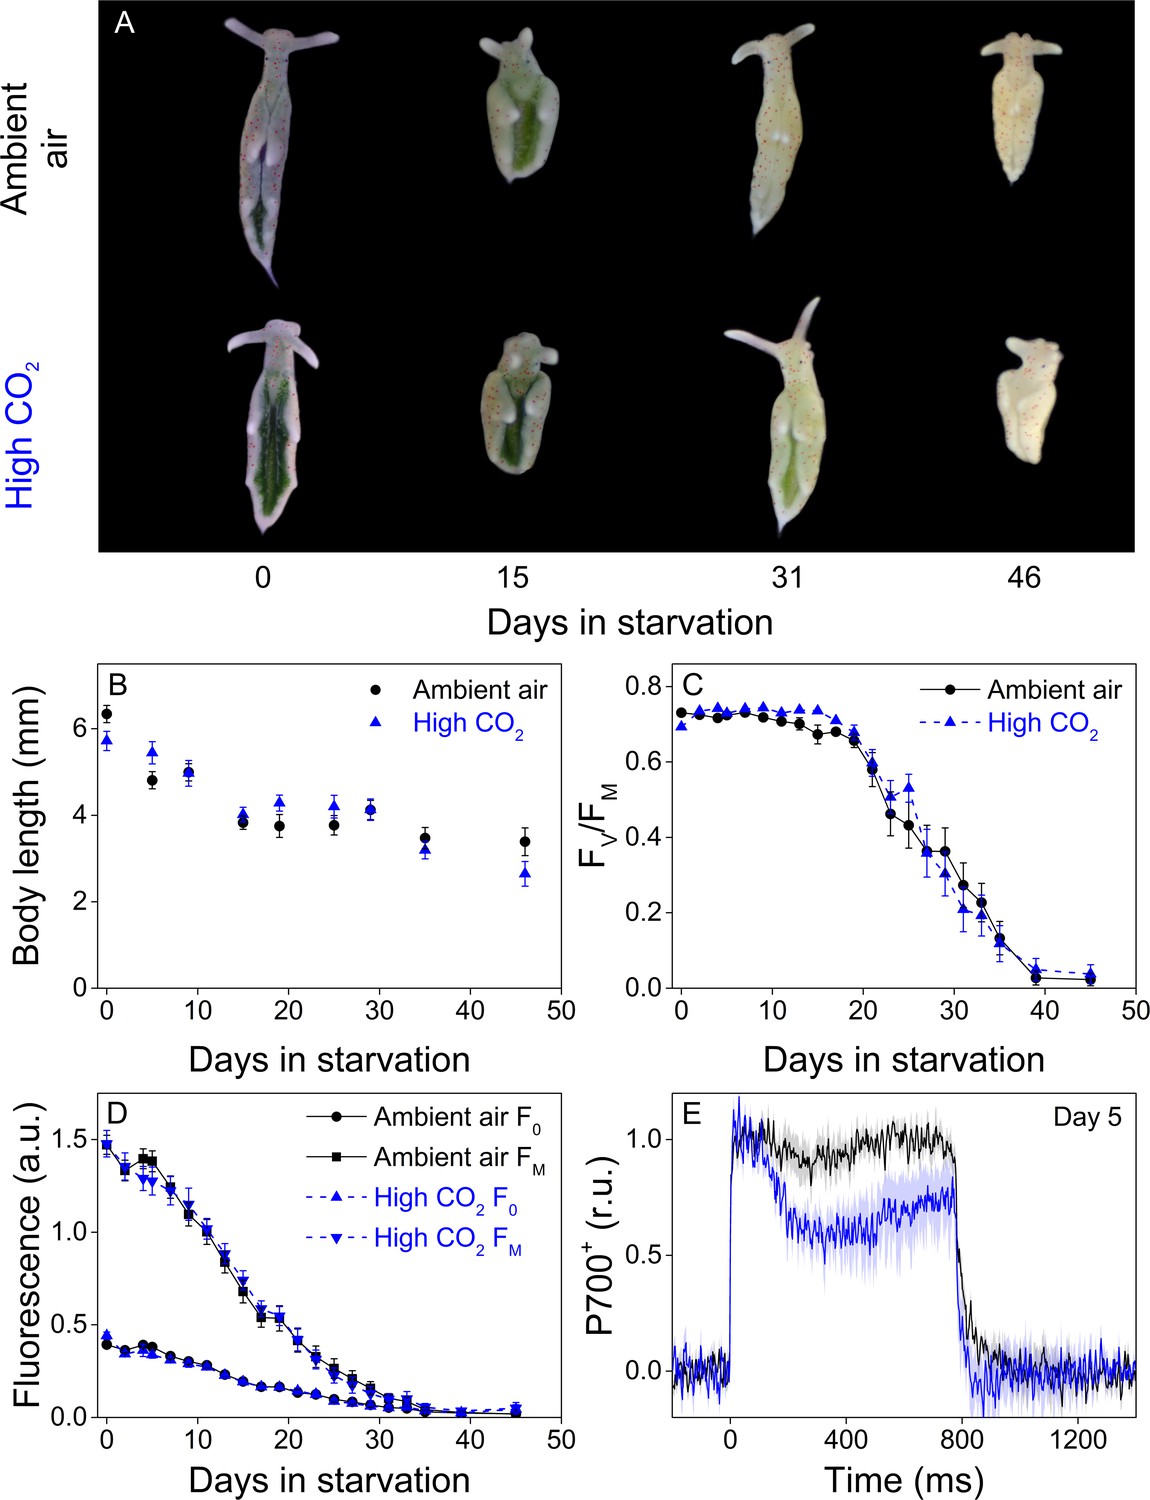
Altered P700 oxidation capacity does not affect chloroplast longevity in E. timida during starvation in steady-light conditions.
(A–B) Coloration of selected individuals (A) and body length (B) of the ambient-air (black) and high-CO2 E. timida (blue) slugs during steady-light starvation. The slug individuals in (A) do not show the actual scale of the slugs with respect to each other. (C–D) Maximum quantum yield of PSII photochemistry (FV/FM) (C) and minimum (F0) and maximum chlorophyll a fluorescence (FM) (D) during starvation in ambient-air (black) and high-CO2 E. timida (blue). (E) Second pulse P700 oxidation kinetics after 5 days in steady-light starvation in ambient-air (black) and high-CO2 E. timida (blue). Steady-light starvation light regime was 12/12 h day/night and PPFD was 40 µmol m−2s−1 during daylight hours. See Figure 7—figure supplement 1 for the spectra of lamps used in starvation experiments. All data in (B–D) represent averages from 50 to 8 biological replicates (see ‘Materials and methods’ for details on mortality and sampling) and error bars show SE. P700+ transients in were double normalized to their respective dark levels and to the P700+ peak measured immediately after the onset of the pulse, and the curves in (E) represent averages from 7 (ambient air E. timida) and five biological replicates (high-CO2 E. timida) and the shaded areas around the curves show SE. See Figure 7—source data 1 for original data from panels B-E.
-
Figure 7—source data 1
Original data from starvation in steady light.
- https://cdn.elifesciences.org/articles/57389/elife-57389-fig7-data1-v2.xlsx
Figure 7—figure supplement 1
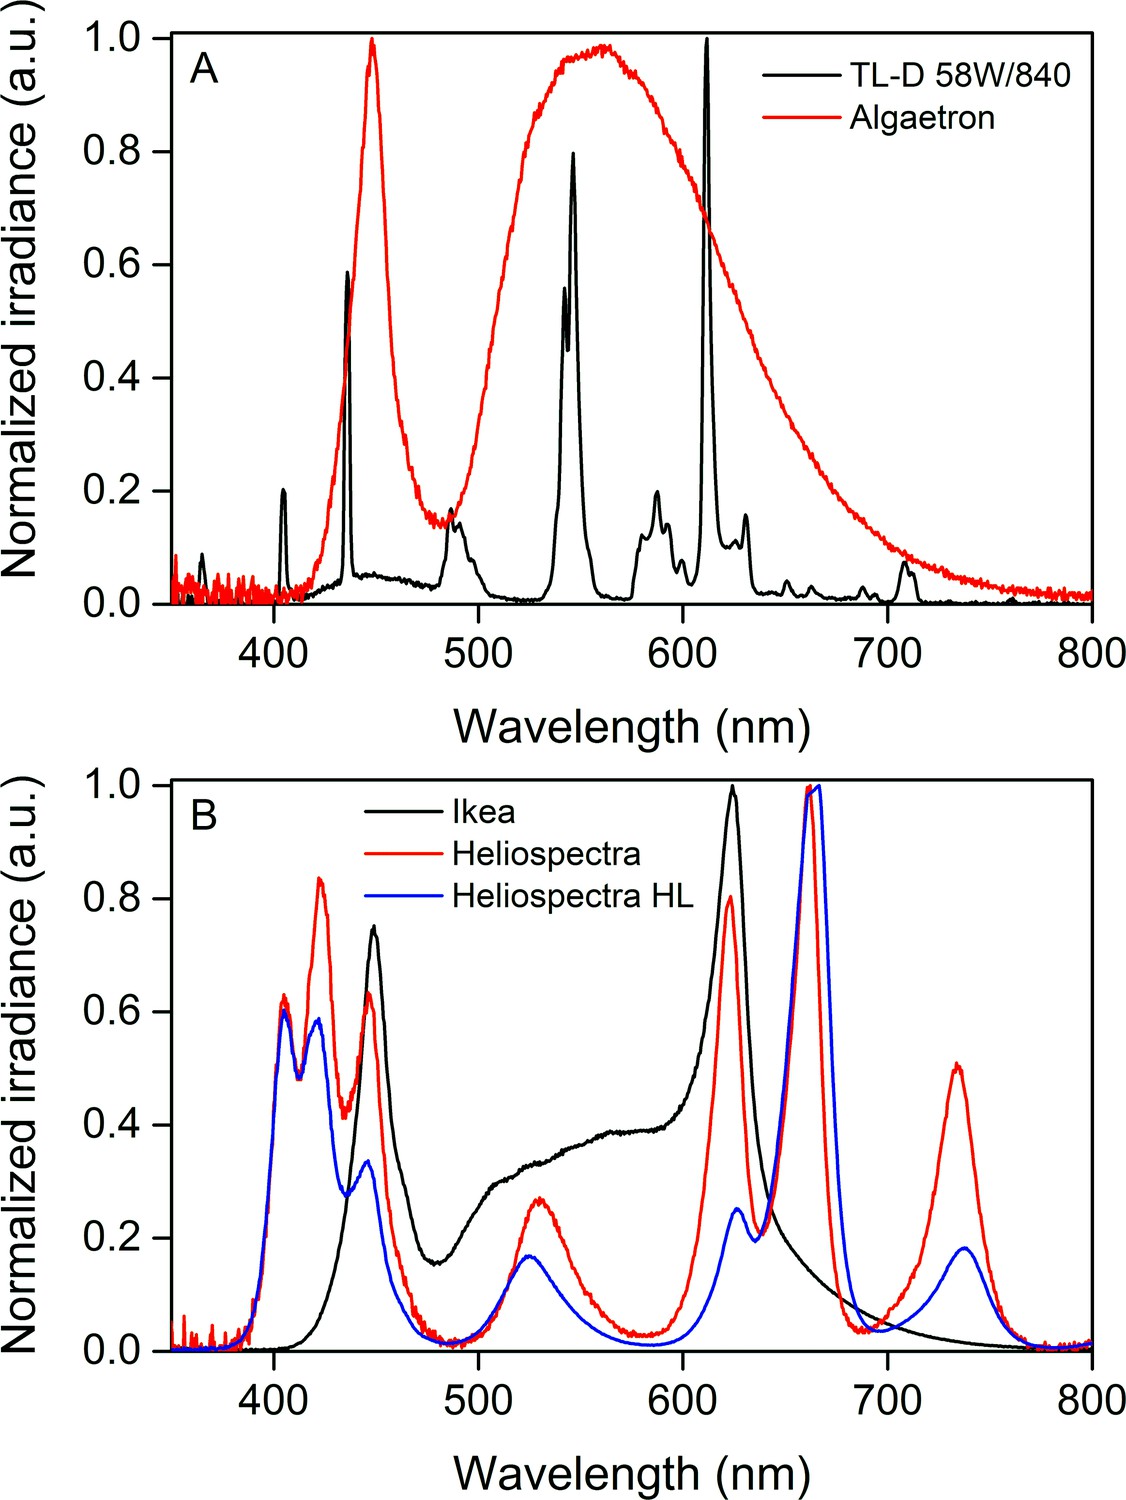
Normalized irradiance spectra from different light sources used in the study.
(A) Growth light spectra, TL-D 58W/840 New Generation fluorescent tube (black) and Algaetron AG230 LED array (red), used as illumination in regular growth conditions and during acclimation to high CO2, respectively. (B) Light sources used in the starvation experiments: Ikea Växer PAR30 E27, 10 W (black) was used for the starvation experiment in steady light; Heliospectra L4A greenhouse lamp was used for the starvation experiment in fluctuating light, and the spectra are from moderate light conditions (PPFD 40 µmol m−2s−1; red) and during a high-light (HL) pulse (PPFD 1500 µmol m−2s−1; blue).
Figure 8 with 1 supplement
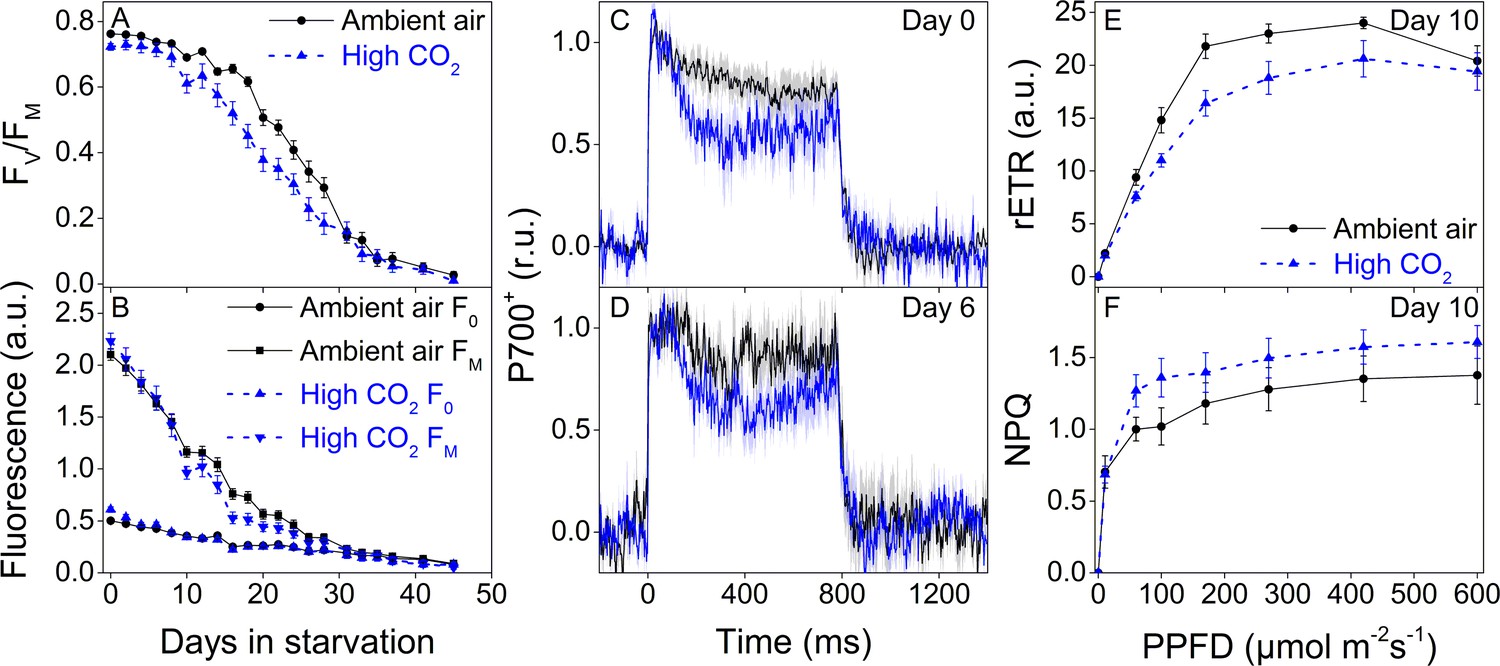
Higher P700 oxidation capacity protects the photosynthetic apparatus of ambient-air E. timida during fluctuating-light starvation.
(A–B) Maximum quantum yield of PSII photochemistry (FV/FM) (A) and minimum (F0) and maximum chlorophyll fluorescence (FM) (B) during fluctuating light starvation in ambient-air (black solid lines) and high-CO2 E. timida (blue dashed lines). (C–D) Second pulse P700 oxidation kinetics after 0 and 5 days in fluctuating-light starvation in ambient-air (black) and high-CO2 E. timida (blue). (E–F) Relative electron transfer rate of PSII (rETR) (E) and NPQ (F) during RLC measurement from dark-acclimated ambient-air (black solid lines) and high-CO2 E. timida (blue dashed lines) after 10 days in fluctuating-light starvation. Illumination for each light step during the RLCs was continued for 90 s prior to firing a saturating pulse to estimate rETR and NPQ. See Figure 8—figure supplement 1 for the fluorescence trace and behavior of NPQ during the RLC measurement. The light regime during the fluctuating light starvation was 12/12 hr day/night, and PPFD of the background illumination was 40 µmol m−2s−1, which was supplemented every 10 min with a 10 s high-light pulse during daylight hours. All data in (A,B) represent averages from 45 to 20 slug individuals (see ‘Materials and methods’ for details on sampling). P700 redox kinetics in (C) represent averages from nine biological replicates for both ambient-air and high-CO2 E. timida, and 6 and 9 in (D), respectively. P700+ transients were double normalized to their respective dark levels and to the P700+ peak measured immediately after the onset of the pulse. Fluorescence-based data in (E,F) represent averages of five biological replicates for ambient-air and high-CO2 E. timida. All error bars and shaded areas around the curves show SE. See Figure 8—source data 1 for original data.
-
Figure 8—source data 1
Original data from starvation in fluctuating light.
- https://cdn.elifesciences.org/articles/57389/elife-57389-fig8-data1-v2.xlsx
Figure 8—figure supplement 1
Fluorescence traces and NPQ during the RLC measurement.
All light steps of the RLC were continued for 90 s and the PPFDs used were 0, 11, 60, 100, 170, 270, 420, and 600 µmol m−2s−1. The data represent averages of five biological replicates. All error bars and shaded areas around the curves show SE.
Tables
Key resources table
| Reagent type (species) or resource | Designation | Source or reference | Identifiers | Additional information |
|---|---|---|---|---|
| Strain, strain background (Elysia timida) | Elysia timida Turku Isolate1 (TI1) | This paper | Mediterranian locality (Elba, Italy, 42.7782° N, 10.1927° E) | |
| Strain, strain background (Acetabularia acetabulum) | Acetabularia acetabulum Düsseldorf Isolate 1 (DI1) | This paper, Schmitt et al., 2014 | Mediterranian locality, s train originally isolated by Diedrik Menzel | |
| Biological sample (Chlamydomonas reinhardtii) | CC406 wild-type strain | Jokel et al., 2015; Chlamydomonas resource center | RRID:SCR_014960 | Total protein extract |
| Antibody | Rabbit anti-FLVB | Jokel et al., 2015 | (1:5000) | |
| Commercial assay or kit | DC Protein Assay Kit | Bio-Rad | Bio-Rad #5000111 | |
| Commercial assay or kit | Next Gel 10% Polyacrylamide Gel Electrophoresis Solutions | VWR | VWR # 97063–026 | |
| Chemical compound, drug | 3-(3, 4-dichlorophenyl)−1, 1-dimethylurea (DCMU) | Merck | Merck #D2425 | |
| Chemical compound, drug | D-(+)-Glucose | Merck | Merck #G8270 | |
| Chemical compound, drug | Glucose Oxidase fromAspergillus niger | Merck | Merck #G2133 | |
| Chemical compound, drug | Catalase from bovine liver | Merck | Merck #C9322 | |
| Software, algorithm | Fiji | Schindelin et al., 2012 | RRID:SCR_003070 | |
| Software, algorithm | Origin | Originlab (https://originlab.com) | RRID:SCR_014212 | Origin 2016 v.9.3 |
Additional files
Download links
A two-part list of links to download the article, or parts of the article, in various formats.
Downloads (link to download the article as PDF)
Open citations (links to open the citations from this article in various online reference manager services)
Cite this article (links to download the citations from this article in formats compatible with various reference manager tools)
Photosynthetic sea slugs induce protective changes to the light reactions of the chloroplasts they steal from algae
eLife 9:e57389.
https://doi.org/10.7554/eLife.57389


