Sox17 and β-catenin co-occupy Wnt-responsive enhancers to govern the endoderm gene regulatory network
- Center for Stem Cell and Organoid Medicine (CuSTOM), Division of Developmental Biology, Perinatal Institute, Cincinnati Children’s Hospital Medical Center, United States
- University of Cincinnati, College of Medicine, Department of Pediatrics, United States
- Department of Developmental and Cell Biology, University of California, Irvine, United States
- Center for Complex Biological Systems, University of California, Irvine, United States
- Center for Autoimmune Genomics and Etiology (CAGE), Divisions of Biomedical Informatics and Developmental Biology, Cincinnati Children's Hospital Medical Center, United States
Figures
Figure 1 with 1 supplement
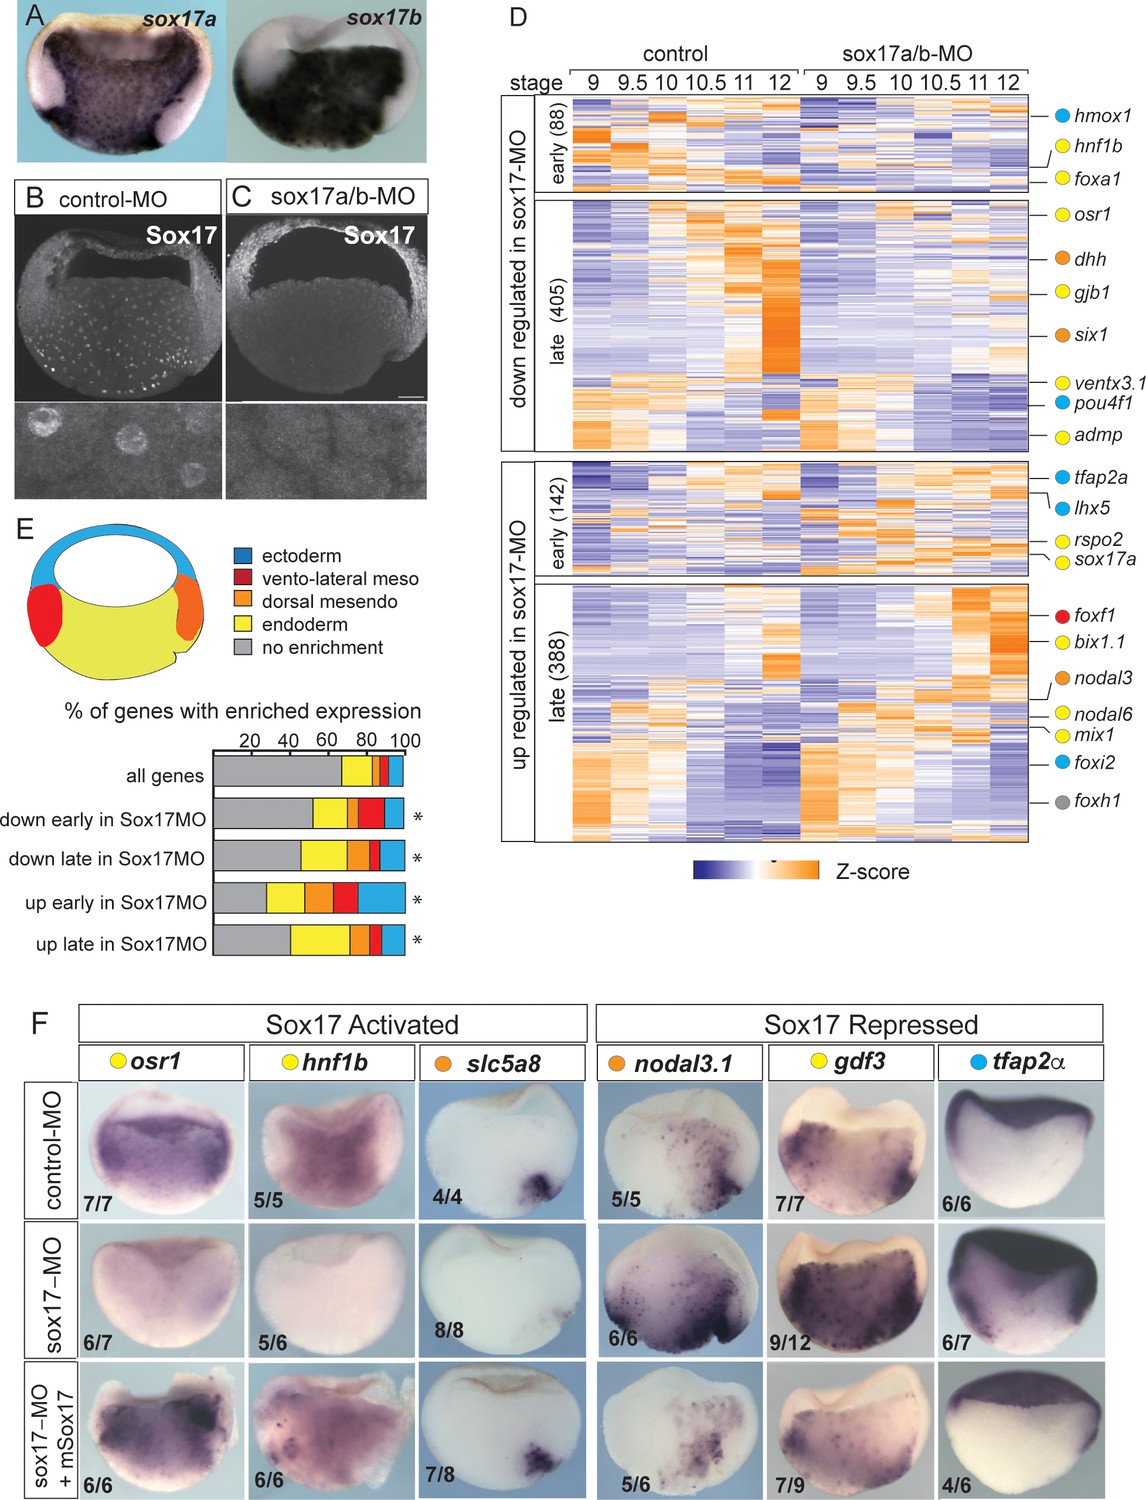
Sox17-regulated endoderm transcriptome.
(A) Endoderm expression of sox17a and sox17b in NF10.5 Xenopus tropicalis gastrula. (B–C) Sox17 immunostaining in control-MO (B) and sox17a/b-MO (C) injected gastrula with an antibody that recognizes both Sox17a and Sox17b shows MO effective knockdown. (D) Time course heatmap of Sox17-regulated transcripts. Differentially expressed genes from a pairwise comparison of control-MO and sox17-MO (>2 fold change, FDR < 5%) at each stage showing transcripts that are downregulated or upregulated early (NF9-10) or late (NF10.5–12). Key genes are color coded based on regional expression from fate map in (E). (E) Enriched expression of Sox17-regulated transcripts. Gastrula fate map (dorsal right) colored by different tissues. Stacked bar graphs showing different patterns of enriched spatial expression based on RNA-seq of dissected gastrula tissues (Blitz et al., 2017). Distribution of expression patterns statistically different from all genes in the genome was determined by two-sided Kolmogorov-Smirnov tests *p<0.01. (F) In situ validation of Sox17-regulated transcripts. Disrupted expression in sox17-MOs is rescued by co-injection of mouse (m) Sox17 RNA.
Figure 1—figure supplement 1
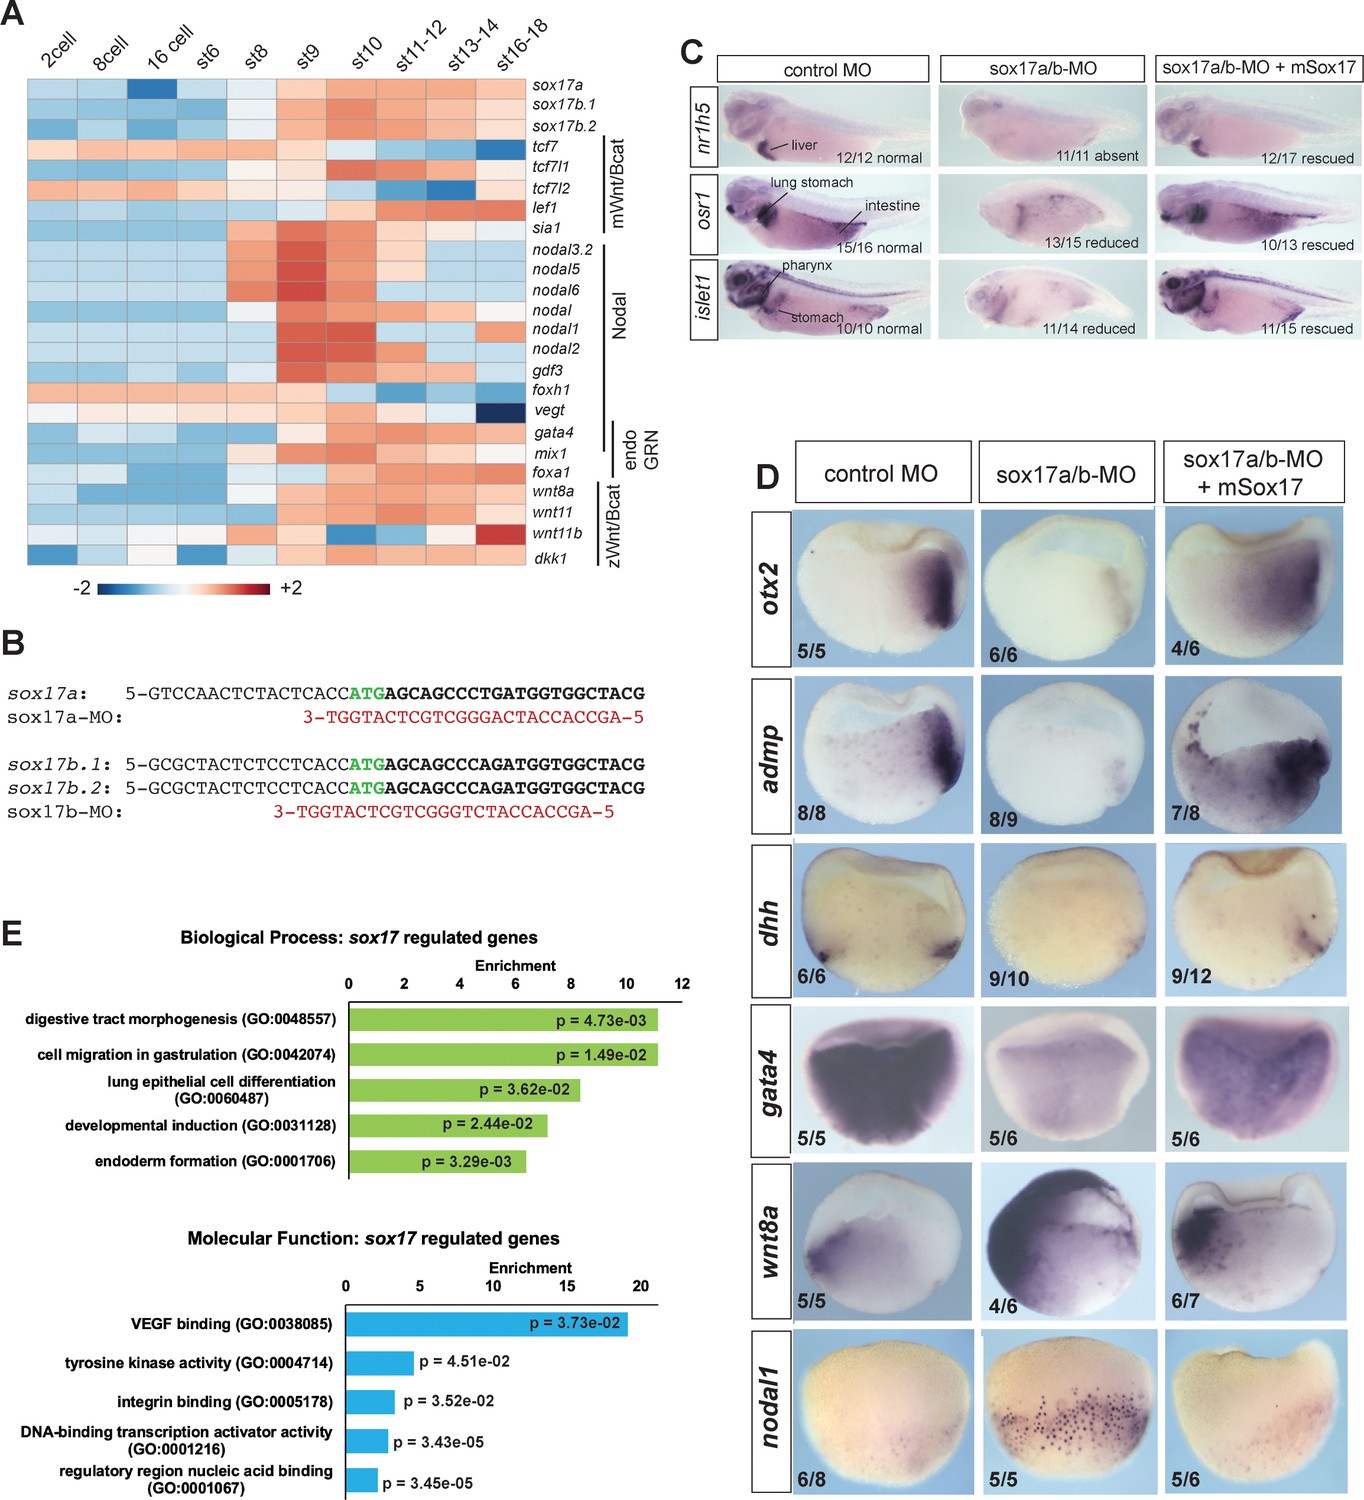
Characterization of Sox17-MO embryos and Sox17-regulated transcriptome.
(A) Temporal expression of key endoderm GRN transcripts (GSE65785; Owens et al., 2016). (B) Sequence alignment of antisense sox17a-MO and sox17b-MO (red) with 5’ end of Xenopus tropicalis sox17a, sox17b.1 and sox17b.2 mRNAs (black) spanning the ATG translation start (green). (C) In situ hybridization of markers for the liver (nr1h5), stomach, lung, intestine and pharynx (osr1 and islet1) snowing that co-injection of mouse Sox17 RNA rescues gut development in sox17-MO embryos at the tailbud stage. (D) Additional validation of gastrula stage transcripts downregulated (otx2, admp, dhh and gata4) or upregulated (wnt8 and nodal1) in sox17-MO embryos and rescue by co-injection of mSox17. (E) GO term enrichment analysis of Sox17-regulated genes showing fold enrichment by Fisher’s exact test with p-values adjusted to 5% FDR for multiple testing correction.
Figure 2 with 2 supplements
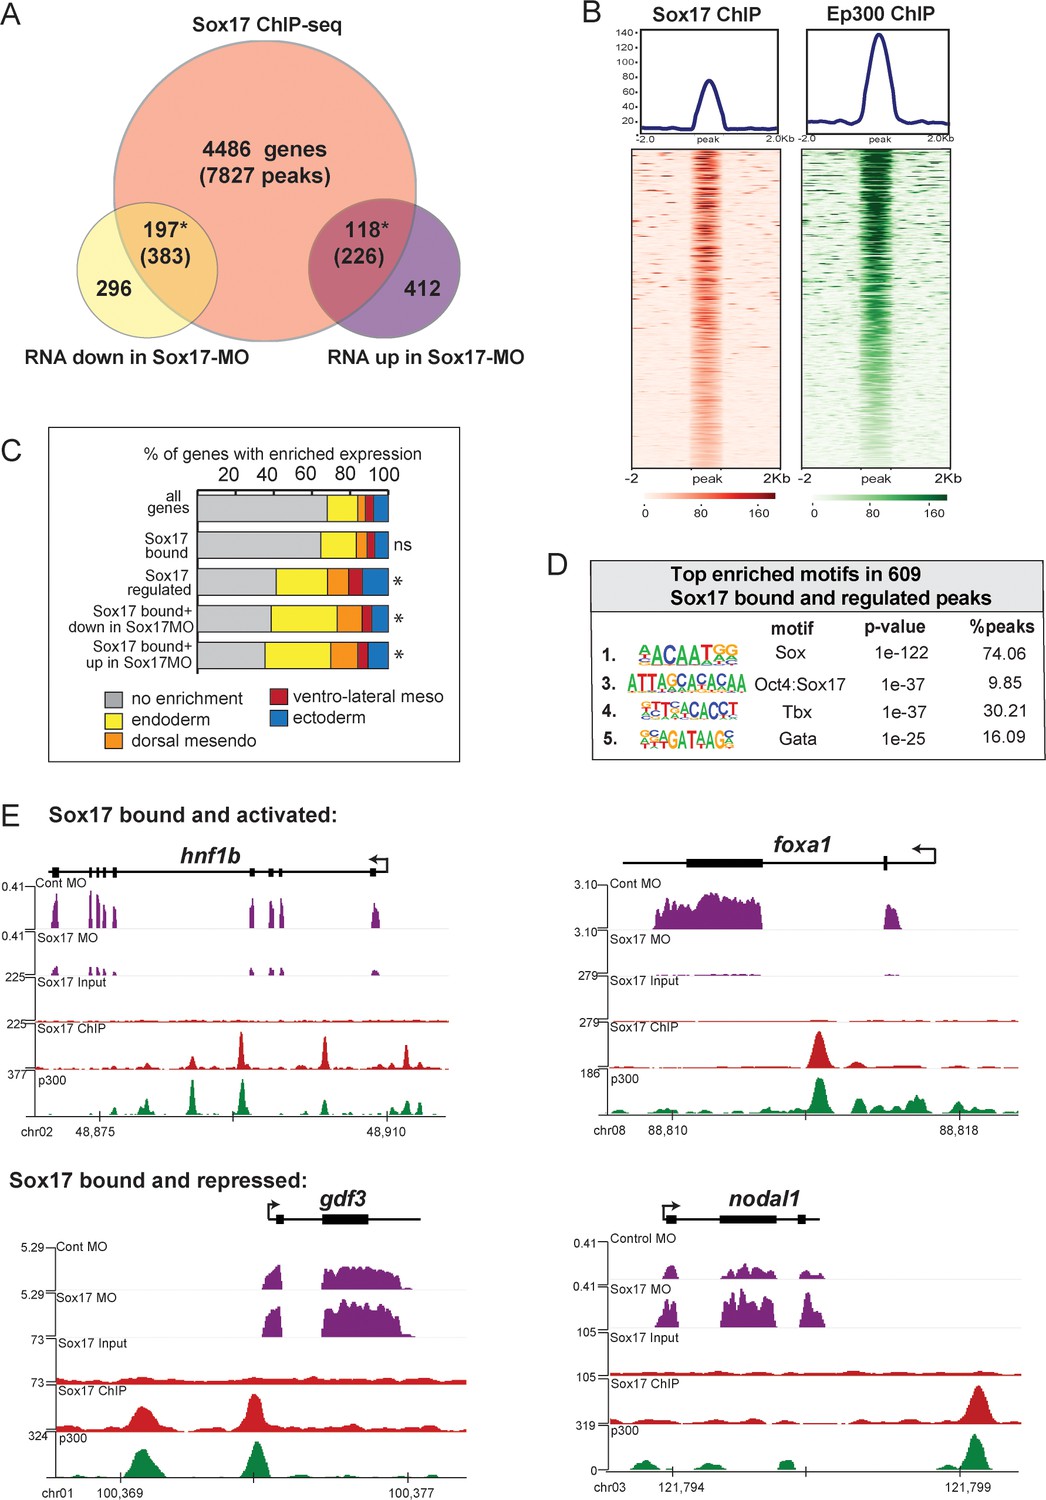
ChIP-seq identifies Sox17-bound enhancers and direct transcriptional targets.
Sox17 ChIP-seq of gastrula embryos. (A) Venn diagram of Sox17-bound genes (and associated peaks) from ChIP-seq intersected with Sox17-regulated genes. Gene intersections are statistically significant based on hypergeometric tests* p<0.001. (B) Peak density plots showing that the Sox17-bound loci are cobound by the histone acetyltransferase Ep300, a marker of active enhancers. Average density of all peaks in top panel. (C) Sox17-bound genes are enriched in the endoderm. Stacked bar graphs showing different patterns of enriched spatial expression based on RNA-seq of dissected gastrula tissues (Blitz et al., 2017). Distribution of expression patterns statistically different from all genes in the genome was determined by two-sided KolmogorovSmirnov tests *p<0.01. (D) Top enriched DNA-binding motifs in Sox17 peaks, based on HOMER hypergeometric test. (E) Genome browser views of representative genes showing RNA-seq expression in control-MO and sox17-MO embryos and ChIPseq tracks of Sox17 and Ep300 binding.
Figure 2—figure supplement 1
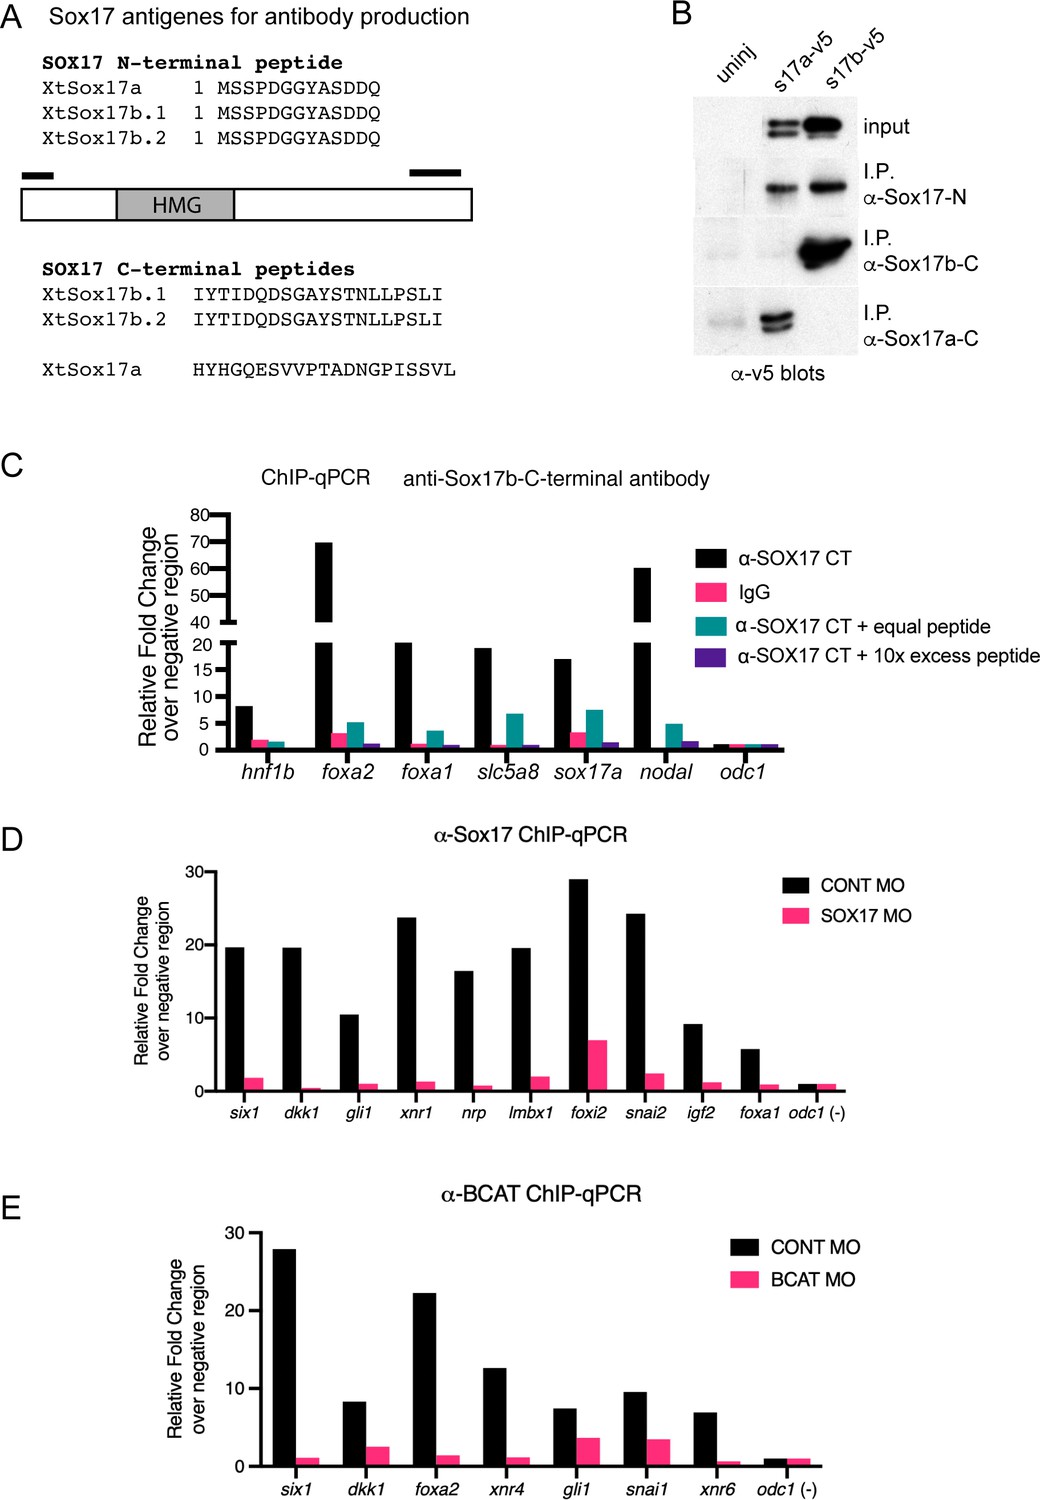
Validation of ChIP antibodies.
(A) Schematic and amino acid sequences of the Xenopus tropicalis Sox17 peptides used to immunize rabbits and generate polyclonal antibodies to: pan-Sox17 N-terminal, Sox17b Cterminal and Sox17a C-terminal. (B) Immunoprecipitation of Xenopus laevis embryos expressing V5 epitope-tagged versions of Sox17a-V5 and Sox17b1-V5. Anti-V5 western blot showed that all antibodies specifically immunoprecipitated the target antigen but that the Sox17b C-terminal antibody was the most efficient. (C) ChIP-qPCR validation of anti-Sox17 antibodies on previously known target loci. In preliminary ChIP-qPCR experiments, the pan-Sox17 N-terminal and Sox17b C-terminal antibodies bound to all the same loci, but the Sox17b C-terminal antibody showed higher fold enrichment (data not shown) and was used for ChIPseq experiments. Representative ChIP-qPCR results show relative fold change of Sox17b binding versus IgG control in Sox17-bound positive control loci relative to the negative control region of odc1,. Addition of the Sox17b C-terminal peptide reduced the ChIP signal in a dose-dependent manner indicating specific binding. (D) Representative ChIP-qPCR assessing the efficiency of Sox17MO knockdown. Sox17 enrichment at target loci are shown relative to a negative region (odc1) in embryos injected with either control-MO or Sox17-MO. The Sox17-MO dramatically reduces Sox17 occupancy at all loci. (E) Representative ChIP-qPCR assessing the efficiency of Bcat-MO knockdown. Bcat enrichment at target loci are shown relative to a negative region (odc1) in embryos injected with either controlMO or Bcat-MO. The Bcat-MO dramatically reduces its occupancy at all loci. All ChIP-qPCR experiments were repeated at least twice.
Figure 2—figure supplement 2
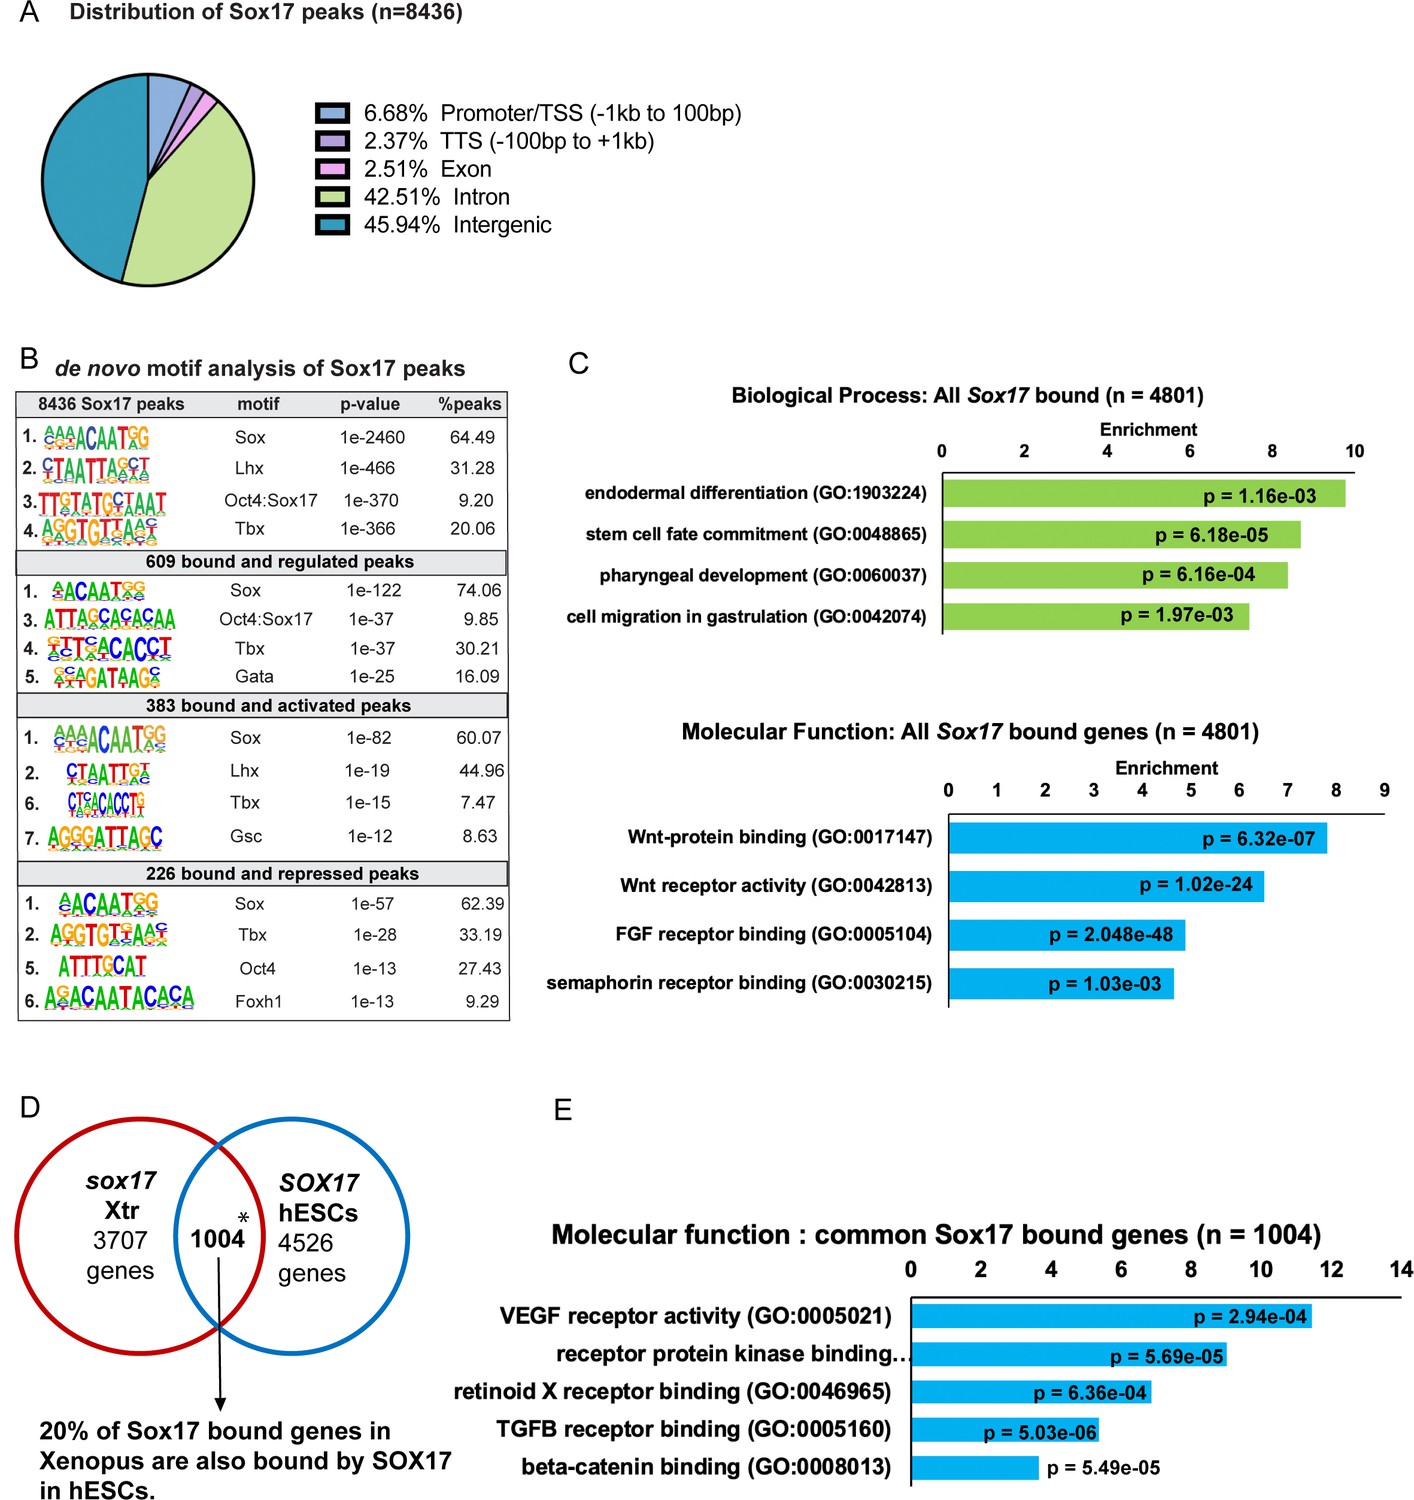
Analysis of Sox17-bound chromatin loci.
(A) Genomic distributions of 8436 Sox17-bound ChIP-seq peaks associated to cognate promoters using HOMER. 88% of the Sox17 peaks were located in either introns or elements more than 1 kb from the TSS, indicative of distal CRMs. (B) De novo DNA-binding motif enrichment analysis of Sox17 peaks associated with Sox17-regulated genes by HOMER hypergeometric test. (C) GO analysis of 4810 genes associated with Sox17 ChIP-seq peaks showed enrichment for endoderm development and Wnt signaling. Fold enrichment by Fisher’s exact test with p-values adjusted to 5% FDR for multiple testing correction (D) Comparison of the Xenopus genes associated with Sox17 ChIP-seq peaks to published human SOX17 ChIP-seq from human embryonic stem cell (hESC)-derived definitive endoderm (GSE61475; Tsankov et al., 2015). The extensive overlap between Xenopus and human Sox17-bound genes (*p<0.001 by hypergeometric test) indicates that Sox17 regulates an evolutionarily conserved GRN. The intersection only includes Xenopus genes that have human orthologs, unannotated Xenopus genes were excluded from the analysis. (E) GO term enrichment analysis of the 1004 Sox17-bound genes conserved between Xenopus and human by Fisher’s exact test with p-values adjusted to 5% FDR for multiple testing correction.
Figure 3 with 2 supplements
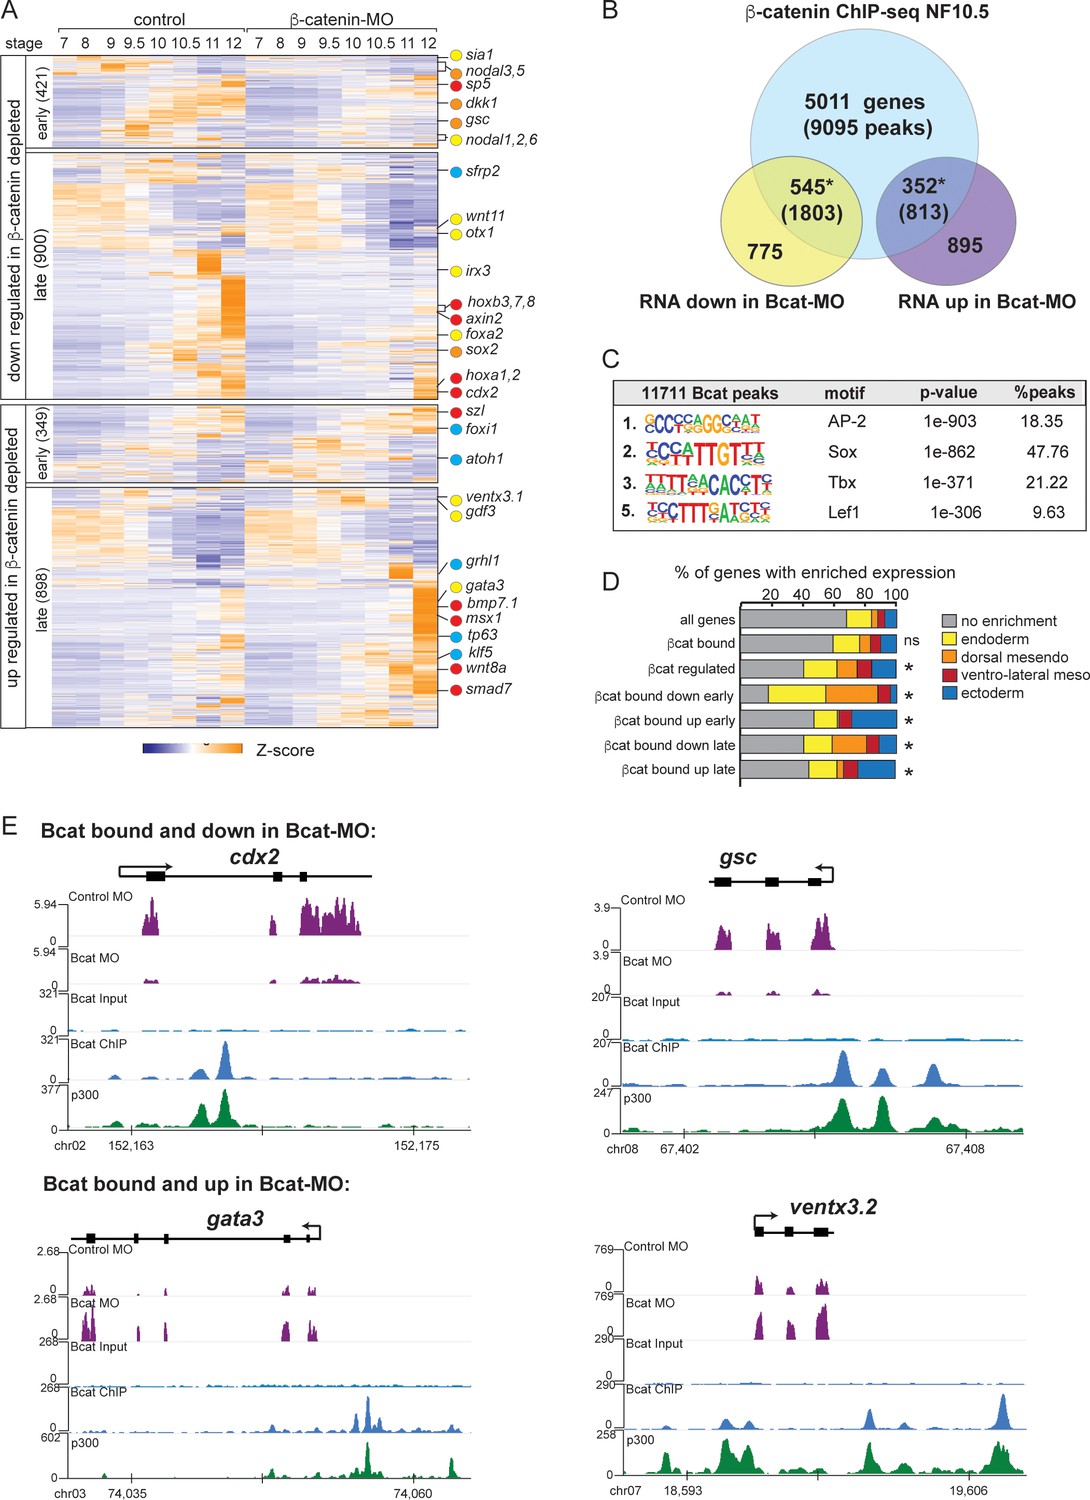
The Bcat-regulated genomic program.
(A) Time course heatmap of Bcat-regulated transcripts. Differential expressed genes from a pairwise comparison of control-MO and Bcat-MO embryos (>2 FC, FDR < 5%) at each stage identified 2568 Bcat-regulated transcripts; 1321 downregulated and 1247 upregulated in Bcat-MO embryos. Key genes are color coded based on regional expression from (D). (B) Venn diagram intersecting Bcat-regulated genes with Bcat-bound genes (and associated peaks) from published X. tropicalis gastrula Bcat ChIP-seq data (Nakamura et al., 2016) identified 898 putative direct targets associated with 2616 peaks. Statistically significant intersections based on hypergeometric tests* p<0.001.* (C) Motif enrichment analysis of Bcat peaks by HOMER hypergeometric test. (D) Stacked bar graphs showing different patterns of enriched spatial expression based on RNA-seq of dissected gastrula tissues (Blitz et al., 2017). Distribution of expression patterns statistically different from all genes in the genome was determined by twosided Kolmogorov-Smirnov tests *p<0.01. (E) Genome browser views of representative genes showing the RNA-seq expression in control-MO and Bcat-MO embryos and Bcat and Ep300 ChIPseq tracks.
Figure 3—figure supplement 1
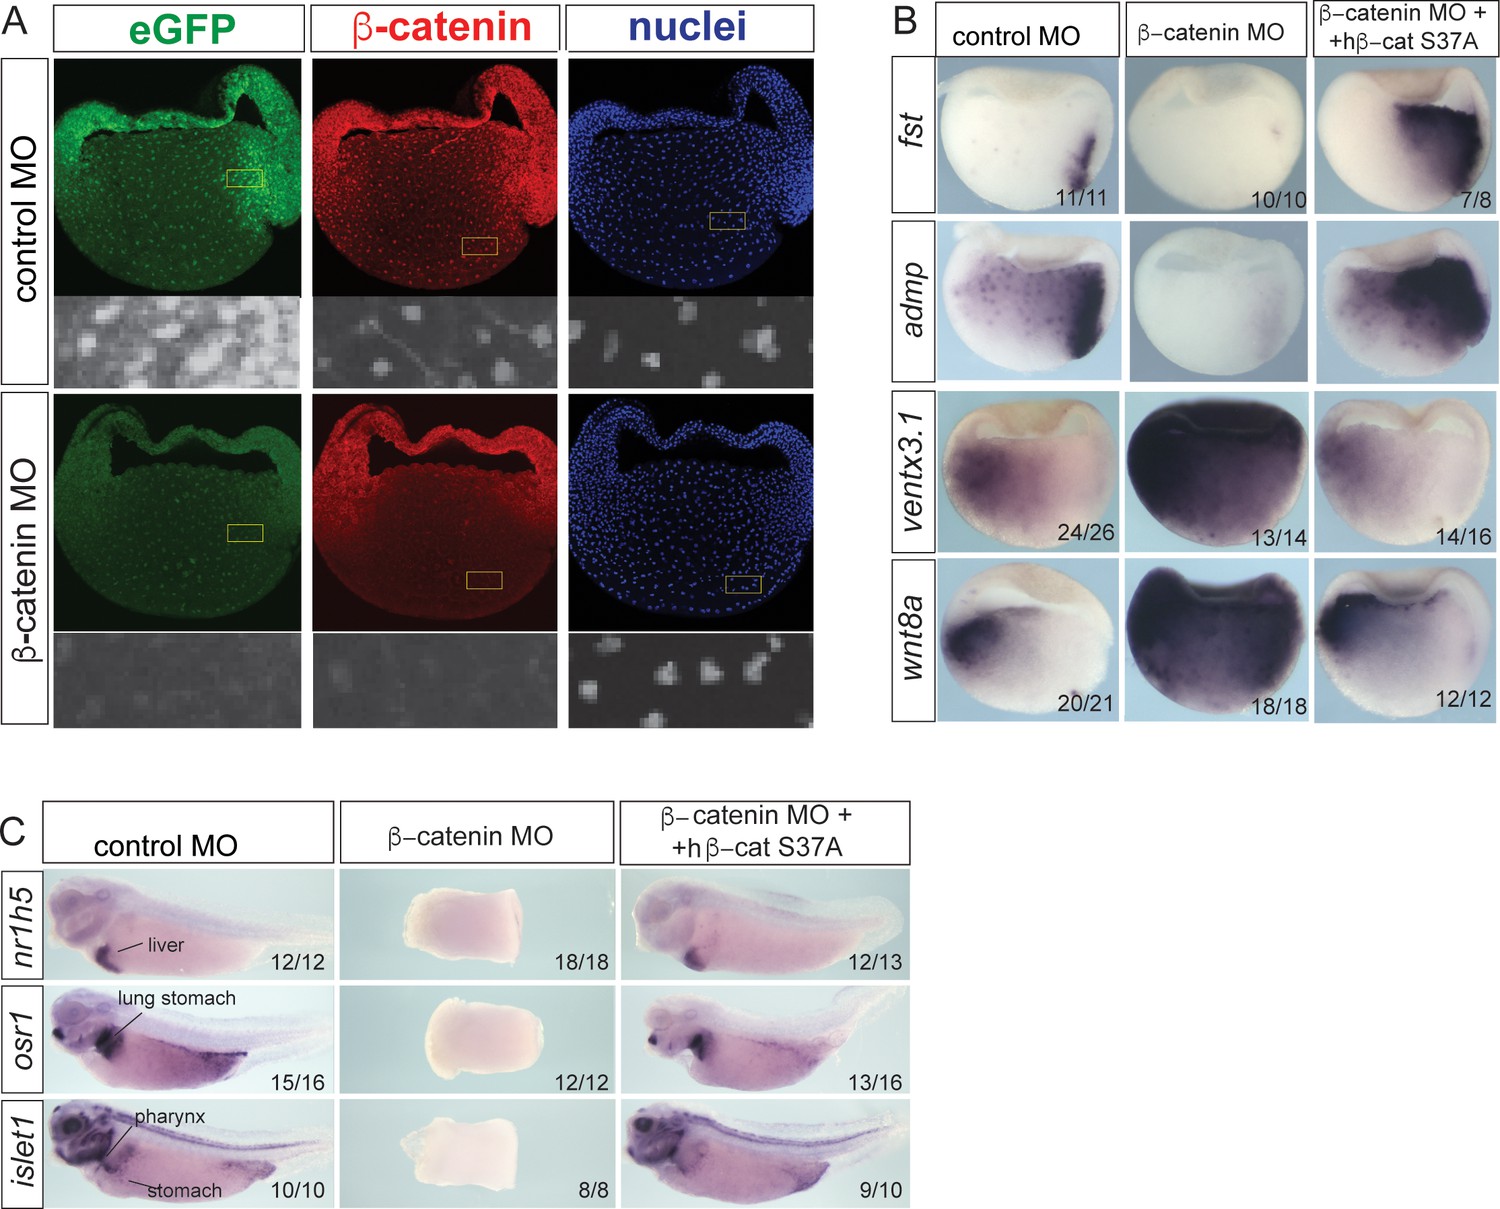
Validation of Bcat-MO embryos.
(A) Immunostaining of Tg(WntREs:dEGFP)Vlem Xenopus tropicalis gastrula embryos show the loss of nuclear Bcat and GFP expression from the Wnt-reporter transgene in Bcat-MO embryos demonstrate effective knockdown. (B–C) Co-injection of RNA encoding a human S37A-stabilized Bcat recues the Bcat-MO-ventralized phenotype. In situ hybridization of gastrula (B) and tailbud embryos (C). In Bcat-MO gastrula, fst and admp are downregulated in the dorsal organizer, whereas wnt8a and ventx3.1 are upregulated consistent with a ventralized phenotype. (C) In situ hybridization of markers for the liver (nr1h5), stomach, lung, intestine and pharynx (osr1 and islet1) show that co-injection of human S37A-stabilized Bcat RNA rescues the ventralized phenotype and disrupted gut development in Bcat-MO tailbud embryos.
Figure 3—figure supplement 2
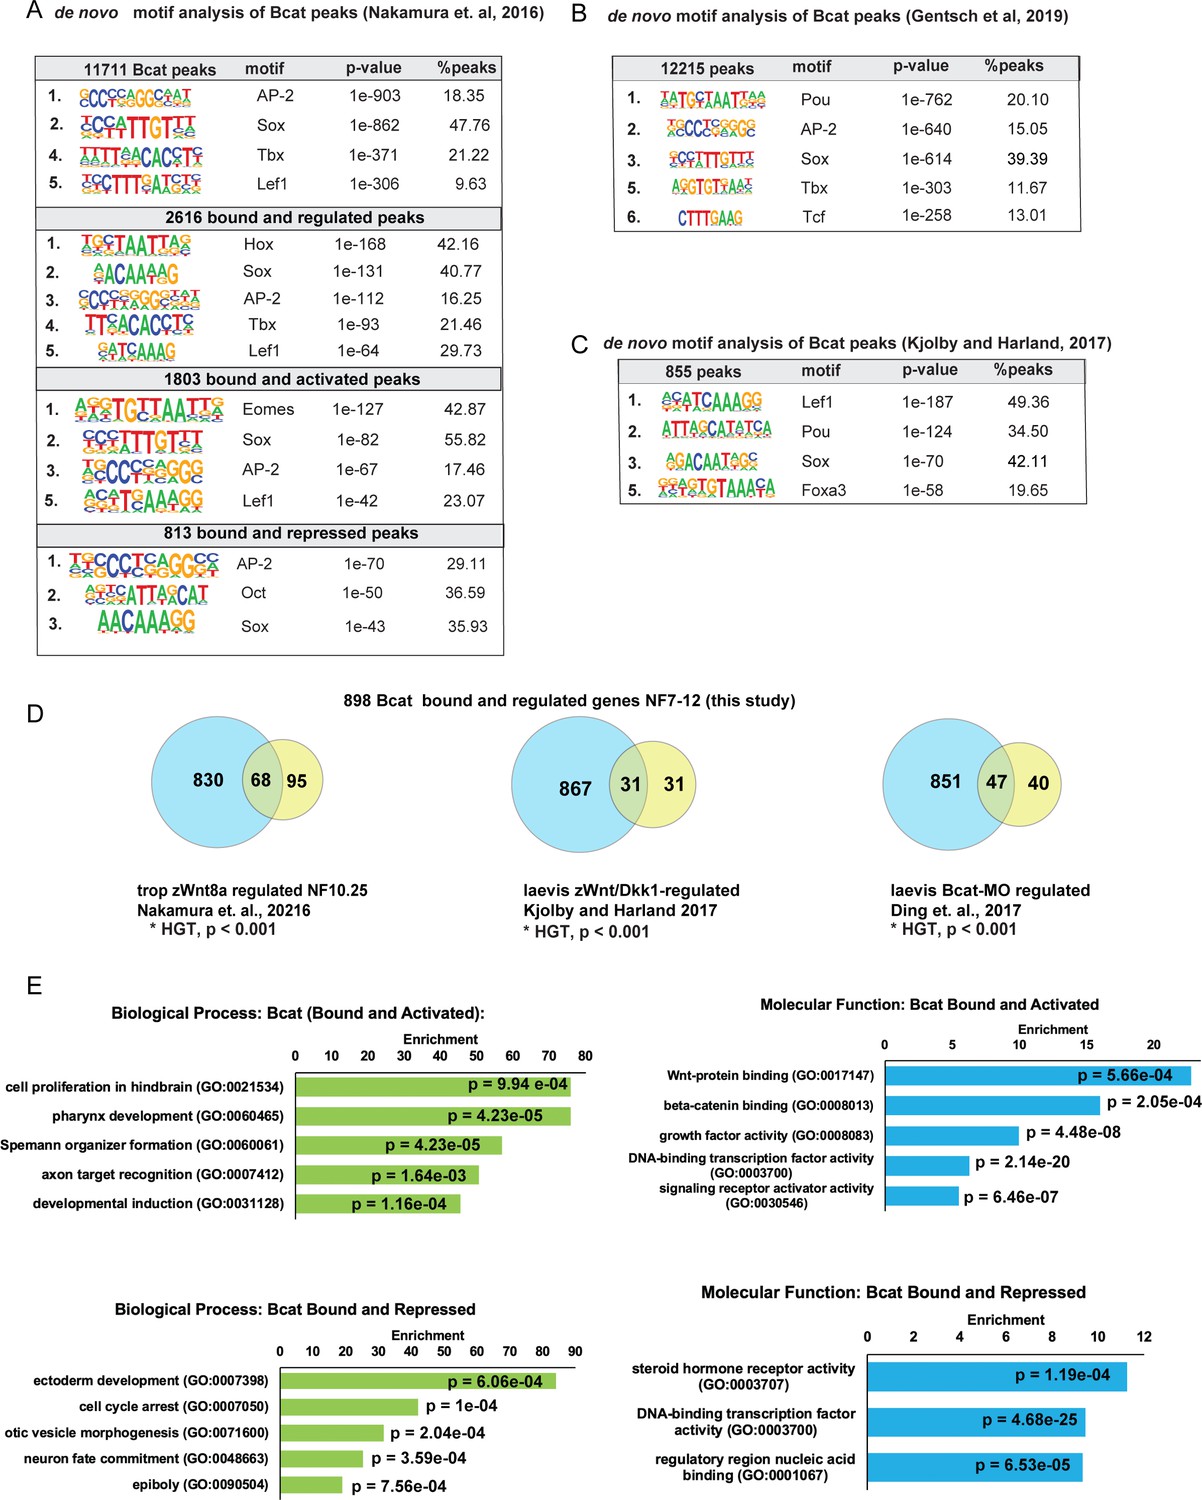
Additional analysis of Bcat ChIP-Seq.
(A) De-novo motif analysis of Bcat peaks associated with different groups of Bcat-regulated genes, based on HOMER hypergeometric test. X. tropicalis stage 10.5 gastrula Bcat ChIP-Seq dataset from GSE72657 (Nakamura et al., 2016). (B) De-novo motif analysis of Bcat-bound peaks from St.10+ Bcat ChIP-Seq data from Gentsch et al., 2019. (C) And of Bcat-3xFlag ChIP-Seq peaks from X. laevis stage 11.5 gastrula from GSE77365, Kjolby and Harland, 2017; show a similar enrichment of SOX motifs based on HOMER hypergeometric test. (D) Comparison of differentially expressed Bcat-regulated genes in this study with other recent genomic analysis of gastrula-stage Wnt targets (Ding et al., 2017; Nakamura et al., 2016; Kjolby and Harland, 2017) shows significant overlap, *p<0.001 by hypergeometric enrichment test. (E) GO enrichment analysis of Bcat-bound and -regulated genes bases on Fisher’s exact test with p-values adjusted to 5% FDR for multiple testing correction.
Figure 4 with 2 supplements
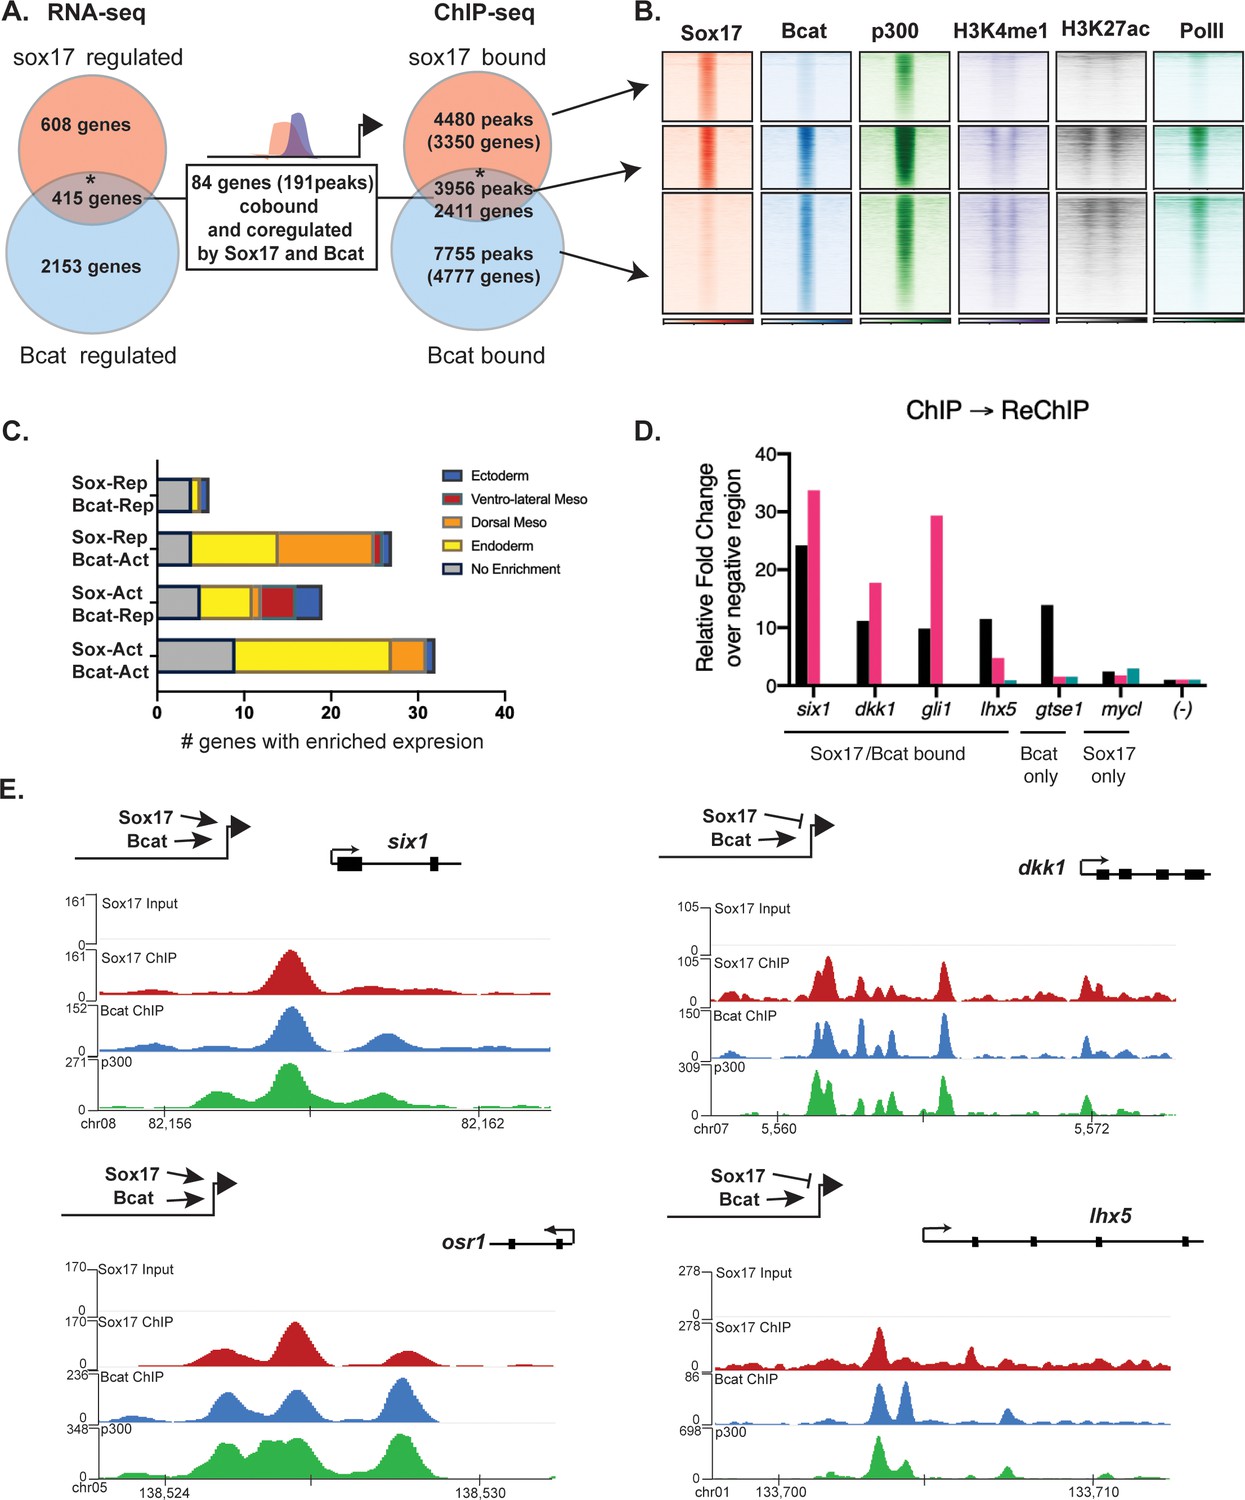
Sox17 and Bcat co-occupy enhancers to regulate the endoderm GRN.
(A) Eighty-four genes (191 Peaks) are cobound and coregulated by Sox17 and Bcat. Venn diagram show that 415 genes are regulated by both Sox17 and Bcat (left), whereas 2411 genes (3956 peaks) are bound by both Sox17 and Bcat. Gene intersections are significant based on hypergeometric tests, *p<0.001. (B) Density plots show that Sox17 and Bcat cobound peaks are enriched for enhancer associated epigenetic marks: Ep300, H3K4me1 and H3K27Ac and RNA pol II. (C) Regional enrichment of all subsets of enhancers cobound and coregulated by Sox17 and Bcat. (D) A representative ChIP-reChIP experiment showing that Sox17 and Bcat coocupy all the test CRMs (six1, dkk1, gli1 and lhx5) in the same cells, in contrast to the gtse1 locus, which is bound only by Bcat. (E) Genome browser views of representative genes showing peak overlap of Sox17, Bcat and Ep300 ChIP-Seq tracks.
Figure 4—figure supplement 1
Additional analysis of cobound and coregulated peaks.
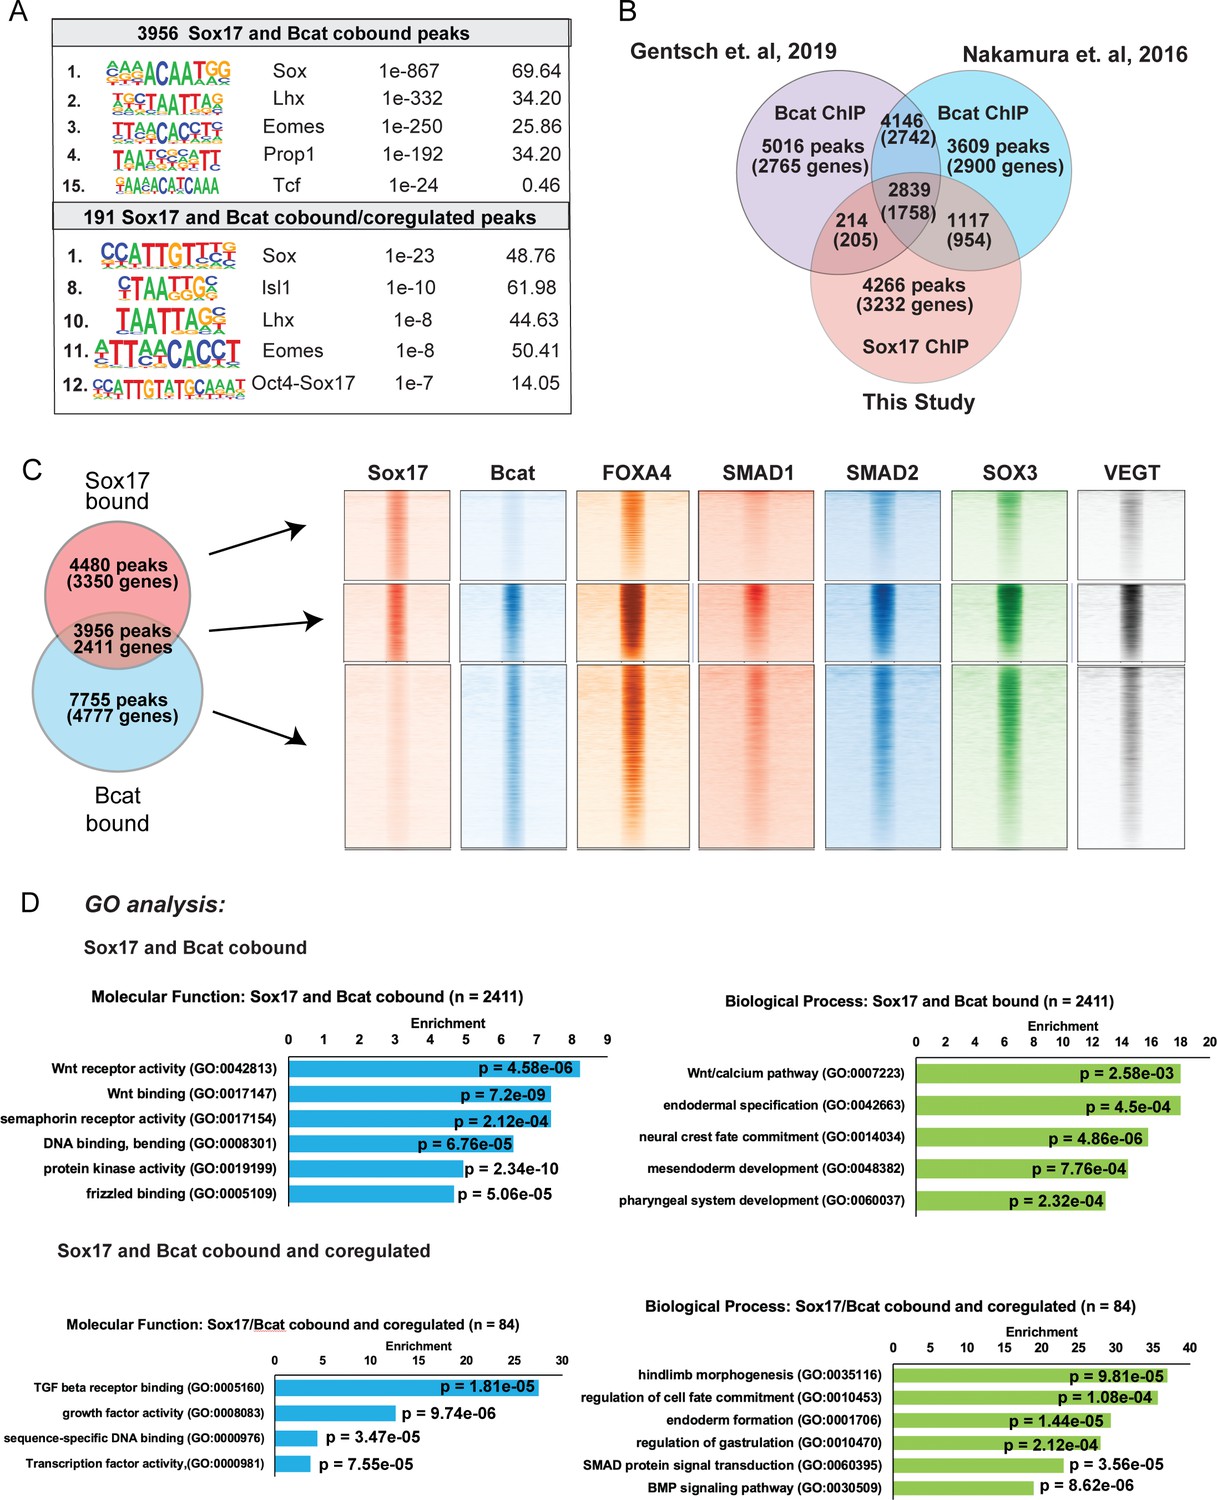
(A) De-novo motif analysis of Sox17 and Bcat bound and/or regulated peaks by HOMER hypergeometric tests. (B) Overlap of Bcat ChIP-Seq datasets from Nakamura et al., 2016 and Gentsch et al., 2019 with Sox17 ChIP-Seq dataset generated in this study. (C) Density plots show that Sox17 and Bcat-cobound peaks are also enriched for binding of other endodermal TFs: Foxa4 GSE85273, Charney et al., 2017b; Smad1, Smad2, Sox3 and VegT (GSE113186, Gentsch et al., 2019). (D) GO enrichment analysis of gene cobound and cobound/coregulated by Sox17 and Bcat peaks bases on Fisher’s exact test with p-values adjusted to 5% FDR for multiple testing correction.
Figure 4—figure supplement 2
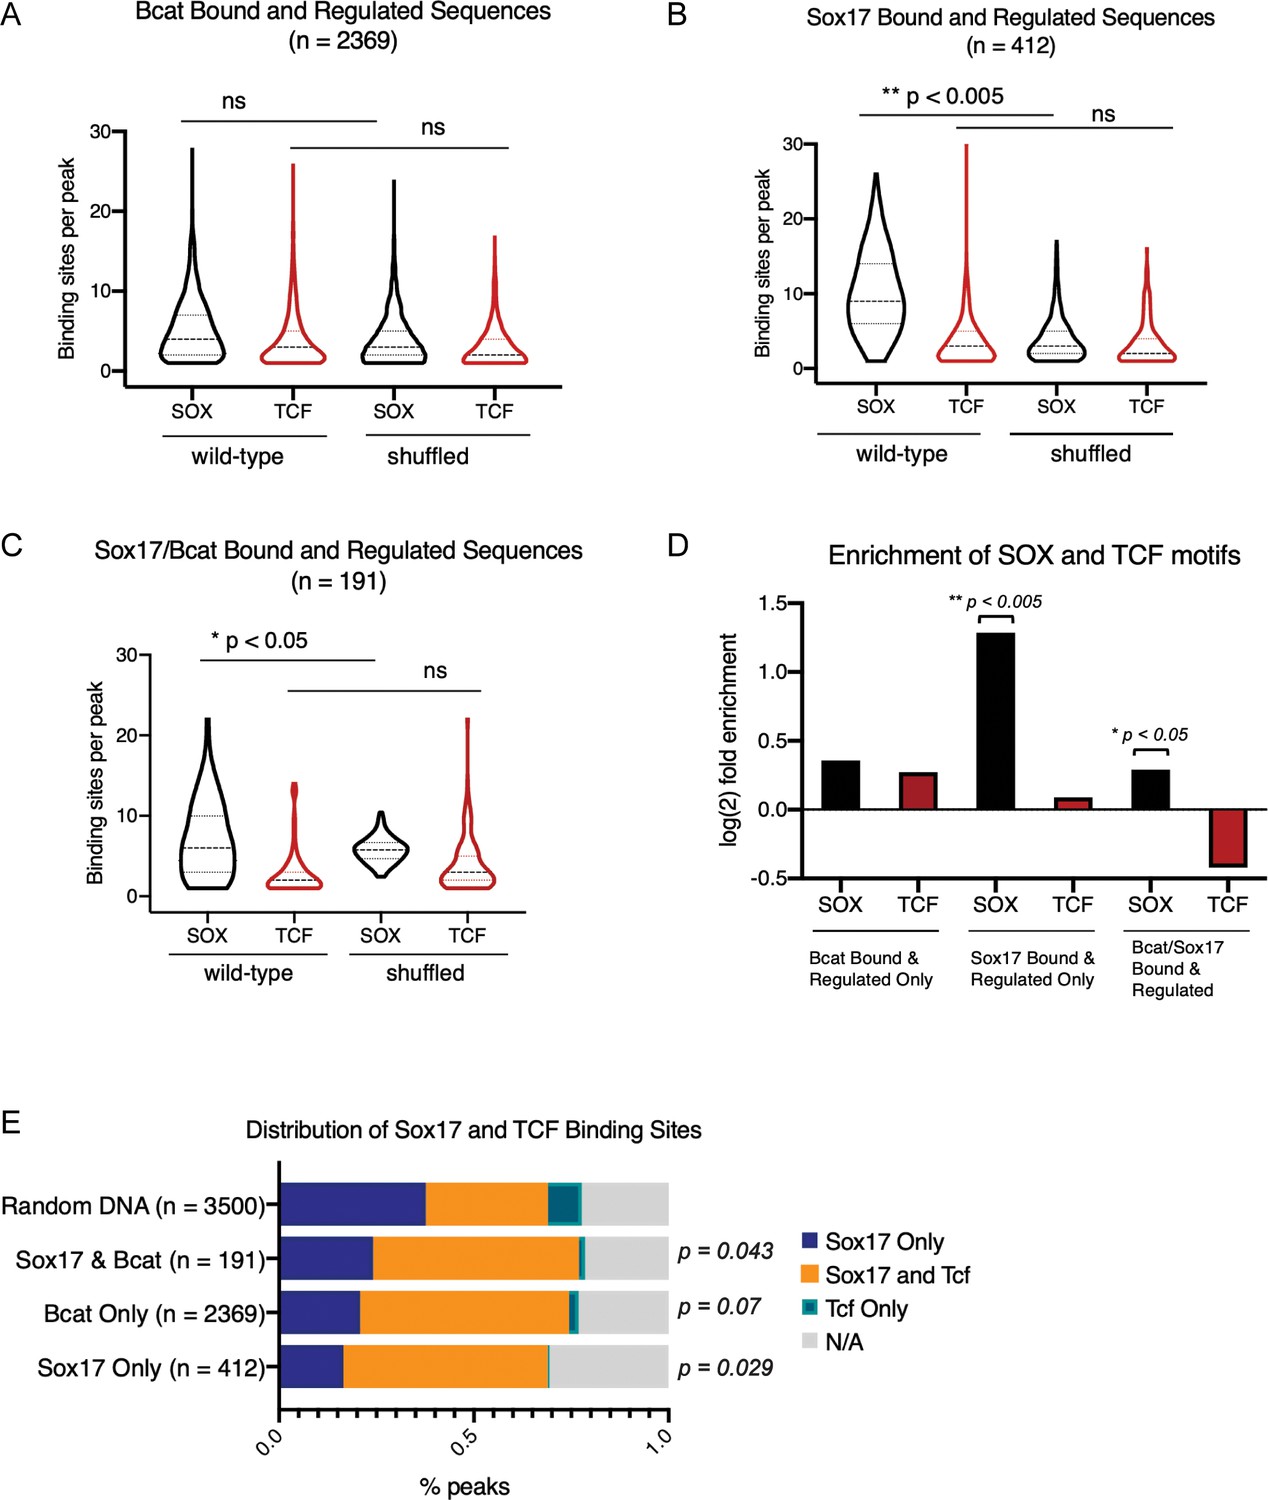
Sox and Tcf DNA-binding motif frequency in Sox/Bcat cooccupied peaks.
(A–C) Violin plots show the frequency of Sox and Tcf DNA-binding sites per peak in (A) exclusively Bcat-bound and -regulated peaks (B) exclusively Sox17-bound and -regulated peaks and (C) Sox17/Bcat co-occupied and coregulated peaks. The significance of motif frequency in wild-type test sequences relative to random ‘shuffled’ background was determined by Fisher exact test (*p<0.05, **p<0.005, ns; not significant). Each wild-type test sequence was randomly scrambled while maintaining dinucleotide frequency to generate ‘shuffled’ sequences. (D) log2 fold enrichment of Sox and Tcf motif frequencies over random for the three peak categories shown in A-C. (E) Stacked bar charts showing the distribution of Sox and Tcf binding sites in the three groups of enhancers compared to a random set of genomic regions. Distribution of motifs was compared between each group of enhancers and random by two-sided Kolmogorov-Smirnov tests.
Figure 5
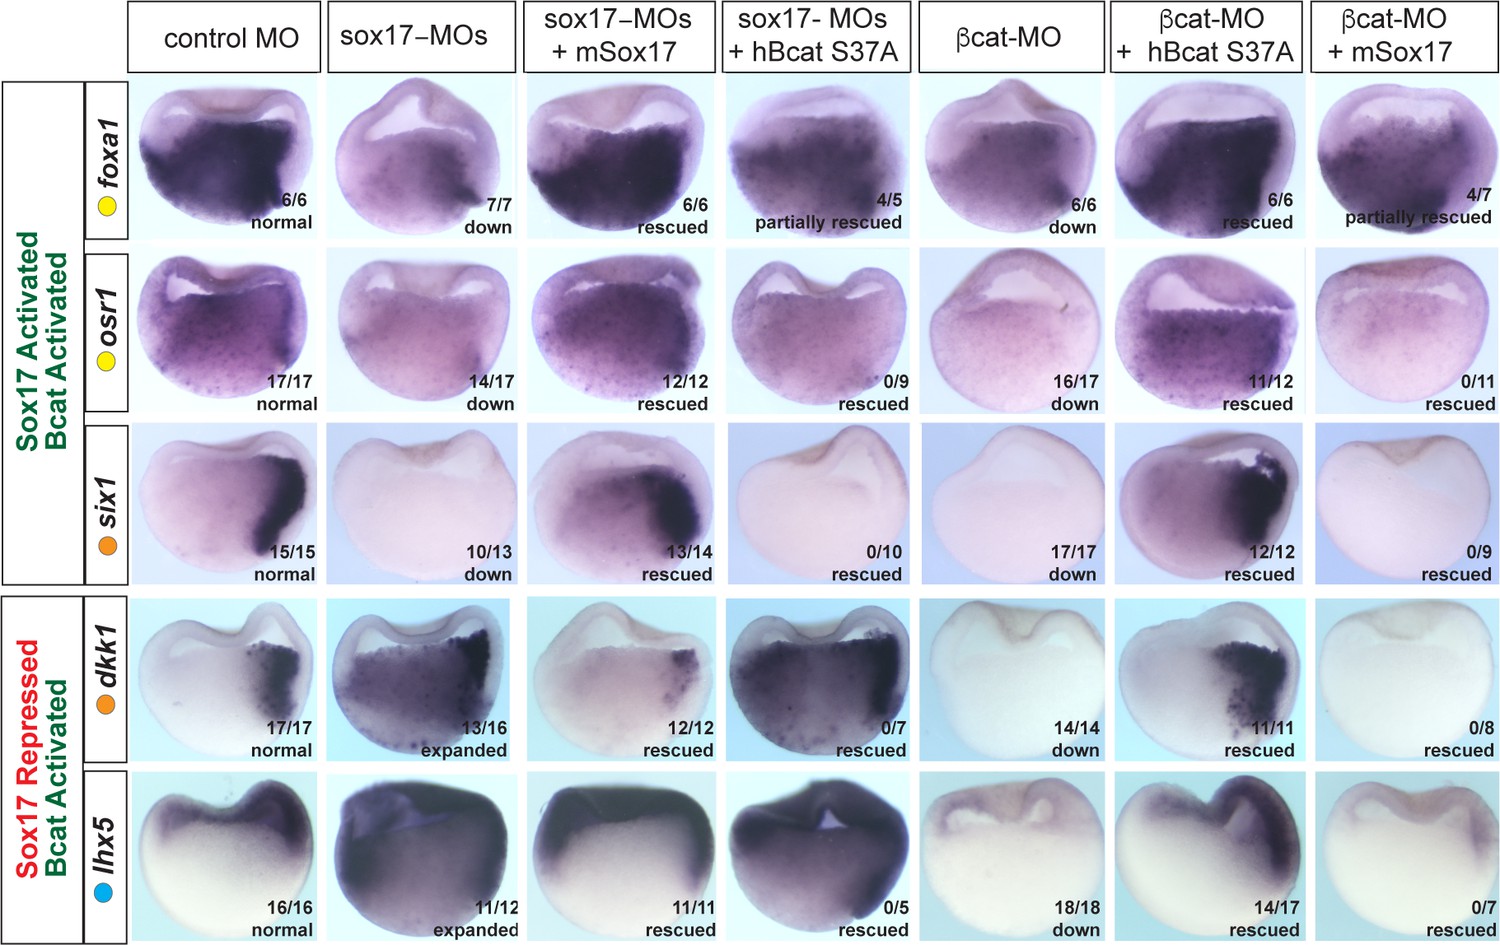
Sox17 and Bcat epistasis.
In situ hybridization of gastrula embryos (dorsal right) injected with sox17-MO or bcat-MO, some of which were co-injected with RNA encoding either mSox17 or a human S37A stabilized Bcat. The genes osr1, six1 and foxa1 are activated by both Sox17 and Bcat, whereas dkk1 and lhx5 are activated by Bcat but repressed by Sox17. Co-injection of mSox17 cannot rescue normal expression in Bcat-MOs, nor can hBcat S37A RNA rescue Sox17-MOs indicating that both Sox17 and Bcat required for normal expression.
Figure 6 with 2 supplements
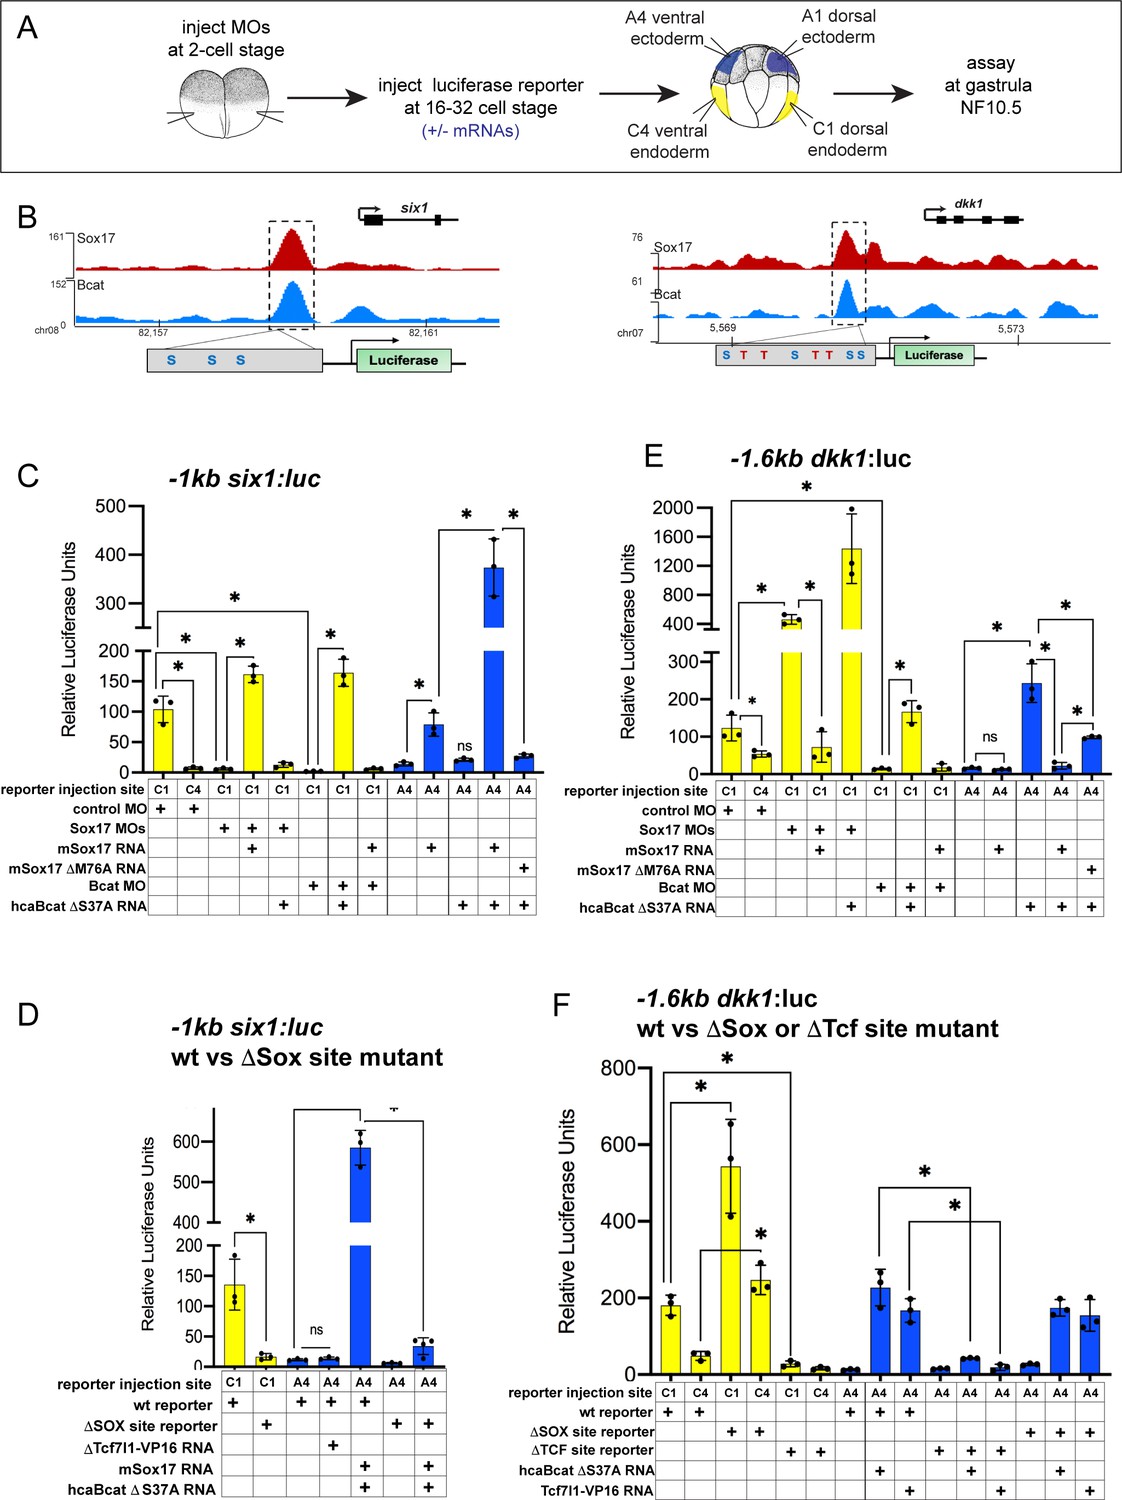
Sox17 and Bcat coordinately regulate endoderm enhancers.
(A) Experimental design. (B) IGV genome browser tracks showing Sox17 and Bcat chromatin binding and schematic of reporter constructs showing the predicted Sox17 and Tcf DNA-binding sites in the −1 kb six1 and −1.6 kb dkk1 enhancers (C–F) Luciferase assay of (C) wildtype (wt) −1 kb six1:luc, (D) wt versus DSox-site mutant 1 kb six1:luc, (E) wt −1.6 kb dkk1:luc and (F) wt versus DSox-site and DTcf-site mutant −1.6 kb dkk1:luc reporters injected in different tissue with the indicated MOs and/or mRNAs. Histograms show mean luciferase activity ± standard deviation, *p<0.05 in pairwise Student T-tests.
Figure 6—figure supplement 1
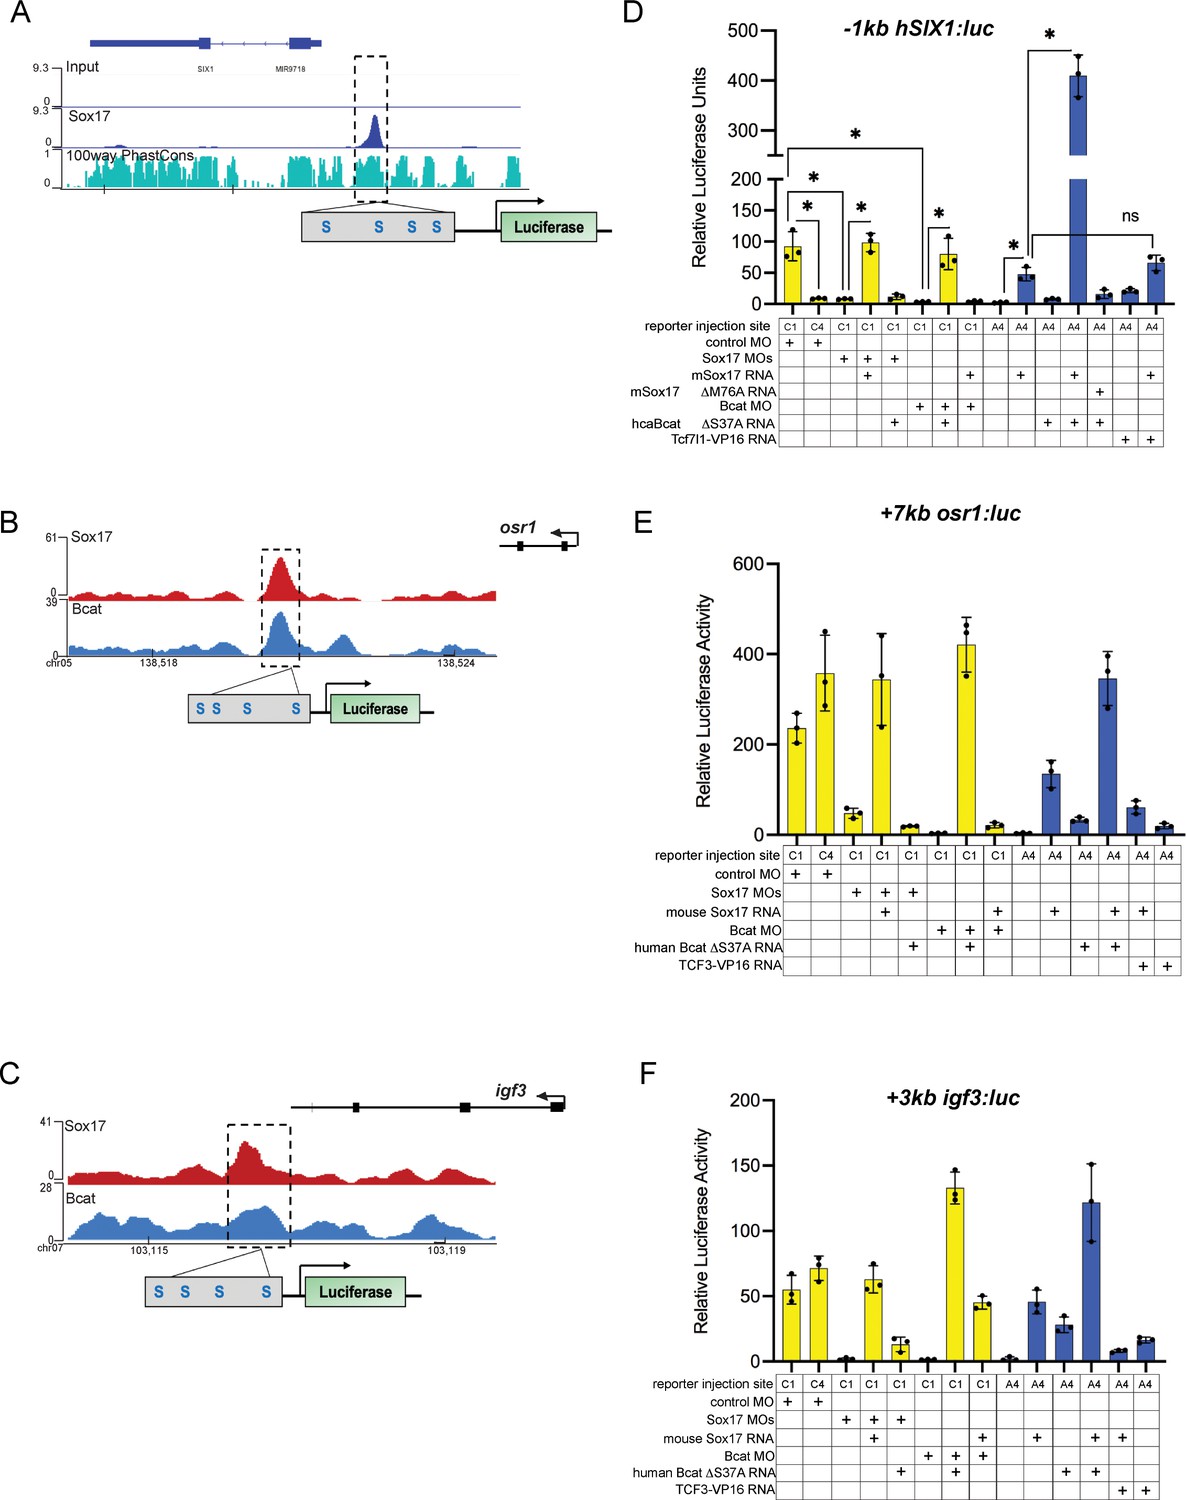
Sox17 and Bcat can regulate some enhancers apparently independent of Tcfs.
(A) IGV track showing evolutionarily conserved SIX1 peak in human DE (Tsankov et al., 2015). (B, C) IGV tracks and luciferase construct schematic showing predicted Sox17 DNA-binding sites but no detectable Tcf sites at the +7 kb osr1 and +3 kb igf3 enhancers, respectively. (D) Luciferase assay of −1 kb SIX1 enhancer (E, F) Luciferase reporter assays of the construct shown in B and C, respectively. Histograms show mean luciferase activity ± standard deviation, *p<0.05 in pairwise Student T-tests.
Figure 6—figure supplement 2
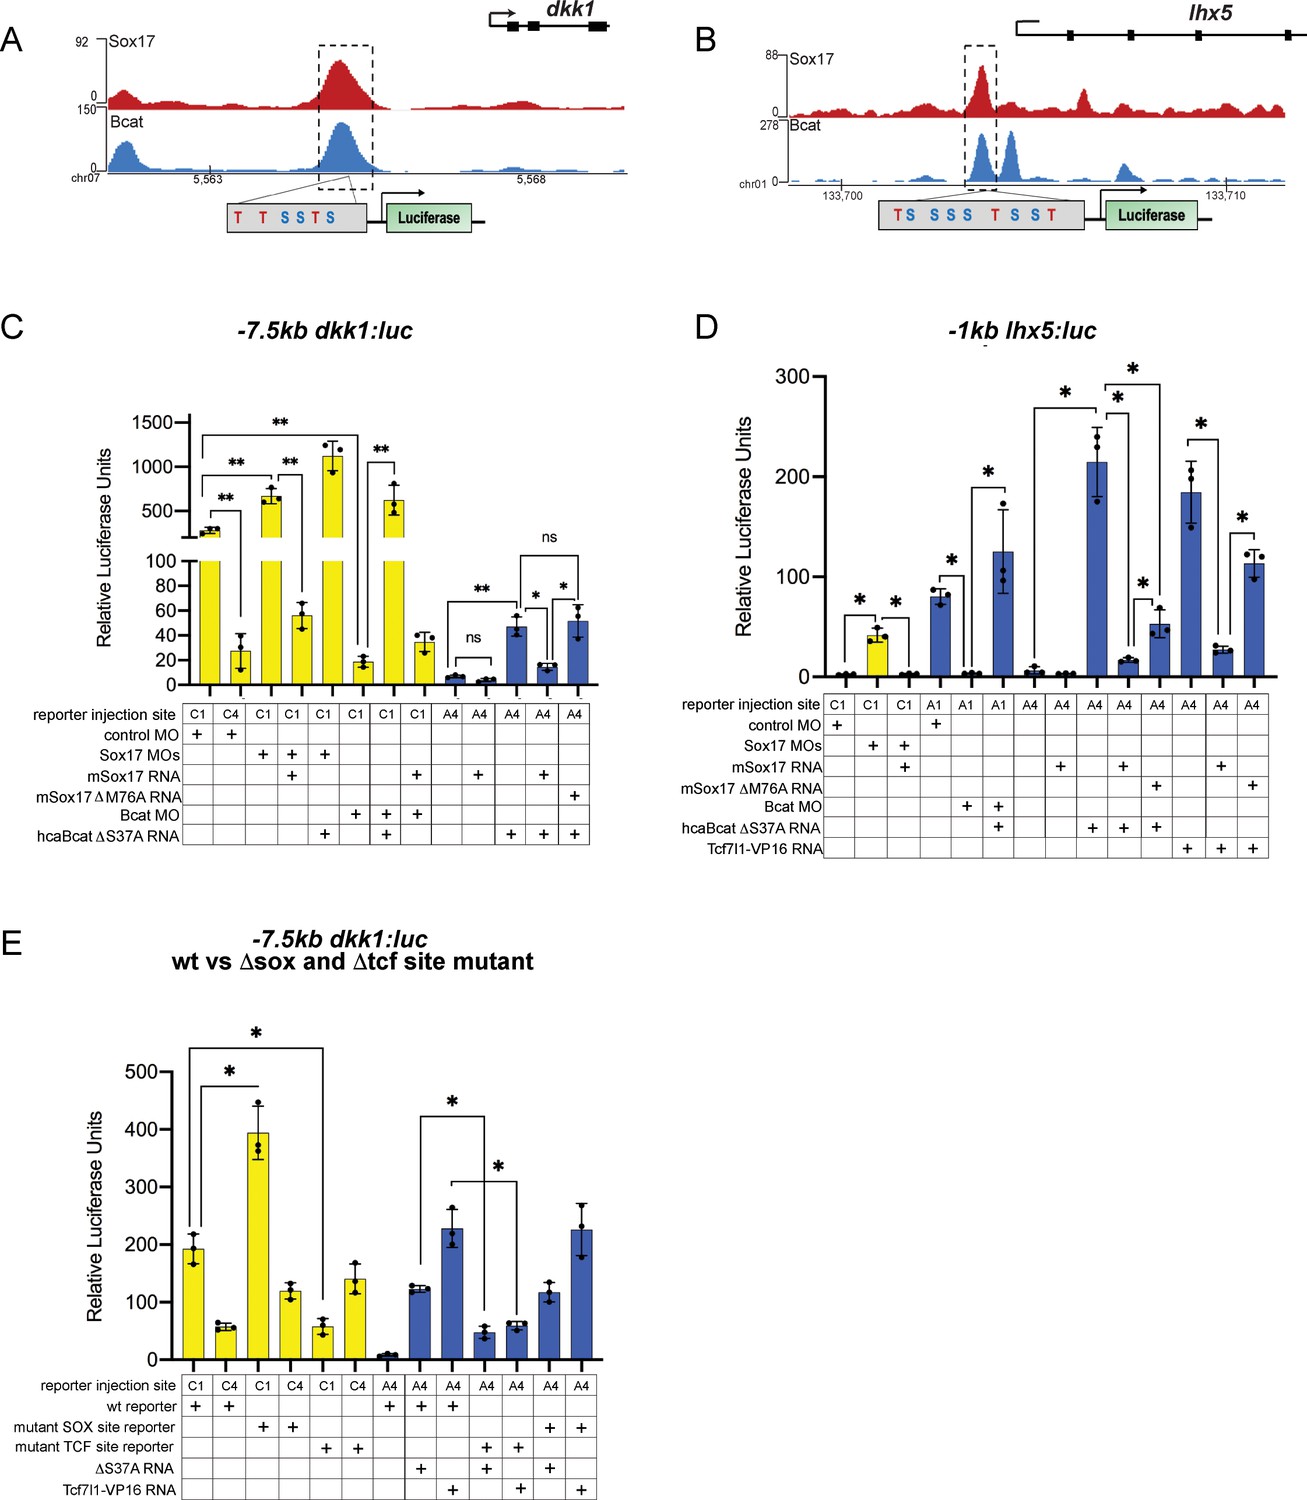
Reporter assays showing Sox17 and Bcat regulated −7.5 kb dkk1 and 1 kb lhx5 enhancers.
(A–B) IGV track and schematic of luciferase constructs showing the predicted Sox17 and Tcf DNA-binding sites at the Sox17/Bcat co-occupied (A) −7.5 kb dkk1 and (B) −1 kb lhx5 enhancers. (C–E) luciferase assay of (C) the wildtype −7.5 kb dkk:luc reporter, (D) wildtype −1 kb lhx5:luc reporter and (E) wildtype versus DSox-site and DTcf-site mutant −7.5 kb dkk1:luc reporters injected in different tissues with the indicated MOs and/or mRNAs. Sox17 represses Bcat-Tcf activation of the dkk1 and lhx5 enhancers. Histograms show mean luciferase activity ± standard deviation, *p<0.05 in pairwise Student T-tests.
Figure 7

Model of Sox17 and Bcat coregulation spatial transcription.
Differential engagement of Sox17, Bcat and Tcfs on enhancers in different cells modulates spatial expression domains. (A) In ectoderm cells lacking Sox17 (and Nodal signaling), ectoderm-specific gene lhx5 is activated through a Bcat/Tcf dependent mechanism while six1 and dkk1 are not transcribed. (B-C) Sox17 is expressed throughout the endoderm and dorsal mesendoderm, while Bcat activity is the higher in dorsal mesendoderm than deep endoderm. (B) In the dorsal region, Sox17 and Bcat synergistically coactivate six1 in the absence of Tcf, whereas Sox17 exerts a repressive influence on Bcat/Tcf-activation of lhx5 and dkk1. We postulate, however, that in the dorsal region Sox17-mediated repression is insufficient to overcome Bcat/Tcf activation of dkk1. (C) In deep endoderm cells where Bcat activity is lower, Sox17-mediated repression of Bcat/Tcf is sufficient to repress dkk1 and lhx5 transcription, but Bcat activity is not high enough to activate six1.
Additional files
-
Supplementary file 1
Sox17-regulated transcripts.
An excel spread sheet of differentially expressed genes from RNA-sequencing of control and Sox17-MO embryos across stages NF 9–12 and associated metadata annotations.
- https://cdn.elifesciences.org/articles/58029/elife-58029-supp1-v3.xlsx
-
Supplementary file 2
Sox17 ChIP-seq peaks.
Coordinates of Sox17-bound peaks at NF10.5 with their gene annotations.
- https://cdn.elifesciences.org/articles/58029/elife-58029-supp2-v3.xlsx
-
Supplementary file 3
β-Catenin-regulated transcripts.
An excel spread sheet of differentially expressed genes in RNA-sequencing of control and Bcat-MO embryos across stages NF 9–12 and associated metadata annotations.
- https://cdn.elifesciences.org/articles/58029/elife-58029-supp3-v3.xlsx
-
Supplementary file 4
β-Catenin ChIP-seq peaks.
Coordinates of Bcat-bound peaks at NF10.5 with their gene annotations. Primary data from GSE72657 (Nakamura et al., 2016).
- https://cdn.elifesciences.org/articles/58029/elife-58029-supp4-v3.xlsx
-
Supplementary file 5
Sox17- β-catenin cobound chromatin.
Coordinates of 191 Sox17 and Bcat cobound/coregulated enhancers and the frequency of Sox and Tcf DNA-binding sites per peak.
- https://cdn.elifesciences.org/articles/58029/elife-58029-supp5-v3.xlsx
-
Supplementary file 6
Sox17- β-catenin cobound and regulated enhancers.
Sequence of wild-type and Sox/Tcf mutated enhancers used for luciferase assays.
- https://cdn.elifesciences.org/articles/58029/elife-58029-supp6-v3.docx
-
Supplementary file 7
Plasmids and primers.
An excel file of information of the cDNA plasmid used for in situ probe synthesis (tab-1) and primers for used for ChIP-qPCR (tab-2).
- https://cdn.elifesciences.org/articles/58029/elife-58029-supp7-v3.xlsx
-
Transparent reporting form
- https://cdn.elifesciences.org/articles/58029/elife-58029-transrepform-v3.pdf
Download links
A two-part list of links to download the article, or parts of the article, in various formats.
Downloads (link to download the article as PDF)
Open citations (links to open the citations from this article in various online reference manager services)
Cite this article (links to download the citations from this article in formats compatible with various reference manager tools)
Sox17 and β-catenin co-occupy Wnt-responsive enhancers to govern the endoderm gene regulatory network
eLife 9:e58029.
https://doi.org/10.7554/eLife.58029


