Arrayed CRISPRi and quantitative imaging describe the morphotypic landscape of essential mycobacterial genes
- SAMRC/NHLS/UCT Molecular Mycobacteriology Research Unit, Department of Pathology, University of Cape Town, South Africa
- Institute of Infectious Disease and Molecular Medicine, University of Cape Town, South Africa
- Department of Integrative Biomedical Sciences, University of Cape Town, South Africa
- Wellcome Centre for Infectious Diseases Research in Africa, University of Cape Town, South Africa
Figures
Figure 1 with 1 supplement
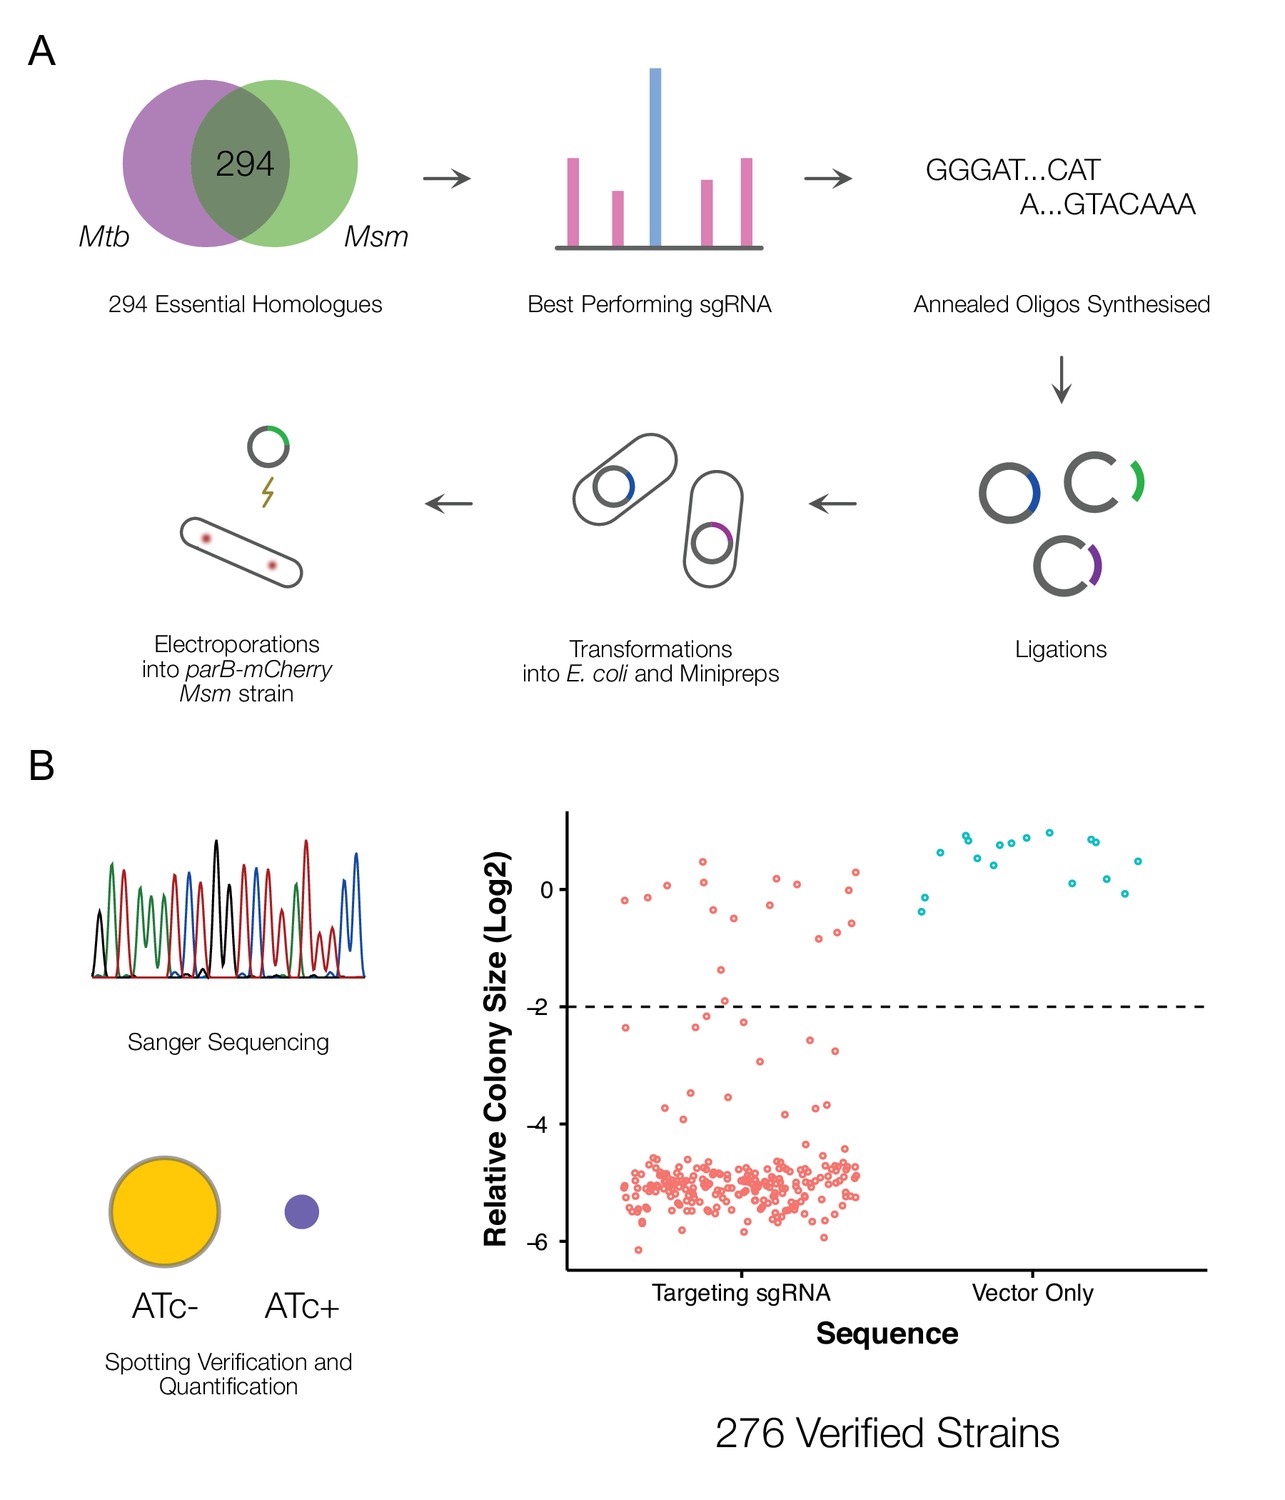
A CRISPRi library targeting essential M. smegmatis homologs of M. tuberculosis genes.
(A) An arrayed CRISPRi library was designed to target 294 essential M. smegmatis genes. For each gene, the highest efficiency sgRNA was identified from a previous pooled CRISPRi-Seq screen (de Wet et al., 2018) and synthesized as an annealed oligonucleotide. Cloning was performed at scale, followed by electroporation into an M. smegmatis ParB-mCherry reporter strain (Santi and McKinney, 2015). (B) A total of 276 sequence-verified transformants produced a greater than twofold decrease in colony size (Kritikos et al., 2017) when spotted on 7H10 agar containing the inducer, anhydrotetracycline (ATc) compared to the same cells spotted onto solid medium without ATc, confirming ATc-dependent growth inhibition.
Figure 1—figure supplement 1
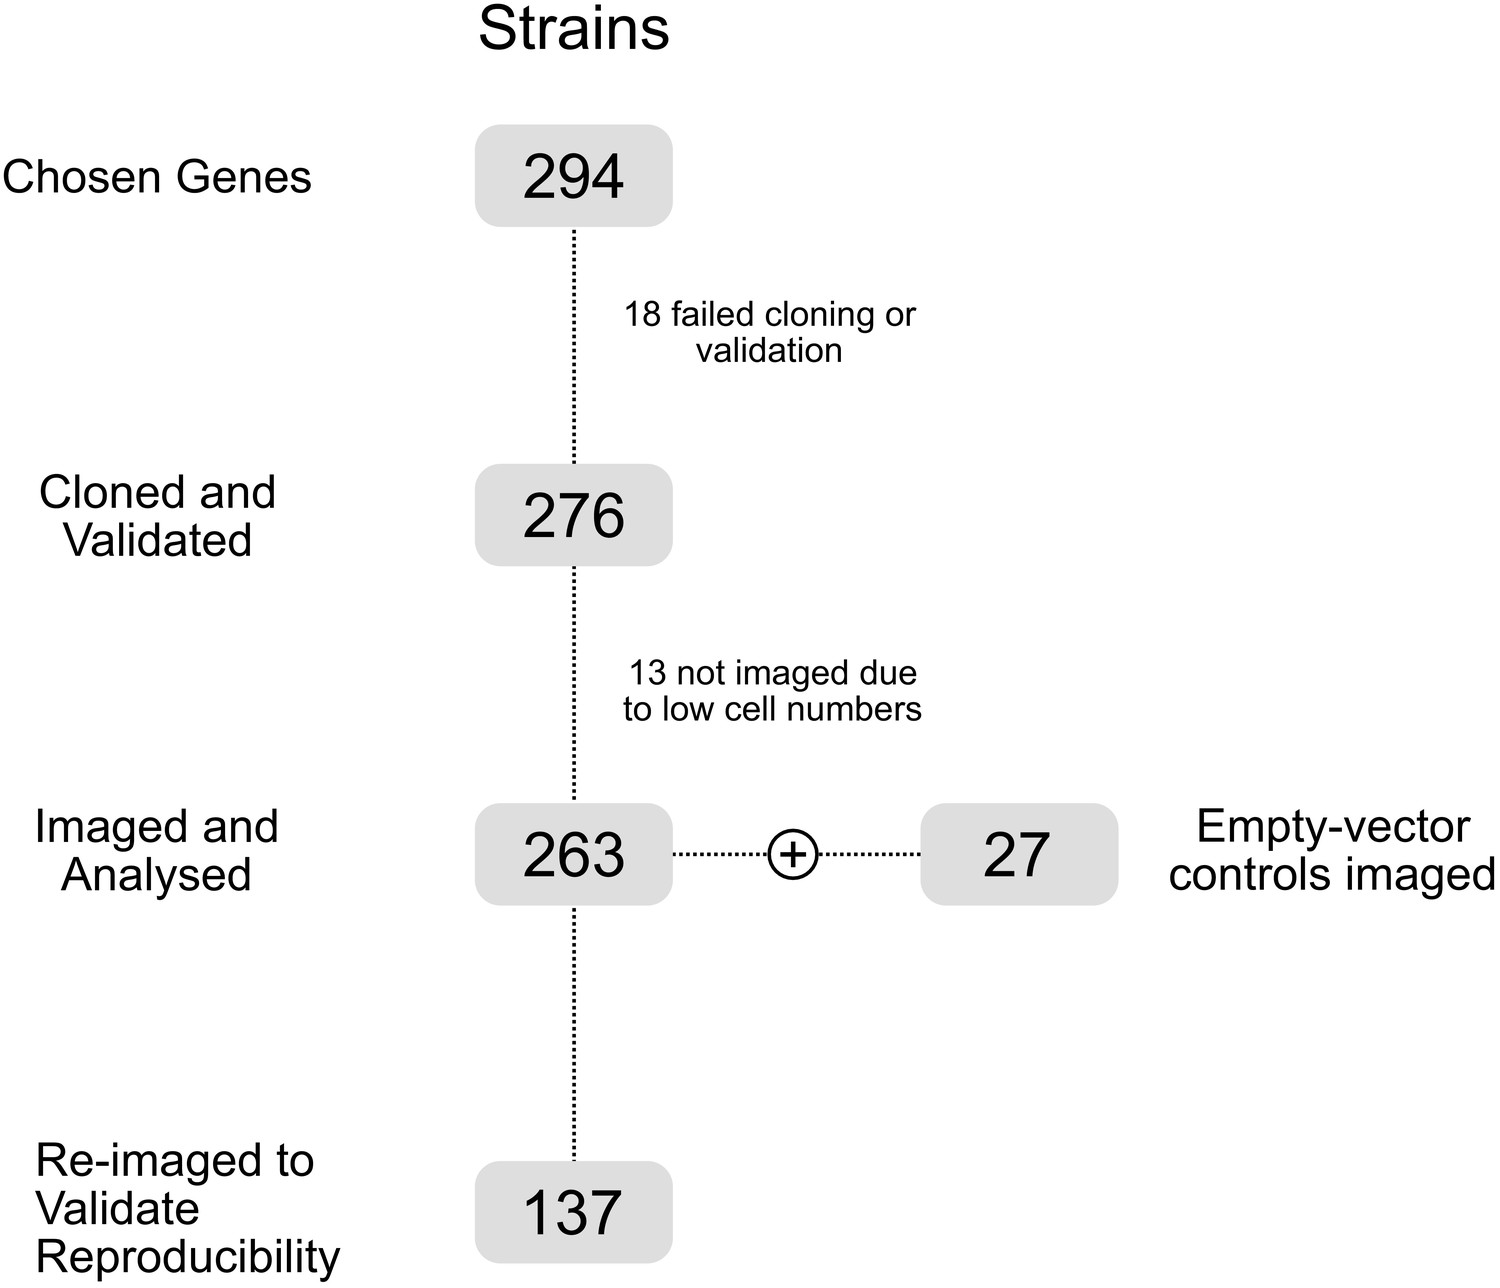
Numbers of strains used at each point of this study.
Figure 2 with 3 supplements
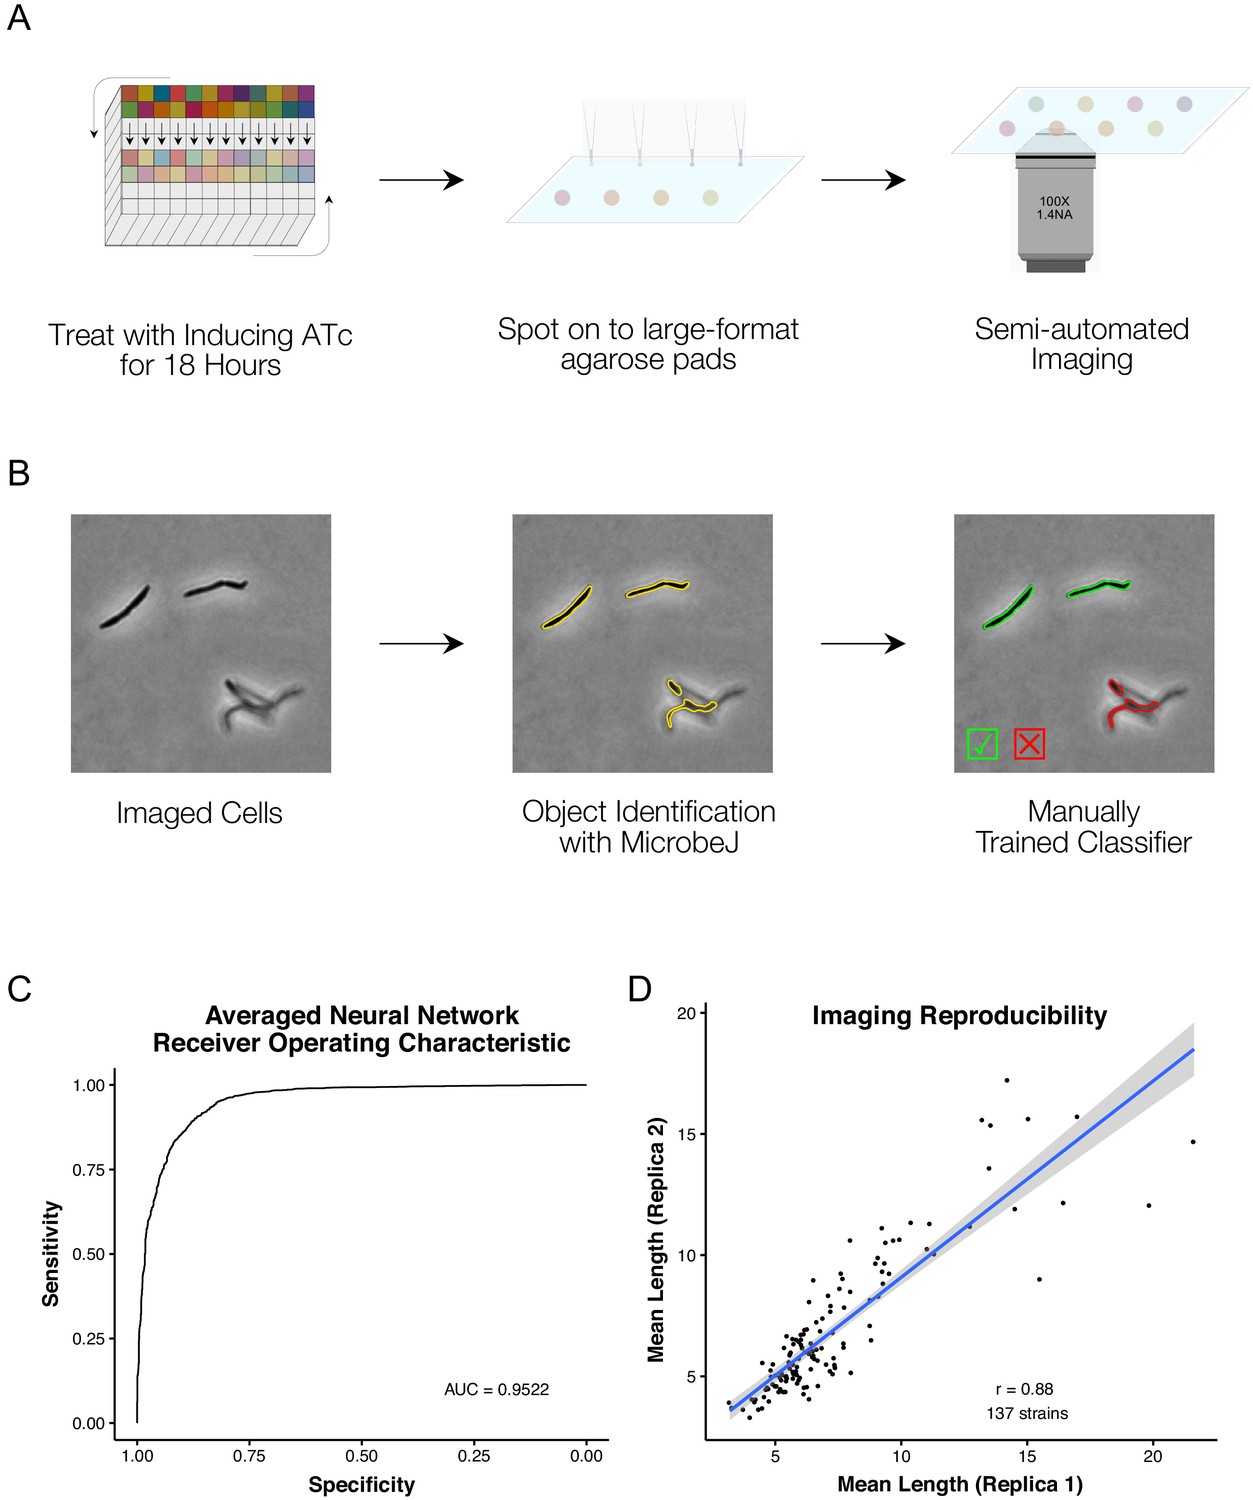
A high-throughput, quantitative CRISPRi-imaging pipeline for mycobacteria.
(A) Cells were exposed to ATc inducer for 18 hr before spotting onto large-format agarose pads for semi-automated imaging. (B) Image processing in MicrobeJ (Ducret et al., 2016) was combined with a manually trained Averaged Neural Network classifier to extract quantitative descriptions of bacterial morphologies and ParB protein localizations for 163559 cells across 263 gene-specific CRISPRi mutants and 27 empty vector controls. (C) Classifier performance was measured by Receiver Operating Characteristic (ROC) Area Under the Curve (AUC), returning good performance metrics. (D) Mean cell lengths were compared for 137 strains imaged as biological replicates on two separate occasions, and showed high reproducibility (r = 0.88, Pearson’s).
Figure 2—figure supplement 1
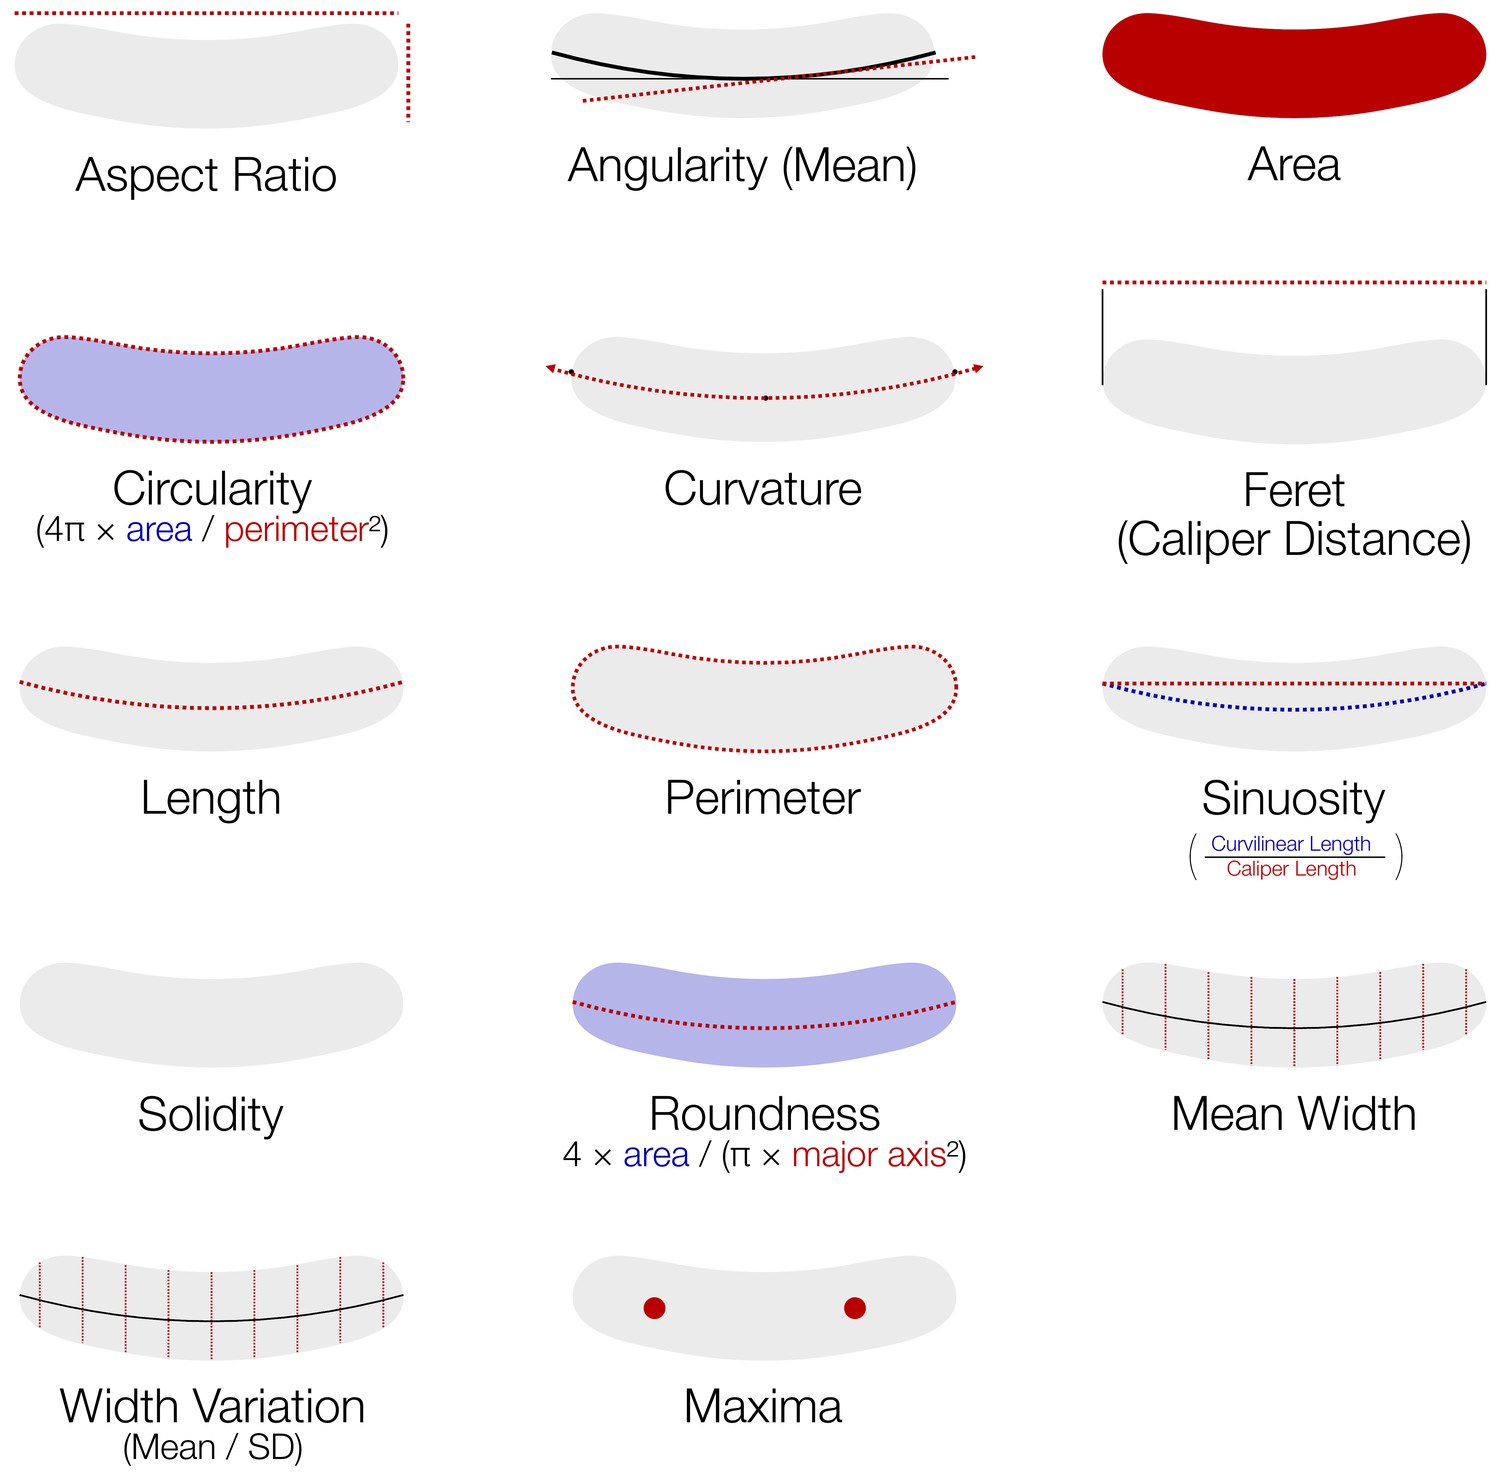
Features extracted by MicrobeJ (Ducret et al., 2016) and utilized in downstream analysis.
Detailed descriptions of each feature can be found in the supplementary material of Ducret et al., 2016.
Figure 2—figure supplement 2
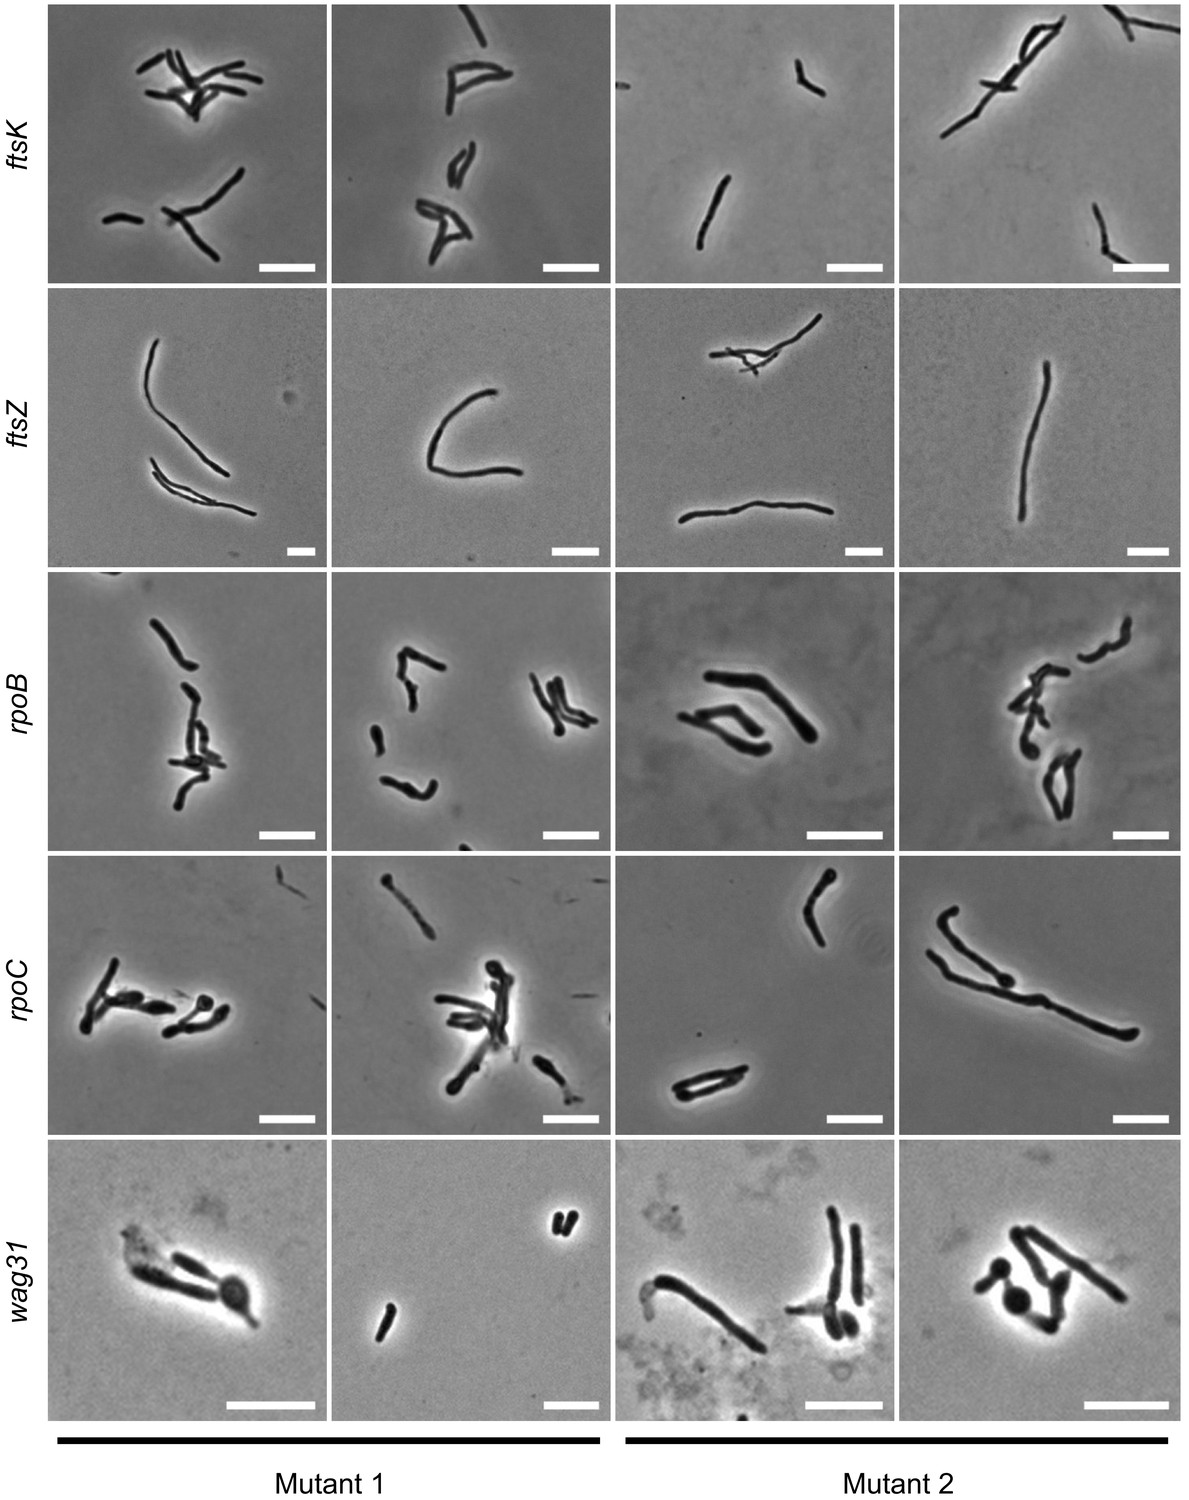
Consistency of phenotypes with varying sgRNAs.
A selection of mutants present in the library (Mutant 1) were chosen and targeted with a second sgRNA (Mutant 2). Phenotypes were broadly consistent.
Figure 2—figure supplement 3
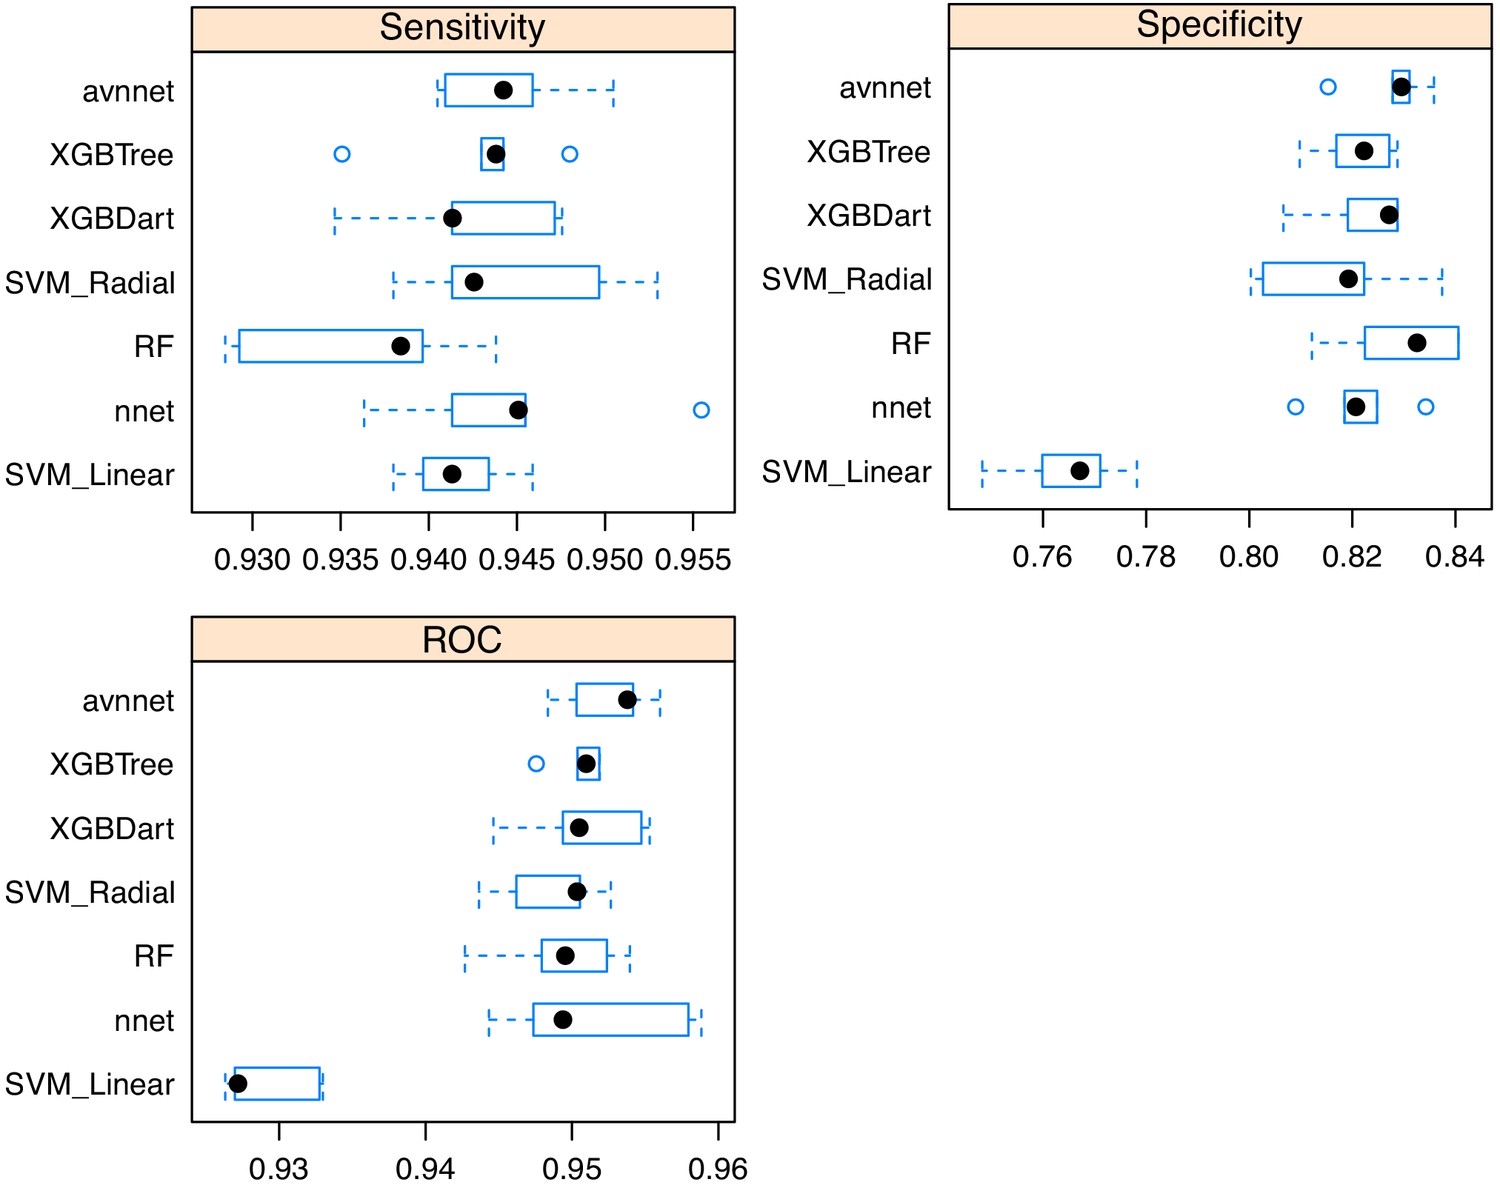
Comparisons of cell classifier models.
Samples of the imaged library were analyzed with MicrobeJ and manually classified. A variety of models was trained using Caret, with fivefold cross validation, and tested on a reserved sample of the classified images. An averaged neural network was selected as the best performing model based on receiver-operating characteristic (ROC) area-under-the-curve.
Figure 3
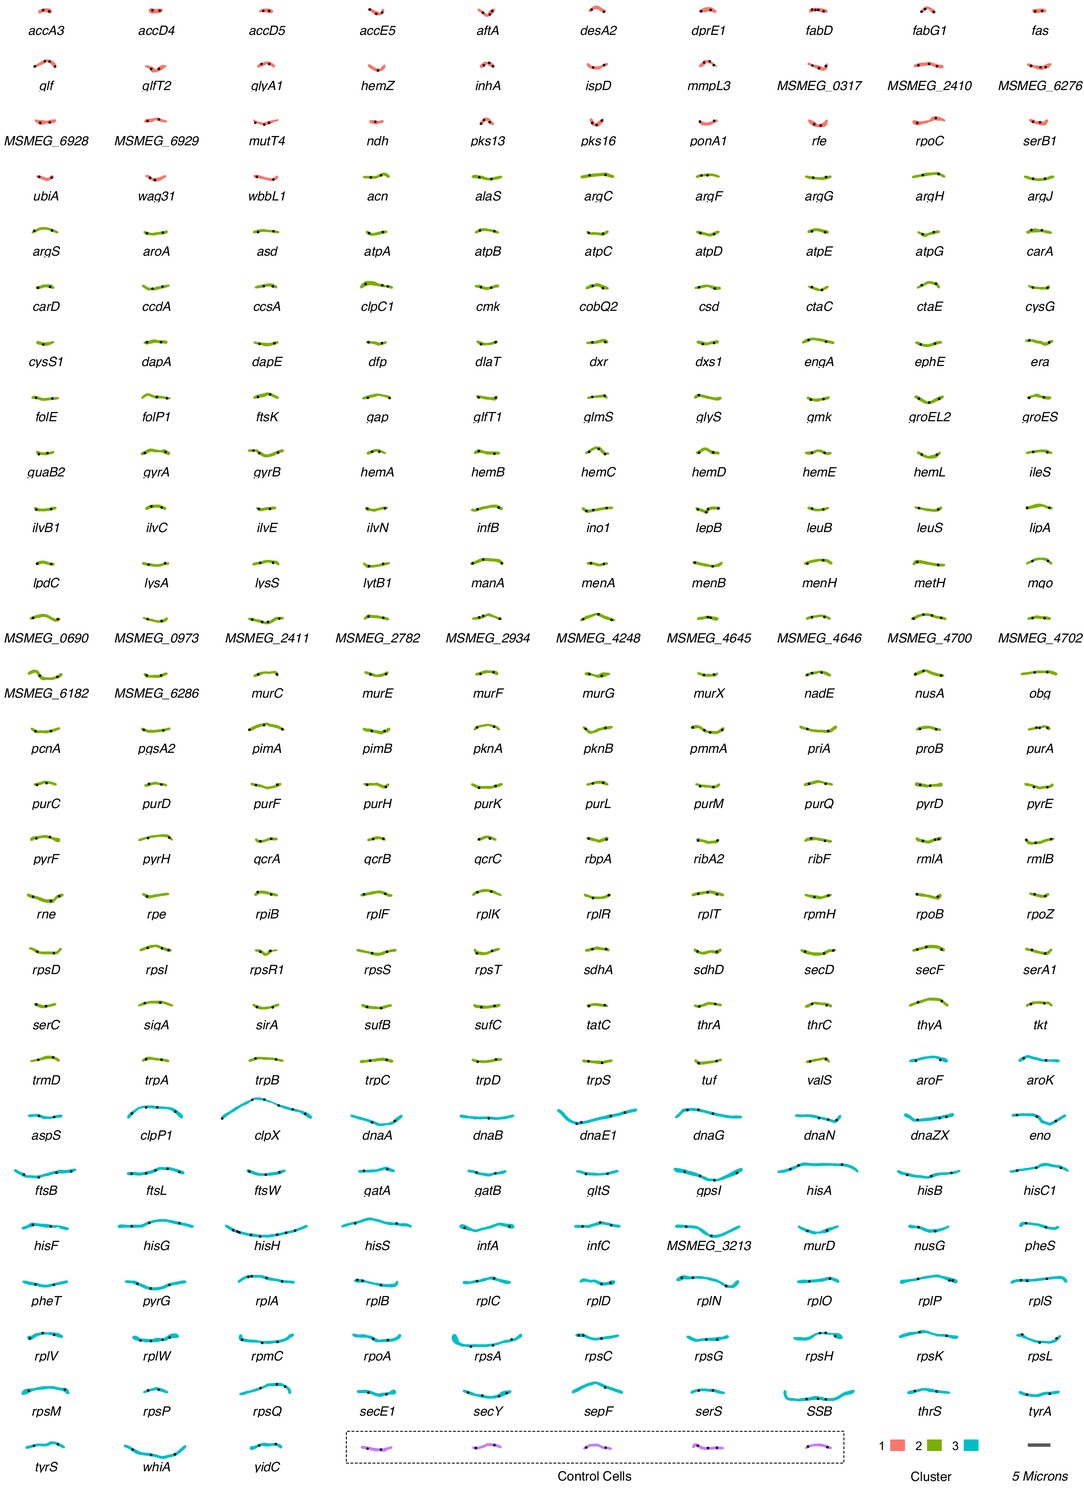
An atlas of morphological changes consequent on essential gene silencing in M. smegmatis.
Following imaging and extraction of quantitative data on cellular morphology, an approximate nearest-neighbor approach was utilized to identify a single representative cell which was closest to the mean values of the measured morphological features for each specific (clonal) mutant population. Representative cell contours and ParB localization patterns were extracted from MicrobeJ and utilized to assemble the atlas of morphological changes. Cells are grouped and colored according to downstream clustering (Figure 5).
Figure 4 with 2 supplements
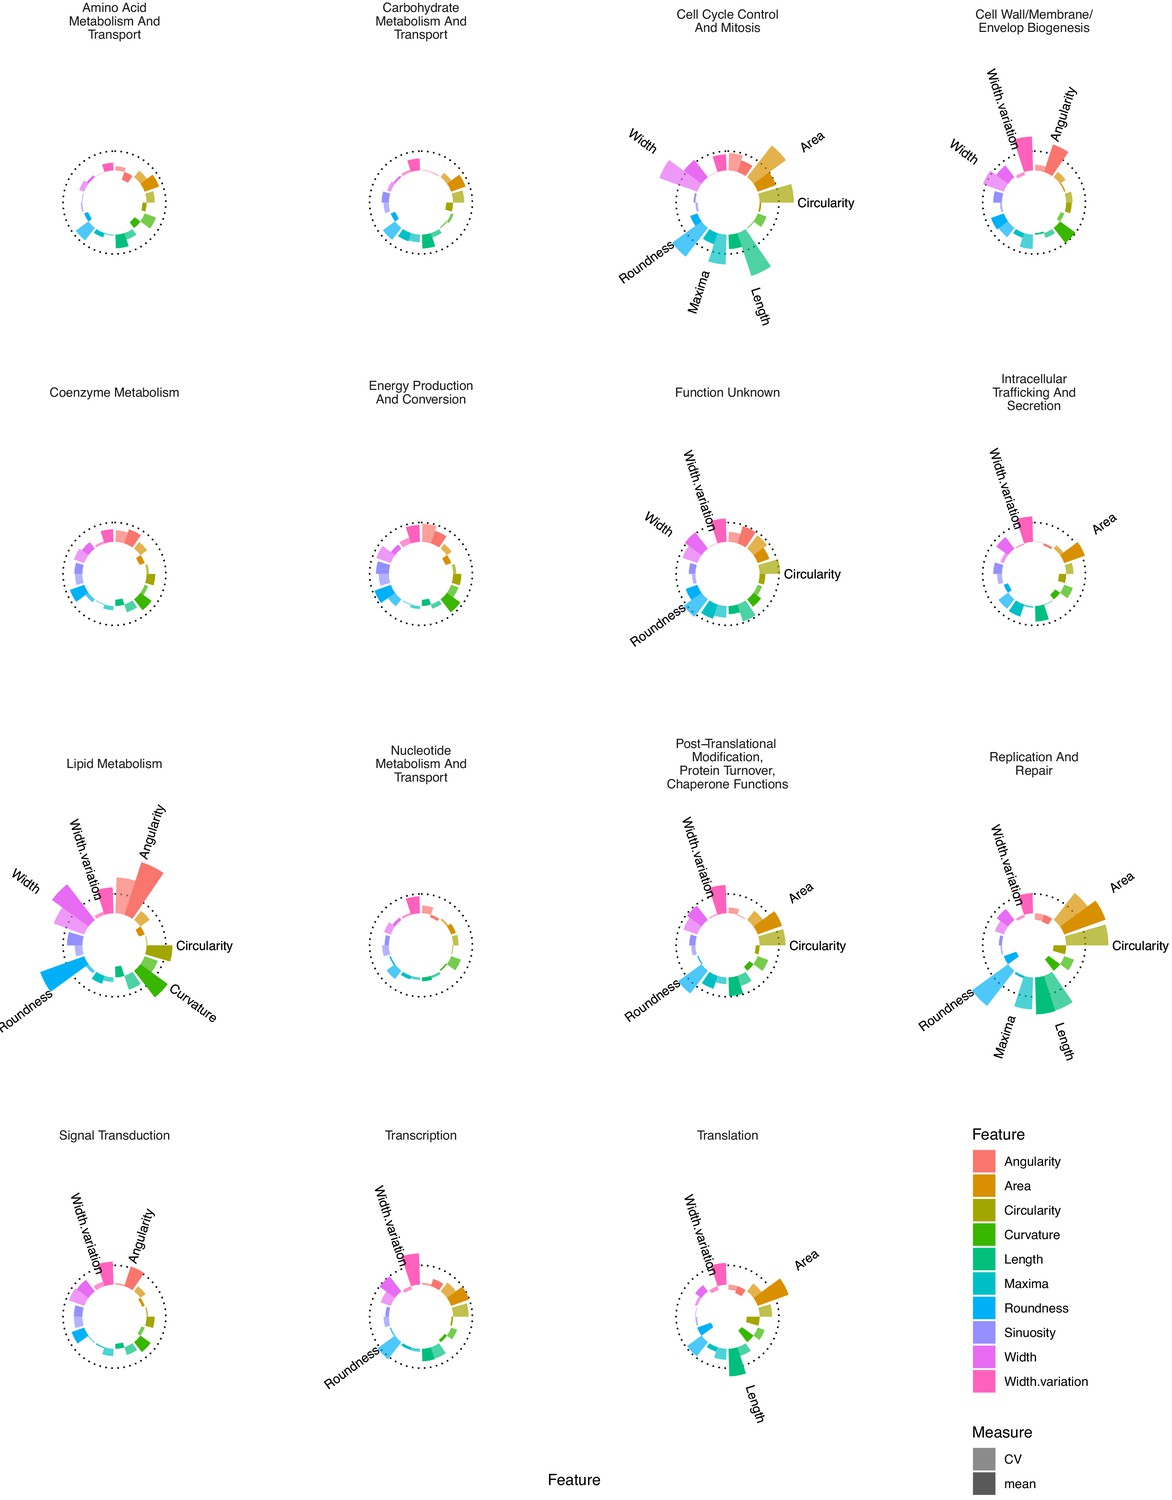
Essential gene silencing produces distinctive phenoprints of genetic function.
Mean Z-scores were calculated and visualized for all genes assigned to a particular COG, highlighting distinctive changes in morphology. The dotted line indicates a Z-score of 3. Selected features with mean Z-scores > 3 are labeled.
Figure 4—figure supplement 1
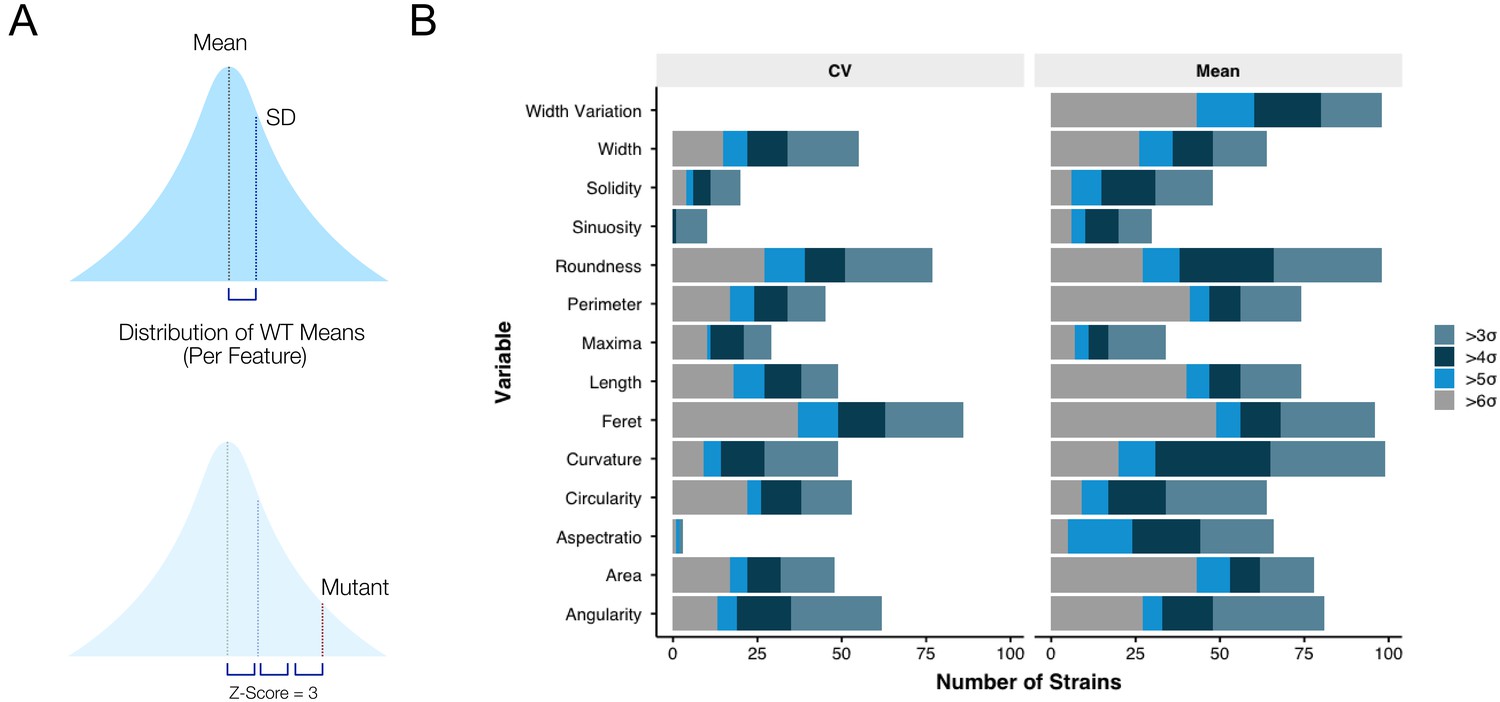
The morphological impact of essential gene silencing.
(A) The mean and coefficient of variation (CV) was determined for each morphological feature, for each gene knockdown, followed by a Z-score transformation. (B) From the arrayed library, 206 (78%) mutants had at least one morphological feature with a Z-score >3, or <-3.
Figure 4—figure supplement 2
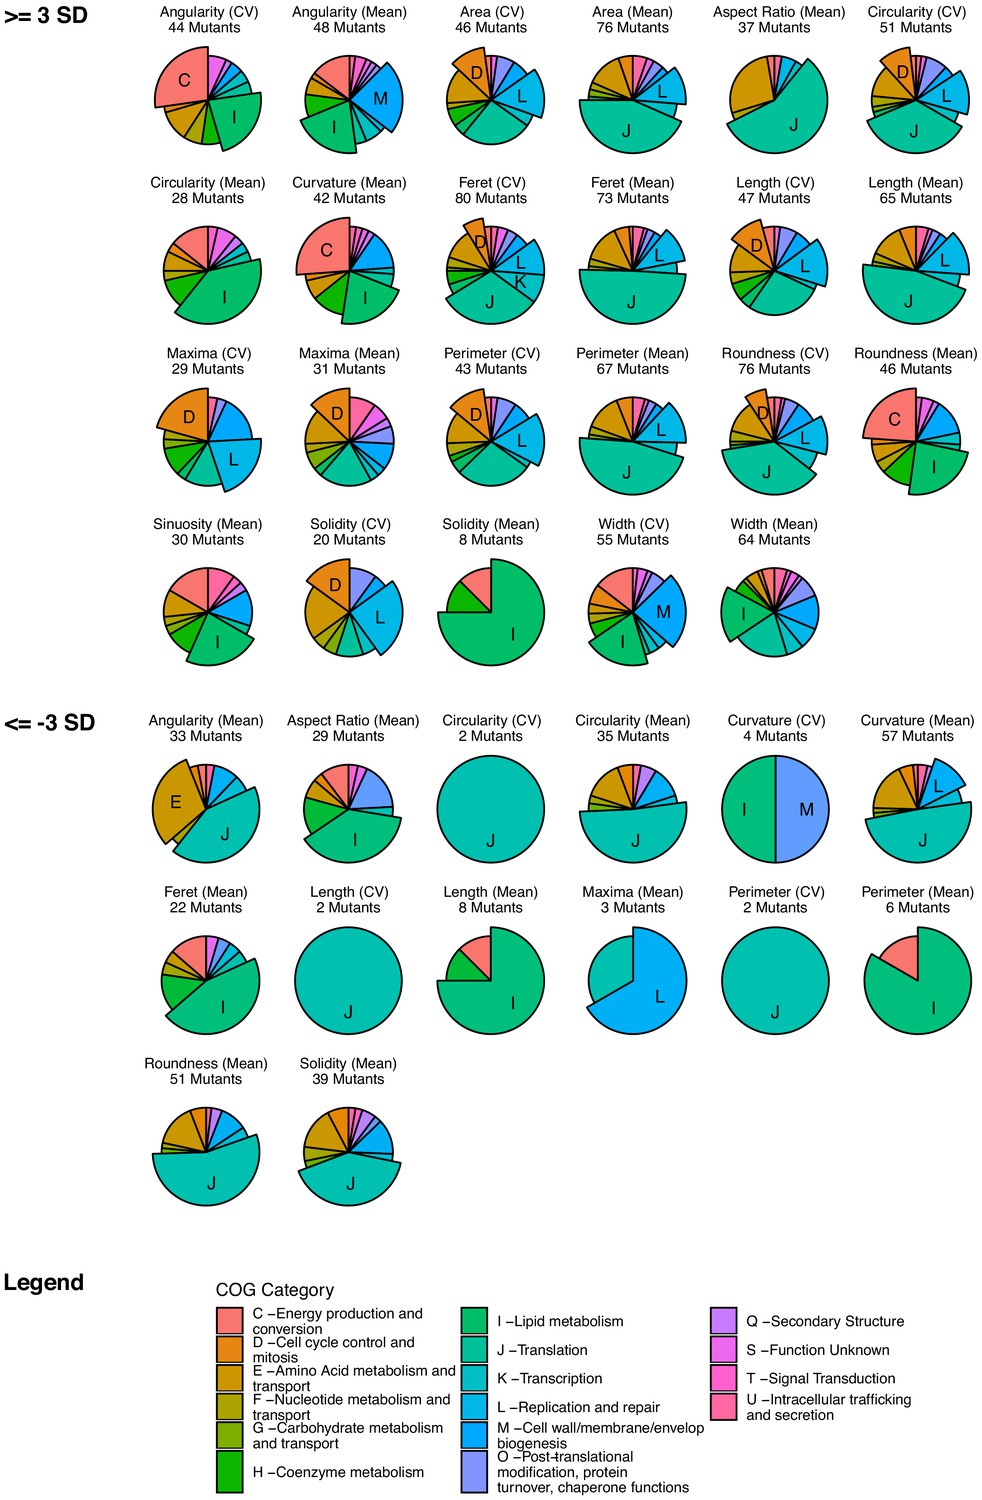
COG enrichment identifies associations between genetic function and morphological changes.
Each gene in the library was functionally annotated to a cluster of orthologous groups (COG) category. For each morphological feature, mutants were selected with Z-scores > 3, or <-3, and tested for statistical enrichment of COGs, with adjustment for multiple testing. Only features with at least one statistically enriched COG (adjusted p value ≤ 0.05) are shown and labeled.
Figure 5 with 1 supplement
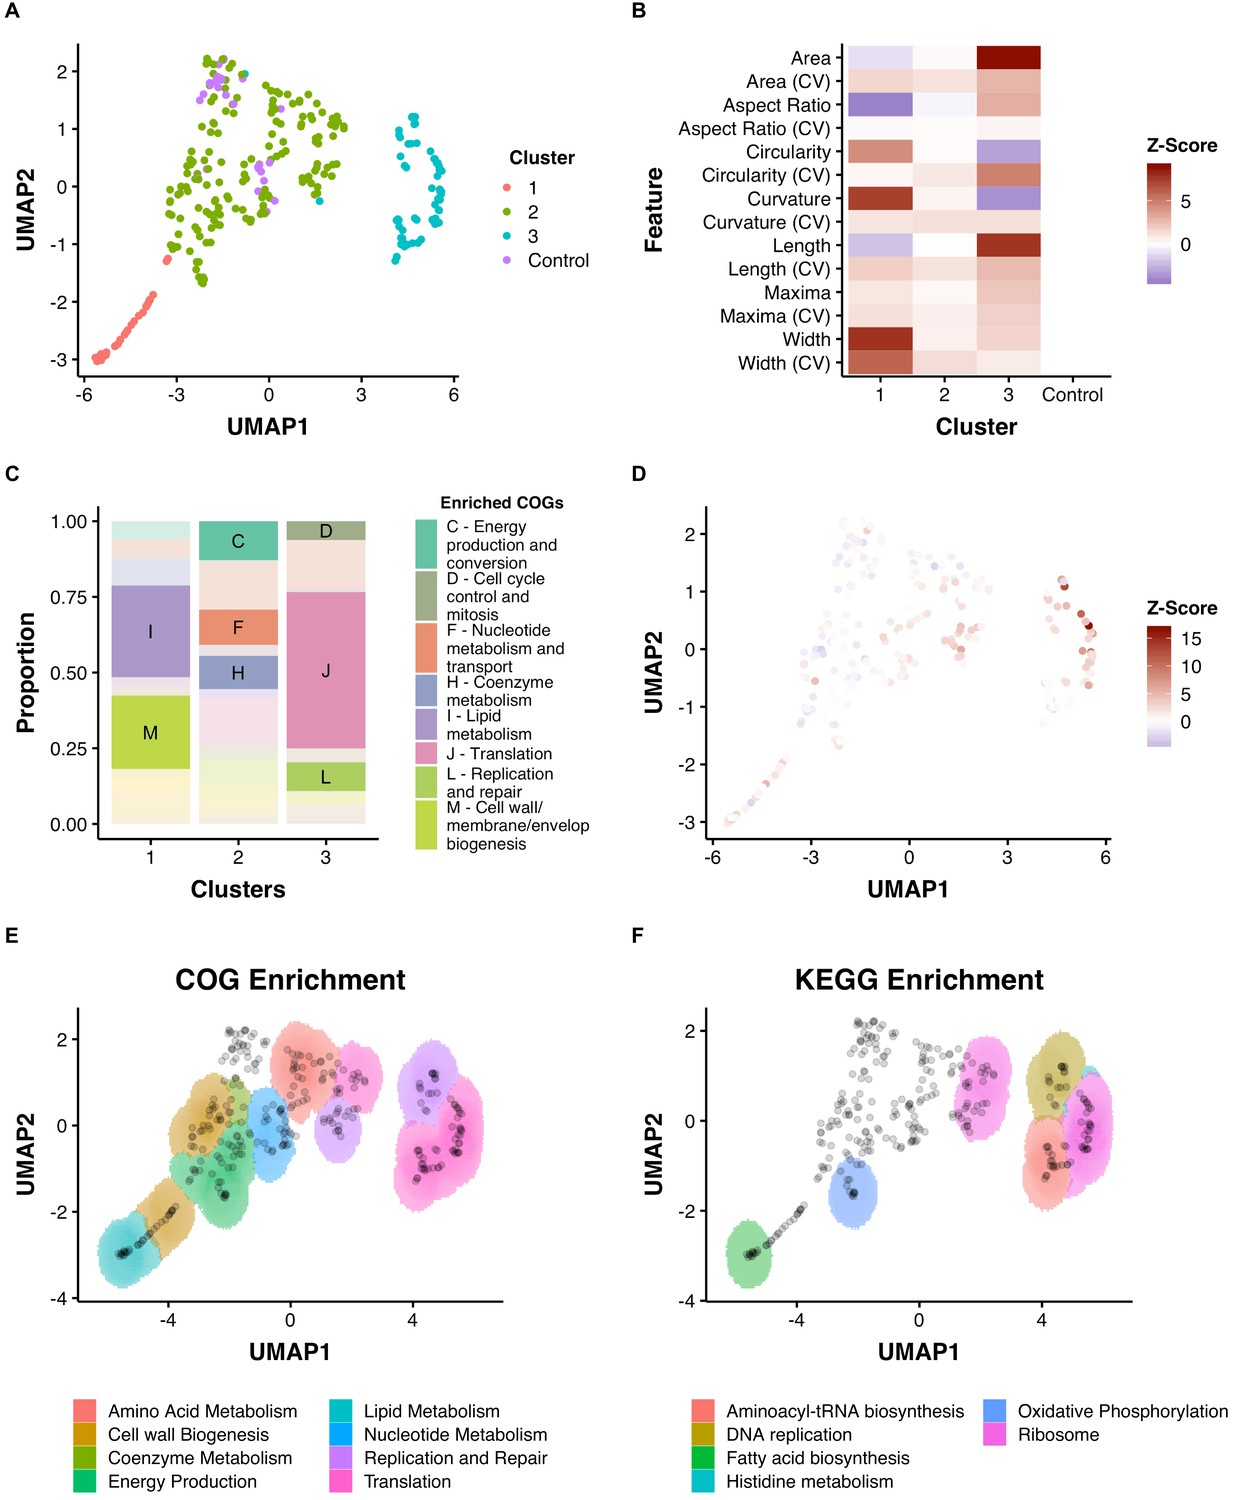
Dimensionality reduction reveals clusters of morphological change that associate with function.
(A) A combination of UMAP dimensionality reduction (Lel et al., 2018) and hdbscan clustering (Lel et al., 2017) was applied to processed morphological data. Parameters were optimized to ensure a uniform clustering of control strains (MinPts = 12). A consistent seed was used for visualization. (B) The mean Z-Scores of each cluster highlights the dominant features determining clustering. (C) Clusters are enriched for certain COGs. (D) Overlaid Z-score data for mean aspect ratio, length, maxima, and width demonstrate heterogeneity within clusters. (E) and (F) An adapted SAFE (Baryshnikova, 2016) approach demonstrates that functionally enriched sub-clusters are present in UMAP space.
Figure 5—figure supplement 1

Distances in UMAP space can reflect relationships of biological relevance.
We obtained data on high-confidence operon identification from a published report (Martini et al., 2019) and compared the Euclidean distances of genes in identified operons to random pairs of genes. A similar approach was used for published protein–protein interaction predictions (Cong et al., 2019).
Figure 6
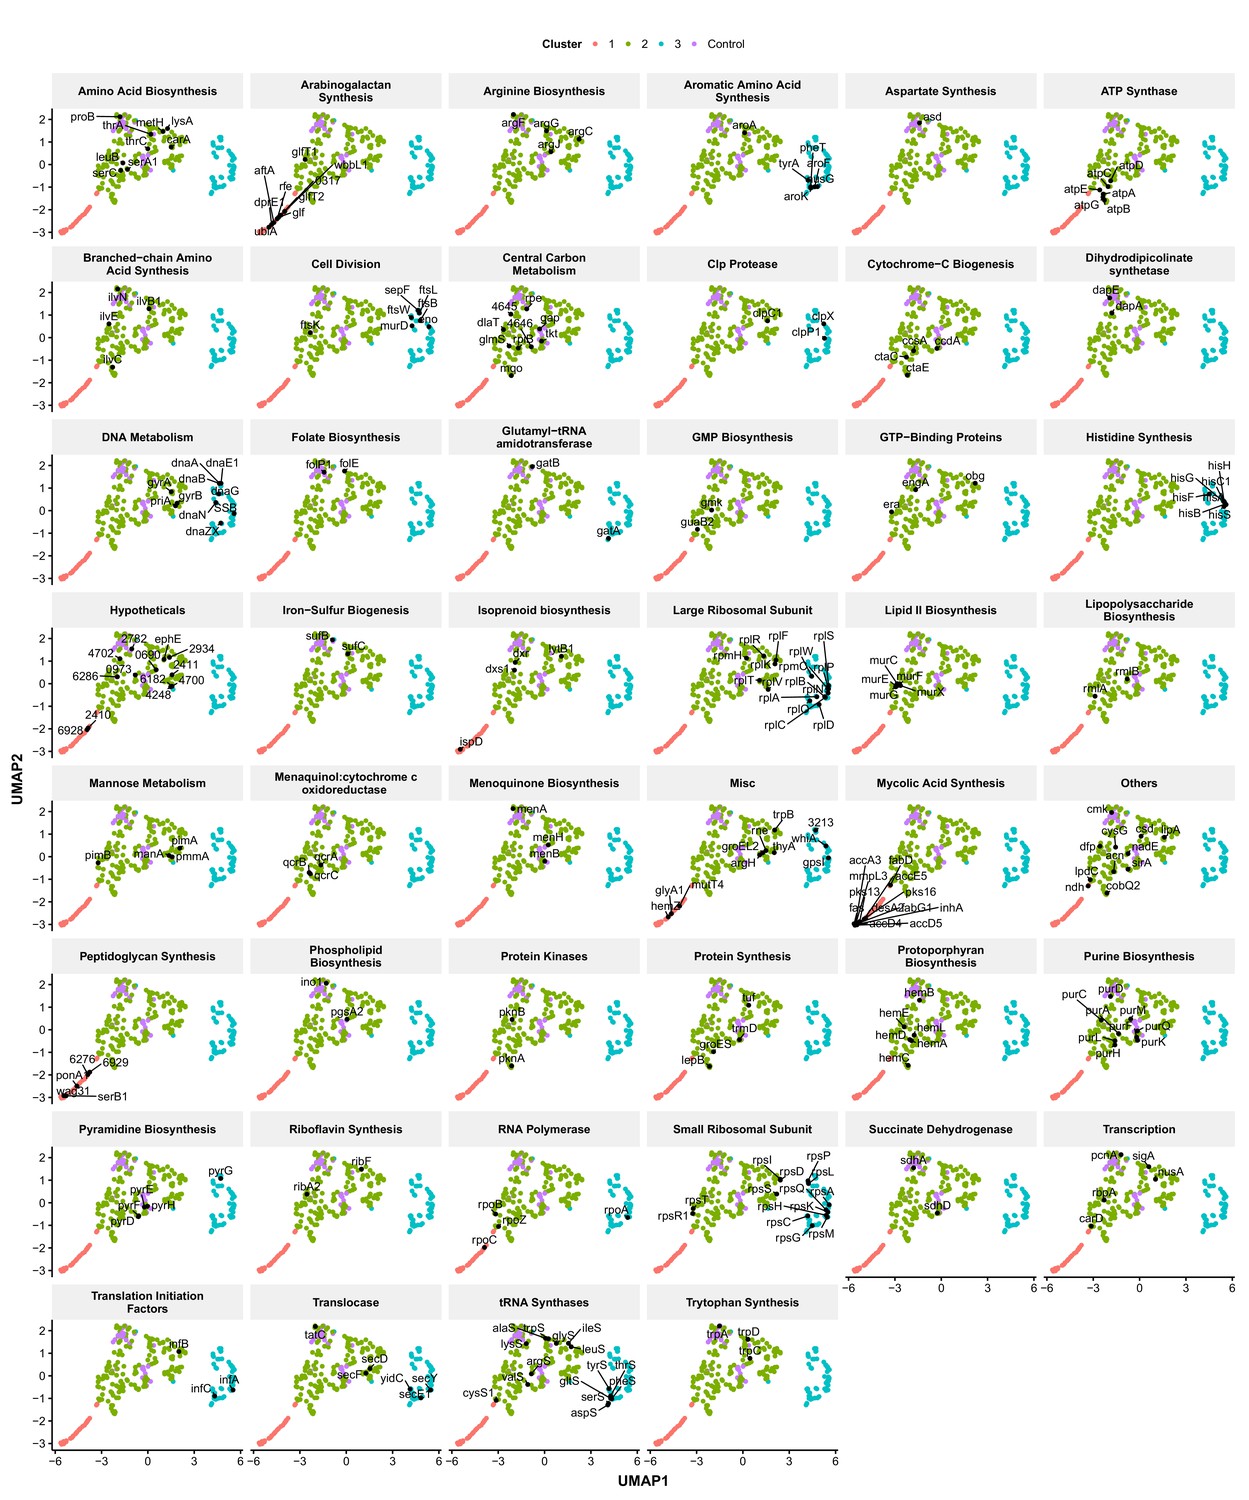
Functionally related genes are frequently found associated in UMAP space.
Genes were manually classified following a review of the literature (Supplementary file 3) and visualized in UMAP space. Numbers represent M. smegmatis accession numbers.
Figure 7 with 1 supplement
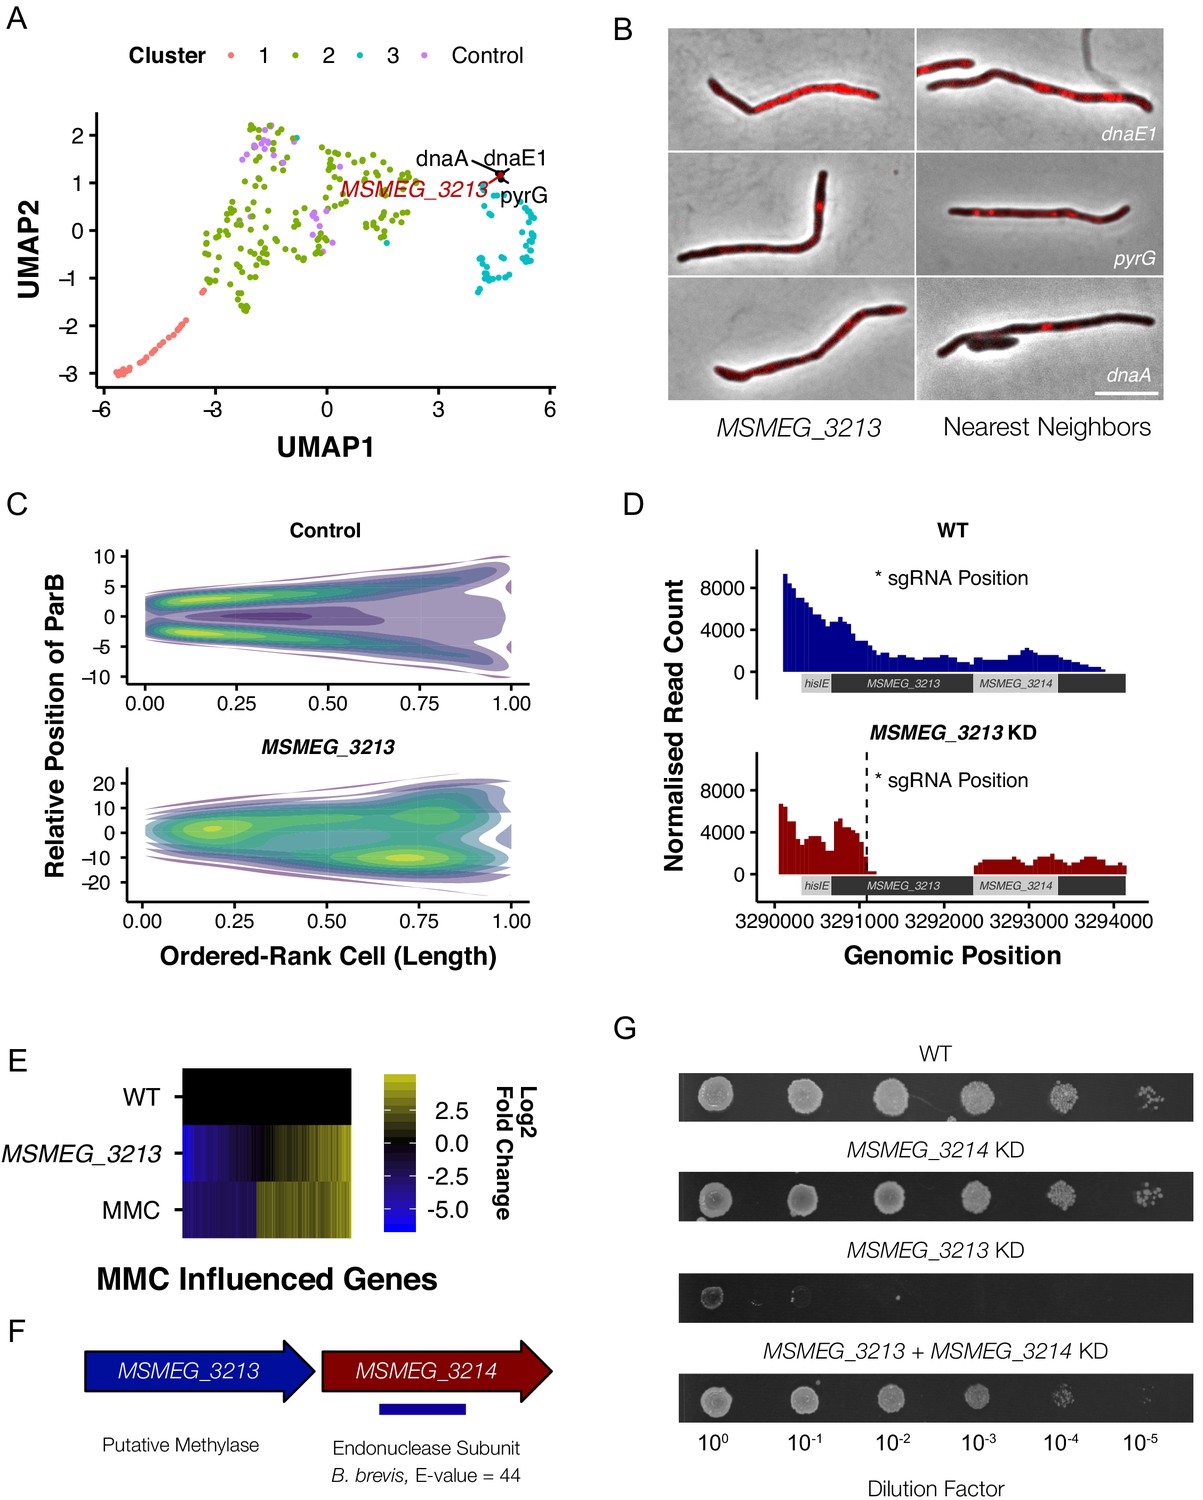
M. smegmatis encodes a previously undescribed restriction-modification system.
(A) MSMEG_3213, a putative DNA methylase, is associated with genes involved in DNA replication and repair in UMAP space. (B) Knockdown of MSMEG_3213 leads to cellular filamentation. The morphological nearest neighbors are dnaE1, pyrG and dnaA. (C) Consensus heatmaps of ParB-mCherry localization demonstrate that oriC positioning is disrupted in the MSMEG_3213 knockdown mutant. (D) Nanopore-based RNA-Seq confirmed that knockdown of MSMEG_3213 was specific to the targeted sgRNA position. (E) MSMEG_3213 produces a transcriptional response comparable to treatment with the DNA damaging agent, mitomycin C (MMC). (F) MSMEG_3213 is located upstream of MSMEG_3214, a gene with weak homology, according to HHpred (Hildebrand et al., 2009), to an endonuclease subunit (REBASE: 3098 BbvCI). (G) Lethality of MSMEG_3213 knockdown is suppressed by simultaneous CRISPRi-mediated knockdown of MSMEG_3214.
Figure 7—figure supplement 1
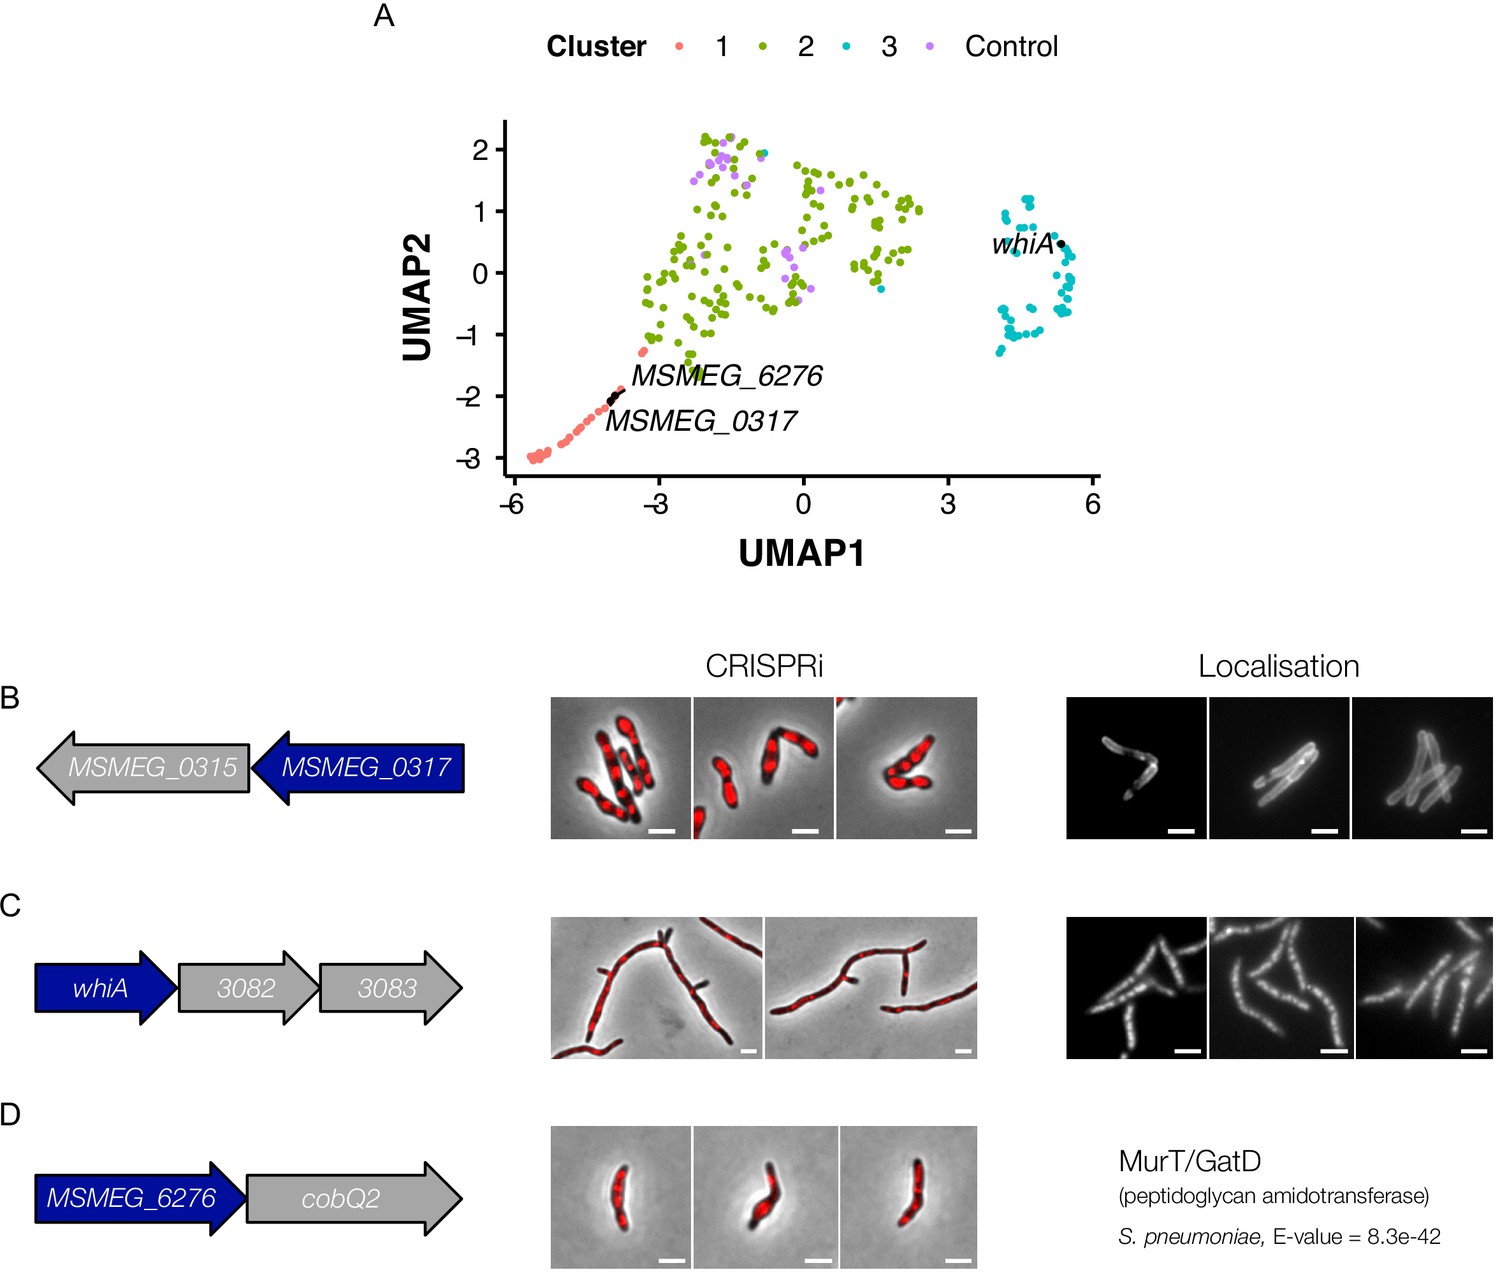
Morphological profiling informs gene function.
(A) Genes with putative function were visualized in UMAP space. MSMEG_0317 (Cashmore et al., 2017) and MSMEG_6276 (murT) were found in the cell-wall cluster, supporting their suggested roles as components of cell-wall synthesis. The transcription factor, WhiA (Rustad et al., 2014), was found in the DNA-Cell Division-Translation Cluster, suggesting a role in cell-cycle regulation. (B) MSMEG_0317 produces a distinct phenotype on knockdown, with Dendra-tagged MSMEG_0317 localizing to the cell wall and cell septa. (C) Knockdown of whiA produces elongated, branching cells, with Dendra-tagged WhiA localized to the nucleoid. (D) MSMEG_6276, a gene predicted by HHpred (Hildebrand et al., 2009) to have strong homology to murT/gatD, causes cellular bulging and lysis on silencing.
Figure 8 with 1 supplement
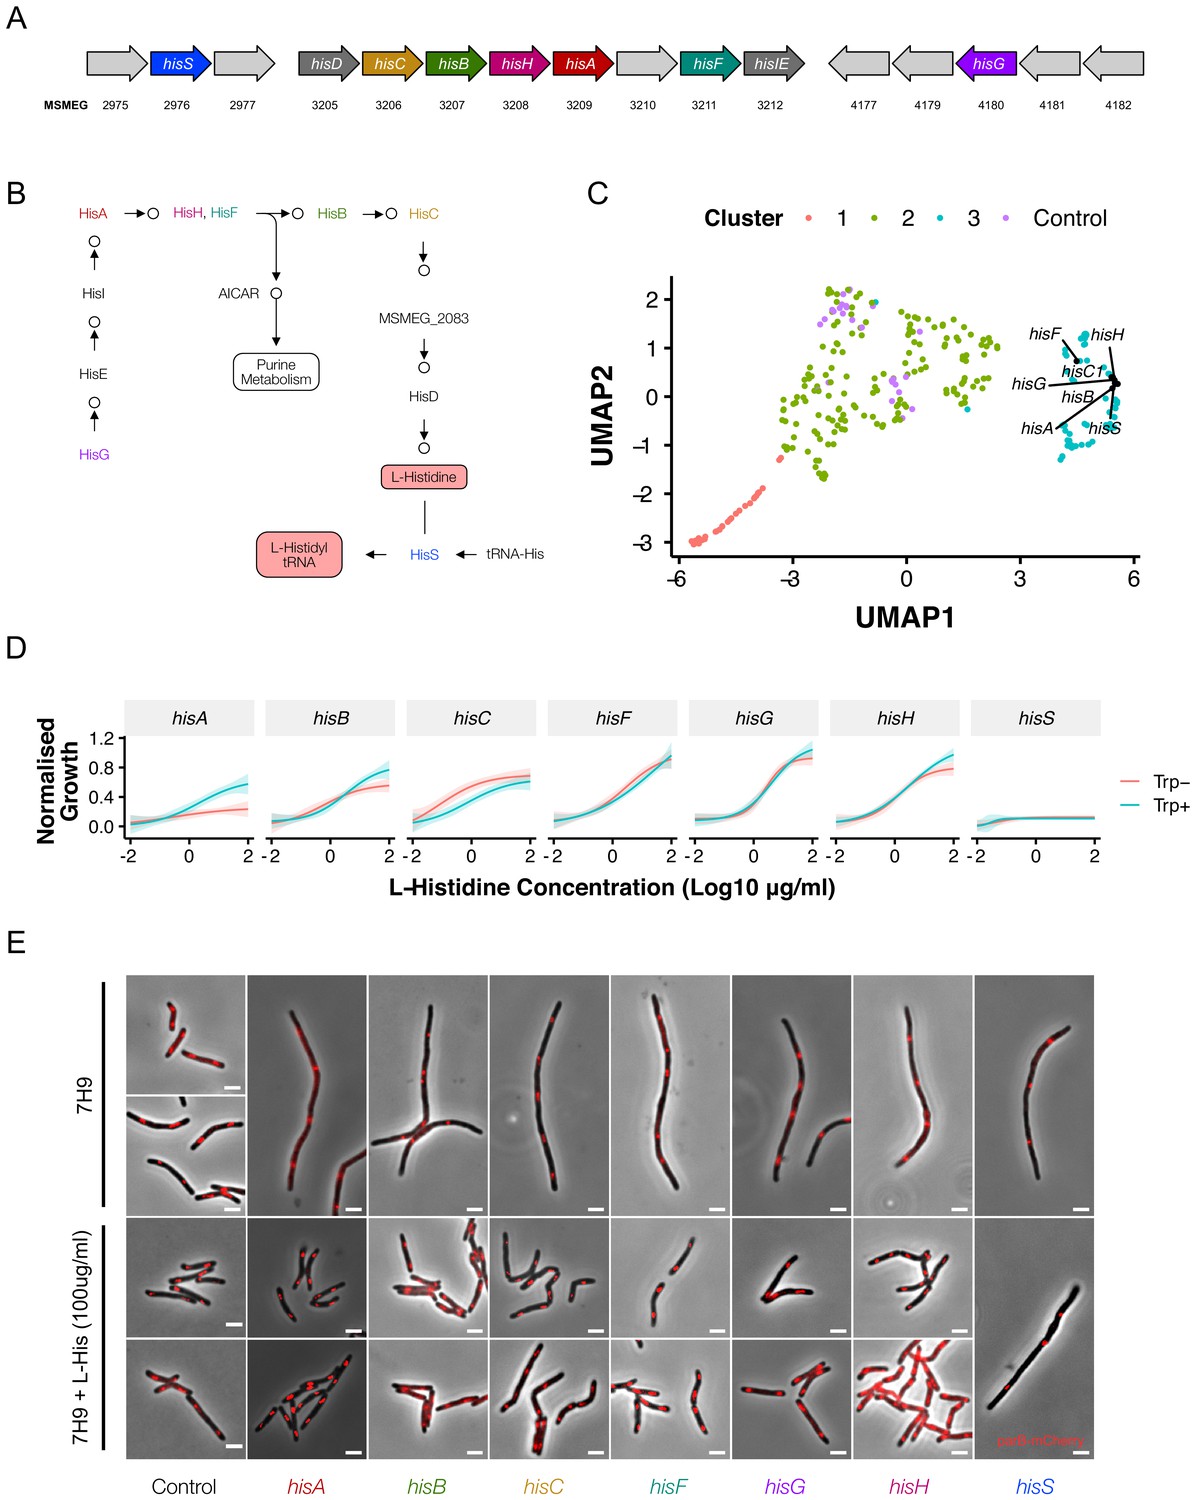
Disrupting components of histidine biosynthesis produces a filamentation response.
(A) Histidine biosynthetic genes are located throughout the chromosome. (B) Histidine is synthesized through a multi-step pathway (KEGG). (C) Cluster analysis demonstrated a consistent filamentation phenotype associated with genes involved in histidine synthesis. (D) Growth could be rescued with histidine supplementation (normalized to non-induced mutants). As HisA has an additional role in tryptophan synthesis, full rescue required simultaneous tryptophan supplementation (50 µg/ml). (E) The addition of histidine to ATc-containing growth media rescued the filamentation phenotype in all mutants other than hisS.
Figure 8—figure supplement 1
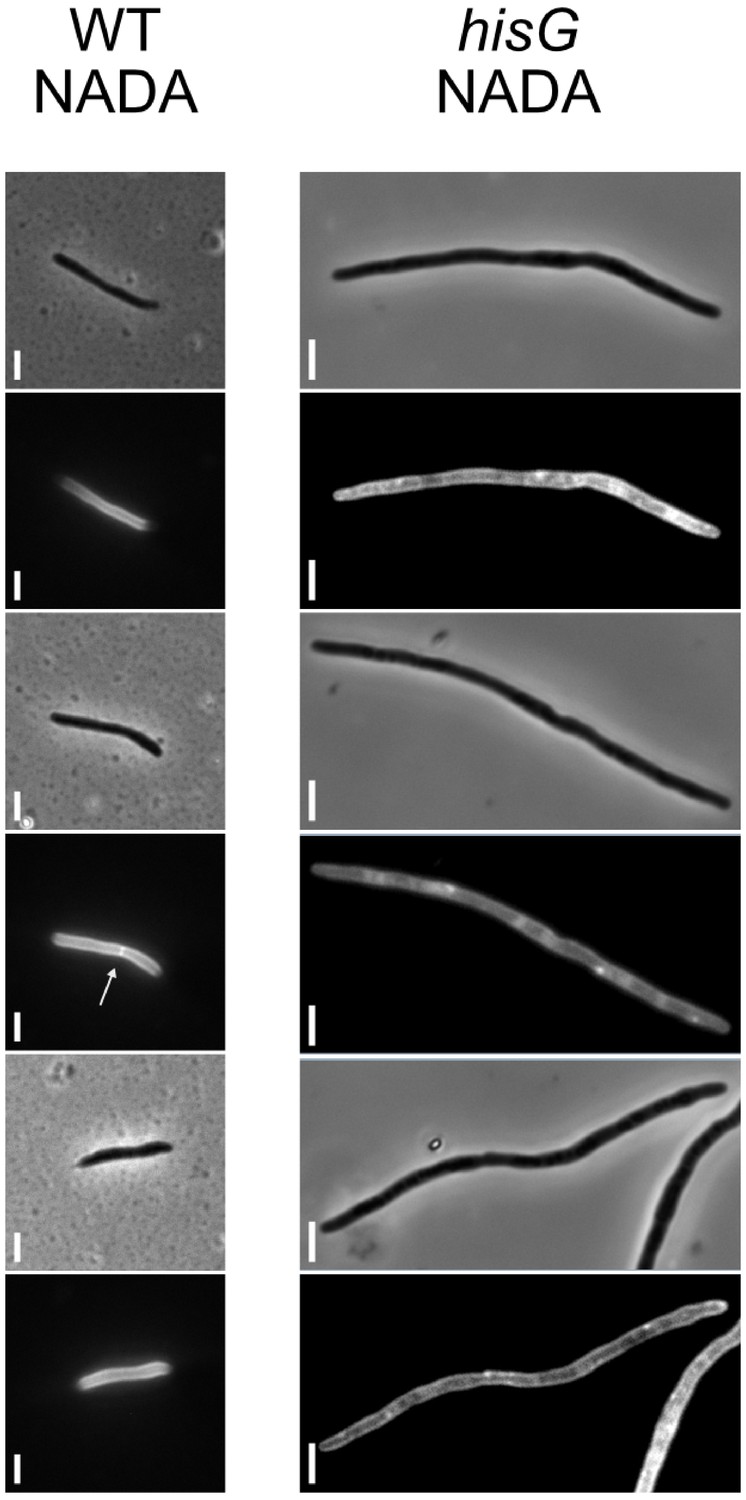
Absence of septum formation on histidine depletion.
Following CRISPRi-mediated silencing of hisG, cells were stained with the D-alanine analogue, NADA, for visualization of peptidoglycan (Botella et al., 2017). While staining was uneven, no clear septa were detected in any cells imaged (n = 35).
Figure 9
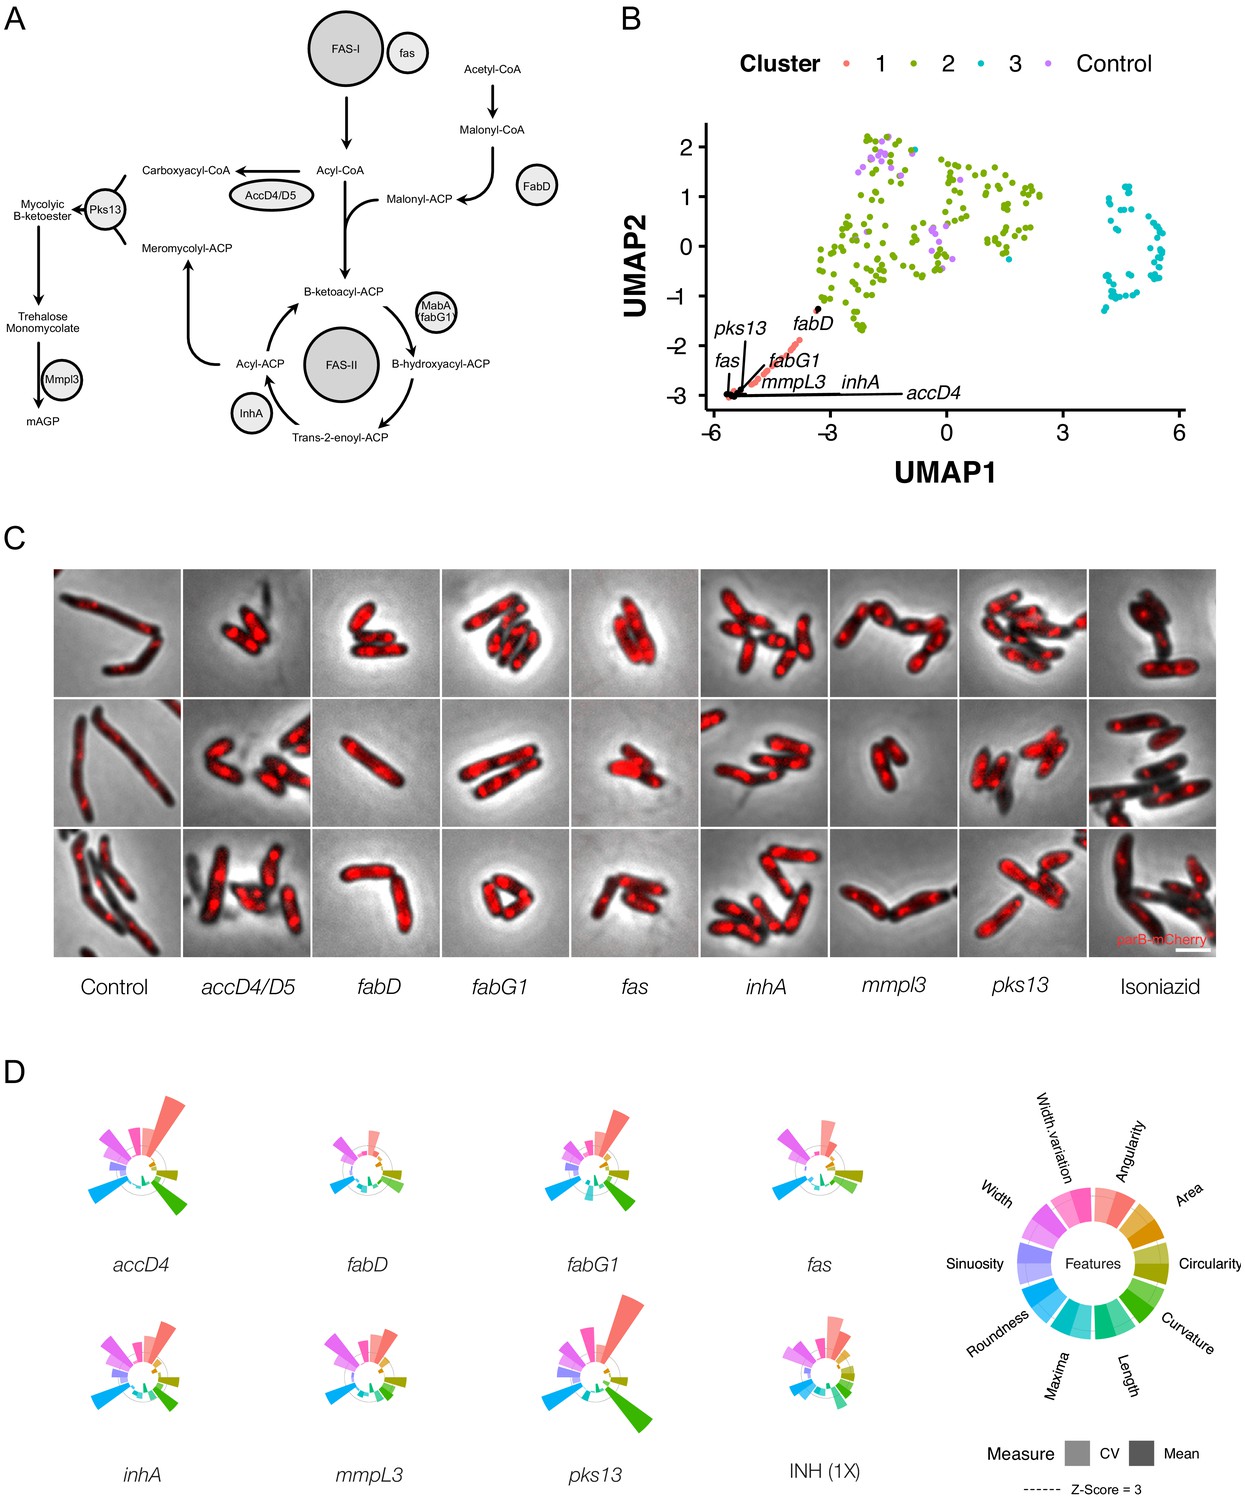
Genetic or chemical inhibition of mycolic acid biosynthesis produces a distinctive change in bacillary morphology.
(A) The multi-step pathway of mycolic acid biosynthesis. (B) Components of mycolic acid synthesis, visualized in UMAP space, cluster closely and are morphologically similar (C) with overlapping phenoprints (D). Exposure to the frontline anti-TB drug, isoniazid (INH), at 1X MIC produces a similar morphological change and an analogous phenoprint to silencing of inhA, the validated target of INH (Vilchèze and Jacobs, 2007).
Figure 10 with 3 supplements
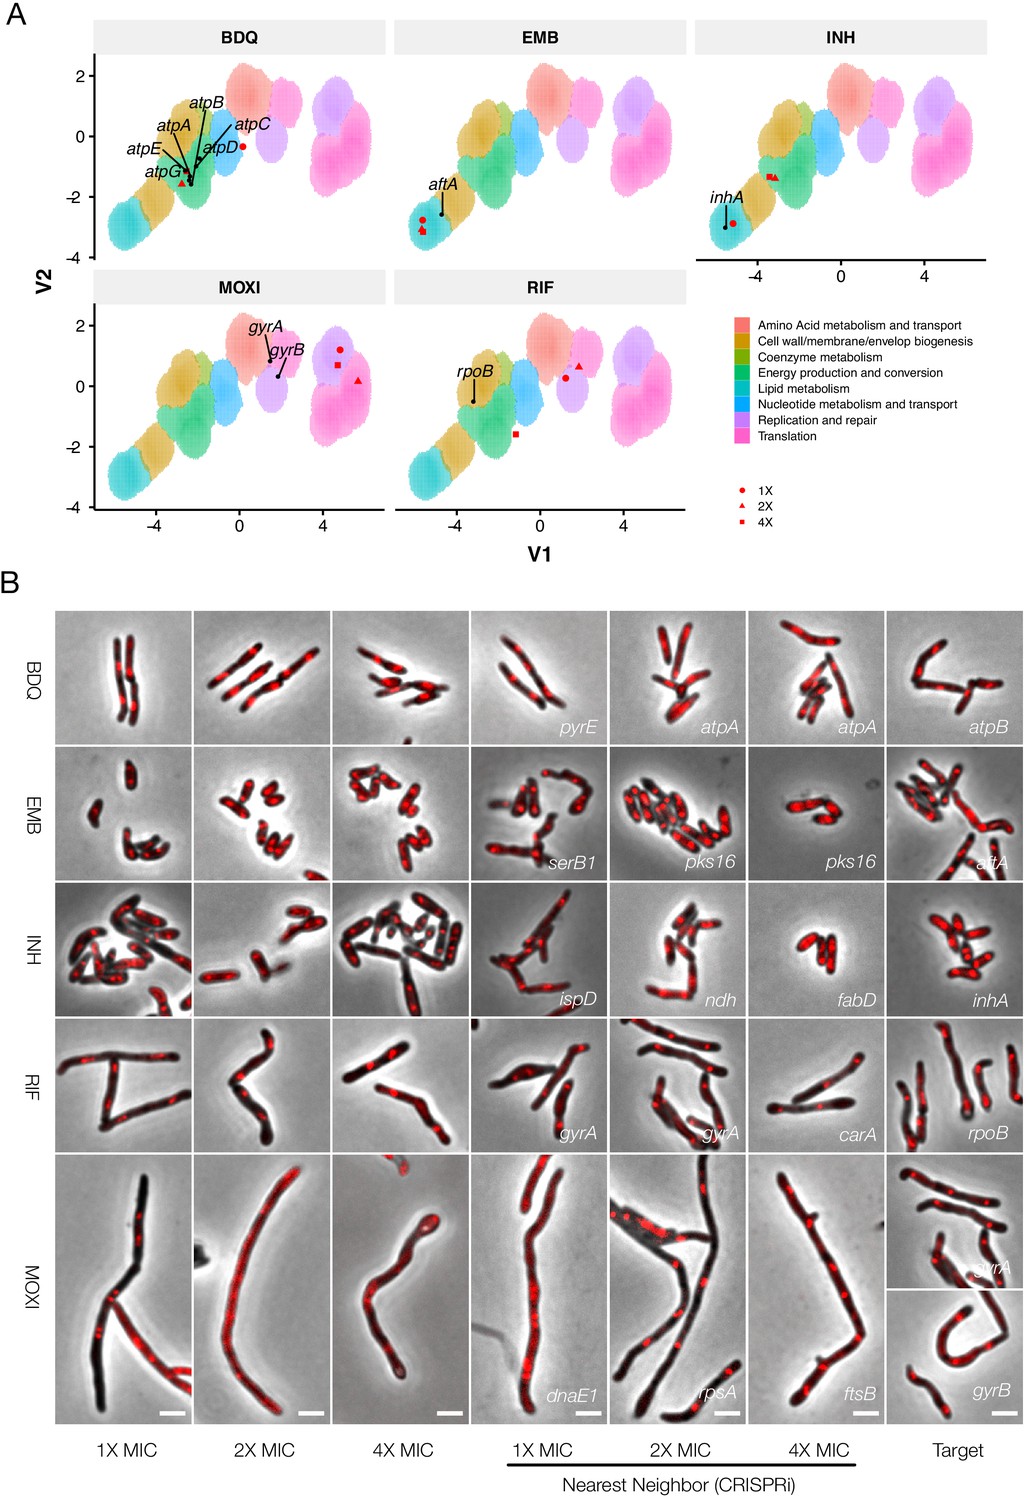
Phenoprinting can inform antimycobacterial MOA.
Cells were exposed to varying supra-MIC concentrations (1X, 2X, 4X MIC) of the selected antimycobacterial compounds for 18 hr, imaged, and analyzed using the pipeline developed for CRISPRi-imaging. The resulting profiles were visualized in CRISPRi-generated UMAP space (A), and the morphological nearest-neighbor identified (B). Known targets were simultaneously visualized for comparative purposes. BDQ, bedaquiline; EMB, ethambutol; INH, isoniazid; RIF, rifampicin; MOXI, moxifloxacin.
Figure 10—figure supplement 1
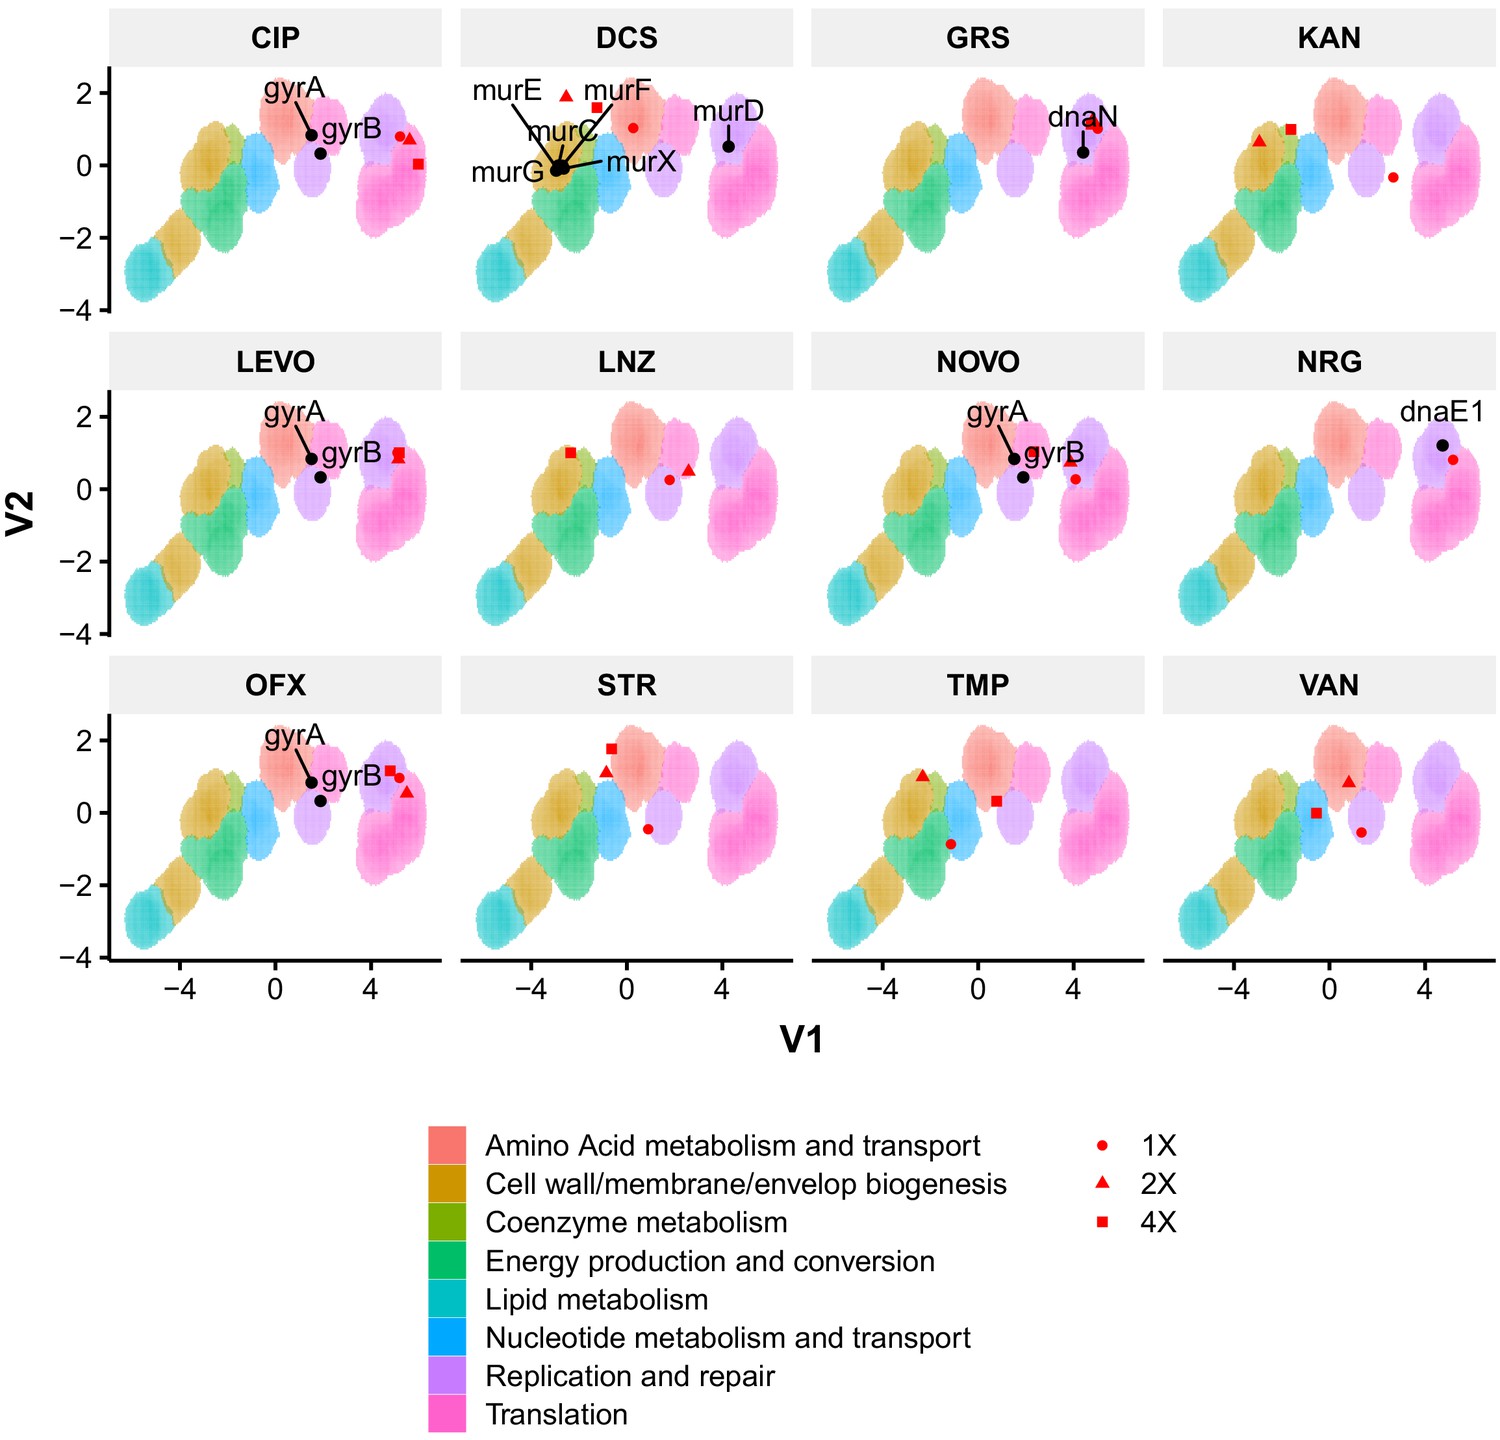
Phenoprinting can inform antimicrobial MOA.
Cells were exposed to varying supra-MIC concentrations (1X, 2X, 4X MIC) of the selected antimycobacterial compounds for 18 hr, imaged, and analyzed using the same pipeline developed for CRISPRi-imaging. The resulting profiles were visualized in CRISPRi-generated UMAP space. CIP, ciprofloxacin; DCS, D-cycloserine; GRS, griselimycin; KAN, kanamycin; LEVO, levofloxacin; LNZ, linezolid; NOVO, novobiocin; NRG, nargenicin; OFX, ofloxacin; STR, streptomycin; TMP, trimethoprim; VAN, vancomycin.
Figure 10—figure supplement 2
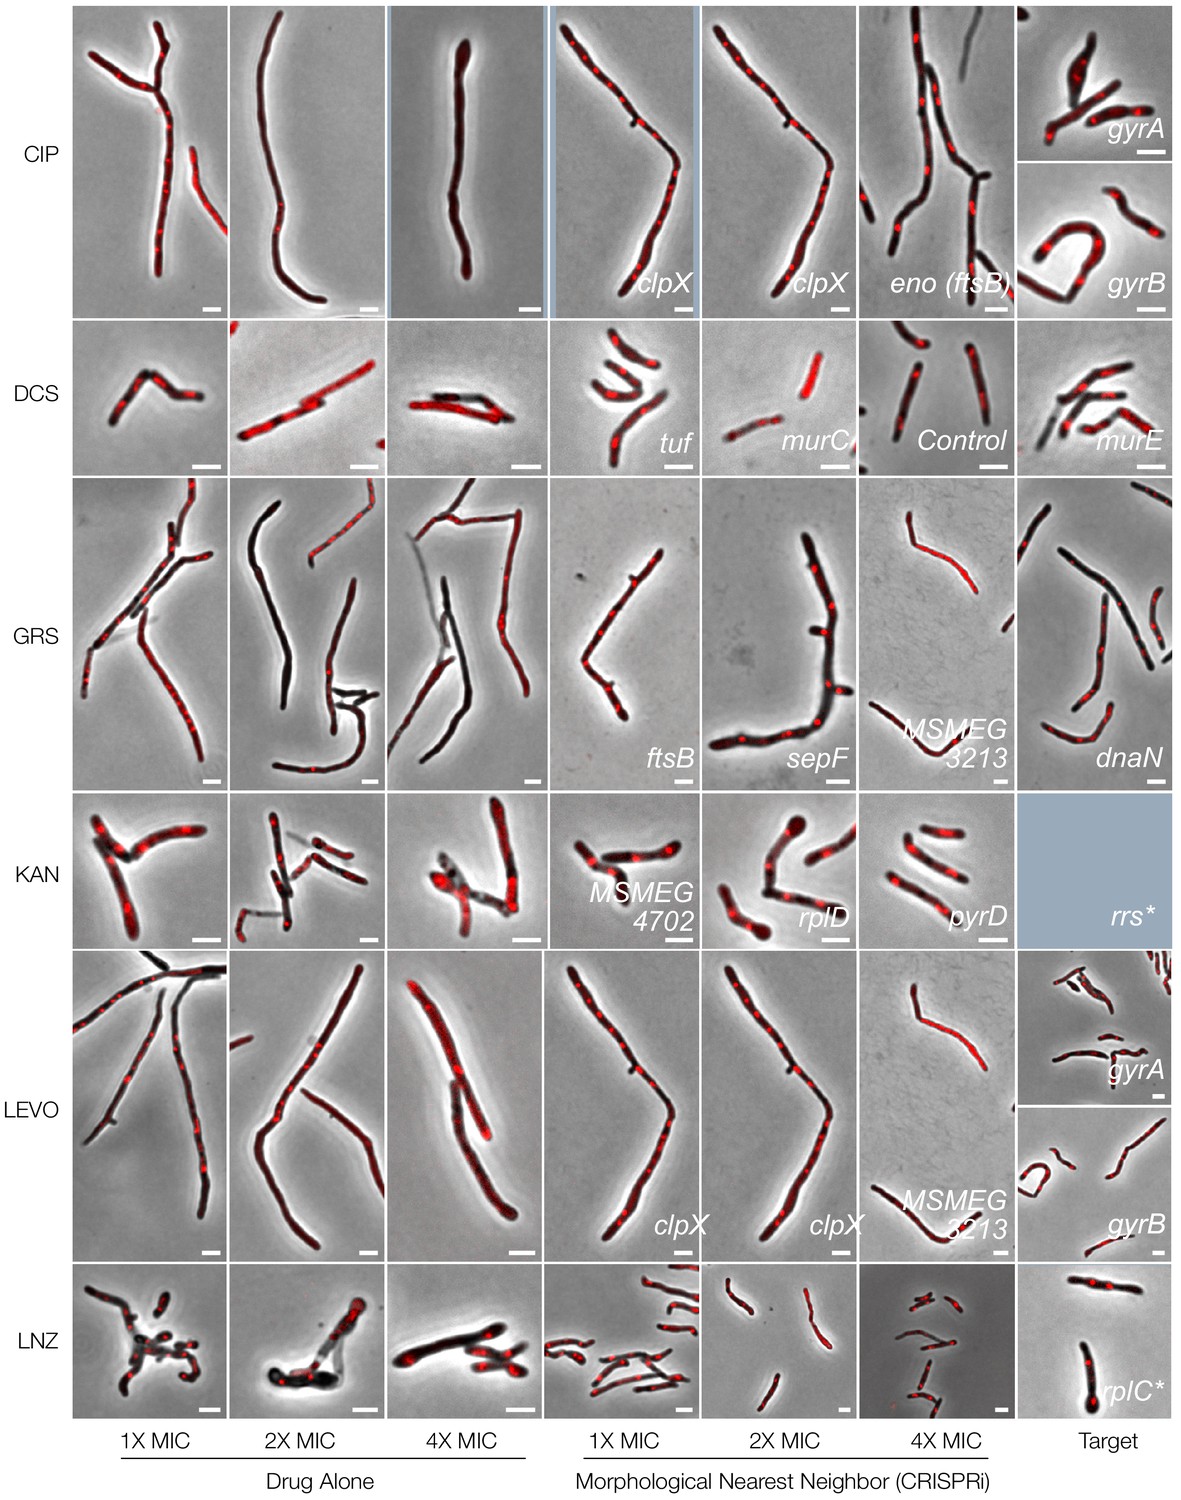
Phenoprinting can inform antimicrobial MOA.
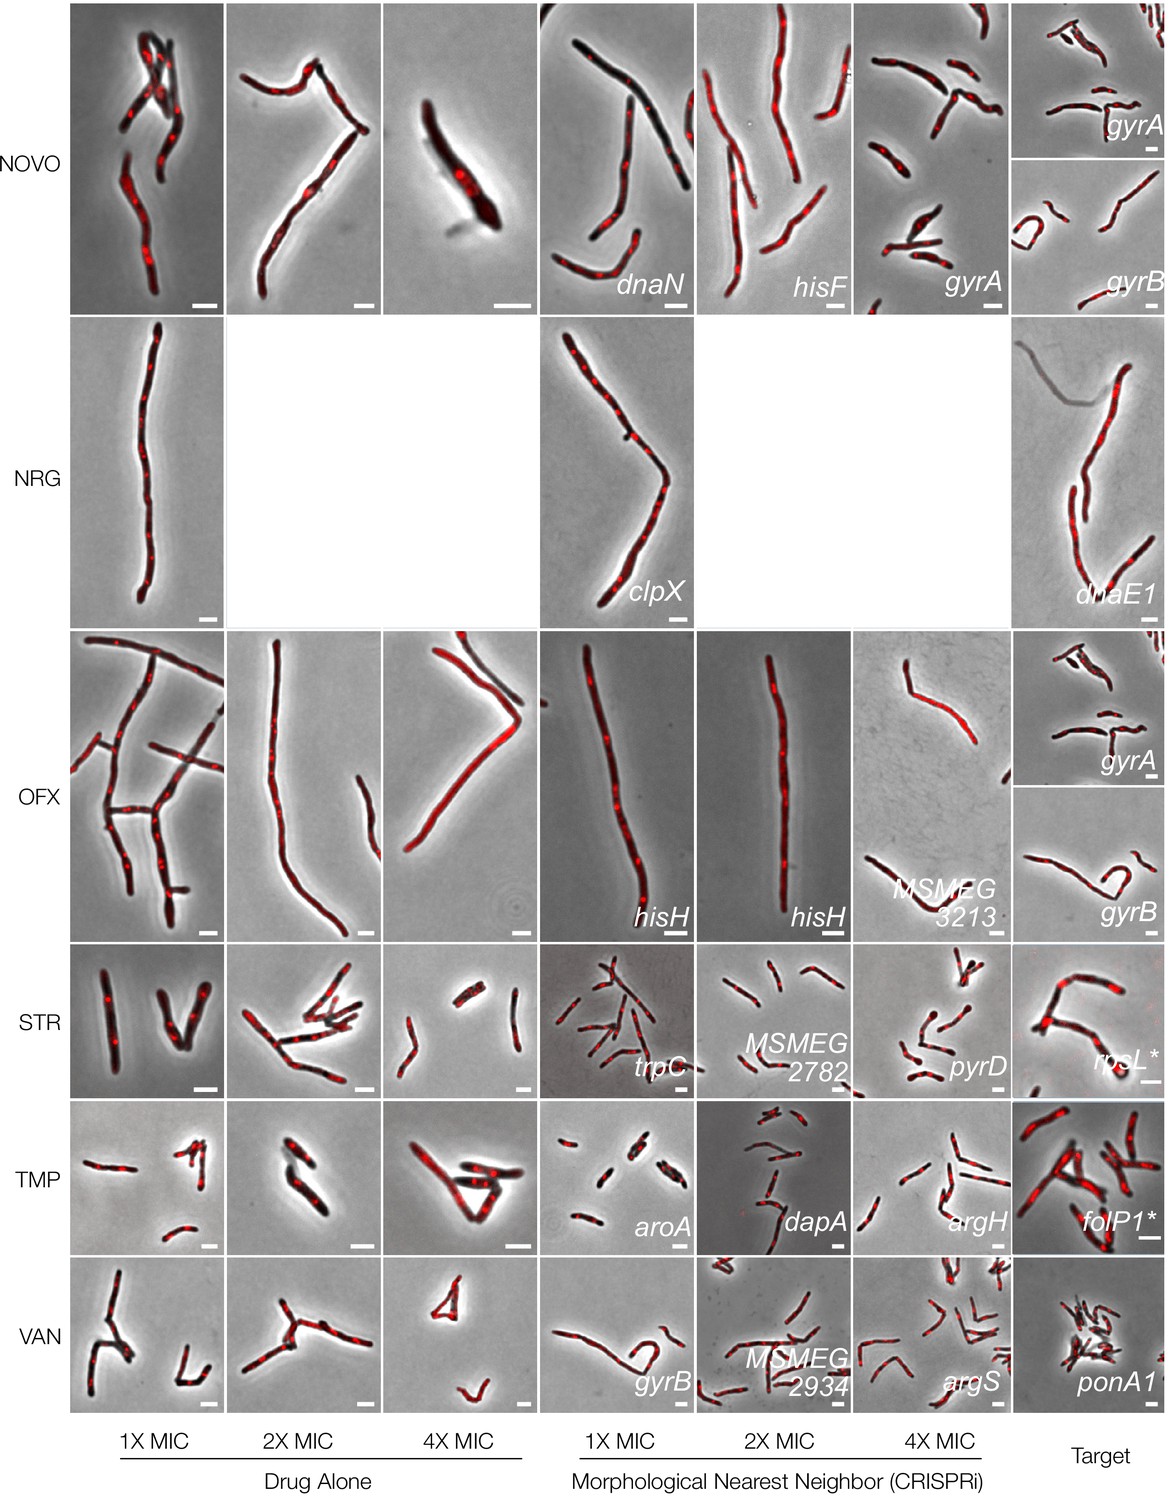
Cells were exposed to varying supra-MIC concentrations (1X, 2X, 4X MIC) of the selected antimycobacterial compounds for 18 hr, imaged, and analyzed using the same pipeline developed for CRISPRi-imaging. The resulting profiles were visualized in CRISPRi-generated UMAP space. For each compound, representative cells, known targets and the morphological nearest neighbor are presented. CIP, ciprofloxacin, DCS, D-cycloserine; GRS, griselimycin; KAN, kanamycin, LEVO, levofloxacin; LNZ, linezolid. NOVO, novobiocin; NRG, nargenicin; OFX, ofloxacin; STR, streptomycin; TMP, trimethoprim; VAN, vancomycin. *The major spontaneous resistance gene, if available. For kanamycin, rrs is not present in the library. Limited compound availability restricted nargenicin assays to 1X MIC.
Figure 10—figure supplement 3
Phenoprinting can inform antimicrobial MOA.
Videos
Video 1
Time-lapse microscopy of ftsZ and wag31 silencing by CRISPRi.
Video 2
Time-lapse microscopy of guaB2 silencing by CRISPRi.
Tables
Key resources table
| Reagent type (species) or resource | Designation | Source or reference | Identifiers | Additional information |
|---|---|---|---|---|
| Strain, strain background (Eschericia coli) | Dh5a | |||
| Strain, strain background (M. smegmatis) | ParB-mCherry | Santi and McKinney, 2015 | ||
| Strain, strain background (M. smegmatis) | See Supplementary file 1 | |||
| Recombinant DNA reagent | plJR962 | Rock et al., 2017 | ||
| Recombinant DNA reagent | See Supplementary file 1 | |||
| Sequence-based reagent | See Supplementary file 1 | |||
| Commercial assay or kit | OneTaq Master Mix | NEB | NEB M0482L | |
| Commercial assay or kit | Esp31-FastDigest | Thermo | FD0454 | |
| Commercial assay or kit | Zyppy-96 Plasmid Miniprep Kit | Zymo | D4041 | |
| Commercial assay or kit | FastRNA Blue Kit | MP Biomedicals | MP6025050 | |
| Commercial assay or kit | DNAse | NEB | NEB M0303S | |
| Commercial assay or kit | Poly(A) Polymerase | NEB | NEB M0276L | |
| Commercial assay or kit | Zymo RNA Clean and Concentrator-5 | Zymo | R1 013 | |
| Commercial assay or kit | Ribo-Zero rRNA Removal Kit | Illumina | MRZMB126 | |
| Commercial assay or kit | Nanopore Direct RNA Sequencing Kit | Oxford Nanopore Technologies | SQK-RNA002 | |
| Commercial assay or kit | Nanopore Direct cDNA Sequencing Kit | Oxford Nanopore Technologies | SQK-DCS109 | |
| Commercial assay or kit | NEBNext Q5 High-Fidelity Polymerase Master Mix | NEB | NEB M0543L | |
| Commercial assay or kit | QIAquick PCR purification kit | Qiagen | 28106 | |
| Commercial assay or kit | T4 Ligase | NEB | NEB M0202M | |
| Commercial assay or kit | SapI | NEB | NEB R0569S | |
| Chemical compound, drug | See Supplementary file 1 | |||
| Software algorithm | FIJI | Schindelin et al., 2012 | ||
| Software algorithm | MicrobeJ | Ducret et al., 2016 | ||
| Software algorithm | R | |||
| Software algorithm | UMAP | Lel et al., 2018 | ||
| Software algorithm | hdbscan | Lel et al., 2017 | ||
| Software algorithm | tSNE | Maaten and Hinton, 2008 | ||
| Software algorithm | Minimap2 | Li, 2018 | ||
| Software algorithm | samtools | Li et al., 2009 | ||
| Software algorithm | deepTools2 | Ramírez et al., 2016 | ||
| Software algorithm | featureCounts | Liao et al., 2014 | ||
| Software algorithm | DESeq2 | Love et al., 2014 | ||
| Software algorithm | Iris | Kritikos et al., 2017 |
Additional files
-
Supplementary file 1
Key reagents.
- https://cdn.elifesciences.org/articles/60083/elife-60083-supp1-v1.xlsx
-
Supplementary file 2
Essentiality calls, functional annotations and identified transcriptional units.
- https://cdn.elifesciences.org/articles/60083/elife-60083-supp2-v1.csv.zip
-
Supplementary file 3
Literature review of genes targeted in this work.
- https://cdn.elifesciences.org/articles/60083/elife-60083-supp3-v1.csv.zip
-
Supplementary file 4
Supplementary methods.
- https://cdn.elifesciences.org/articles/60083/elife-60083-supp4-v1.docx
-
Transparent reporting form
- https://cdn.elifesciences.org/articles/60083/elife-60083-transrepform-v1.docx
Download links
A two-part list of links to download the article, or parts of the article, in various formats.
Downloads (link to download the article as PDF)
Open citations (links to open the citations from this article in various online reference manager services)
Cite this article (links to download the citations from this article in formats compatible with various reference manager tools)
Arrayed CRISPRi and quantitative imaging describe the morphotypic landscape of essential mycobacterial genes
eLife 9:e60083.
https://doi.org/10.7554/eLife.60083


