Single nuclei RNA-seq of mouse placental labyrinth development
- The Eli and Edythe Broad Center of Regeneration Medicine and Stem Cell Research, Center for Reproductive Sciences, University of California, San Francisco, United States
- Department of Urology, University of California, San Francisco, United States
Figures
Figure 1 with 1 supplement
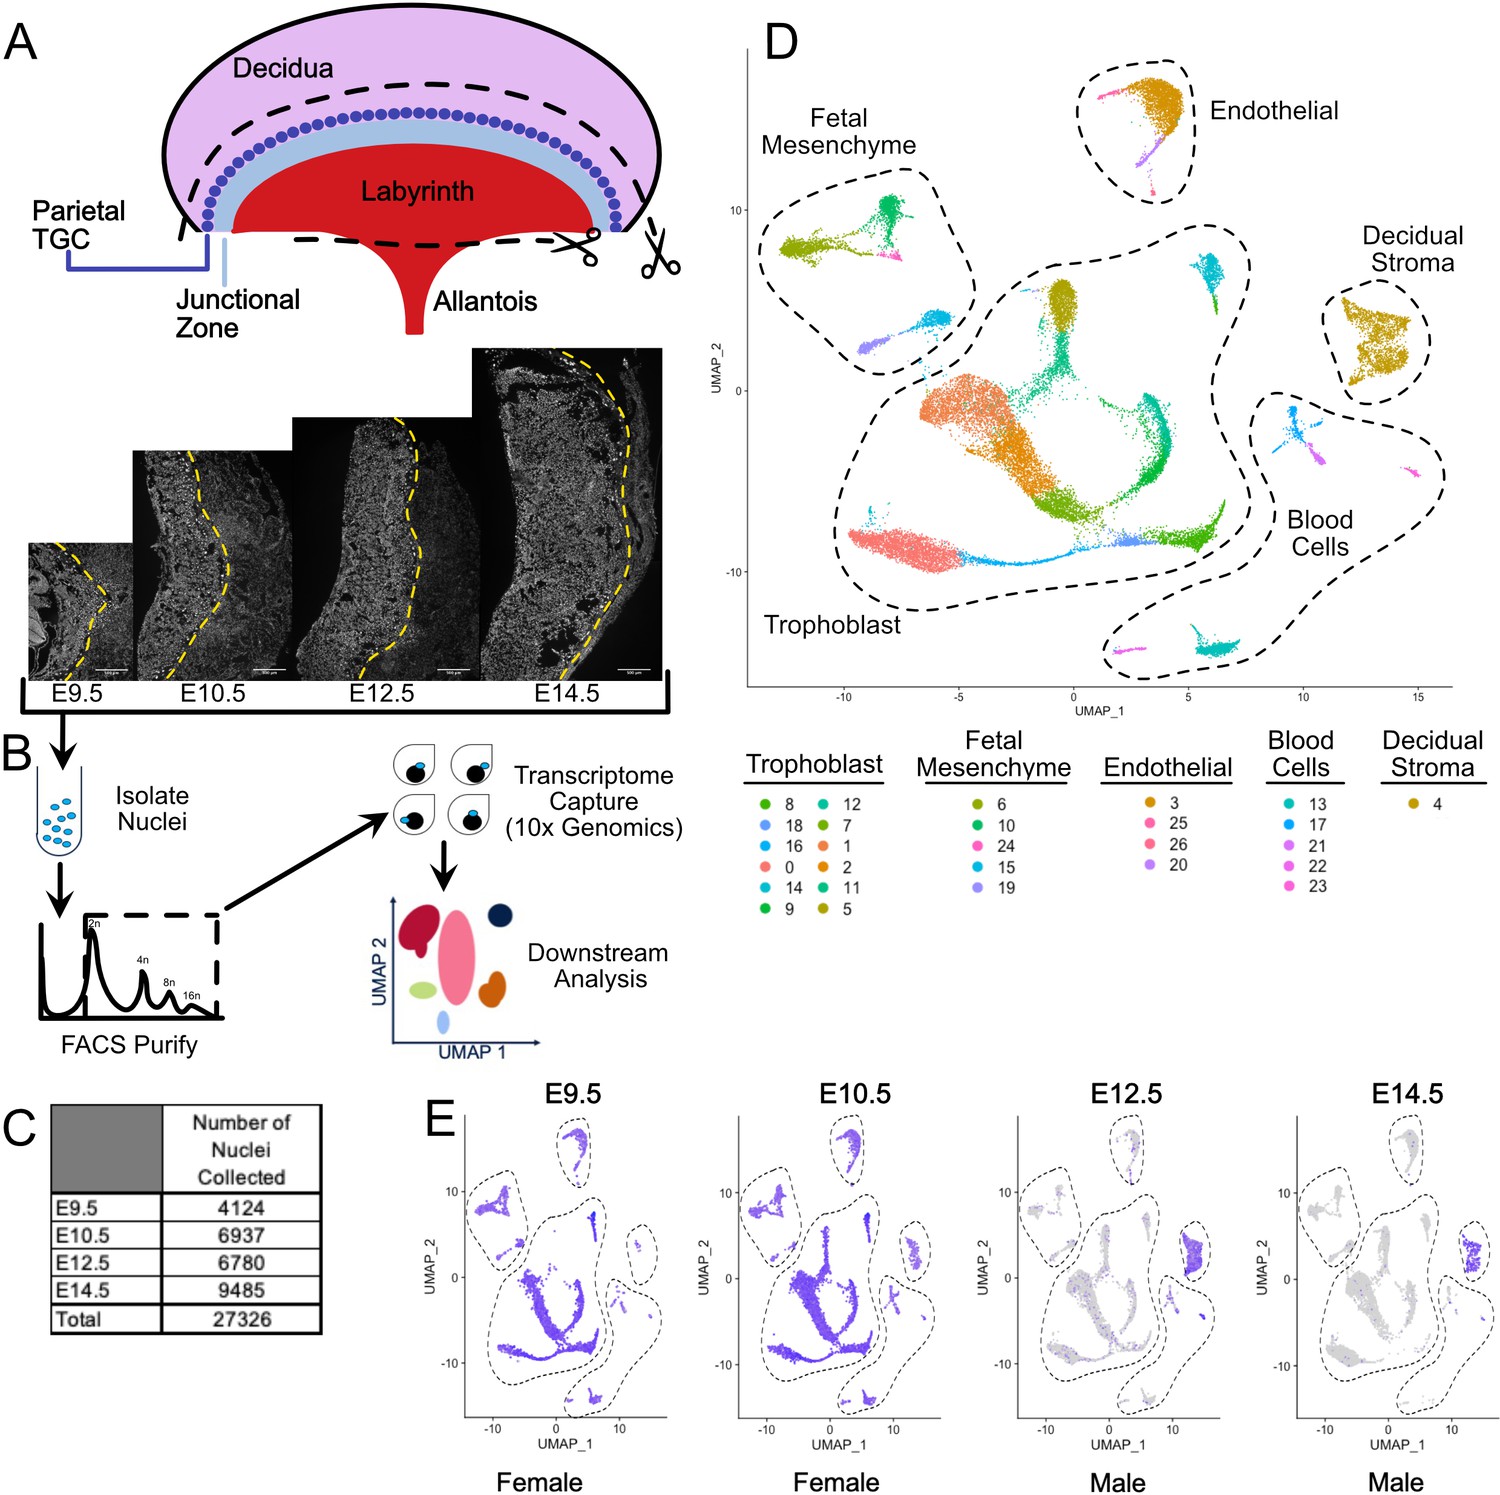
Nuclear isolation and snRNA-seq of mouse placental cells (E9.5-E14.5).
(A) Schematic showing the main regions of the placenta – Labyrinth, Junctional Zone, Parietal TGC, and Decidua. Removal of the decidual stroma and the allantois is marked by scissors and cut lines. Sections of placentas at E9.5–14.5 stained with DAPI to label nuclei and reveal tissue architecture. The dotted line is drawn at the interface between the junctional zone (left of the line) and the maternal decidual stroma (right) to demonstrate the growth occurring during this time span. (B) Schematic outlining nuclei isolation from tissue, purification using FACS, transcriptome capture, and downstream analysis. (C) Number of nuclei collected at each gestational age and in total. (D) Visualization of the 27,326 nuclei included in the analysis plotted in two dimensions by transcriptome similarity using uniform manifold approximation and projection (UMAP). Each dot represents one nucleus colored according to assignment by clustering analysis (see Materials and methods). Dotted lines encircle clusters with common properties. (E) Expression of Xist in each sample. Female placenta samples express Xist in all nuclei. Male placental samples express Xist only in maternally derived nuclei. The main cell type groupings from D are outlined here also.
-
Figure 1—source data 1
Marker genes for clusters in complete snRNA-seq data (E9.5-E14.5).
- https://cdn.elifesciences.org/articles/60266/elife-60266-fig1-data1-v2.csv
Figure 1—figure supplement 1
Quality control metrics andmarker genes for snRNA-se of mouse placentae (E9.5-E14.5).
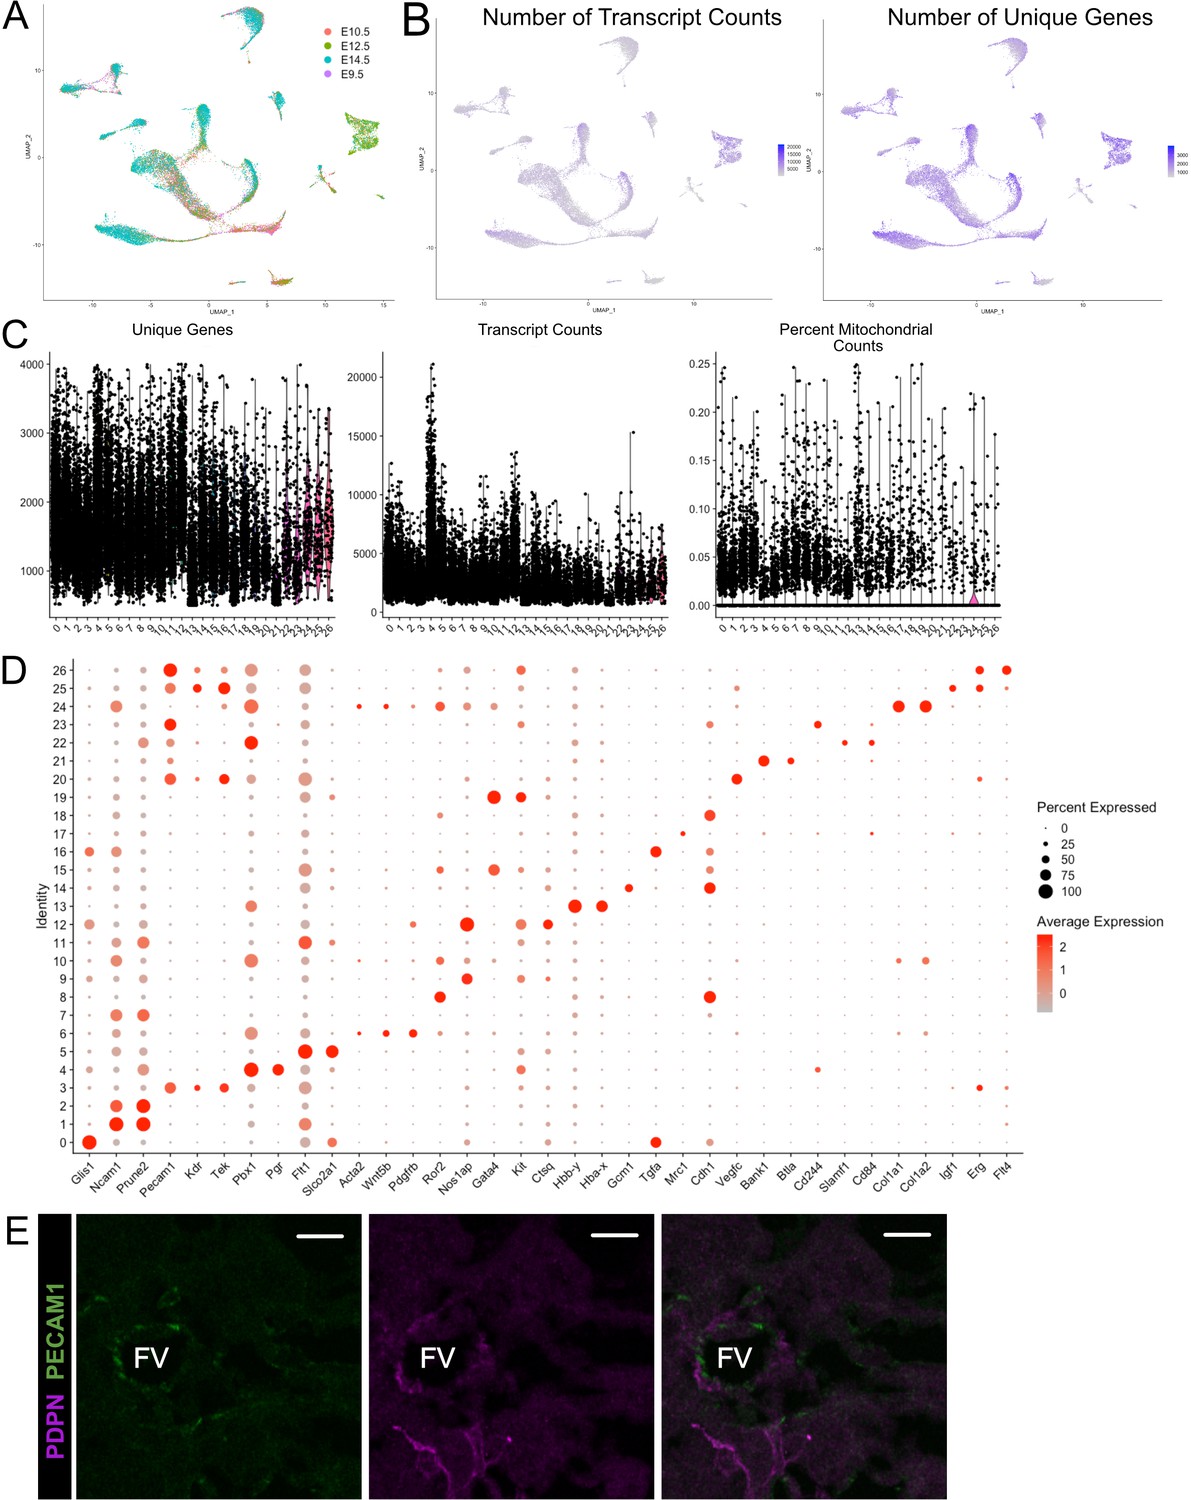
(A) UMAP projection of all nuclei color coded by timepoint from which they were collected. (B) The number of transcripts identified per nucleus (left) and the number of unique genes identified (right) per cell projected in UMAP space. (C) Violin plots showing the number of unique genes (left), number of transcripts (middle), and the percent of reads mapping to mitochondrial genes (right) for each cluster identified in Figure 1D. (D) Dot plot showing the average expression per cluster and percent of nuclei in each cluster expressing select marker genes. Genes are listed on the x-axis and clusters on the y-axis. (E) Immunofluorescence staining of PDPN and PECAM1 at E10.5 showing PDPN+ c mesenchymal cells and contacts with fetal PECAM+ endothelial cells (Scale Bar – 20 µm; FV – Fetal Vessel).
Figure 2 with 3 supplements
Sub-clustering of the trophoblast nuclei identifies the cell types of the labyrinth and junctional zone.
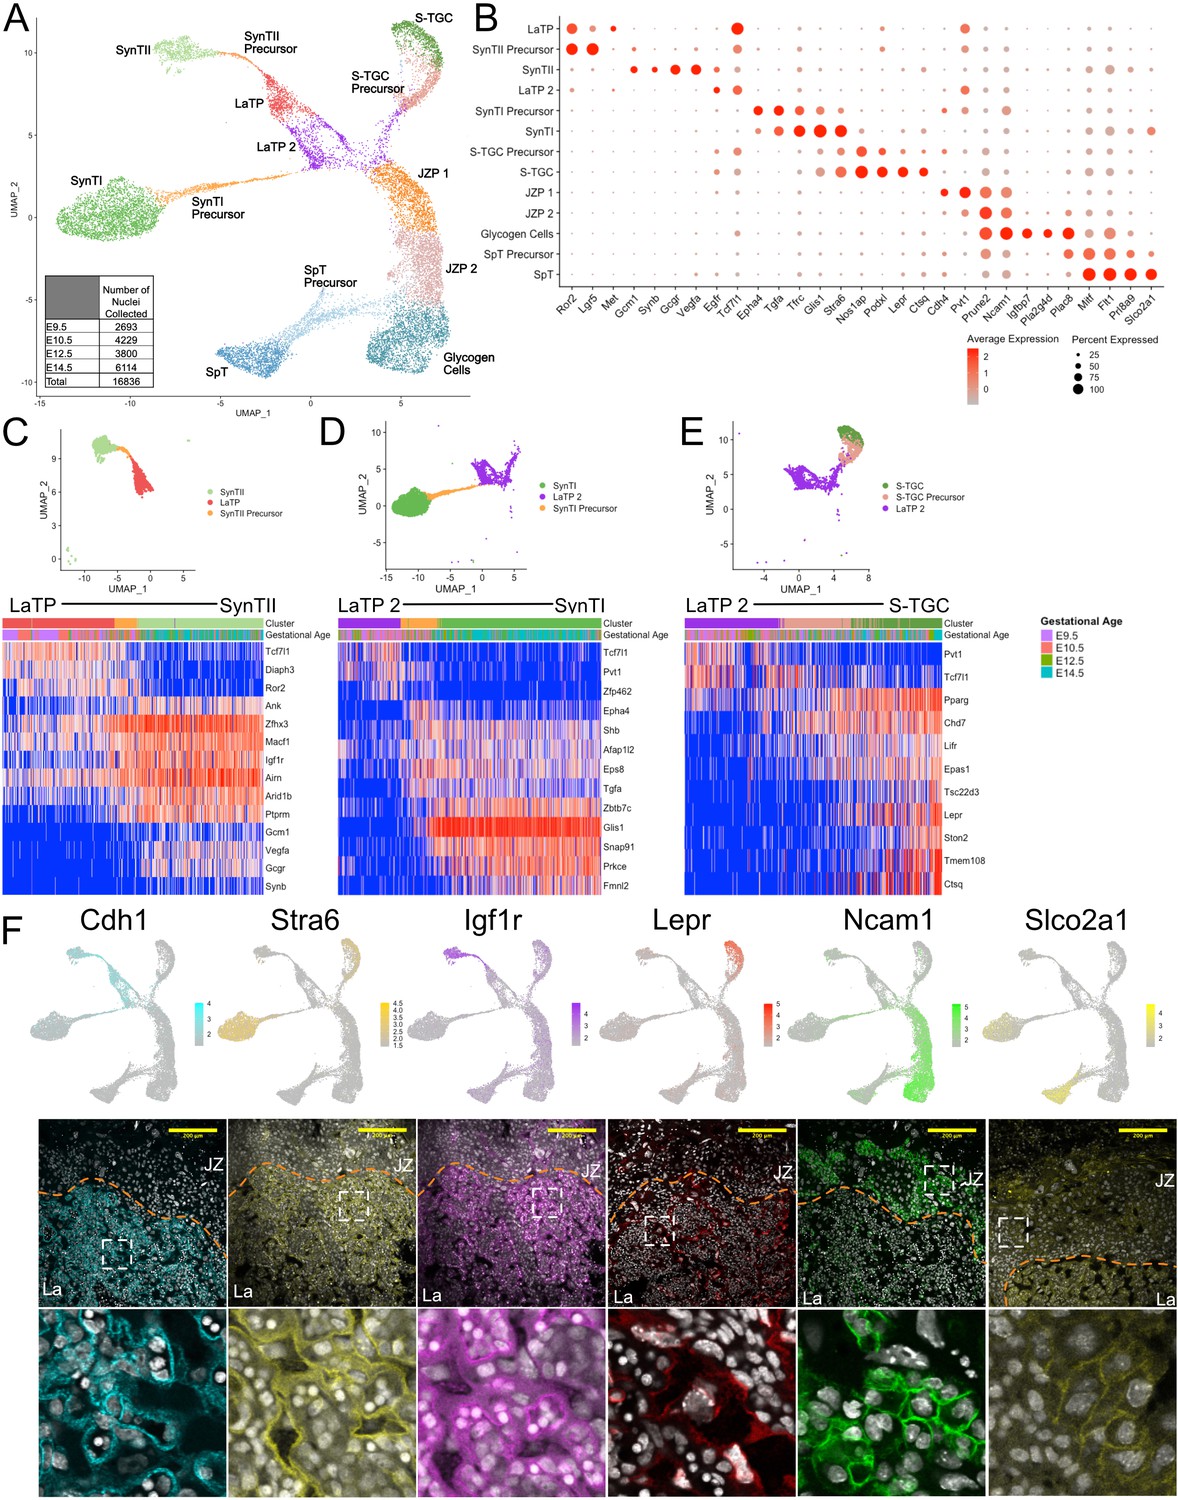
(A) UMAP showing the 16,836 nuclei included in the trophoblast subset, clustered and plotted according to transcriptome similarity. Clusters were annotated according to canonical marker genes and named below. Inset shows the number of nuclei collected at each gestational age. (B) Dot plot showing average expression and percent of nuclei in each cluster expressing canonical and novel marker genes identified for each cluster. Genes listed on the x-axis and clusters on the y-axis. (C–E) Nuclei along the differentiation from LaTP to SynTII, SynTI, and S-TGC were ordered by pseudotime using Slingshot. The nuclei included along each pseudotime axis shown at top. The expression of select genes (y-axis) representing each differentiation are shown in each heatmap. Each column represents a nucleus organized in pseudotime proceeding from left to right along the x-axis. (F) Expression of genes unique to several trophoblast populations projected in UMAP space (top) and localization of corresponding protein in E12.5 mouse placenta sections by immunofluorescence staining (Middle – 20x, Scale Bar = 200 µM; Bottom – high magnification inset area shown by white dashed line). Separation of labyrinth (La) and junctional zone (JZ) shown by the orange dashed line.
-
Figure 2—source data 1
Marker genes for clusters in subclustered trophoblast nuclei.
- https://cdn.elifesciences.org/articles/60266/elife-60266-fig2-data1-v2.csv
-
Figure 2—source data 2
Expression of the top 200 variable genes along the pseudotime ordering of cells from LaTP to SynTII (Figure 2C).
- https://cdn.elifesciences.org/articles/60266/elife-60266-fig2-data2-v2.csv
-
Figure 2—source data 3
Expression of the top 200 variable genes along the pseudotime ordering of cells from LaTP2 to SynTI (Figure 2D).
- https://cdn.elifesciences.org/articles/60266/elife-60266-fig2-data3-v2.csv
-
Figure 2—source data 4
Expression of the top 200 variable genes along the pseudotime ordering of cells from LaTP2 to S-TGC (Figure 2E).
- https://cdn.elifesciences.org/articles/60266/elife-60266-fig2-data4-v2.csv
Figure 2—figure supplement 1
Quality control metrics for snRNA-seq of subclustered trophoblast nuclei and dissection of LaTP populations by specific markers.
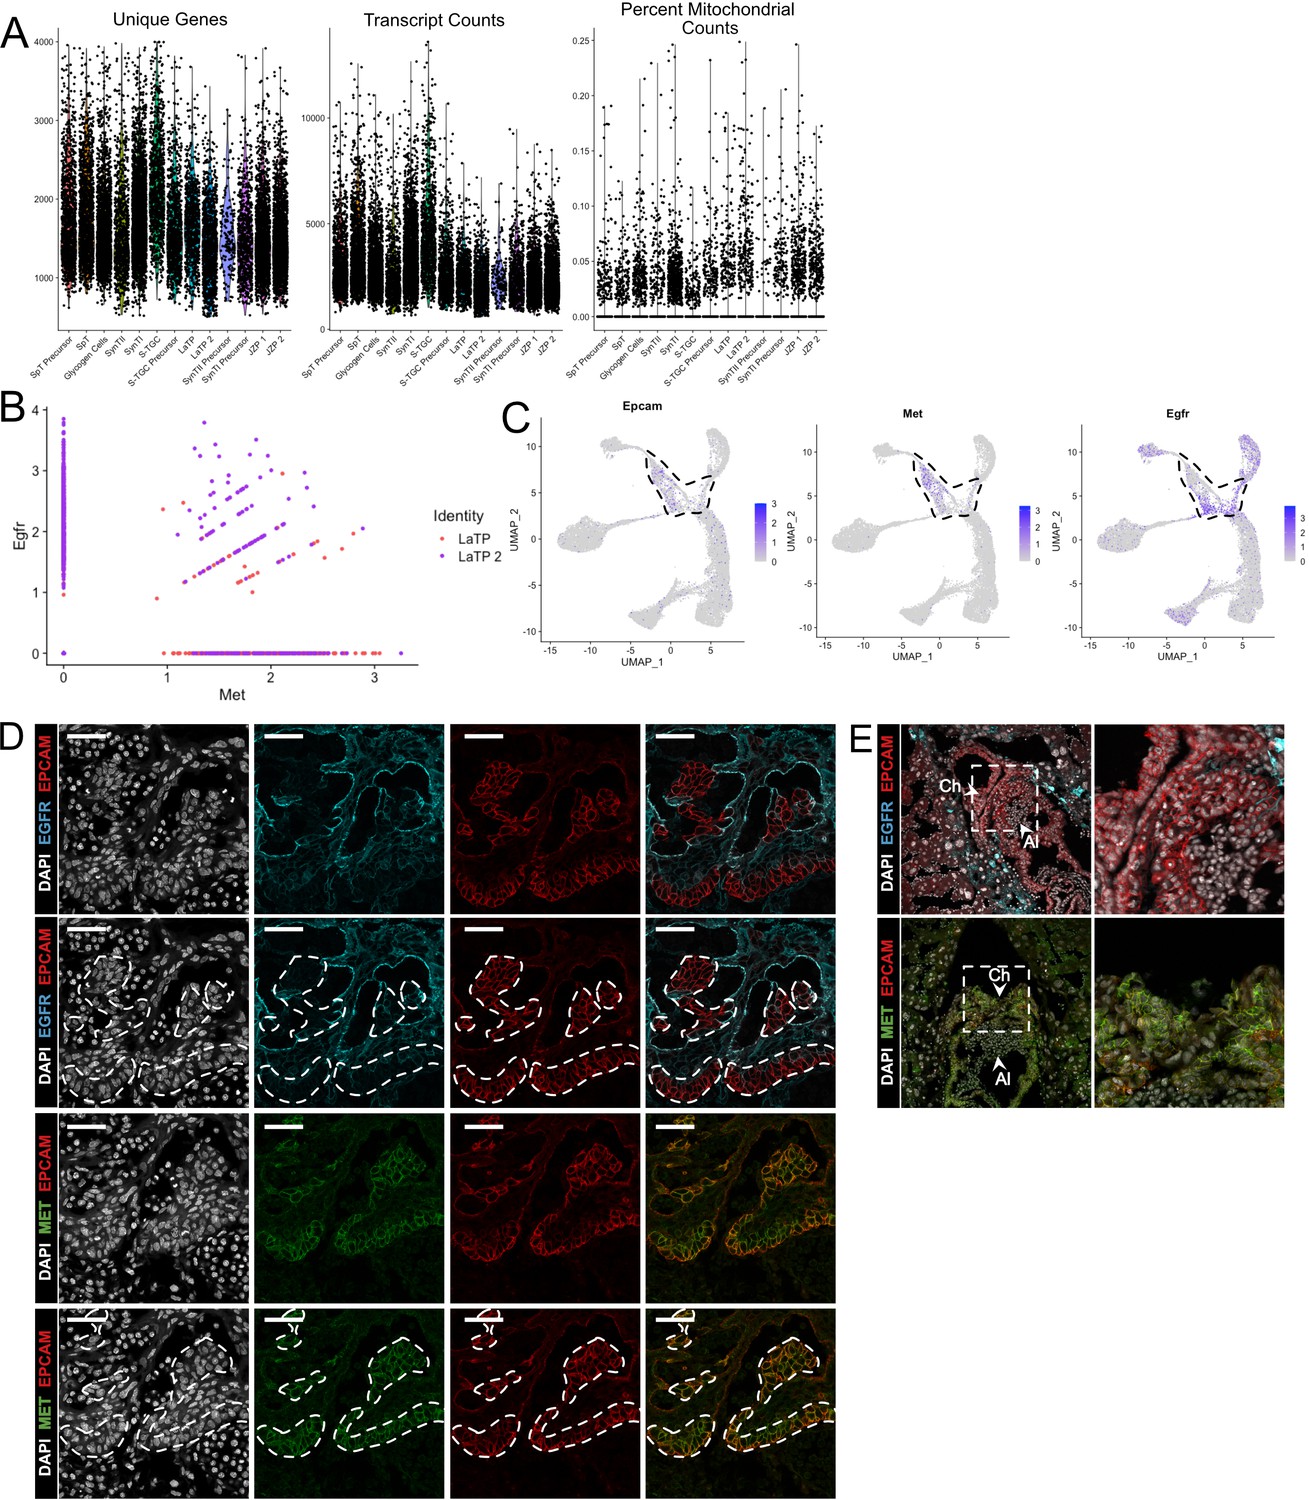
(A) Violin plots showing the number of unique genes (left), number of transcripts (middle), and the percent of reads mapping to mitochondrial genes (right) for each cluster identified in the trophoblast dataset in Figure 2A. (B) Scatter plot of expression of Egfr and Met in LaTP and LaTP2 clusters showing Egfr expression to be highly enriched in LaTP2. (C) Expression of Epcam RNA projected in trophoblast nuclei. LaTP and LaTP two clusters are outlined by the dotted line. (D) Immunofluorescence staining of EPCAM and EGFR (top two rows) or EPCAM and MET (bottom two row). White dashed lines outline EPCAM expression as a marker of canonical LaTPs. MET expression colocalizes with EPCAM and represent the LaTP cluster. EGFR and EPCAM domains are largely non-overlapping, with EGFR expressing cells representing the distinct LaTP2 cluster. EGFR is also expressed in mature SynTII. (E) Immunofluorescence staining of EPCAM and EGFR or EPCAM and MET at E8.5. Arrows denote the allantois (Al) and the chorion (Ch). The white box denotes the inset at right.
Figure 2—figure supplement 2
Additional validation of the identities of Junctional Zone clusters.
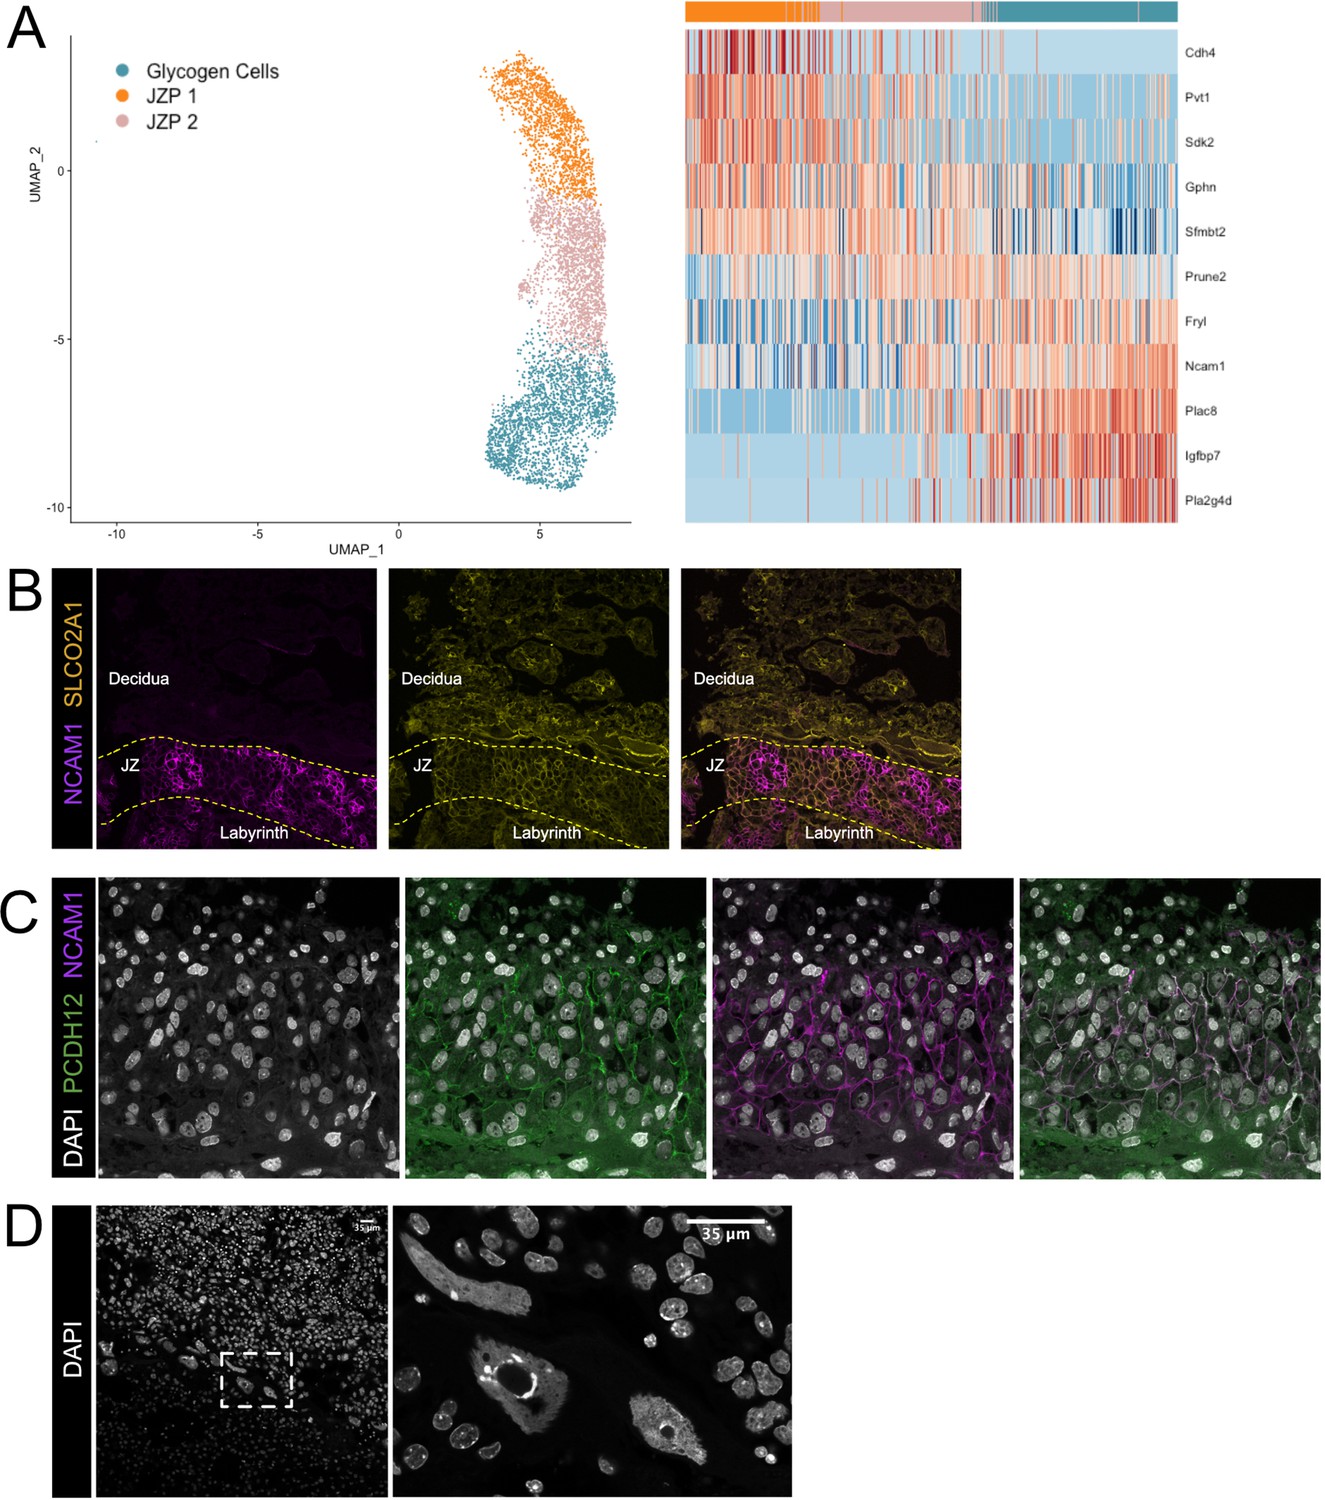
(A) Nuclei along the differentiation from JZP1 to GCs were ordered by pseudotime using Slingshot. The nuclei included along each pseudotime axis shown at left. The expression of select genes (y-axis) representing differentiation is shown in heatmap (right). Each column represents a nucleus organized in pseudotime proceeding from left to right along the x-axis. (B) Immunofluorescence staining of sections from E12.5 placentas for Ncam1 (Purple) and Slco2a1 (Yellow). Dashed lines separate boundaries between placental regions (Labyrinth, JZ – Junctional Zone, and Decidua). (C) Immunofluorescence staining of sections from E12.5 placentas for Pcdh12 (Green) and Ncam1 (D) DAPI staining in E12.5 placental sections. Dashed box outlines the magnified region shown at left.
Figure 2—figure supplement 3
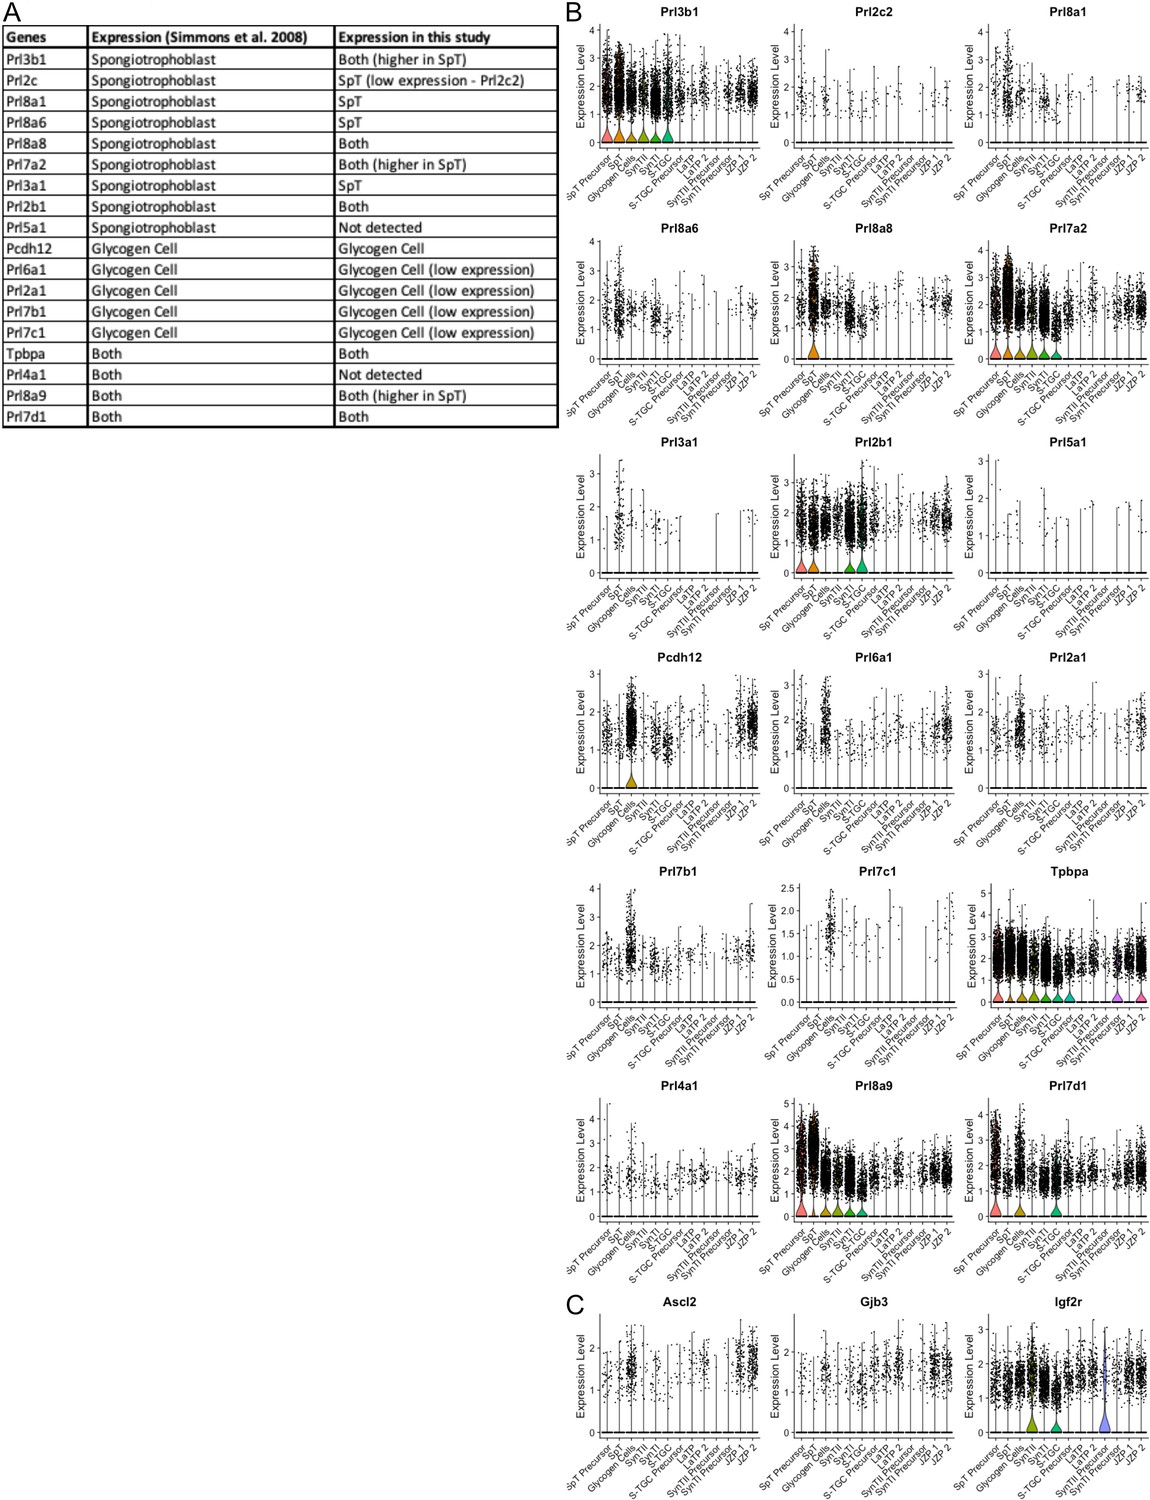
Characterization of spongiotrophoblast and glycogen gell clusters by specific expression of prolactin genes.
(A) Table of prolactin gene expression in either spongiotrophoblast or glycogen cells from Simmons et al., 2008a and their expression in the snRNA-seq data. (B) Violin plots showing the expression of the prolactin genes in (A). (C) Violin plots showing the expression of additional canonical markers Pcdh12, Tpbpa, Ascl2, Gjb2, and Igf2r.
Figure 3 with 1 supplement
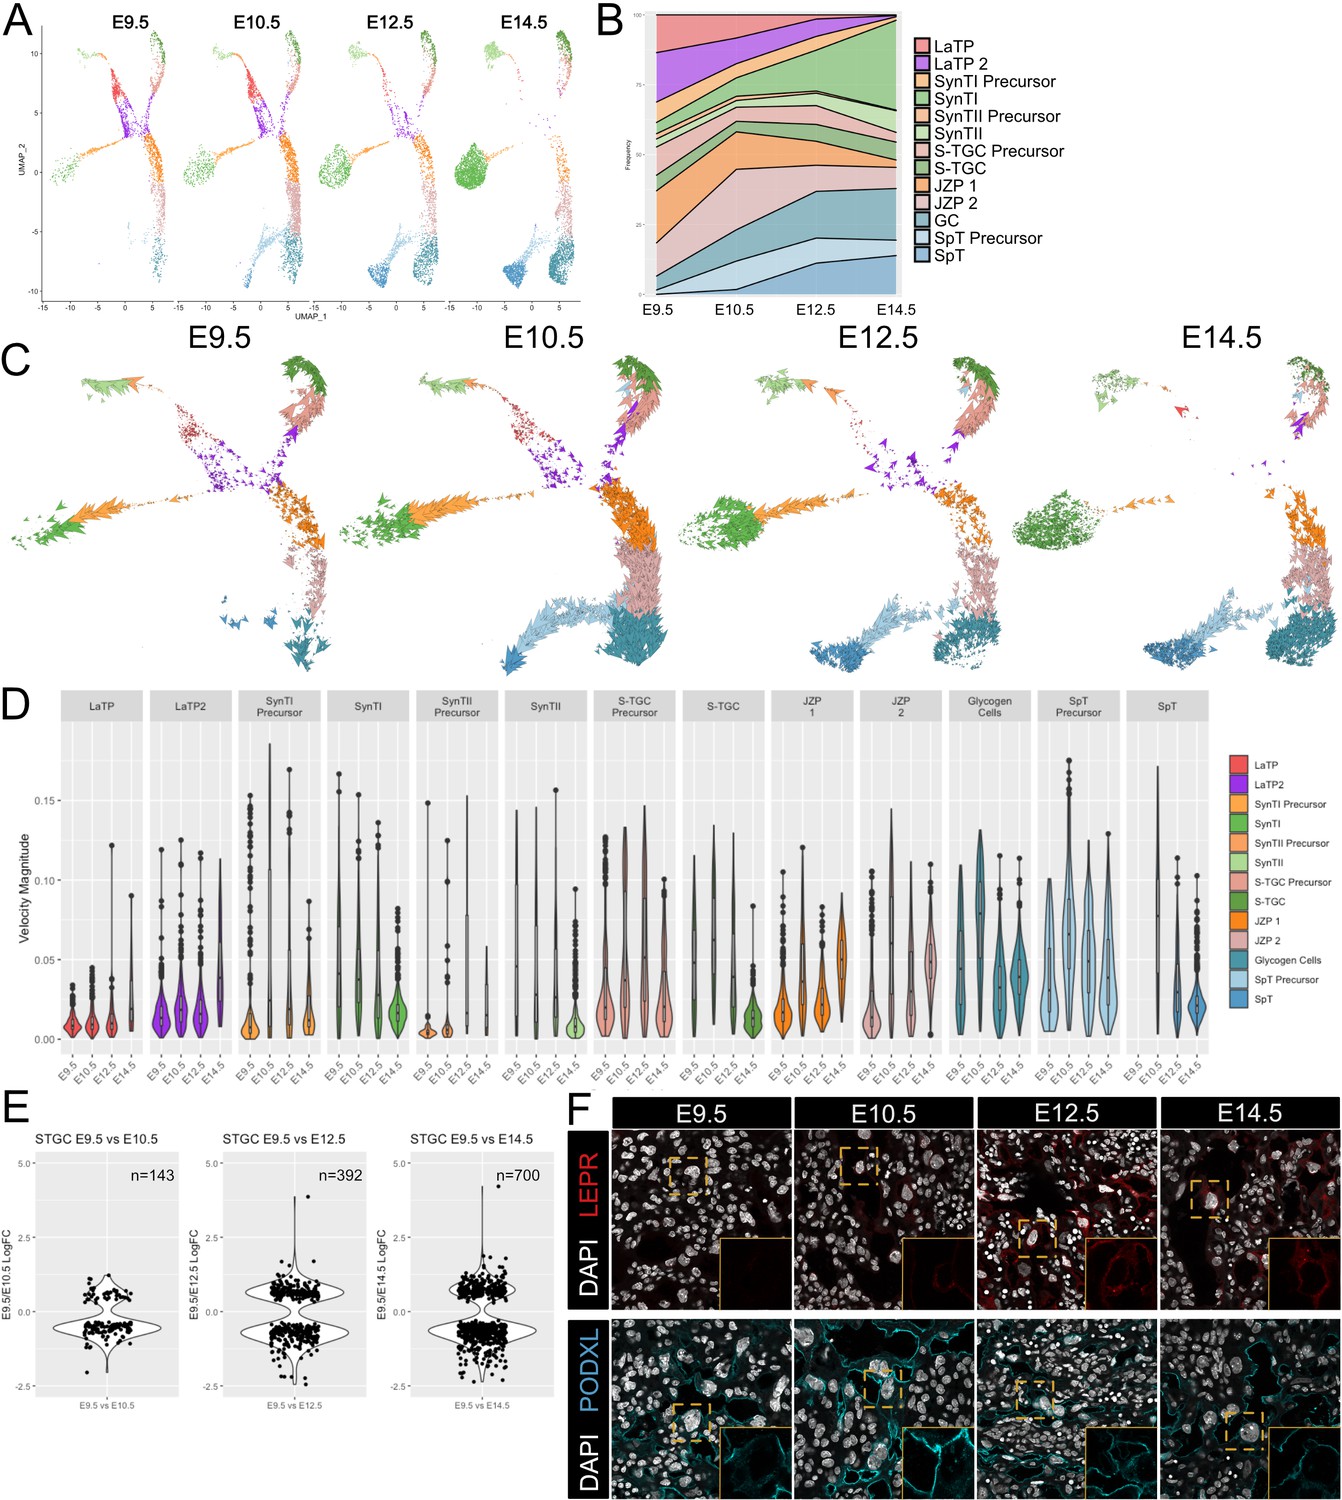
Developmental time course and trajectory inference reveal details of lineage dynamics and commitment in trophoblast.
(A) UMAP projection of all nuclei captured at each gestational age. (B) Quantification of the proportion of each cluster captured at each developmental time point. (C) RNA velocity vectors of the trophoblast nuclei at each time point. Arrows show the estimated magnitude and direction of each nucleus in pseudotime. (D) The magnitude of velocity vectors shown in D summarized as violin plots, with nuclei split by cluster identity and developmental time point. (E) Violin plots showing the log2 fold change of differentially expressed genes between nuclei from S-TGC at E9.5 vs. each other timepoint. (F) Immunofluorescence staining of LEPR (top) and PODXL (bottom) in the placental labyrinth at each developmental timepoint at 63x. Insets, magnification of area surrounding a S-TGC indicated by dotted line, DAPI stain removed to highlight protein expression.
-
Figure 3—source data 1
Average RNA velocity magnitude split by developmental stage and cluster (Figure 3D).
- https://cdn.elifesciences.org/articles/60266/elife-60266-fig3-data1-v2.xlsx
-
Figure 3—source data 2
S-TGC Differential Expression (E9.5 v E10.5).
- https://cdn.elifesciences.org/articles/60266/elife-60266-fig3-data2-v2.csv
-
Figure 3—source data 3
S-TGC Differential Expression (E9.5 v E12.5).
- https://cdn.elifesciences.org/articles/60266/elife-60266-fig3-data3-v2.csv
-
Figure 3—source data 4
S-TGC Differential Expression (E9.5 v E14.5).
- https://cdn.elifesciences.org/articles/60266/elife-60266-fig3-data4-v2.csv
Figure 3—figure supplement 1
Analysis of S-TGC across developmental time reveals a switch from proliferation to maturation.
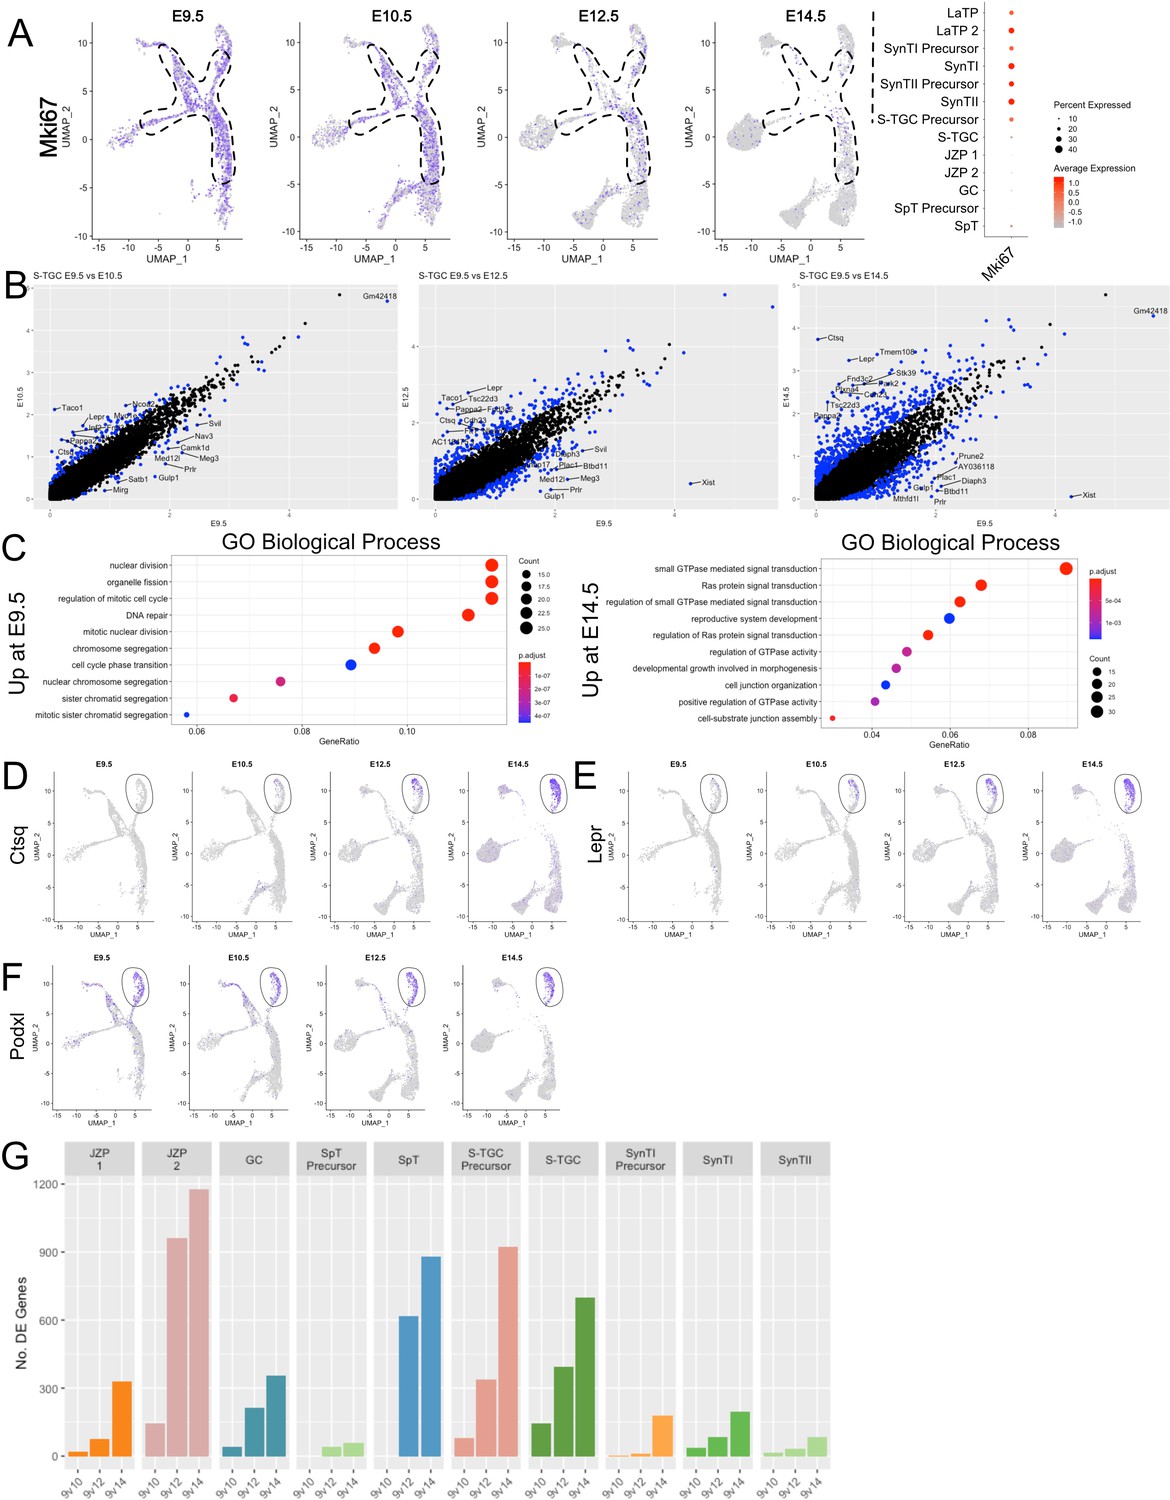
(A) Expression of Mki67 projected in UMAP space at each time point (left). The dotted line outlines the progenitor populations LaTP, LaTP2, SynTI Precursor, SynTII Precursor, and JZP 1/2. Quantification, shown as a dot blot representing percent cells expressing (increasing with dot size) and average expression (increasing with red color) of Mki67 in each cell population combined across all timepoints (right). (B) Scatter plot of differential expression (log2 fold change) in S-TGC nuclei comparing expression at E9.5 on the x-axis with E10.5 (left), E12.5 (middle), and E14.5 (right). Each dot represents a gene and significantly differentially expressed genes are colored blue (adj. p-value<0.05, 100 permutations). The top 10 differentially expressed genes by log2FC in either direction are labeled. (C) Gene Ontology (Biological Process) of genes upregulated at E14.5 vs E9.5 (left) and genes upregulated at E9.5 vs E14.5 (right) (adj. p-value<0.05, logFC >0.5). GeneRatio is the of the number of genes in the given ontology divided by the number of genes found in any ontology (Yu, 2018) . (D–F) Expression of Ctsq (D), Lepr (E), Podxl (F) across trophoblast cells represented on UMAP plot at each developmental time point. The S-TGC population is circled by a solid line. (G) The number of differentially expressed genes (y-axis) between each timepoint for each cluster (with greater than 50 nuclei captured at each timepoint).
-
Figure 3—figure supplement 1—source data 1
S-TGC Gene Ontology results by developmental stage.
- https://cdn.elifesciences.org/articles/60266/elife-60266-fig3-figsupp1-data1-v2.xlsx
Figure 4 with 1 supplement
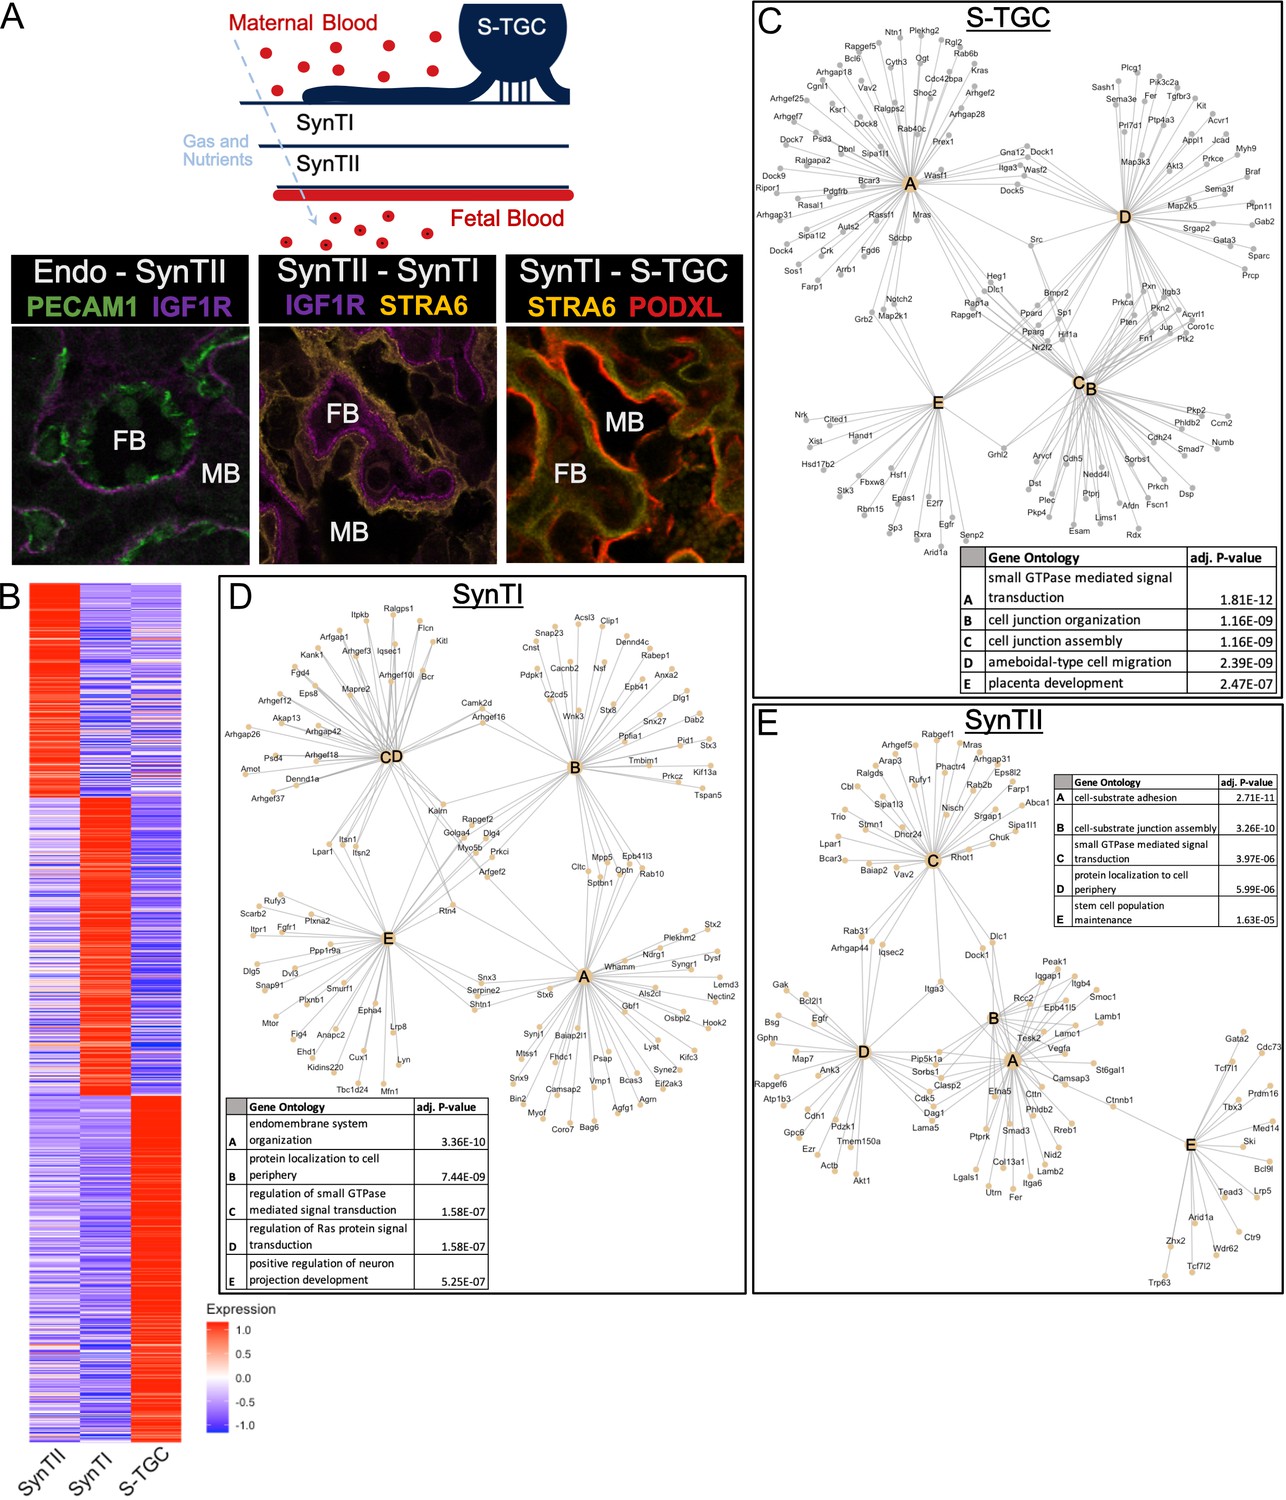
Defining distinct roles of the trophoblast subtypes at the gas exchange interface.
(A) Schematic showing the relative location of the cell types at the gas and nutrient exchange interface of the labyrinth – S-TGC, SynTI, SynTII, (sometimes referred to as trophoblast layer I, II, and III, respectively) and the fetal endothelium (top). Immunofluorescence staining resolving expression in each pair of neighboring cell types – Endothelial/SynTII, SynTII/SynTI, and SynTI/S-TGC in E12.5 mouse placenta sections. (B) Heatmap of all differentially expressed genes by log fold change in SynTI, SynTII, and S-TGC clusters. (C–E) Network diagrams showing the top 5 Gene Ontology (Biological Process) enriched in marker genes (adj. p-value<0.05, logFC >0.5) in each cluster (Yu G. 2018). Gene ontology categories are nodes and associated marker genes are annotated. Adjusted p-values for enrichment are listed in the table insets.
-
Figure 4—source data 1
Differential expression between interface clusters (SynTI, SynTII, and S-TGC).
- https://cdn.elifesciences.org/articles/60266/elife-60266-fig4-data1-v2.csv
-
Figure 4—source data 2
Gene Ontology results for differentially expressed genes between interface clusters (SynTI, SynTII, and S-TGC).
- https://cdn.elifesciences.org/articles/60266/elife-60266-fig4-data2-v2.xlsx
Figure 4—figure supplement 1
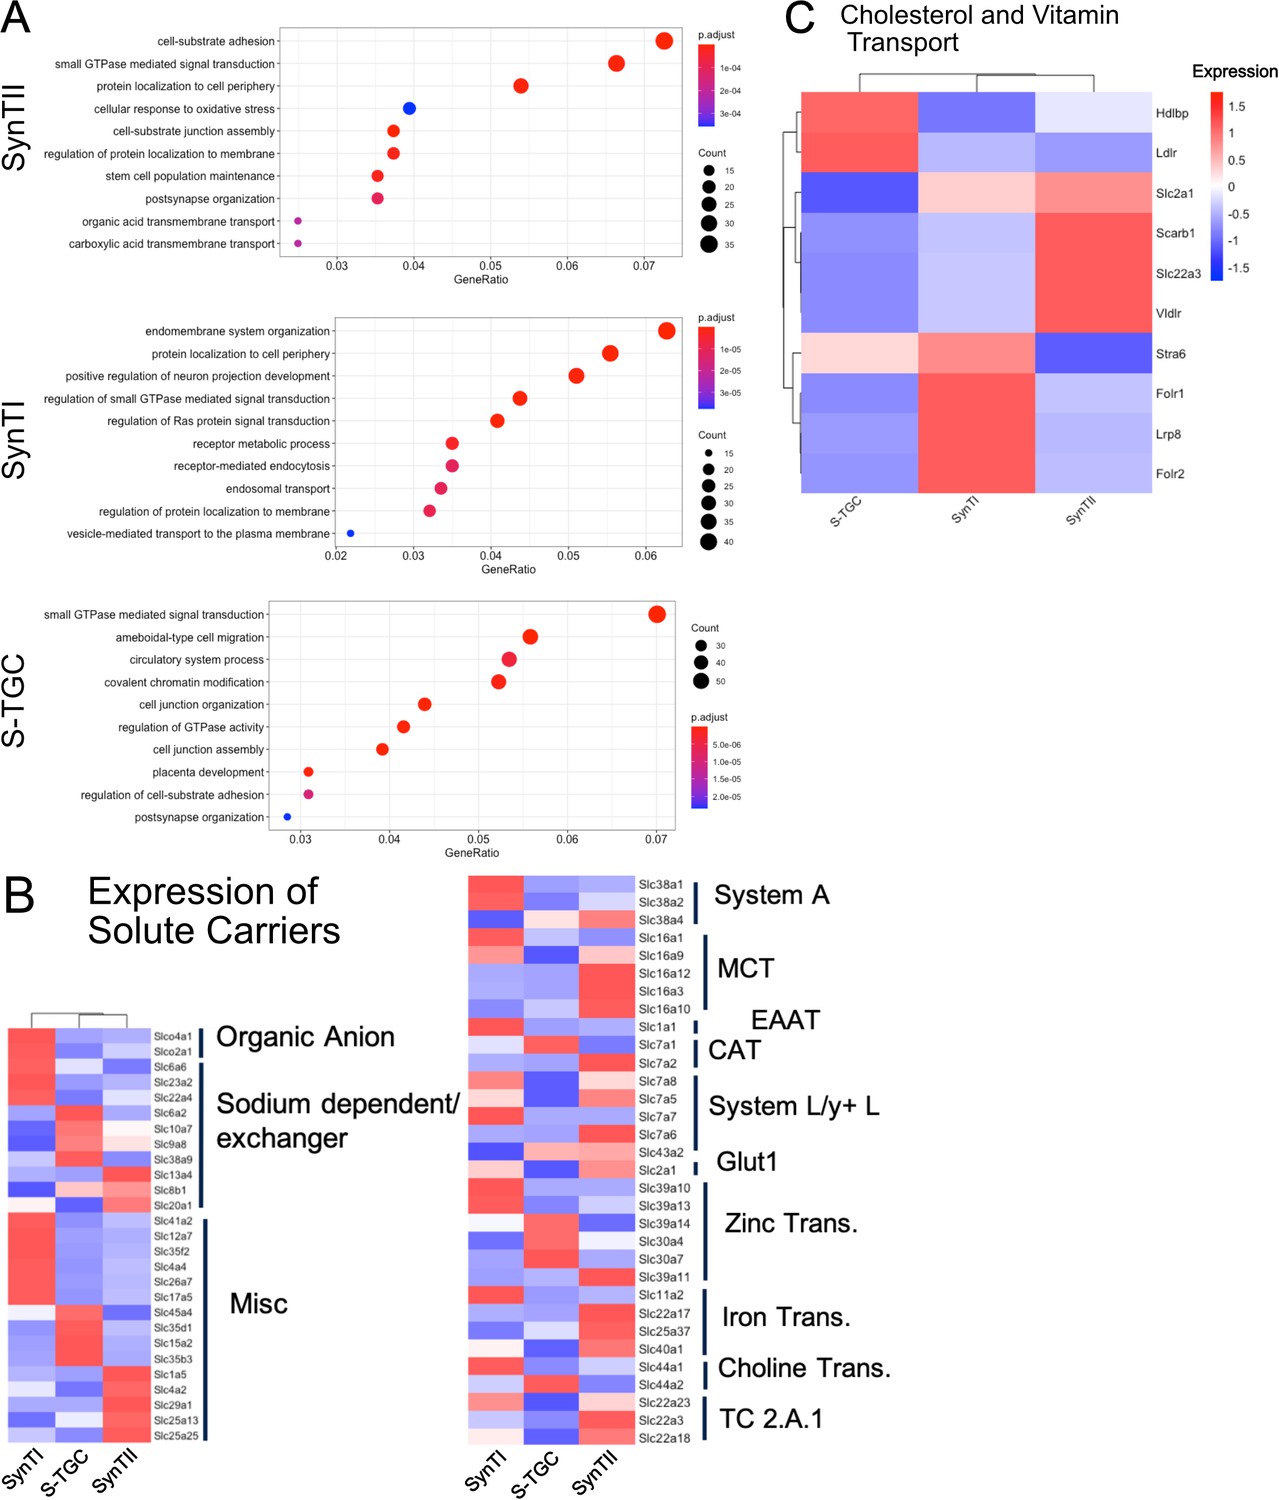
Gene ontology (biological process) of differentially expressed genes SynTII (top), SynTI (middle), S-TGC (bottom).
Significantly differentially expressed genes are defined by adj. p-value<0.05 and logFC >0.5. GeneRatio is the of the number of genes found the given ontology divided by the number of genes found in any ontology category. (B) Heatmap of scaled expression all solute transporters showing differential expression (adj. p-value<0.05) in SynTI, SynTII, S-TGC compared to all other trophoblast clusters. Genes are organized and annotated by class of transporter. (C) Heatmap of scaled expression of select genes involved in vitamin and cholesterol transport.
Figure 5 with 2 supplements
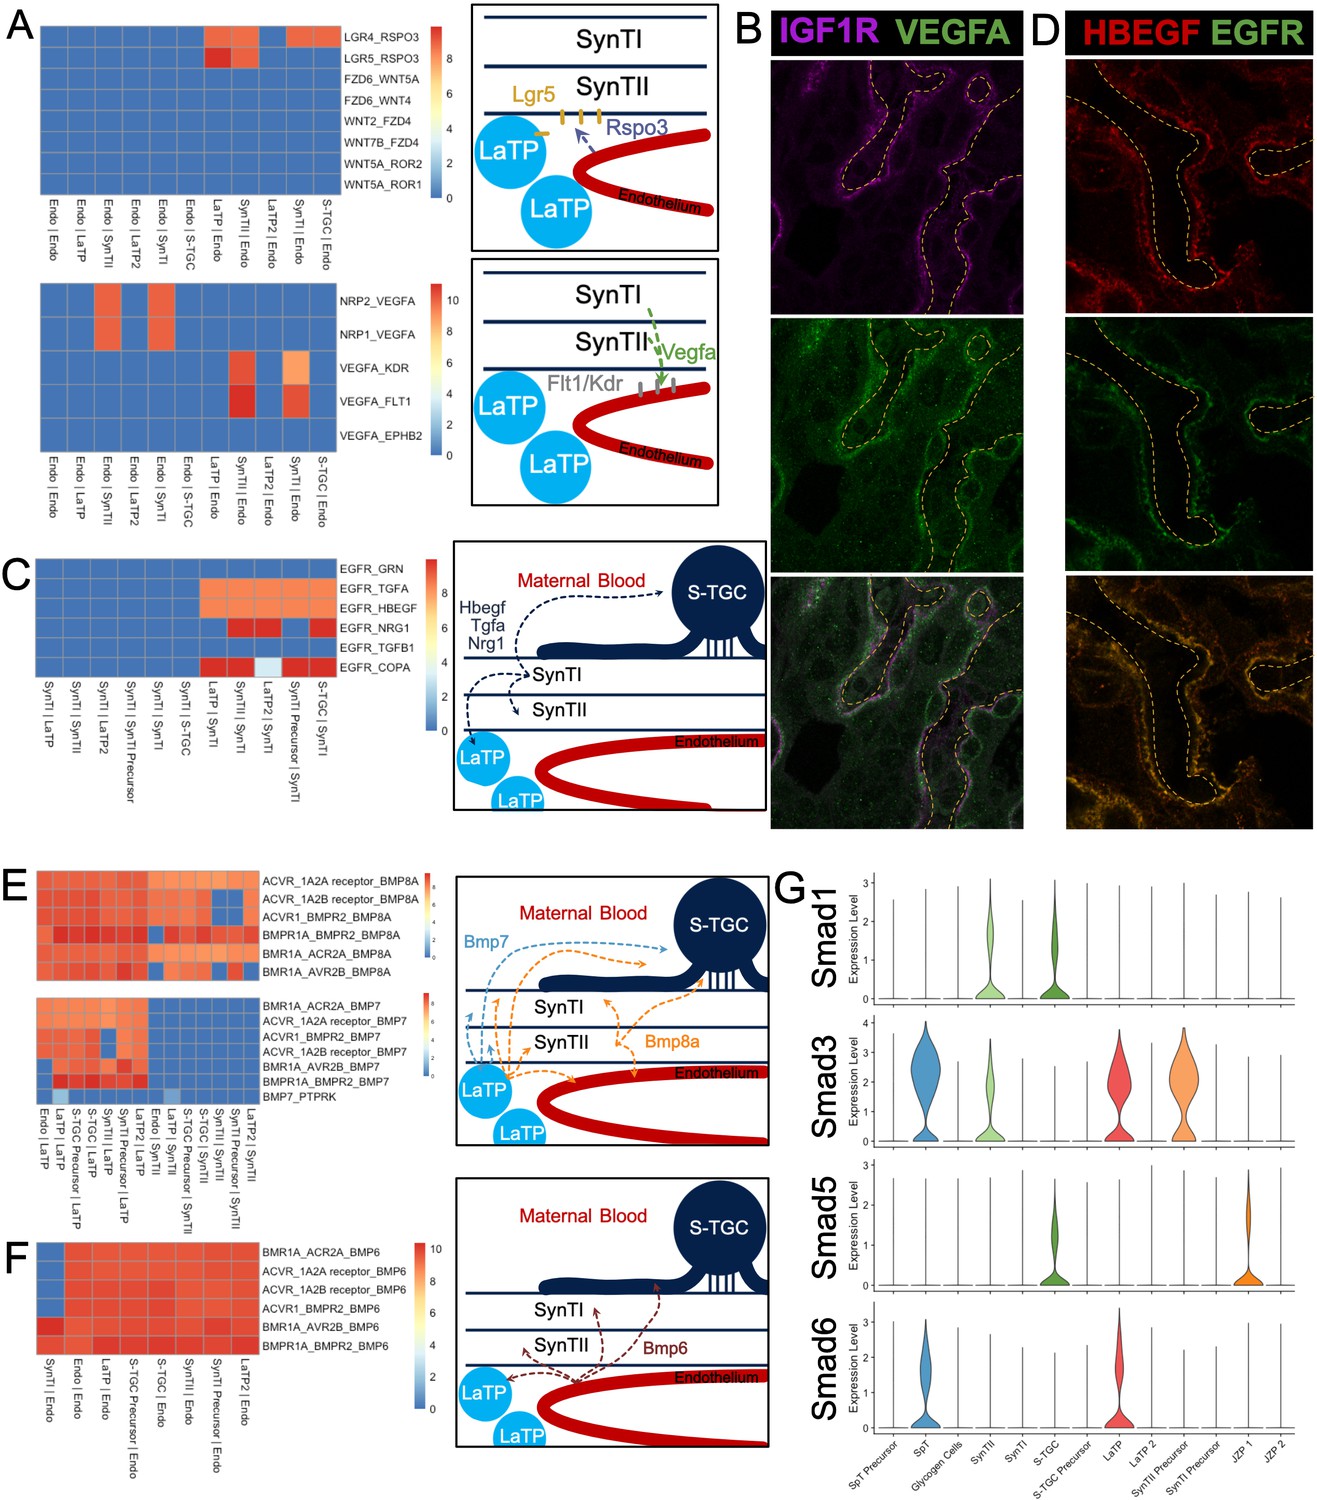
Predicting Cell Signaling within the placental labyrinth.
(A) Heatmap showing all Wnt signaling interactions (top) and Vegf signaling (bottom) between the endothelium and labyrinth trophoblast populations. Left: schematics summarizing signaling interactions. (B) Immunofluorescence staining for VEGFA and IGF1R demonstrating colocalization in SynTII in E12.5 mouse placenta sections (63x). Fetal Vessels are outlined in yellow dashed line. (C) Heatmap showing all Egfr signaling interactions between labyrinth populations. Schematic showing secretion of Egf ligands Hbegf, Tgfa, and Nrg1 from SynTI to Egfr expressed on SynTII, LaTP, and S-TGC. (D) Immunofluorescence staining for HBEGF and EGFR demonstrating colocalization of the ligand and receptor SynTII, but only HBEGF expression in SynTI (E12.5 mouse placenta sections - 63x) (E) Heatmap showing signaling interactions of Bmp8a (top) and Bmp7 (bottom), secreted by the LaTP and SynTII or LaTP only, respectively. (F) Heatmap showing predicted signaling interactions between Bmp6 secreted by the endothelium to receptors on LaTP, SynTI, SynTII and S-TGC. (G) Transcript expression for the Smad TFs which are differentially regulated (Smad1/3/5/6).
Figure 5—figure supplement 1
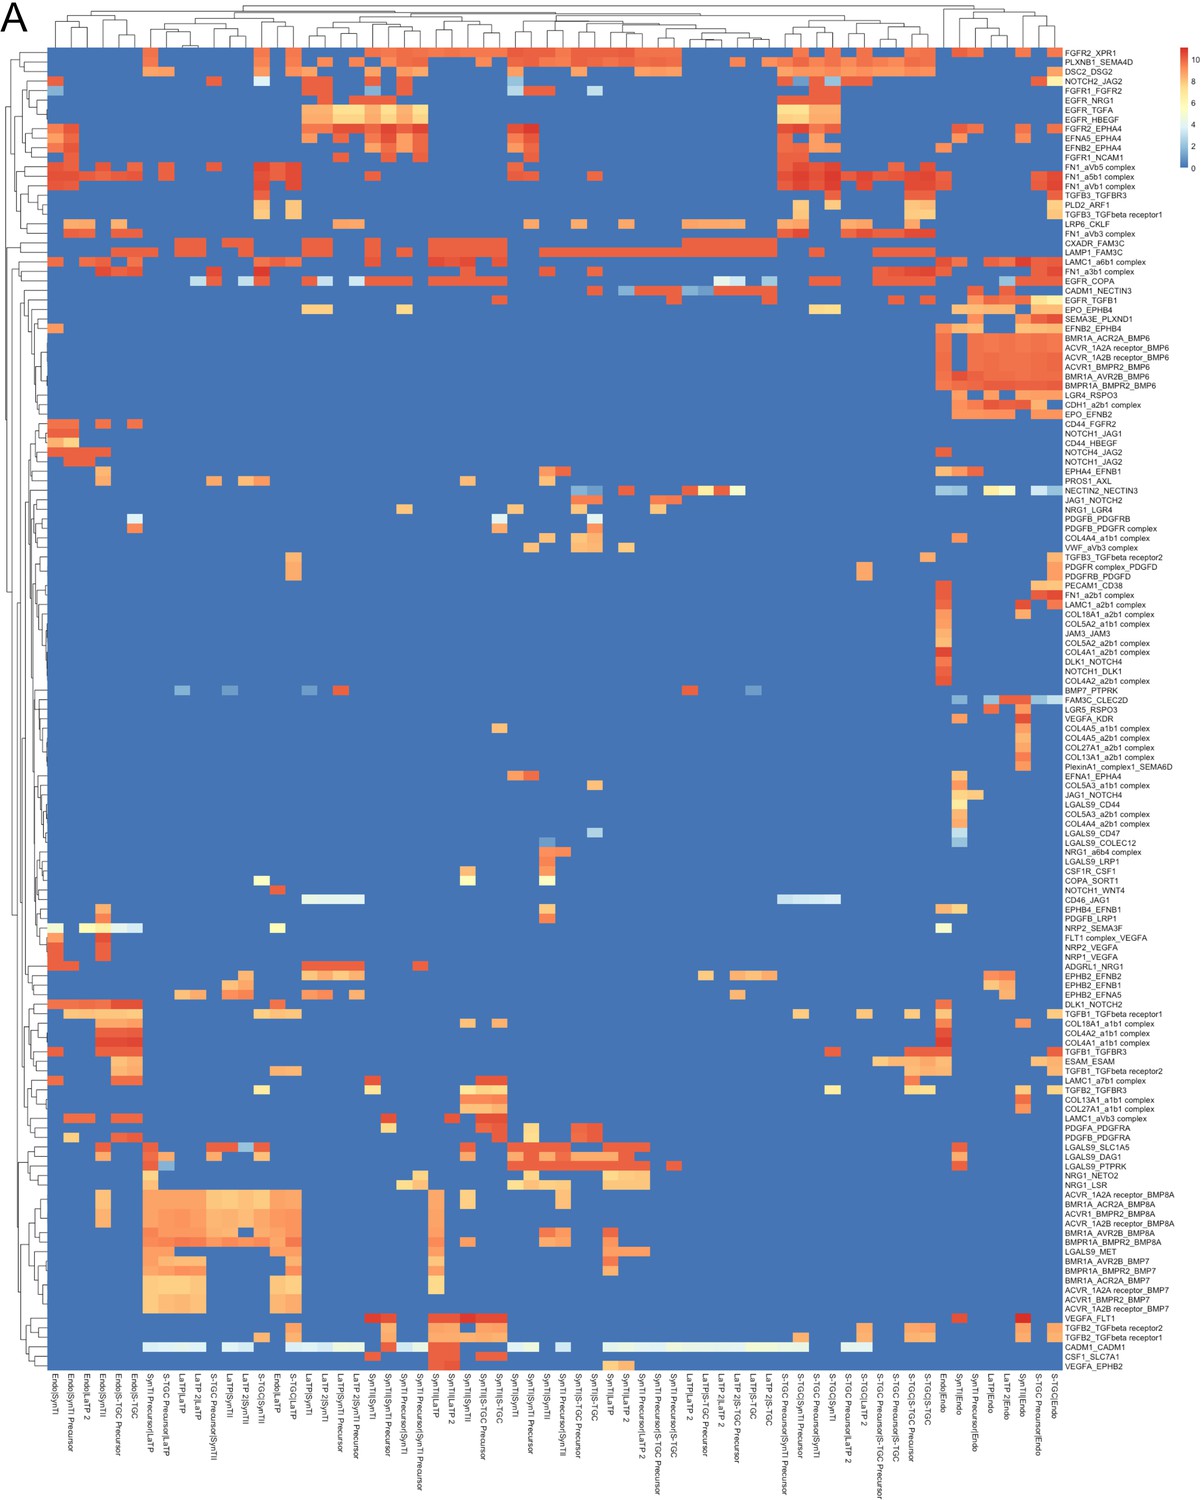
All predicted receptor-ligand interactions between labyrinth populations.
(A) Heatmap of 139 ligand–receptor interactions predicted by CellPhoneDB (p-value<0.05 permutation test). The rows are ligand–receptor pairs and columns are cell–cell pairings. Strength of interaction is shown by coloration. All interactions not reaching significance have a strength of zero (blue).
-
Figure 5—figure supplement 1—source data 1
CellPhoneDB interaction raw data for trophoblast populations.
- https://cdn.elifesciences.org/articles/60266/elife-60266-fig5-figsupp1-data1-v2.csv
Figure 5—figure supplement 2
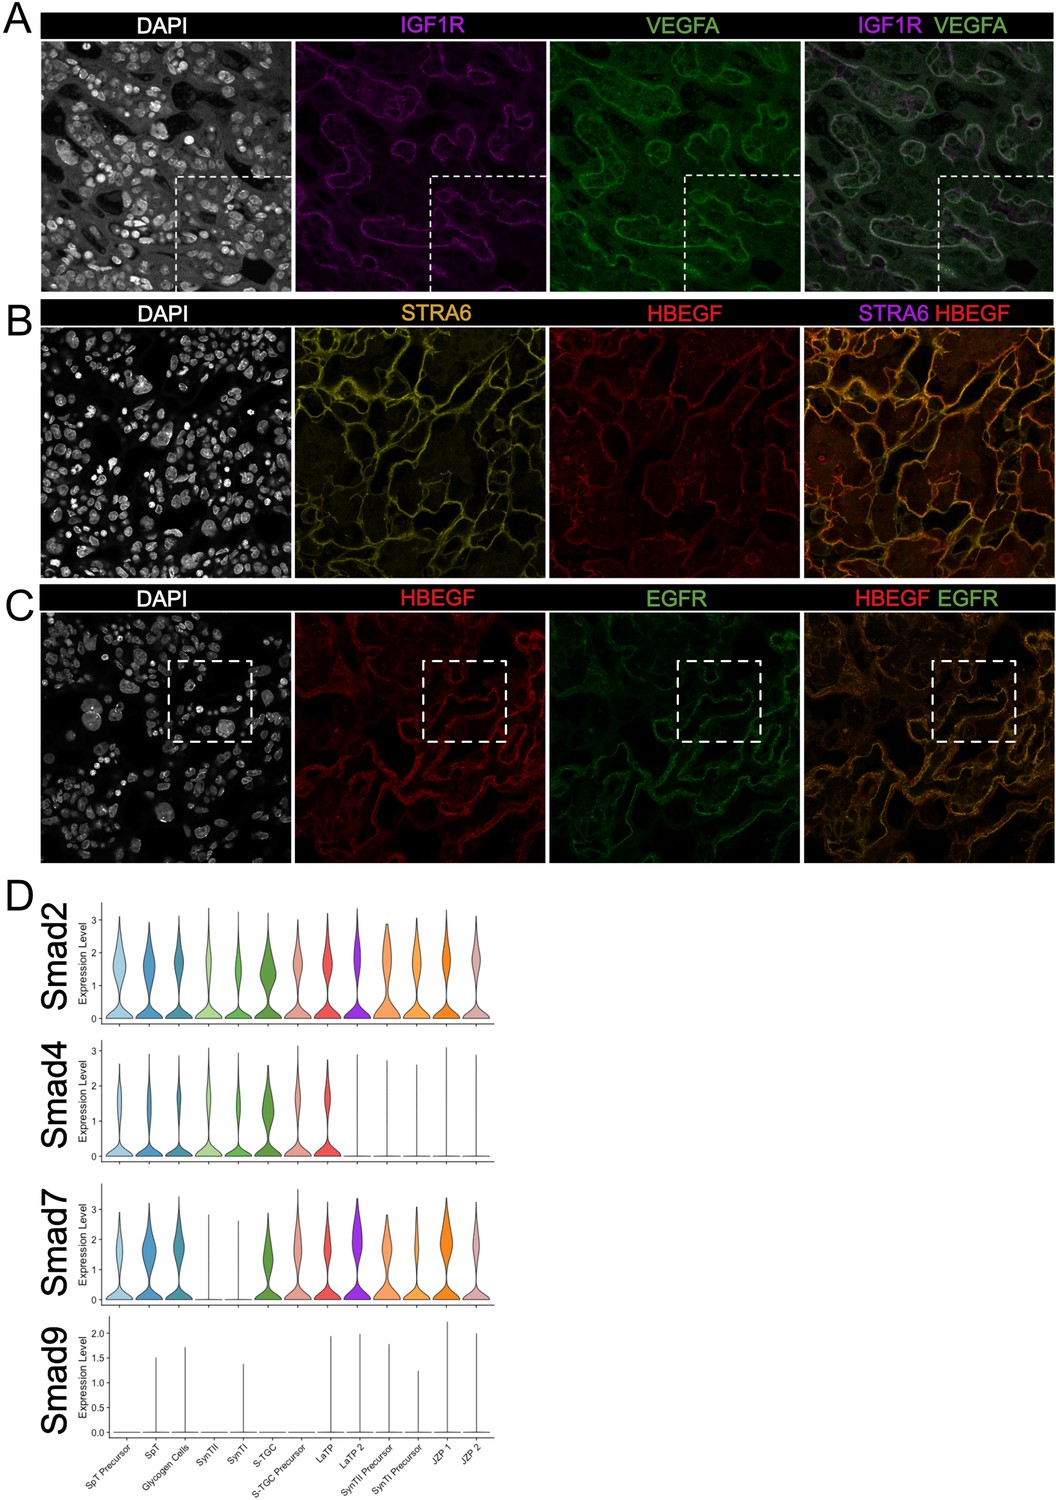
Validation of predicted cell signaling events in the labyrinth.
(A–C) Immunofluorescence staining of sections from E12.5 placentas of (A) IGF1R (Purple) and VEGFA (Green); (B) STRA6 (Yellow) and HBEGF (Red); HBEGF (Red) and EGFR (Green). The white- dashed line in (A) and (B) outline the magnified areas shown in Figure 5B and Figure 5D, respectively. Fetal vessels are outlined by the yellow dashed lines. (D) Violin plots summarizing expression of Smad2/4/7/9 in each trophoblast cluster.
Figure 6 with 1 supplement
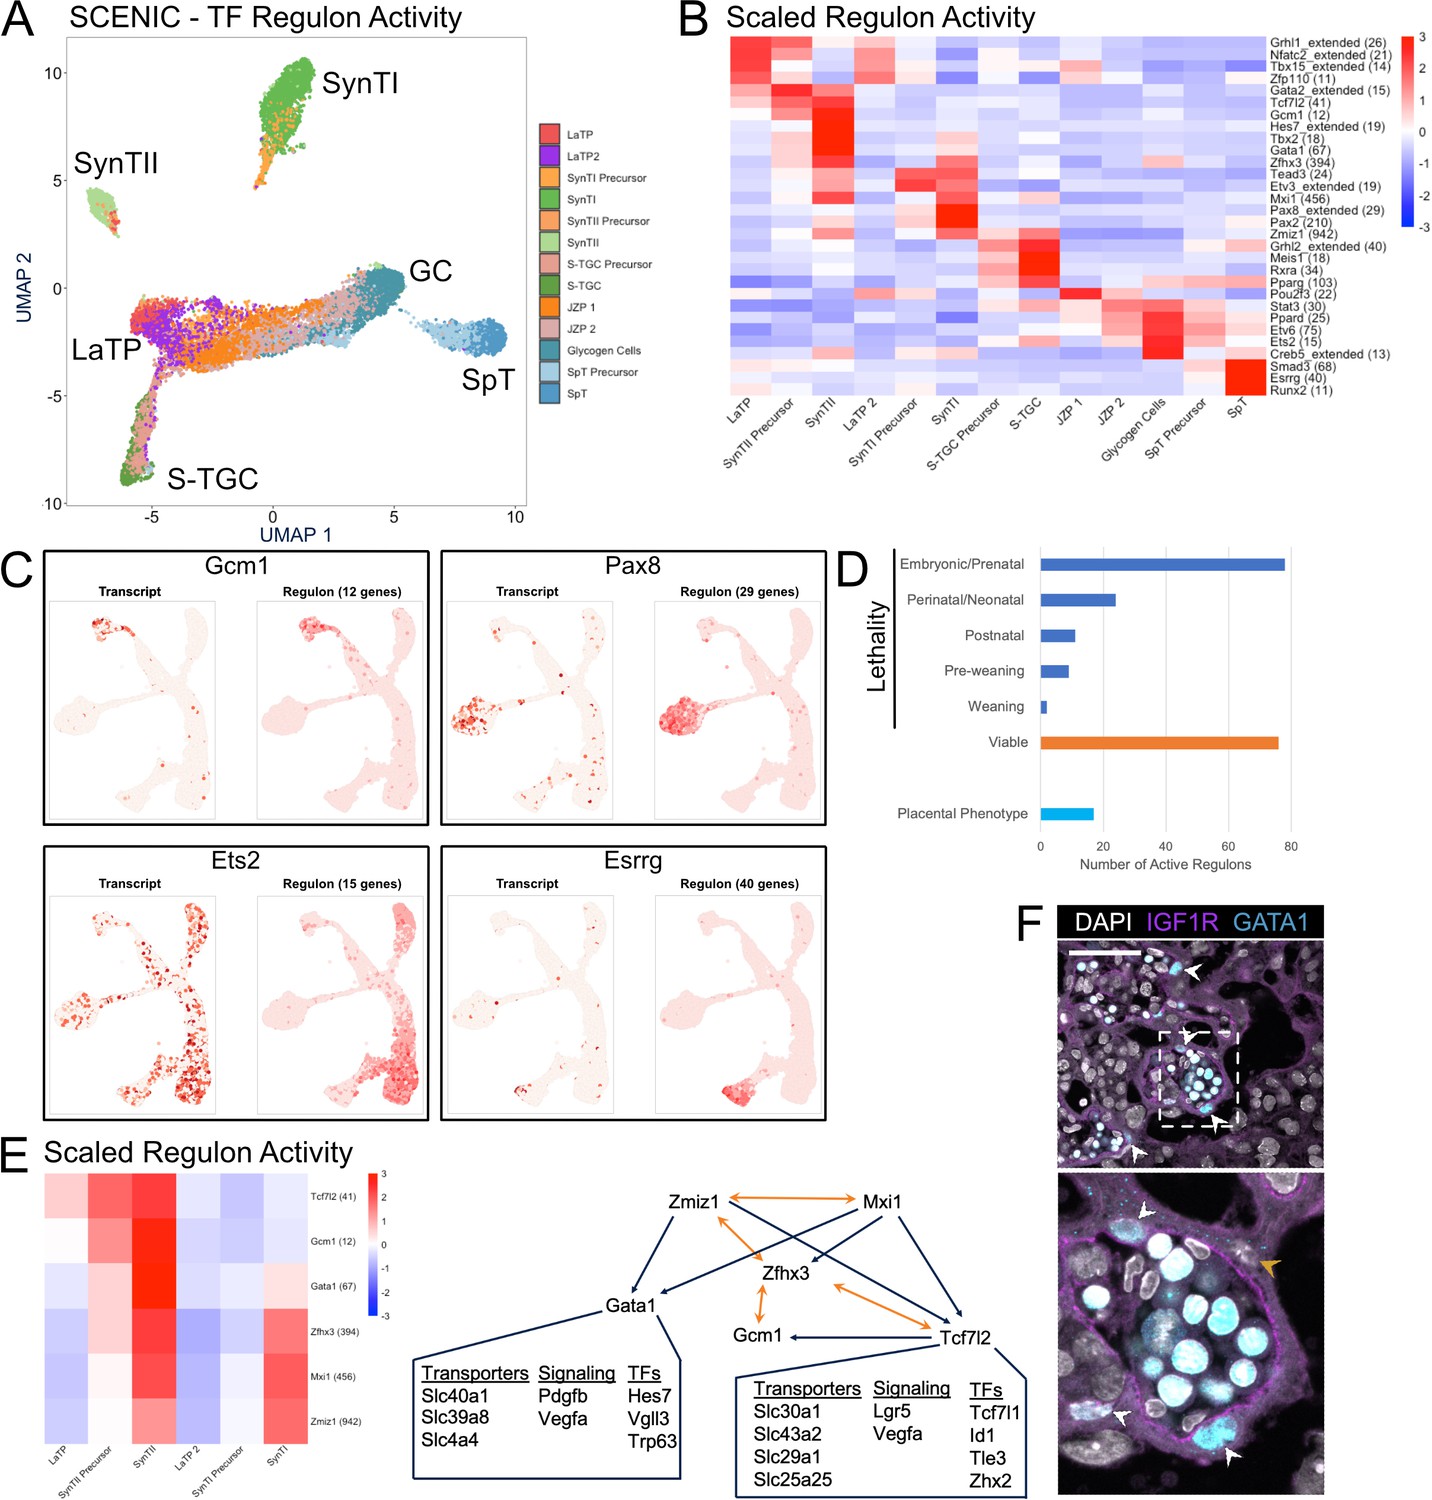
Modeling transcription factor regulon activity identifies new candidate regulators of SynTII.
(A) UMAP projection derived from regulon activity predicted by SCENIC. The clusters are colored according to Seurat clustering of transcript data. The cluster identities of each of the five arms of the UMAP are annotated. (B) Heatmap of the scaled regulon activity for select regulons expressed in each trophoblast population. The number of genes predicted to be regulated by each transcription factor is included in parenthesis. (C) Comparison of transcript expression of the TF (left) and the regulon activity for that TF (right) at the single-cell resolution projected in UMAP space for Gcm1, Pax8, Ets2, and Esrrg. The number of genes predicted to be regulated by each transcription factor is denoted in parentheses. (D) Quantification of the number active regulons with a lethal phenotype in mouse according to the Jackson Laboratory MGI (Embryonic/Prenatal - 78, Perinatal/Neonatal - 24, Postnatal - 11, Pre-weaning - 9, lethality at weaning - 2, no developmental lethality - 76) and the number with known placental phenotypes in vivo (n = 17). (E) Heatmap showing expression of a network of regulons enriched for expression in SynTII (left). Gene regulatory network of high confidence predicted interactions from GRNboost2 (right). Unidirectional regulation denoted by blue arrows and bidirectional regulation by yellow. Predicted targets of Gata1 and Tcf7l2 expressed in SynTII and important in SynTII differentiation or function are annotated. (F) Immunofluorescence staining for GATA1 and IGF1R showing GATA1 expressing nuclei in IGF1R SynTII cells (E12.5 mouse placenta sections - 63x). GATA1+ SynTII nuclei – white arrowheads, GATA1- putative SynTI nucleus – yellow arrowhead.
-
Figure 6—source data 1
SCENIC scaled regulon activity in trophoblast nuclei.
- https://cdn.elifesciences.org/articles/60266/elife-60266-fig6-data1-v2.csv
-
Figure 6—source data 2
SCENIC regulon predicted binding targets for all active regulons.
- https://cdn.elifesciences.org/articles/60266/elife-60266-fig6-data2-v2.txt
Figure 6—figure supplement 1

Additional validation of SCENIC and Gata1 expression and expression of genes with validated placental phenotypes in vivo.
(A) Heatmaps showing the Pearson correlation values between cluster averages of transcript expression (left) and SCENIC regulon activity (right). Clusters are ordered by hierarchical clustering with complete linkage. (B) Dot plot showing the average expression and percent of the nuclei in each cluster of all subviable genes with placental phenotypes from Perez-Garcia et al., 2018 in the trophoblast clusters from Figure 2. (C) Dot plot showing the average expression and percent of the nuclei in each cluster of all subviable genes with placental phenotypes from Perez-Garcia et al., 2018 in the conglomerate dataset clusters from Figure 1. (D) Additional immunofluorescence staining of GATA1 and Igfr1 in SynTII at E12.5.
Tables
Key resources table
| Reagent type (species) or resource | Designation | Source or reference | Identifiers | Additional information |
|---|---|---|---|---|
| Strain (Mus musculus) | C57BL/6J Mice | https://www.jax.org/strain/000664 | 000664 | 6–12 weeks old |
| Commercial assay or kit | Nuclei isolation Kit: Nuclei EZ Prep | Sigma-Aldrich | NUC101-1KT | |
| Antibody | E-cadherin Monoclonal antibody (ECCD-2) | Thermofisher Scientific | 13–1900 | IF (1:250) |
| Antibody | Human/mouse NCAM-1/CD56 Polyclonal antibody | R and D Systems | AF2408-SP | IF (1:25) |
| Antibody | Anti-EpCAM Polyclonal antibody | Abcam | ab71916 | IF (1:1000) |
| Antibody | Anti-Stra6 Polyclonal antibody | Sigma-Aldrich | ABN1662 | IF (1:100) |
| Antibody | Anti-Igf1r Polyclonal antibody | R and D Systems | AF305 | IF (1:50 w/ antigen retrieval) |
| Antibody | Anti-Slco2a1 Polyclonal antibody | Atlas Antibodies | HPA013742 | IF (1:25 w/ antigen retrieval) |
| Antibody | Anti-Lepr Polyclonal antibody | R and D Systems | AF497 | IF (1:200) |
| Antibody | Anti-Pcdh12 Polyclonal antibody | Abcam | ab113720 | IF (1:25 w/ antigen retrieval) |
| Antibody | Anti-Podxl Polyclonal antibody | R and D Systems | AF1556 | IF (1:25) |
| Antibody | Anti-Pecam1 Polyclonal antibody | Abcam | ab23864 | IF (1:50) |
| Antibody | Anti-Vegfa Polyclonal antibody | Abcam | ab51745 | IF (1:50) |
| Antibody | Anti-Met Polyclonal antibody | R and D Systems | AF276 | IF (1:100) |
| Antibody | Anti-Egfr Polyclonal antibody | R and D Systems | AF1280 | IF (1:100) |
| Antibody | Anti-Gata1 Monoclonal antibody | Cell Signaling | 3535 | IF (1:100) |
| Antibody | Anti-Hbegf Polyclonal antibody | R and D Systems | AF8239 | IF (1:20) |
| Software, algorithm | R | https://www.r-project.org/ | ||
| Software, algorithm | ImageJ | ImageJ (http://imagej.nih.gov/ij/) | ||
| Software, algorithm | Seurat (3.1.3) | https://satijalab.org/seurat/ | ||
| Software, algorithm | cellranger (3.0.2) | https://support.10xgenomics.com/single-cell-gene-expression/software/pipelines/latest/feature-bc | ||
| Software, algorithm | CellPhoneDB | https://www.cellphonedb.org/ | ||
| Software, algorithm | SCENIC | https://github.com/aertslab/SCENIC | ||
| Software, algorithm | ClusterProfiler | https://guangchuangyu.github.io/software/clusterProfiler/ | ||
| Software, algorithm | Slingshot | https://github.com/kstreet13/slingshot | ||
| Software, algorithm | scVelo | https://github.com/theislab/scvelo | ||
| Software, algorithm | FlowJo | https://www.flowjo.com |
Additional files
-
Supplementary file 1
Sample information and processing.
Contains information of the number of nuclei captured at each timepoint and the processing information for each dataset (number of Principal Components and the resolution parameters used for cluster/integration)
- https://cdn.elifesciences.org/articles/60266/elife-60266-supp1-v2.xlsx
-
Supplementary file 2
Number of nuclei captured per cluster complete dataset.
Breakdown of the number of nuclei collected at each timepoint for each cluster identified in the dataset used in Figure 1. Also, provided is the percent of the total nuclei assigned to each cluster captured at each timepoint. Finally, these data are normalized to the number of nuclei captured at each timepoint so that comparisons may be made with in a cluster across timepoints.
- https://cdn.elifesciences.org/articles/60266/elife-60266-supp2-v2.xlsx
-
Supplementary file 3
Number of nuclei captured per cluster trophoblast dataset.
Breakdown of the number of nuclei collected at each timepoint for each cluster identified in the trophoblast dataset used in Figures 2–6. Also, provided is the percent of the total nuclei assigned to each cluster captured at each timepoint. Finally, these data are normalized to the number of nuclei captured at each timepoint so that comparisons may be made with in a cluster across timepoints.
- https://cdn.elifesciences.org/articles/60266/elife-60266-supp3-v2.xlsx
-
Transparent reporting form
- https://cdn.elifesciences.org/articles/60266/elife-60266-transrepform-v2.pdf
Download links
A two-part list of links to download the article, or parts of the article, in various formats.
Downloads (link to download the article as PDF)
Open citations (links to open the citations from this article in various online reference manager services)
Cite this article (links to download the citations from this article in formats compatible with various reference manager tools)
Single nuclei RNA-seq of mouse placental labyrinth development
eLife 9:e60266.
https://doi.org/10.7554/eLife.60266


