Dynamics of nevus development implicate cell cooperation in the growth arrest of transformed melanocytes
- Center for Complex Biological Systems, University of California, Irvine, United States
- Department of Developmental and Cell Biology, University of California, Irvine, United States
- Department of Dermatology, University of California, Irvine, United States
- Beckman Laser Institute, University of California, Irvine, United States
- Department of Mathematics, University of California, Irvine, United States
- Department of Biological Chemistry, University of California, Irvine, United States
Figures
Figure 1 with 1 supplement
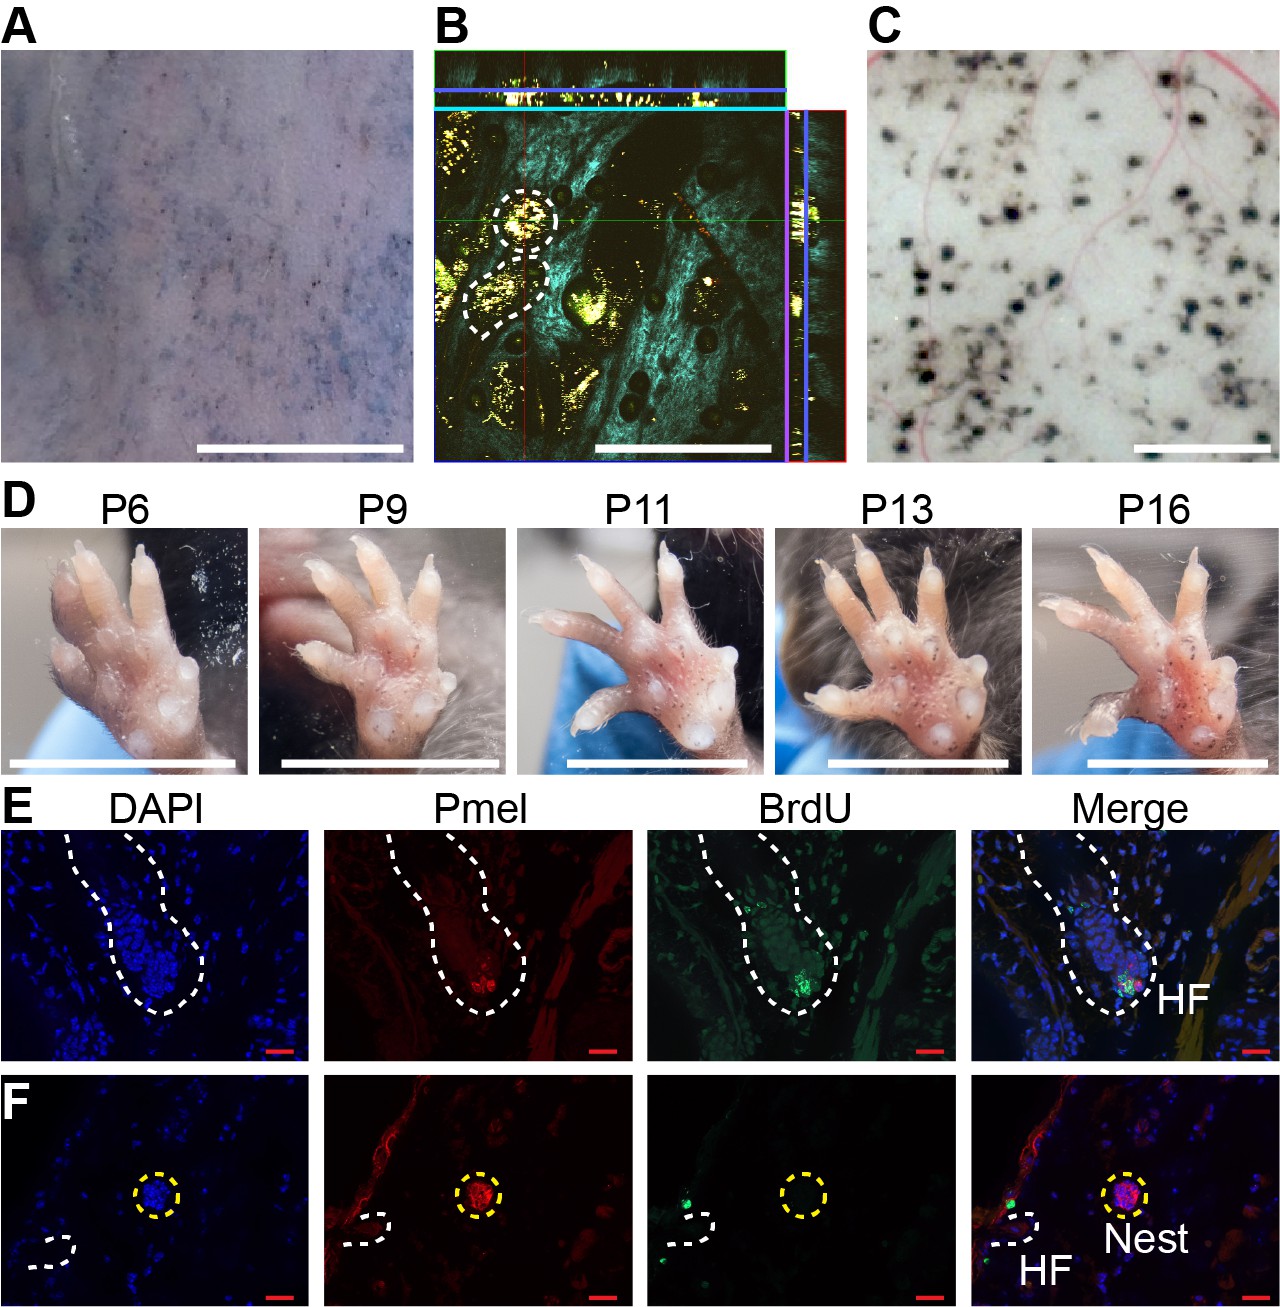
Dynamics of nevus growth.
(A-D) Visualization of nevi on BrafV600E mice. (A) Live imaging of back skin at telogen-stage (P50), following hair depilation. Scale bar = 5 mm. (B) Live imaging of a sample like that in panel A using multi-photon microscopy. The central square is an en face view of the skin (x-y plane), while rectangles above and to the right are cross-sections (x-z and y-z planes, respectively, with blue lines marking the location of the central image). Melanin autofluorescence appears yellow, second harmonic generation of collagen is cyan, and keratin autofluorescence is green. Dashing outlines dermal melanocyte nests. Scale bar = 318 µm. (C) Appearance of nevi on the undersurface of back skin (at P21). Scale bar = 1 mm. (D) Nevus development on the ventral (glabrous) surface of the paw. Images of a single paw were taken at the indicated ages. Scale bar = 0.5 cm. (E-F) Assessment of melanocyte proliferation. Sections are from albino wildtype (E) and BrafV600E (F) skin at P21. Melanocytes were identified by premelanosome protein (Pmel) immunohistochemistry and proliferation assessed by BrdU incorporation. Wildtype hair follicle (HF) melanocytes (E) incorporate BrdU whereas nevus melanocytes (F) do not. Scale bar = 20 µm.
Figure 1—figure supplement 1
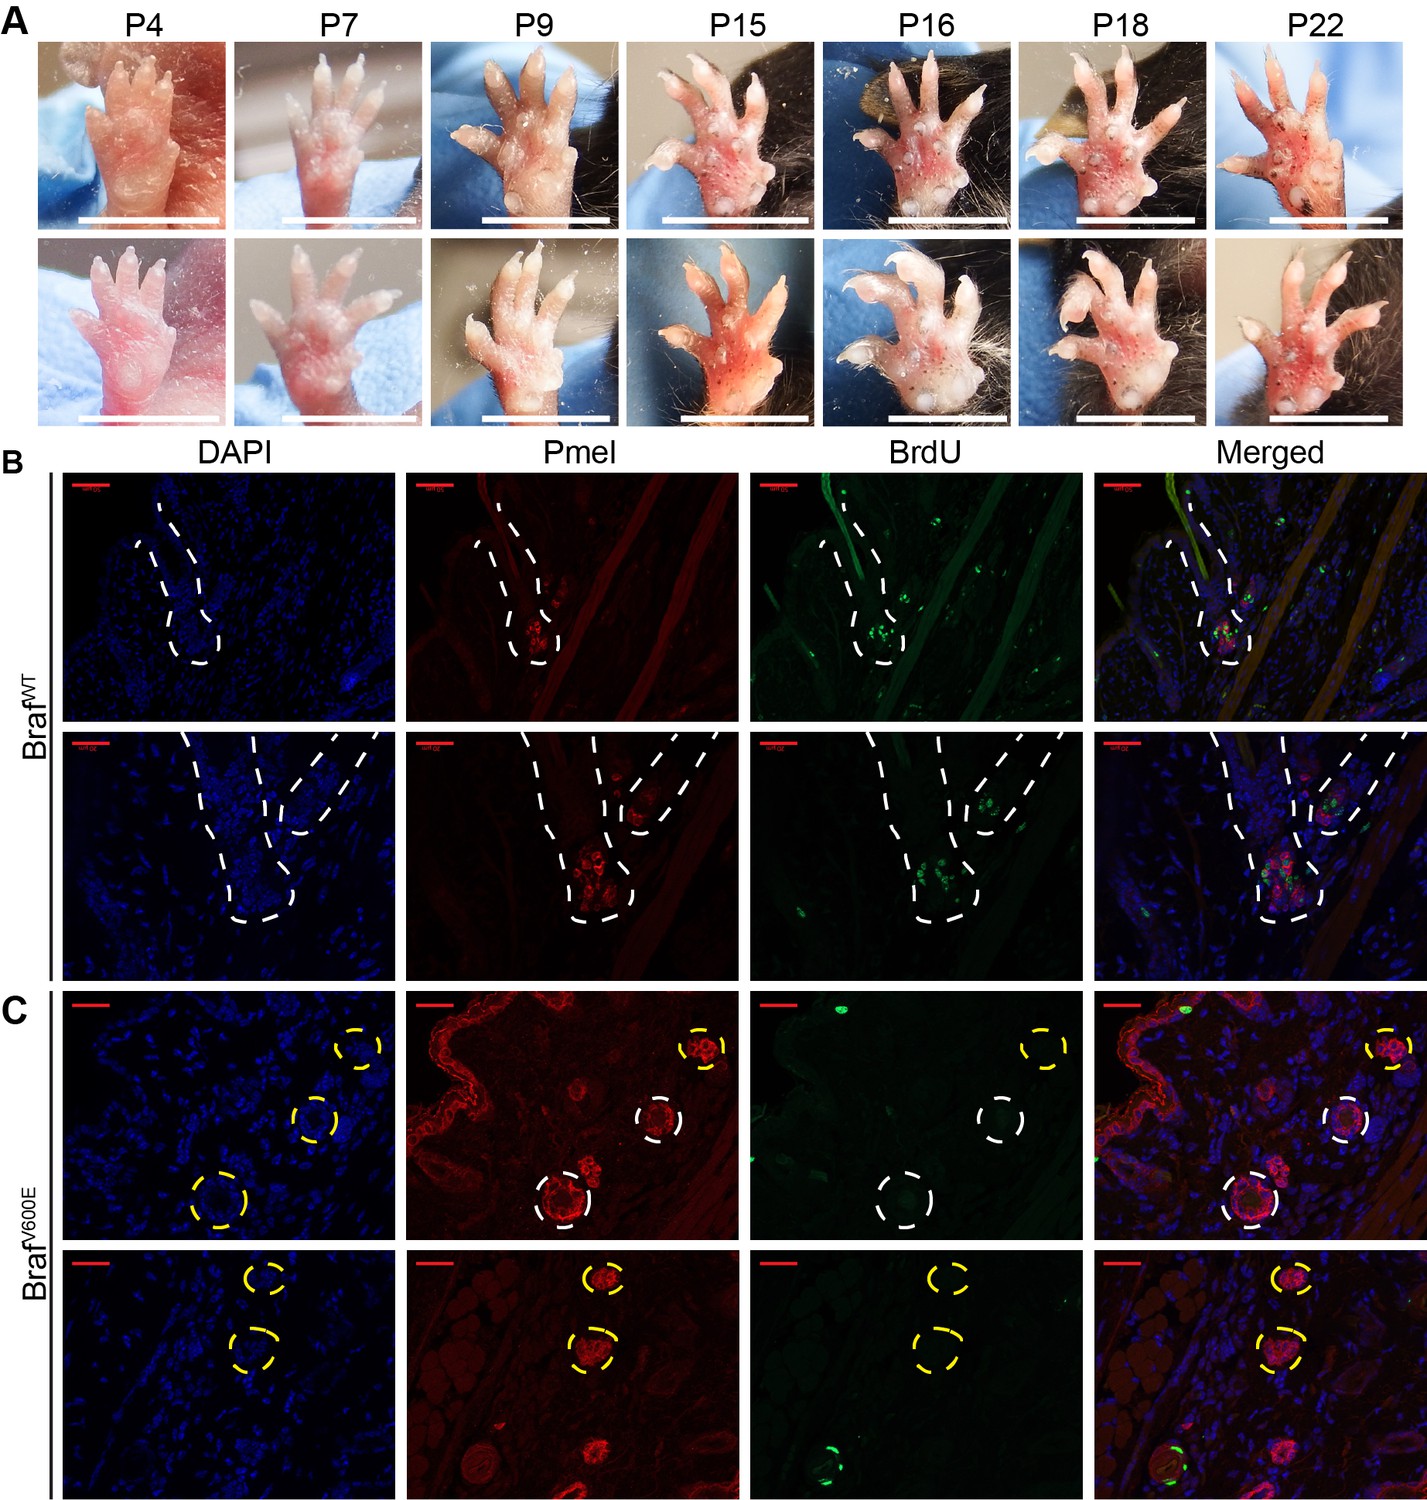
Dynamics of nevus growth.
(A) Nevus development on the ventral surface of the glabrous paw. Images were taken at the indicated age. (B–C) Identification of dividing or non-dividing melanocytes with the premelanosome protein (Pmel), and BrdU incorporation, in the (B) hair follicle (HF) of wild type mice and (C) in nests at P21 in BrafV600E mice. Scale bar = 20 µm.
Figure 2 with 1 supplement
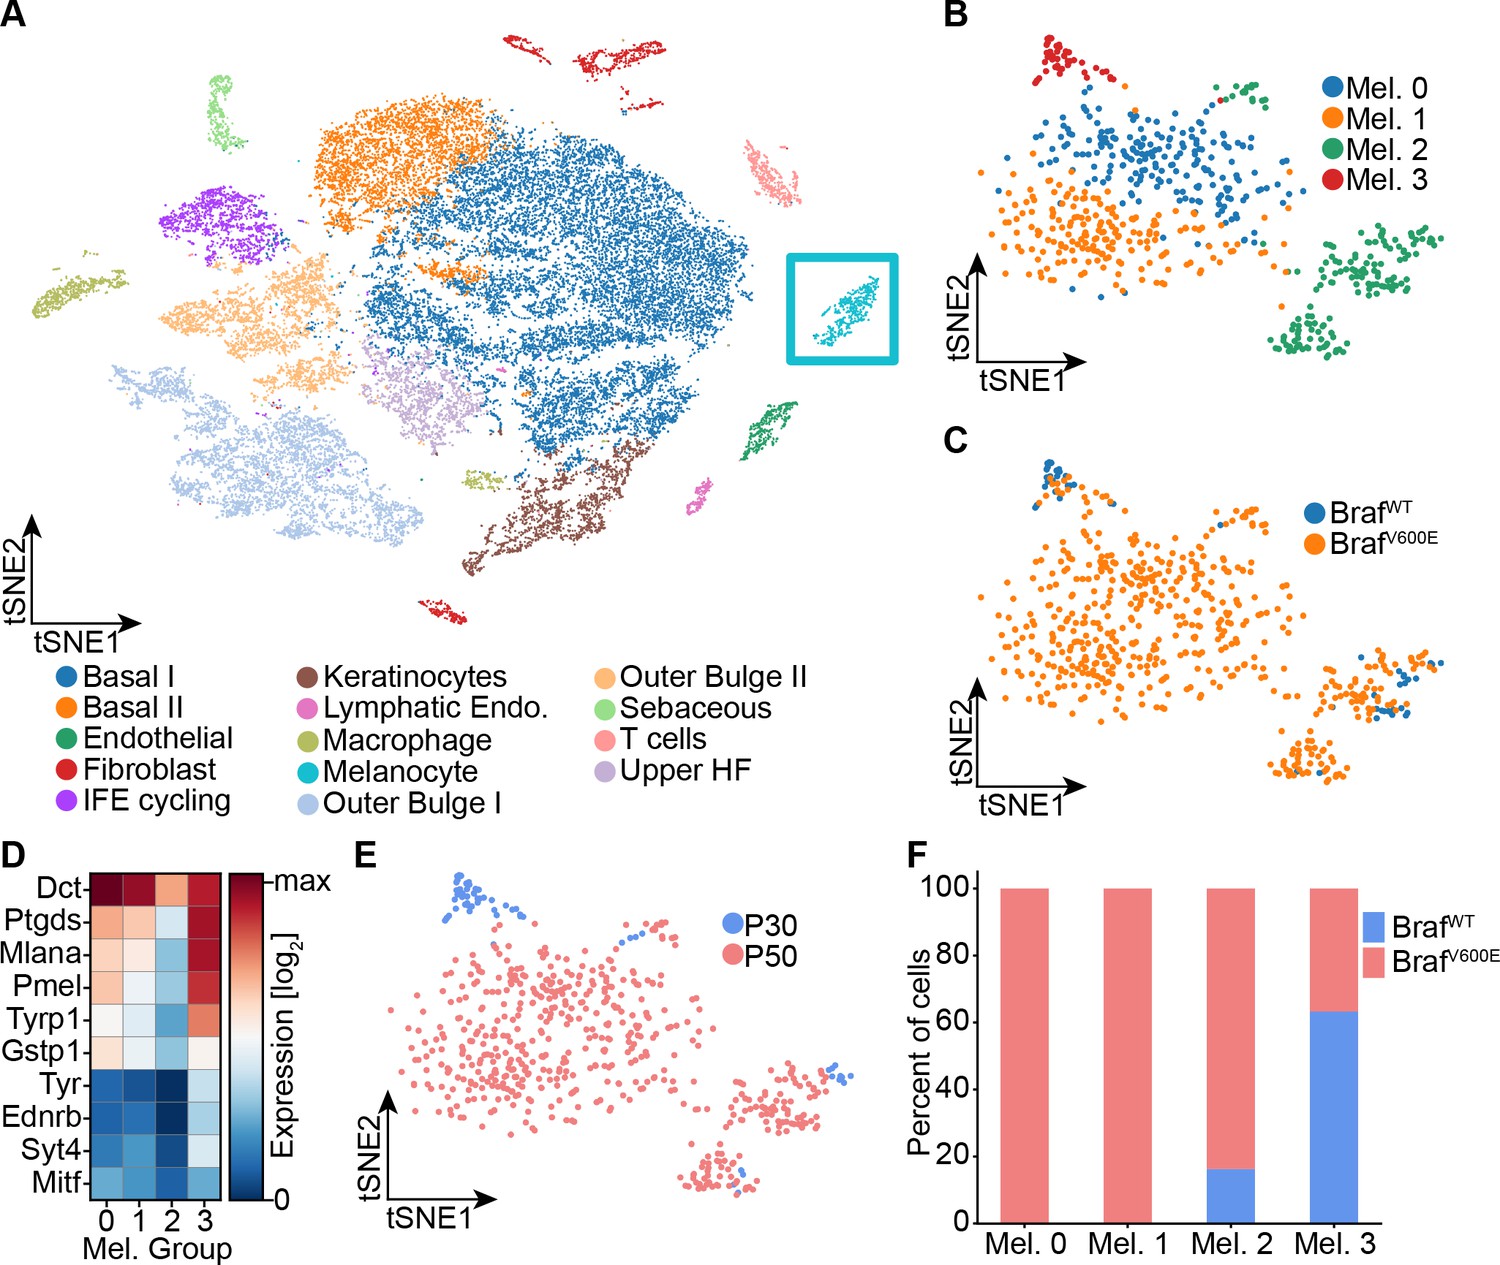
Single-cell RNA sequencing of mouse dorsal skin to transcriptionally characterize melanocytes.
(A) Skin cell types are visualized with tSNE (cells = 35,141) from mice at P30 (n[BrafWT]=2 mice, n[BrafV600E]=2 mice) and P50 (n[BrafWT]=3 mice, n[BrafV600E]=3 mice). Melanocytes are outlined with a blue box. (B) Subclustering of melanocytes (n = 609) visualized on a tSNE plot. Four clusters were identified. (C) Visualization of melanocytes based on their genotype on a tSNE plot. (D) A heat map of genes involved in pigmentation. Each cluster expresses these genes at different levels. (E) Visualization of melanocytes, based on mouse age, on a tSNE plot. (F) Quantification of melanocytes in each cluster based on their genotype (BRAF wildtype or mutant).
Figure 2—figure supplement 1
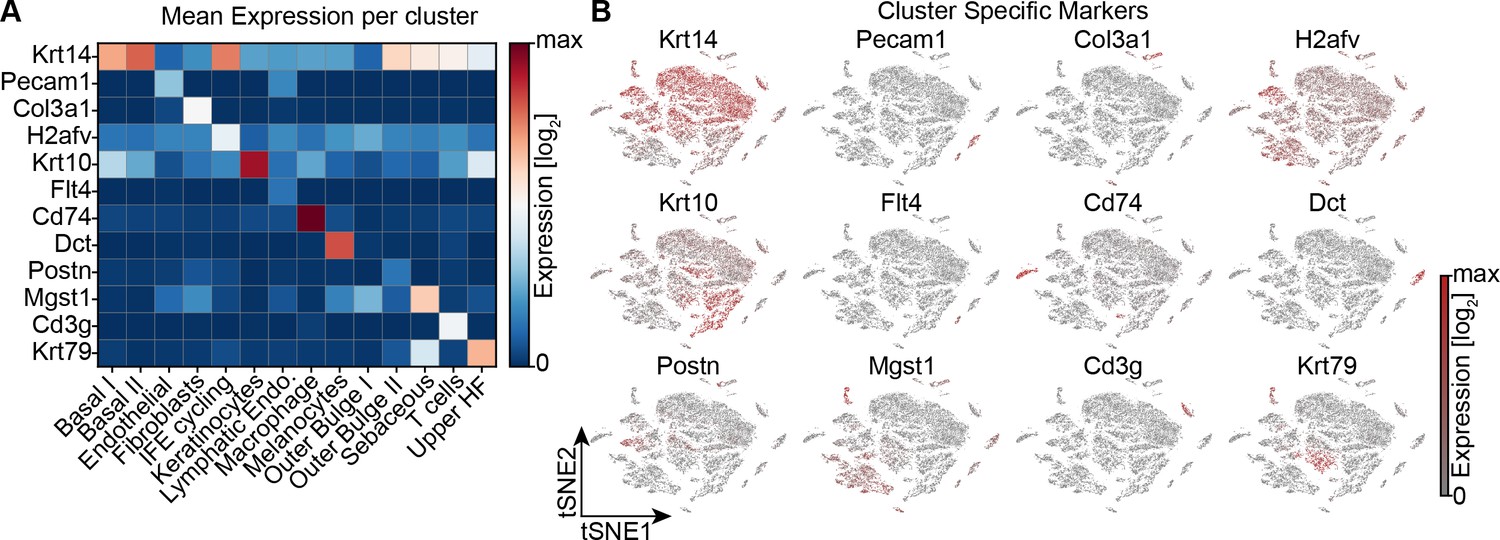
Single cell RNA sequencing of mouse dorsal skin, to transcriptionally characterize cells.
(A) Heat map depicting the average gene expression of canonical markers for known cell types found in the skin. (B) Using gene expression of the indicated genes to identify cell-type clusters.
Figure 3 with 3 supplements
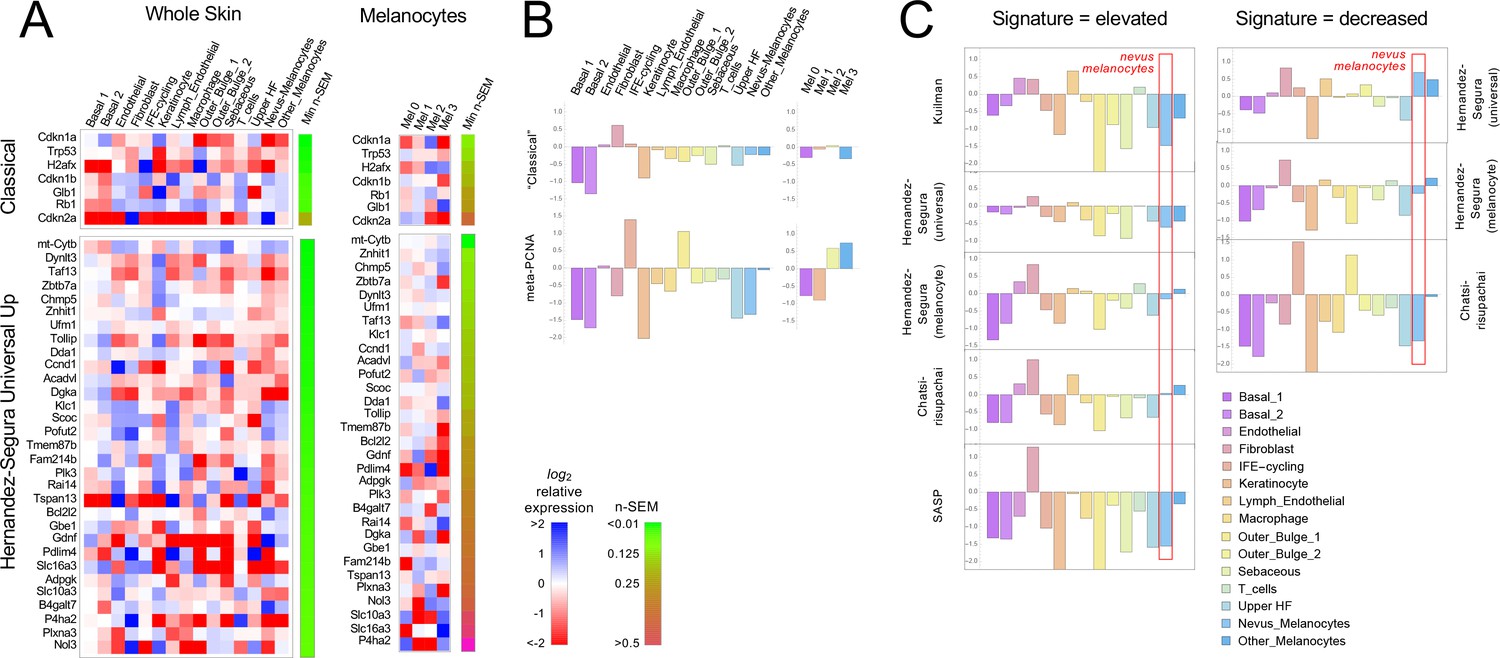
Gene expression fails to identify nevus melanocytes as senescent.
Transcriptomes of clusters identified in Figure 2 were compared with proposed ‘signatures’ of senescence.( A) Gene expression data for clusters in Figure 2A and B were averaged by cluster and, for each gene, expressed as a ratio to the average expression level of that gene in the entire skin sample (‘Whole Skin’) or just the melanocyte clusters (‘Melanocytes’). The heat map displays the logarithm of that ratio, with blue representing upregulation and red downregulation, relative to the appropriate average. Two proposed signatures for genes upregulated in senescence (‘Classical’ and ‘Universal Up’) are shown (For other signatures, see Figure 3—figure supplement 1). Gene lists have been sorted by the minimum gene expression variability within the least variable cluster (green-brown bar). (B). The ‘Classical’ heatmaps in panel A are summarized as a bar graph displaying the sum of the log-transformed data. Also shown are summary results for a proposed signature of proliferation, ‘meta-PCNA’, which clearly distinguishes between cell types expected to be proliferative and non-proliferative (in normal skin). The ‘Classical’ senescence signature fails to identify nevus melanocytes (Mel 0 and Mel 1) as senescent, especially when compared with other cell types or other melanocytes. (C). Extension of the analysis in panel B to eight additional signatures.
Figure 3—figure supplement 1
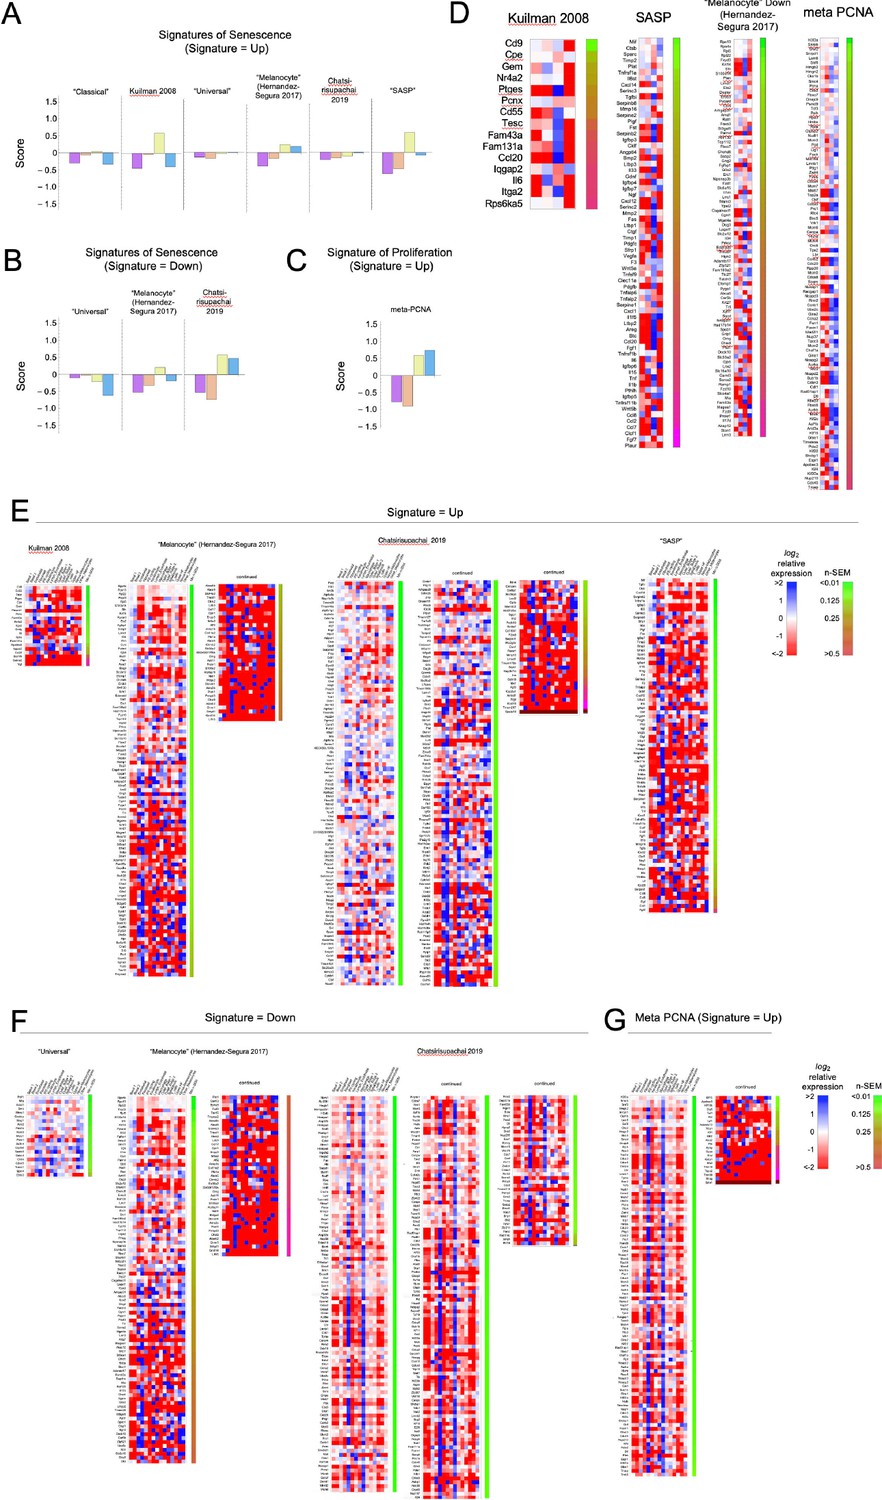
Heat maps for other signatures associated with senescence or proliferation.
The single-cell transcriptomes analyzed in Figure 3 were compared with each of the signatures in Source data 1. (A–D) Summary (A–C) and detailed (D) comparisons for the four melanocytes subclusters. (E–F). detailed comparisons of all skin subclusters to all signatures not shown in Figure 3.
Figure 3—figure supplement 2

Comparing proliferation-associated gene expression in cluster 3 (hair follicle) melanocytes from wildtype and Braf-mutant animals.
As shown in Figure 3 and Figure 3—figure supplement 1, Mel 3 melanocytes score higher for expression of proliferation genes (meta-PCNA signature) that those of clusters Mel 0 and Mel 1. Here, cluster Mel 3 was divided into wildtype and Braf-mutant subsets, and levels of meta-PCNA genes compared. The heat map is essentially the same as in panel D of Figure 3—figure supplement 1, except three genes not expressed in cluster Mel 3 were removed. As in Figure 3, genes have been sorted by minimum normalized standard error of the mean. Highest confidence assignments are at left, lowest at right. Bars show genes expression in wildtype (orange) and Braf-mutant (blue) cells (error bars are SEMs). No statistically significant differences are seen, although there is a slight trend toward lower expression in mutant (suggesting Braf activation might be associated with some inhibition of proliferation).
Figure 3—figure supplement 3
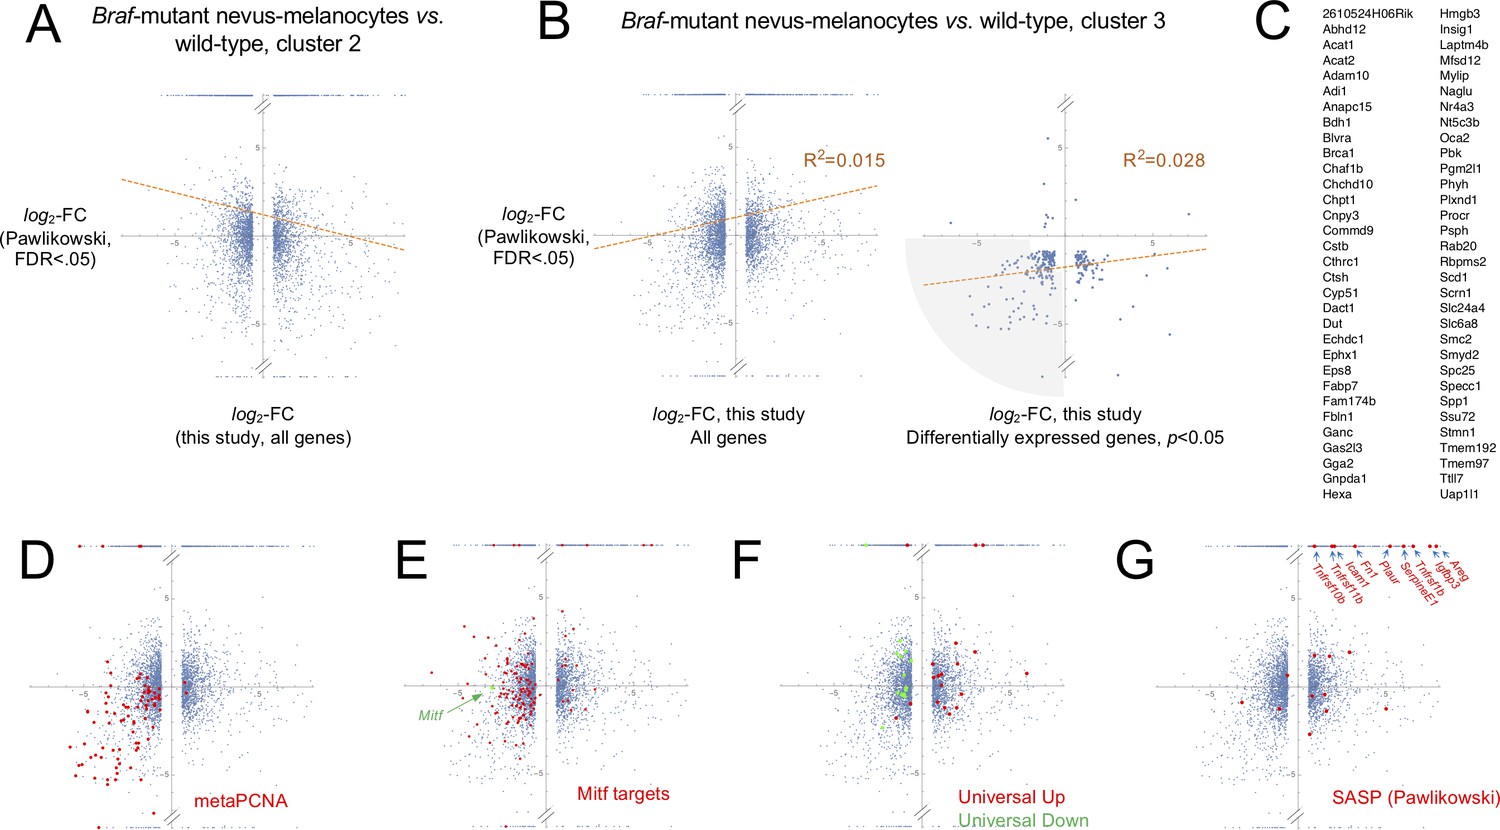
Comparing mouse nevus melanocyte gene expression with effects of BRAFV600E on cultured human melanocytes.
(A-B) In the scatter plots, values on the abscissa are gene expression fold-change data from microarray data of Pawlikowski et al., 2013, comparing gene expression in cultured BrafV600E-transduced human melanocytes with mock-transduced human melanocytes. Log-transformed fold-change data from probe sets mapping to the same gene were averaged, and genes without clear mouse orthologs were discarded. Values on the ordinate are from the present study, comparing gene expression in nevus melanocyte from BrafV600E-expressing skin (Mel 0 and 1) with non-nevus melanocytes of either Mel 2 (panel A, putative melanocyte stem cells) or Mel 3 (panel B, hair follicle melanocytes) from wild-type skin. Each dot represents a single gene; in the right-hand plot of panel B, only genes that were found to be significantly different (adjusted p-value<0.05) between nevus melanocytes and Mel 3 melanocytes are shown. Points at the very bottom or top of each plot represent genes that showed no detectable expression in either the nevus melanocytes, or the non-nevus melanocytes, respectively. Lines of best fit are shown, along with the coefficient of determination (R2). The small positive correlation in B is largely driven by points in the lower left quadrant. The shaded area in the right panel of B highlights 99 jointly-statistically significant genes that are substantially affected in this quadrant. (C) Sixteen of the genes associated with the shaded area in the right-hand panel of B are associated with cell proliferation (meta-PCNA signature; see Figure 3), while 19 are Mitf-target genes (as described by Hoek et al., 2008; Rambow et al., 2015; Tirosh et al., 2016). The remaining 64 are listed here. (D–G) All plots are based on the left-hand plot in panel B, colored to highlight particular sets of genes. Panel D shows genes belonging to the meta-PCNA signature; the data imply that nevus cells and cultured BRAF-transformed melanocytes are both growth-inhibited. Panel E highlights Mitf (green) and Mitf-target genes (red). The data imply that Mitf and its targets are nearly all downregulated in BRAFV600E-transduced cultured melanocytes, but not in nevus melanocytes (compared with hair follicle melanocytes); instead, Mitf expression is little-changed, and only a subset of Mitf target genes is downregulated (these include melanin synthesis and melanosome biogenesis genes Gpr143, Mlana, Pmel, Slc45a2, Tyr and Tyrp1). Panel F highlights genes ‘universally’ associated with senescence (Hernandez-Segura et al., 2017; see Figure 3). The data show that the senescent phenotype of the cultured BRAFV600E-melanocytes is well captured by this signature, whereas the phenotype of nevus melanocytes is not. Panel G highlights those genes considered by Pawlikowski et al., 2013 to be SASP-associated, most of which are upregulated in BRAFV600E-transduced cultured melanocytes. A subset of these appears upregulated in nevus melanocytes (arrows), although the very high fold-change values of those genes marked by arrows simply reflect the fact that transcripts for these genes were not detected in hair follicle melanocytes.
-
Figure 3—figure supplement 3—source data 1
Data are derived from Table S1 of Pawlikowski et al., 2013, and relate to Figure 3—figure supplement 3.
The data were first converted from Affymetrix probe set IDs to current gene symbols using DAVID (https://david.ncifcrf.gov/). Fold-change data were log2-transformed. When multiple probesets mapped to the same gene, log2-fold changes were averaged, and the lowest FDR value was retained. Human gene symbols were then converted to mouse ortholog symbols (using https://www.genenames.org/ and http://www.informatics.jax.org) wherever unambiguous assignments could be made. ‘BH FDR’=Benjamini Hochberg false discovery rate.
- https://cdn.elifesciences.org/articles/61026/elife-61026-fig3-figsupp3-data1-v1.xlsx
Figure 4 with 1 supplement
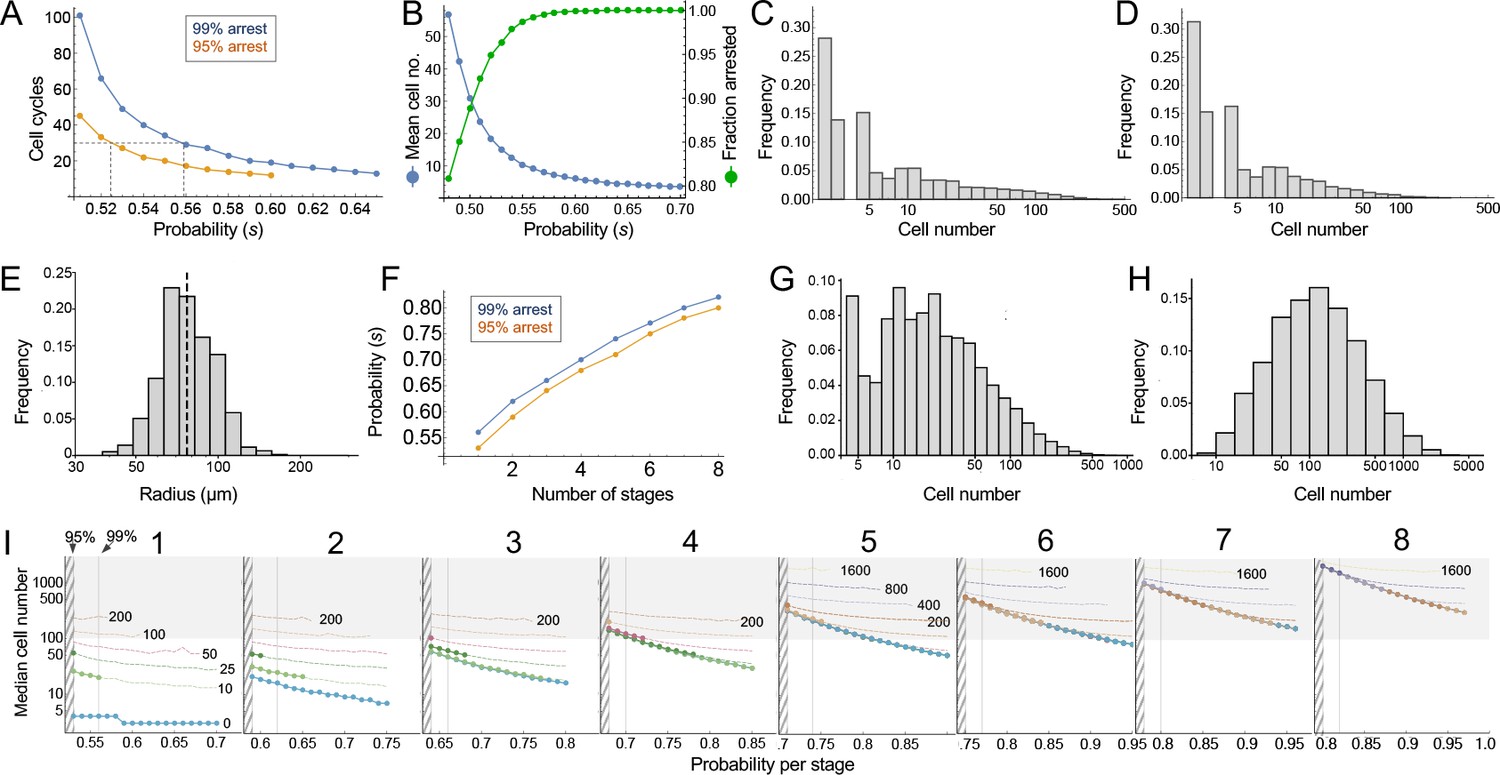
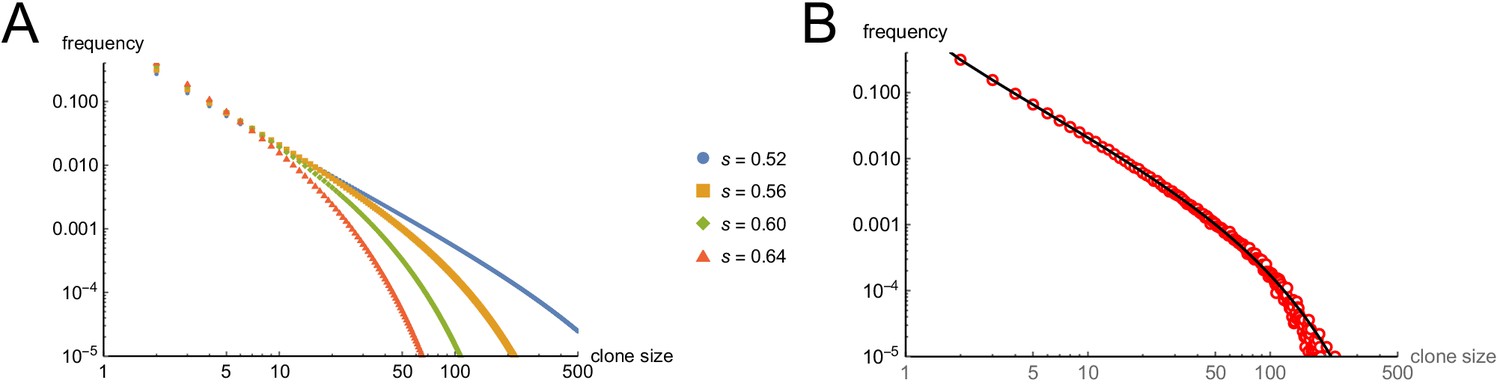
Modeling cell-autonomous clonal arrest as a probabilistic process.
(A-D) Monte Carlo simulations were carried out in which a single-cell replicates and arrests with fixed probability, s, per cell cycle. (A) Cell cycles required before proliferation stops in 95% or 99% of simulations. (B) Mean cells at 30 cell cycles, and fraction of clones expected to have arrested by then. (C–D) Clone (nevus) size distributions, after 30 cell cycles, assuming s = 0.56 (C), the probability required for 99% arrest, or 0.53 (D), the probability required for 95% arrest (see panel A). (E) Actual mouse nevus sizes at P21 (mice = 3, nevi = 768). Dashed line shows median radius, 76.8 µm. (F–I) Simulations in which proliferating cells arrest after multiple events (stages). (F) The value of s required to ensure arrest within 30 cell cycles, as a function of number of stages. (G–H) Clone size distributions for two (G), or three (H) stages, assuming the lowest per-stage transition probability compatible with 99% arrest by 30 cell cycles (see panel C). (I) Median clone size for different numbers of stages (labeled above each graph), transition probabilities per stage (plotted on the abscissa), and thresholds below which clones are excluded from analysis. Each curve represents a different exclusion threshold (between 0 and 200 cells for 1–4 stages, and up to 1600 cells for 5–8 stages, as labeled). Curves change from solid to dashed where the observability threshold becomes inconsistent with the observations in panel E (in panel E the median nevus has >3 times the area of the smallest observable nevi; in panel I the curves become dashed when median cell number is less than twice the observability threshold). Within the hatched region, fewer than 95% of clones arrest by 30 cell cycles. The thin line to right of the hatched region marks the probability at which 99% of clones arrest by 30 cell cycles. Solid gray demarcates median cell numbers between 100 and 3000 (see text). All results are from a minimum of 20,000 simulations.
-
Figure 4—source data 1
Raw data used to generate histogram in Figure 4E.
- https://cdn.elifesciences.org/articles/61026/elife-61026-fig4-data1-v1.xlsx
Figure 4—figure supplement 1
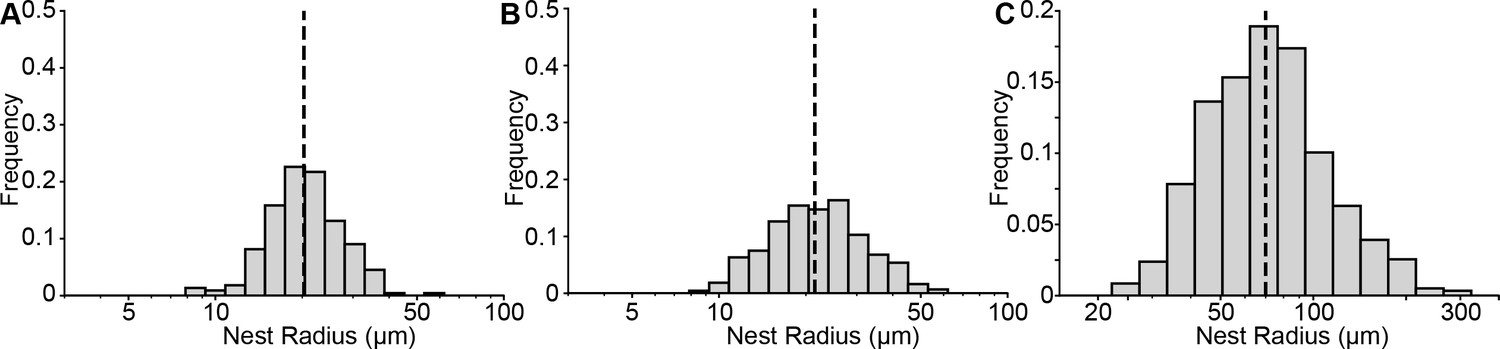
Size distribution of mouse and human nests.
(A-B) Quantification of nest radii from mice treated with 75 mg/mL of tamoxifen at (A) P21 (mice = 10, nests = 221) or (B) P50 (mice = 18 mice, nests = 428). The black dashed line represents the medians of 20.2 and 21.4 µm, respectively. (C) Quantification of human nests. The black dashed line represents the median radius of 70 µm.
-
Figure 4—figure supplement 1—source data 1
Raw data used to generate histograms in Figure 4—figure supplement 1.
- https://cdn.elifesciences.org/articles/61026/elife-61026-fig4-figsupp1-data1-v1.xlsx
Figure 5 with 1 supplement

Models and evidence for cooperative, feedback-mediated arrest.
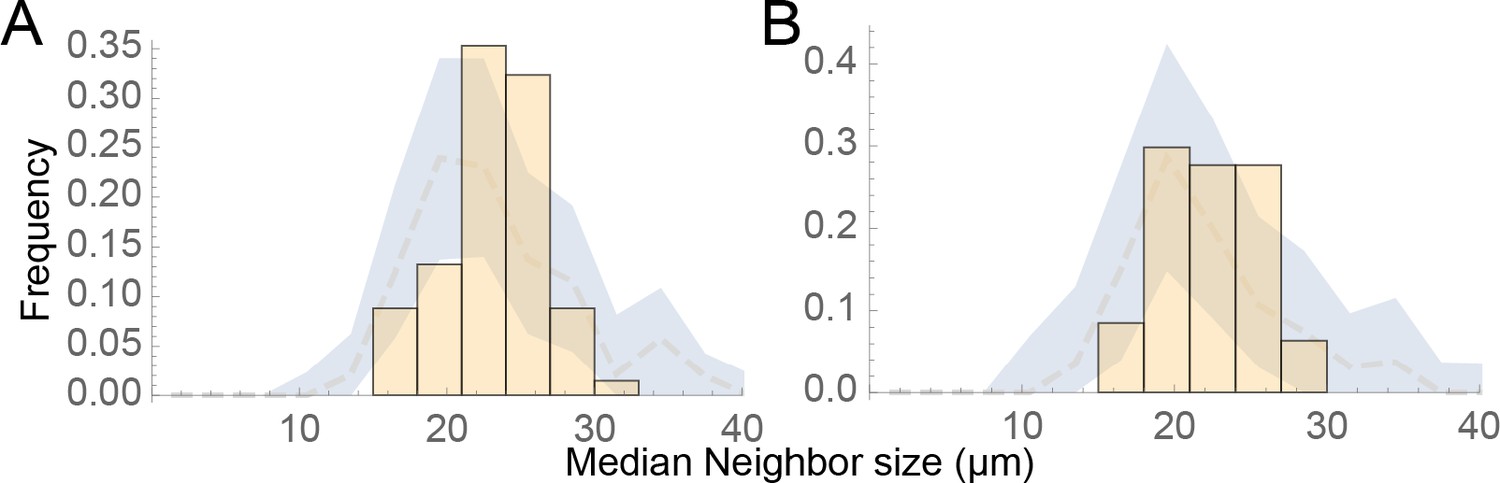
(A) A generic integral negative feedback scheme. ‘Renewal probability’, p, is the probability that offspring of cell division remain dividing (i.e. 1−p is the probability that they arrest). (B) Clone sizes generated by 9115 stochastic simulations of scheme A, modeled as an ordinary differential equation, where p falls with the number of arrested cells according to a Hill function with half-maximal effect at 50 arrested cells. (C–D) Results from a spatial (agent-based) simulation of scheme A, in which the signal from arrested cells spreads by diffusion. Histogram (C) tabulates clone sizes produced by 100 independent simulations (the histograms in both B and C are logarithmically-scaled to show that the data are well fit by log-normal distributions). Panels (D) are from a single simulation, showing locations of growing and arresting cells, and the gradient of the diffusible signal. Bar = 50 µm. The average cell cycle is equivalent to approximately 382 Monte Carlo time steps. (E–F) Using spatial coordinates and areas of 122 nests in seven individual fields at P21, nests were modeled as disks of equivalent area, and mean sizes of neighboring nests falling within successively larger annuli around each target nest were determined. Distributions of mean neighbor sizes up to 45 µm away from (E) large (radius >20 µm) and (F) small (radius <20 µm) nests (histograms) are compared with a ‘null distribution’ derived by random permutation (blue fields). Arrows show deviations in neighbor size distribution greater than expected at random, and substantially different for large versus small nests.
-
Figure 5—source data 1
Raw data used to generate histograms and permutation tests in Figure 5E–F.
Data are from nests visualized by MPM at postnatal day 21. Analysis was restricted to fields with at least 10 nests.
- https://cdn.elifesciences.org/articles/61026/elife-61026-fig5-data1-v1.xlsx
Figure 5—figure supplement 1
Evidence for influence of nevi on each other’s sizes is minimal at long range.
(A–B) The same nest size and location data were analyzed as in Figure 5E–F, except that distributions of mean neighbor sizes up to 150 μm away from (A) large (radius >20 μm) and (B) small (radius <20 μm) nests (histograms) were included. As in Figure 5E–F, observed distributions are compared with a ‘null distribution’ derived by random permutation (blue fields).
Figure 6
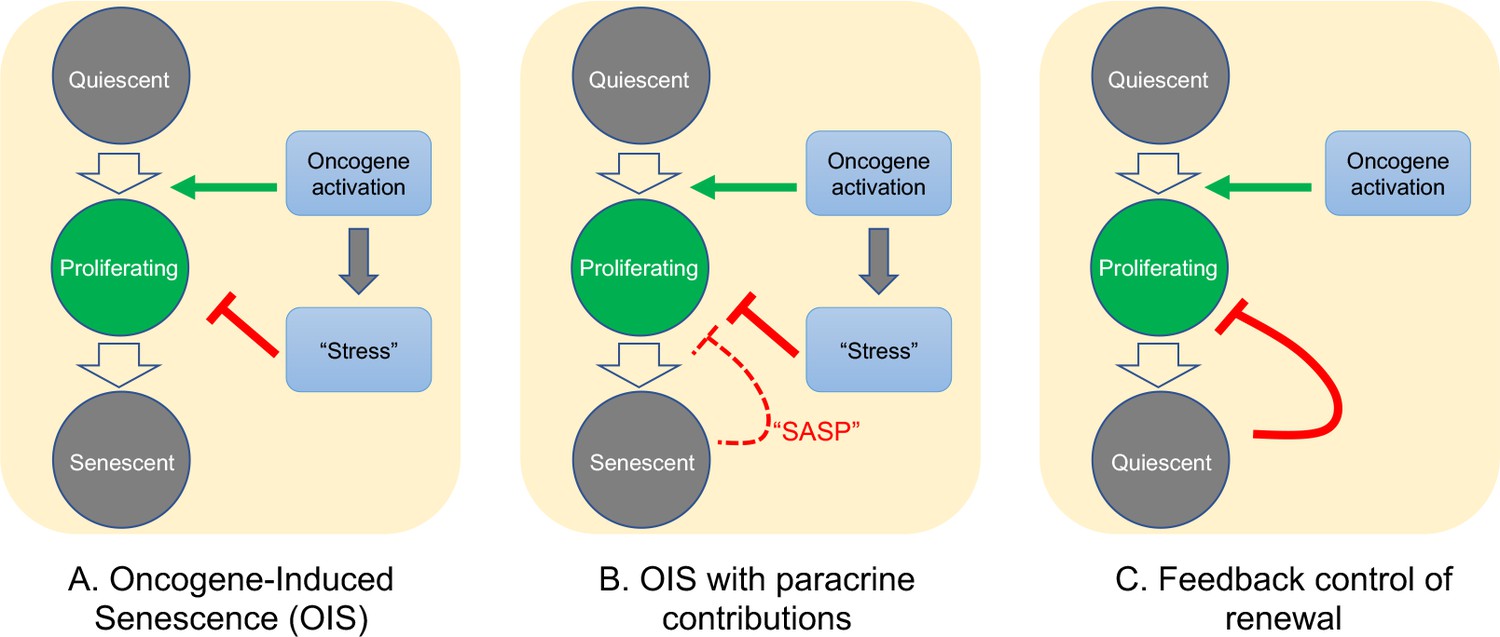
Possible mechanisms of growth arrest.
Three different models of nevus growth arrest are presented, varying from classical OIS (A) to feedback control of proliferative cell renewal (C). The model in the middle panel (B) illustrates a hypothetical hybrid situation, in which paracrine effects of senescence-associated secreted proteins (SASP) act as inhibitors of melanocyte self-renewal. Although model B can mimic some of the dynamic behaviors of model C, in the absence of convincing evidence that nevus melanocytes actually are senescent, we favor model C.
Appendix 1—figure 1
Predicting clone sizes at the time of clonal extinction.
(A) Analytical results, under assumptions of different values for the cell-autonomous arrest probability s. (B). A comparison of the analytical results for s = 0.56 with the outcomes of 500,000 Monte Carlo simulations.
Tables
Key resources table
| Reagent type (species) or resource | Designation | Source or reference | Identifiers | Additional information |
|---|---|---|---|---|
| Gene (Mus musculus) | Braf | Mouse Genome Informatics (MGI) | MGI:88190 | |
| Gene (M. musculus) | Tyr::CreER | MGI | MGI:3641203 | MGI Transgene name: GeneTg(Tyr-cre/ERT2)13Bos |
| Genetic reagent (M. musculus) | B6.Cg-Tg(Tyr-cre/ERT2)13Bos Braftm1Mmcm /BosJ | Dankort et al., 2009 | RRID:MGI:5902125 | |
| Antibody | Anti-Pmel (rabbit monoclonal) | Abcam | Cat#ab137078 RRID:AB_2732921 | Also known as anti-melanoma gp100 IF (1:500) |
| Antibody | Anti-BrdU (rat monoclonal) | Abcam | Cat#ab6326 RRID:AB_305426 | IF (1:500) |
| Antibody | Goat anti-rabbit alexa fluor 594 conjugated (polyclonal) | ThermoFisher Scientific | Cat#A-11012 RRID:AB_2534079 | (1:2000) |
| Antibody | Chicken anti-rat alexa fluor 488 (polyclonal) | ThermoFisher Scientific | Cat#A-21470 RRIB:AB_2535873 | (1:2000) |
| Sequence-based reagent | Braf_F | IDT | PCR primer | 5’-TGAGTATTTTTGTGGCAACTGC −3’ |
| Sequence-based reagent | Braf_R | IDT | PCR primer | 5’-CTCTGCTGGGAAAGCGCC −3’ |
| Sequence-based reagent | Cre_F | IDT | PCR primer | 5’- GGTGTCCAATTTACTGACCGTACA-3’ |
| Sequence-based reagent | Cre_R | IDT | PCR primer | 5’- CGGATCCGCCGCATAACCAGTG −3’ |
| Chemical compound, drug | 4-hydroxytamoxifen | Sigma-Aldrich | Cat#68047-06-3 | |
| Chemical compound, drug | TrueBlack lipofuscin | Biotium | Cat#23007 | |
| Software, algorithm | Mathematica | Wolfram | RRID:SCR_014448 | |
| Software, algorithm | Scanpy | Wolf et al., 2018 | RRID:SCR_018139 | |
| Software, algorithm | Cell Ranger | 10X genomics | RRID:SCR_017344 | |
| Software, algorithm | CompuCell3D | Swat et al., 2012 | RRID:SCR_003052 |
Additional files
-
Source data 1
Gene lists and literature references for gene expression signatures.
- https://cdn.elifesciences.org/articles/61026/elife-61026-data1-v1.xlsx
-
Source data 2
Parameters values used in CompuCell3D modeling.
- https://cdn.elifesciences.org/articles/61026/elife-61026-data2-v1.xlsx
-
Transparent reporting form
- https://cdn.elifesciences.org/articles/61026/elife-61026-transrepform-v1.docx
Download links
A two-part list of links to download the article, or parts of the article, in various formats.
Downloads (link to download the article as PDF)
Open citations (links to open the citations from this article in various online reference manager services)
Cite this article (links to download the citations from this article in formats compatible with various reference manager tools)
Dynamics of nevus development implicate cell cooperation in the growth arrest of transformed melanocytes
eLife 9:e61026.
https://doi.org/10.7554/eLife.61026


