Development and characterization of a chronic implant mouse model for vagus nerve stimulation
- Institute of Bioelectronic Medicine, The Feinstein Institutes for Medical Research, Northwell Health, United States
- Departments of Neurosurgery, University of Colorado Anschutz Medical Campus, United States
- Department of Physiology and Biophysics, University of Colorado Anschutz Medical Campus, United States
- The Elmezzi Graduate School of Molecular Medicine, United States
- Skirball Institute for Biomolecular Medicine, New York University School of Medicine, New York University, United States
- Department of Neuroscience and Physiology, Neuroscience Institute, Center for Neural Science, New York University School of Medicine, New York University, United States
- Department of Otolaryngology, New York University School of Medicine, New York University, United States
- Howard Hughes Medical Institute Faculty Scholar, New York University School of Medicine, New York University, United States
- Institute of Molecular Medicine, The Feinstein Institutes for Medical Research, Northwell Health, United States
Figures
Figure 1
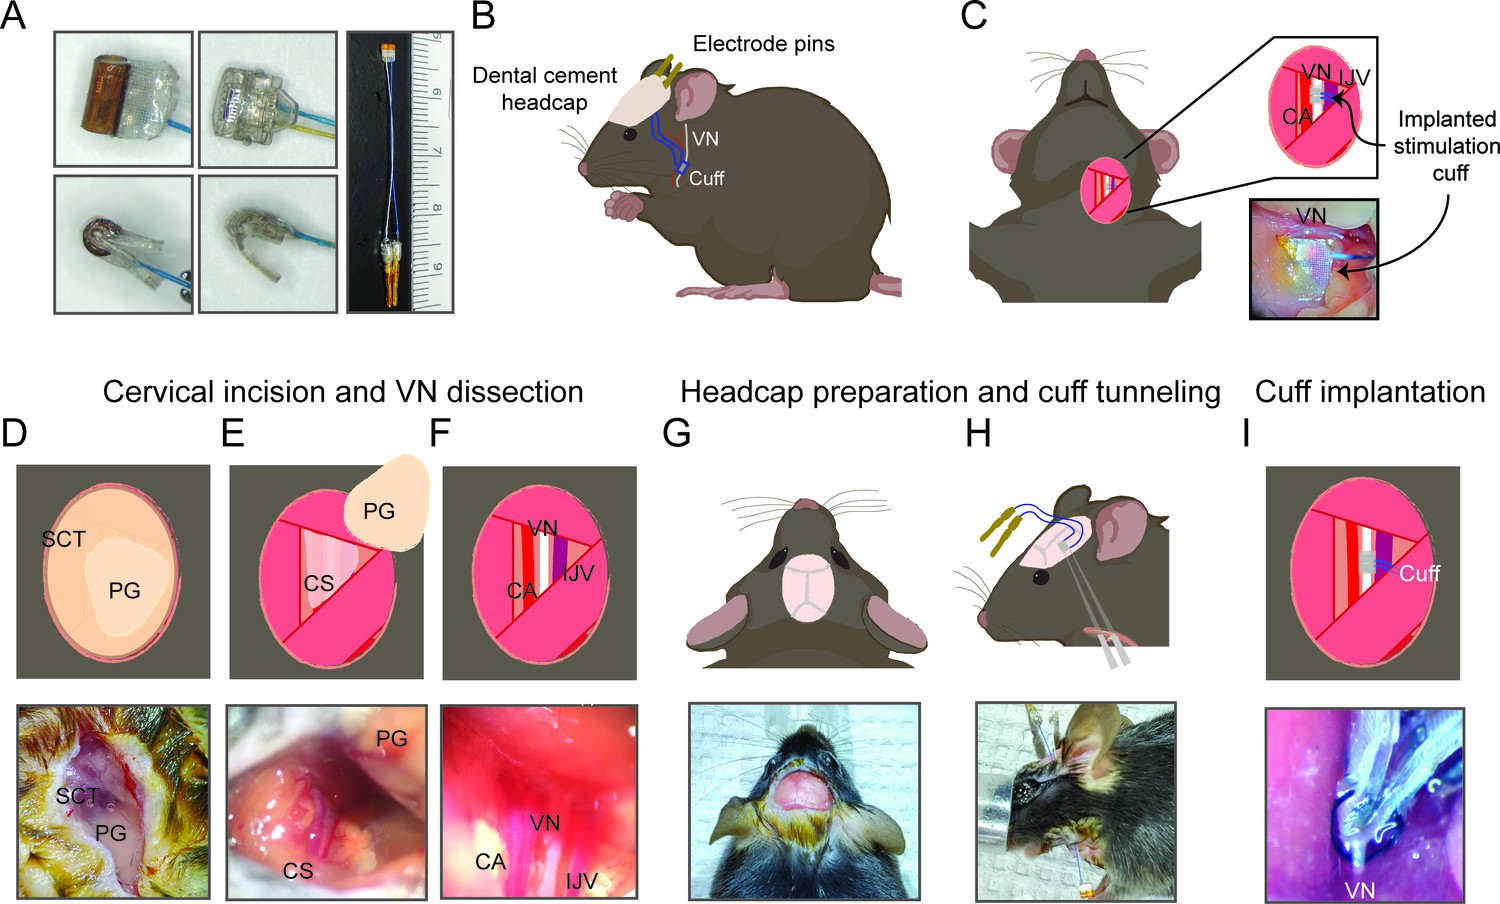
Surgical procedure for long-term implantation.
(A) Lead wires of cuff electrodes produced by MicroLeads or CorTec are cut to a length of 2.5–3.0 cm and soldered to gold pins (right panel, MicroLeads). Front-facing (upper panels) and side (lower panels) view of 150 μm MicroLeads and 100 μm CorTec cuff electrodes. (B, C) Overview of implant, headcap with pins and location of the vagus nerve (VN) cuff. The cuff is implanted on the left cervical VN. (D) A 1 cm ventral incision is made about 0.5 cm lateral to the sternal notch, exposing subcutaneous tissue (SCT) and the parotid gland (PG). (E) SCT is bluntly dissected freeing the PG, which is then retracted from view exposing the carotid sheath (CS). (F) The VN is bluntly dissected away from the carotid artery (CA) and the internal jugular vein (IJV). (G) The scalp is incised to expose lambda and bregma. (H) A subcutaneous tunnel is created from skull base to cervical incision site, either between the eye and ear (depicted) or directly caudal to the ear. (I) The cuff is tunneled under the sternomastoid muscle and implanted on the VN. Pins are finally secured to the skull with dental cement. Created with BioRender.com.
Figure 2 with 1 supplement
Dose-dependent physiological responses to vagus nerve stimulation (VNS).
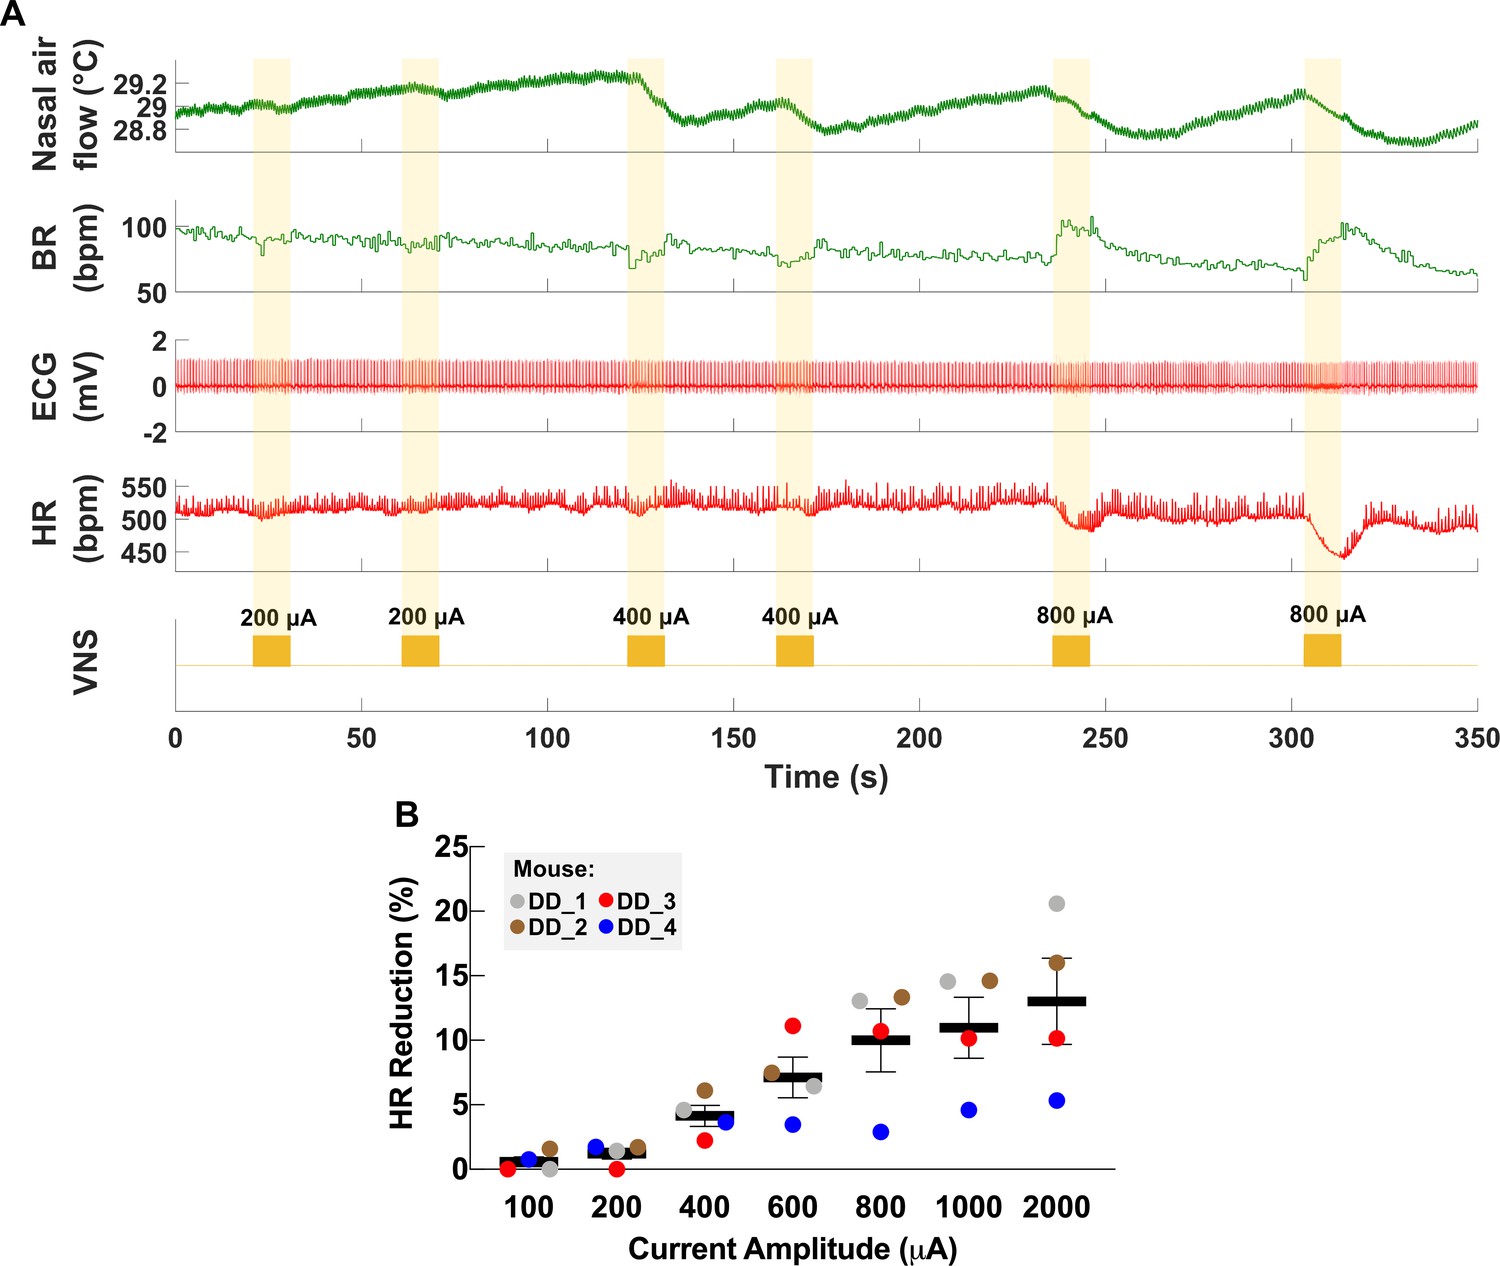
(A) Representative traces from a chronically implanted mouse showing nasal air flow (top panel) and extracted breathing rate (BR, second panel), and ECG (third panel) and extracted heart rate (HR, fourth panel). Trains of VNS of increasing intensity from 200 to 800 μA (fifth panel, yellow traces) cause BR and HR responses with increasing magnitudes. (B) Percentage of HR reduction as a function of VNS intensity in four chronically implanted mice (parameters: short pulse width, frequency 30 Hz, duration 5 s).
-
Figure 2—source data 1
Source data file (.xlsx) containing heart rate (HR) measurements at baseline and during vagus nerve stimulation (VNS) at different intensities used to create Figure 2B.
- https://cdn.elifesciences.org/articles/61270/elife-61270-fig2-data1-v2.xlsx
Figure 2—figure supplement 1

Vagus nerve stimulation (VNS) in a conscious mouse.
Figure 3 with 1 supplement
Longitudinal changes in heart rate threshold (HRT) and electrode impedance of long-term implants.
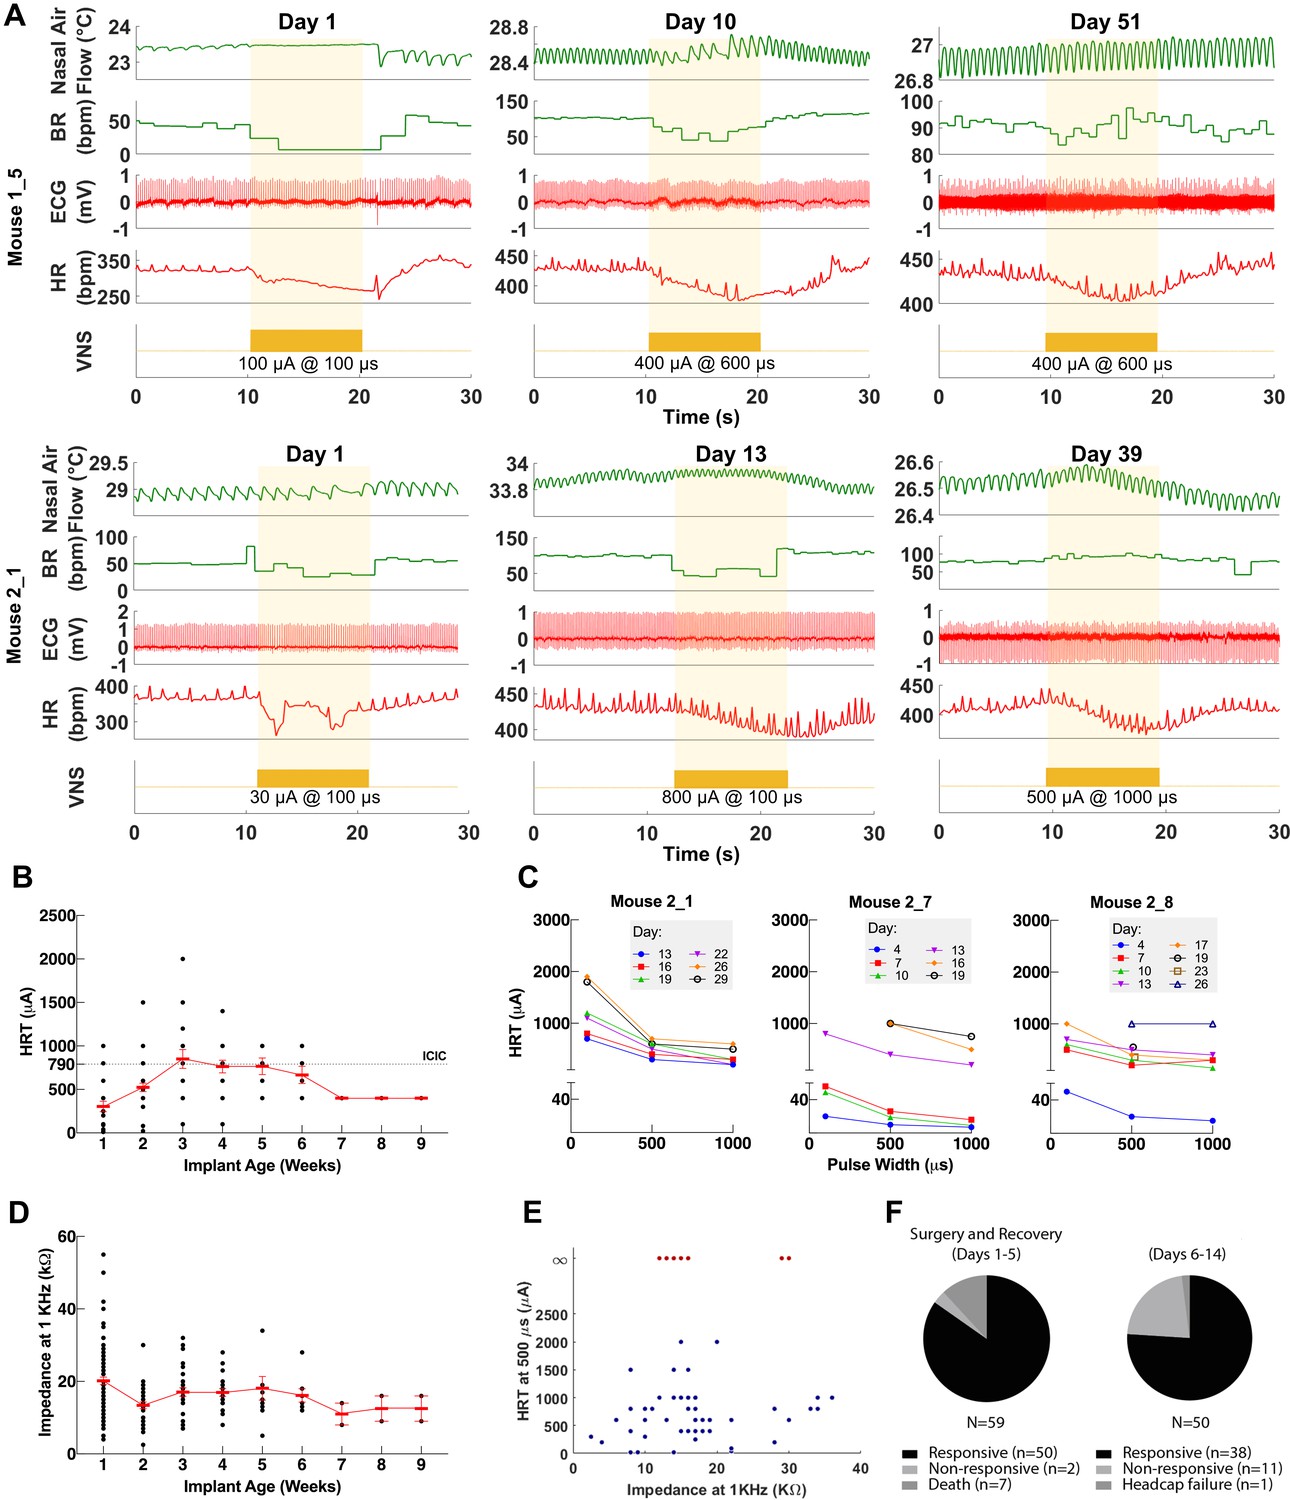
(A) Examples of physiological responses to vagus nerve stimulation (VNS) in two mice, showing changes in breathing rate (BR; green trace) and heart rate (HR; red trace) elicited by a train of VNS with HRT intensity, as determined on that day of testing (yellow trace, with stimulus parameters shown). HRT is defined as the stimulation intensity required to produce an ~5–15% decrease in HR. (B) HRT values vs. implant age (n = 26 mice), where multiple measurements were grouped together under the corresponding week. Horizontal gray dotted line indicates intensity corresponding to maximum charge injection capacity (ICIC) with 600 μs pulse width (PW), as calculated for these electrodes. (C) HRT values determined with VNS trains of 0.1, 0.5, and 1 ms-wide pulses at different implant ages in three mice. (D) Electrical impedance measured at different implant ages (n = 29 mice). (E) HRT values plotted against electrode impedance from individual measurements performed during a 40-day period post-implant. ‘Infinity’ HRT values (data points in red) indicate implants that did not produce a HR response up to 2 mA at 2 ms PW. Pearson correlation was 0.05 (p NS). (F) Surgical success rates for one of the tested cohorts of animals.
-
Figure 3—source data 1
Source data file (.xlsx) containing pre-implantation and longitudinal impedance and heart rate threshold (HRT) values from cohorts 1–3.
- https://cdn.elifesciences.org/articles/61270/elife-61270-fig3-data1-v2.xlsx
Figure 3—figure supplement 1
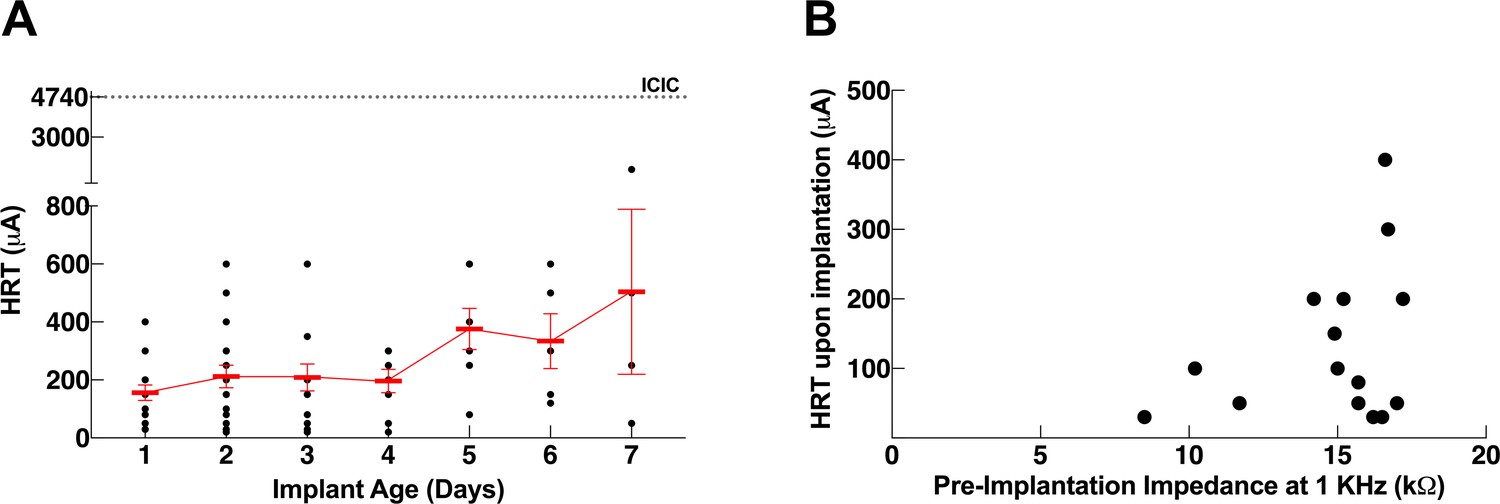
Dependence of heart rate threshold (HRT) on electrode impedance and implant age.
(A) Heart rate threshold (HRT) values during the first week post-implantation (n = 20 mice) determined with short pulse width. (B) HRT values on the first day post-implantation plotted against pre-implantation impedance measured ex vivo (n = 15 mice).
Figure 4 with 1 supplement
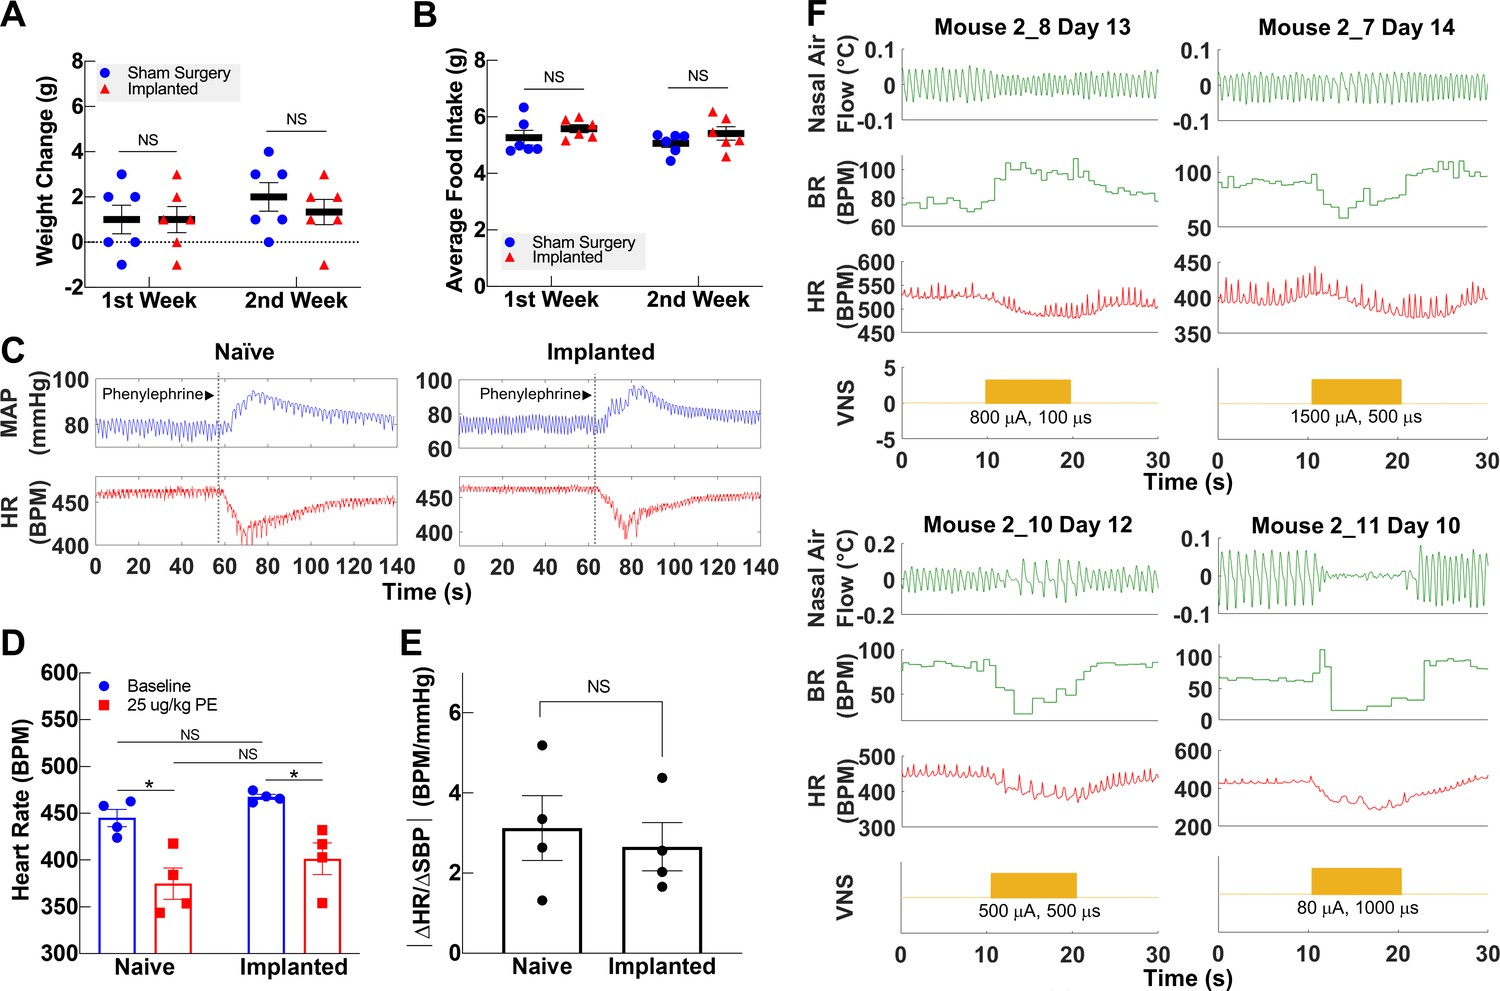
Vagally mediated reflexes in animals with long-term implants.
(A) Weight change at first and second week post-surgery in mice subjected to sham surgery (n = 6) and in implanted mice (n = 6). (B) Average food intake during the first and second week post-surgery in sham surgery and in implanted mice (n = 6 in each group). (C) Example of baroreflex-mediated changes in heart rate (HR) in response to phenylephrine (PE)-elicited increase in blood pressure in a naive animal (left) and in an animal with a long-term implant (right). Traces showing mean arterial blood pressure (MAP; green trace) and HR (red trace); vertical line indicates time of PE injection. (D) HR in naive and implanted animals before and after PE injection. (E) Baroreflex sensitivity index in naive and implanted animals (n = 4 in each group). Index is calculated as the absolute value of the change in HR (ΔHR) over the change in systolic blood pressure (ΔSBP), before and after PE injection. (F) Examples of HR (red trace) and BR (green trace) changes in four mice with long-term implants showing responses to vagus nerve stimulation (VNS); BR responses include rapid, shallow breathing (upper left), and slowing down (upper right, lower left), or cessation of breathing (lower right) during VNS. Data is presented as mean ± SEM; NS = not significant, *p<0.05 by Student’s t-test with Bonferroni correction for multiple comparisons.
-
Figure 4—source data 1
Source data (.xlsx) file containing heart rate and blood pressure changes after phenylephrine injection used to calculate baroreflex sensitivity index.
- https://cdn.elifesciences.org/articles/61270/elife-61270-fig4-data1-v2.xlsx
Figure 4—figure supplement 1
Examples of intact vagal reflexes in animals with chronic implants.
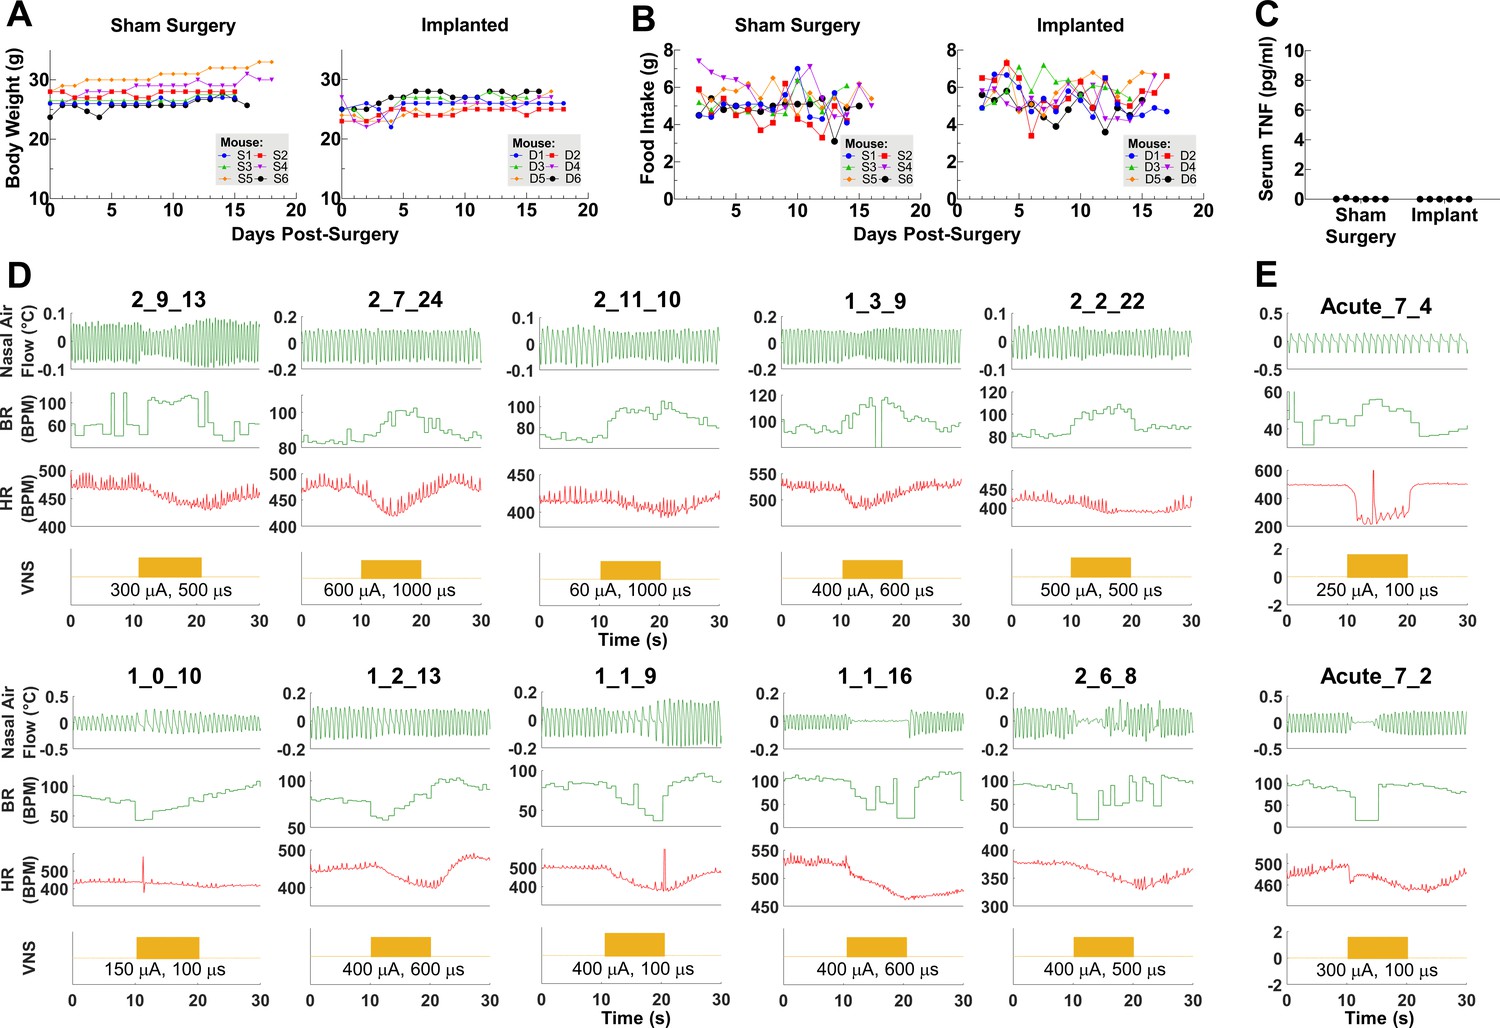
(A) Daily body weights in animals after sham surgery and long-term implantation (n = 6 in each group).
(B) Daily food intake in the two groups of animals. (C) Serum TNF levels at 16–19 days post-implantation in the two groups of animals. (D) Physiological traces from nine different mice showing various breathing responses to vagus nerve stimulation (VNS) at different implant ages and (E) during acute VNS in two naive mice.
Figure 5
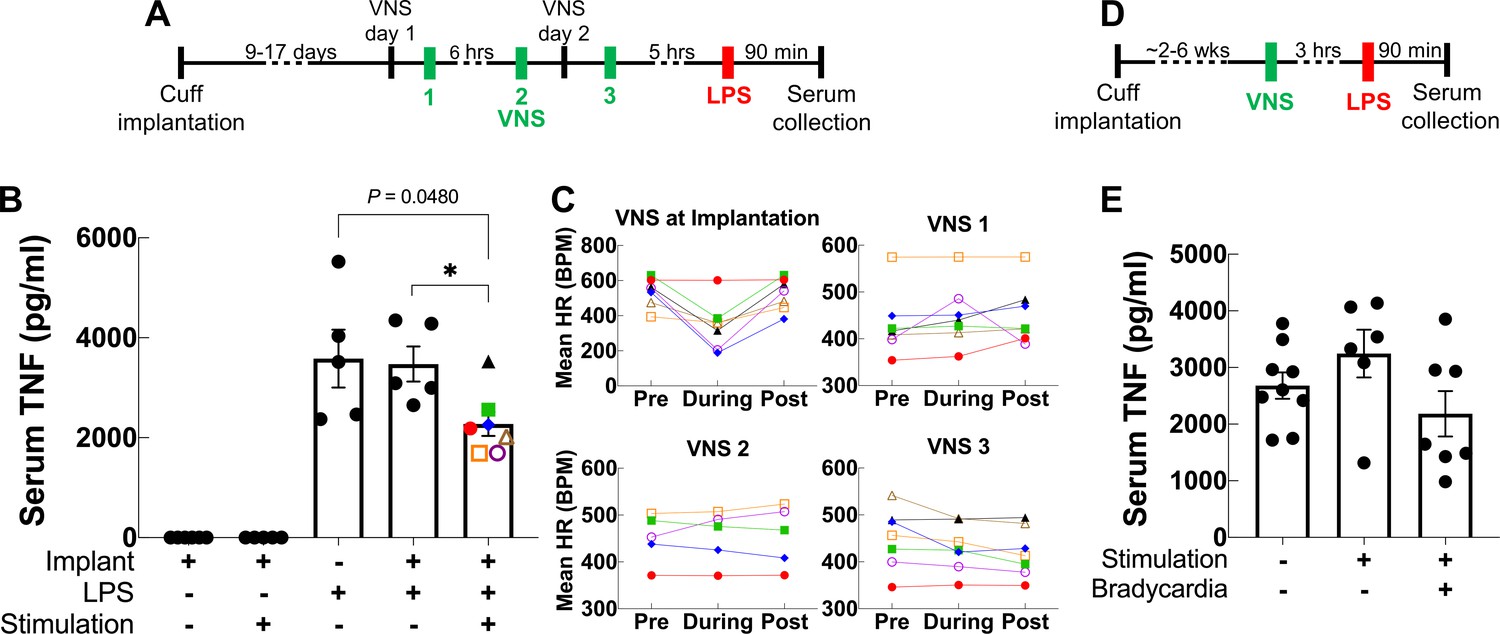
Vagus nerve stimulation (VNS) using the long-term implant inhibits TNF release in endotoxemia.
(A) Mice with 9- to 17-day-old implants received three doses of VNS over 2 days using previously reported parameters (intensity 1 mA, pulse width [PW] 250 μs, frequency 30 Hz). Lipopolysaccharide (LPS) was administered 5 hr after the last VNS dose, and blood was collected 90 min post-LPS injection. (B) Serum TNF levels from implanted mice that received no LPS (saline) with sham or VNS (first and second bars), sham surgery mice that received LPS (third bar), and implanted mice that received LPS with sham or VNS (fourth and fifth bars). Data shown as mean ± SEM. *p = 0.0177, by Mann–Whitney with Bonferroni correction for multiple comparisons. (C) Mean heart rate (HR) before, during, and after each stimulation event for endotoxemic mice that received VNS. Each line corresponds to a subject with matching shape and color in fifth bar in (B). (D) In a separate experiment, mice with 2- to 6-week-old implants (n = 22) received a single dose of VNS, or sham VNS, for 5 min (intensity at heart rate threshold [HRT], PW 250 μs, frequency 10 Hz). LPS was administered 3 hr after VNS and blood was collected 90 min post-LPS injection. (E) Serum TNF levels from mice that received sham stimulation (left bar), mice that received VNS without a HR response (middle bar), and mice that received VNS that elicited a HR response (right bar). Data shown as mean ± SEM. p NS (VNS with bradycardia vs. sham, and VNS with vs. without bradycardia) by Mann–Whitney with Bonferroni correction for multiple comparisons.
Figure 6 with 1 supplement
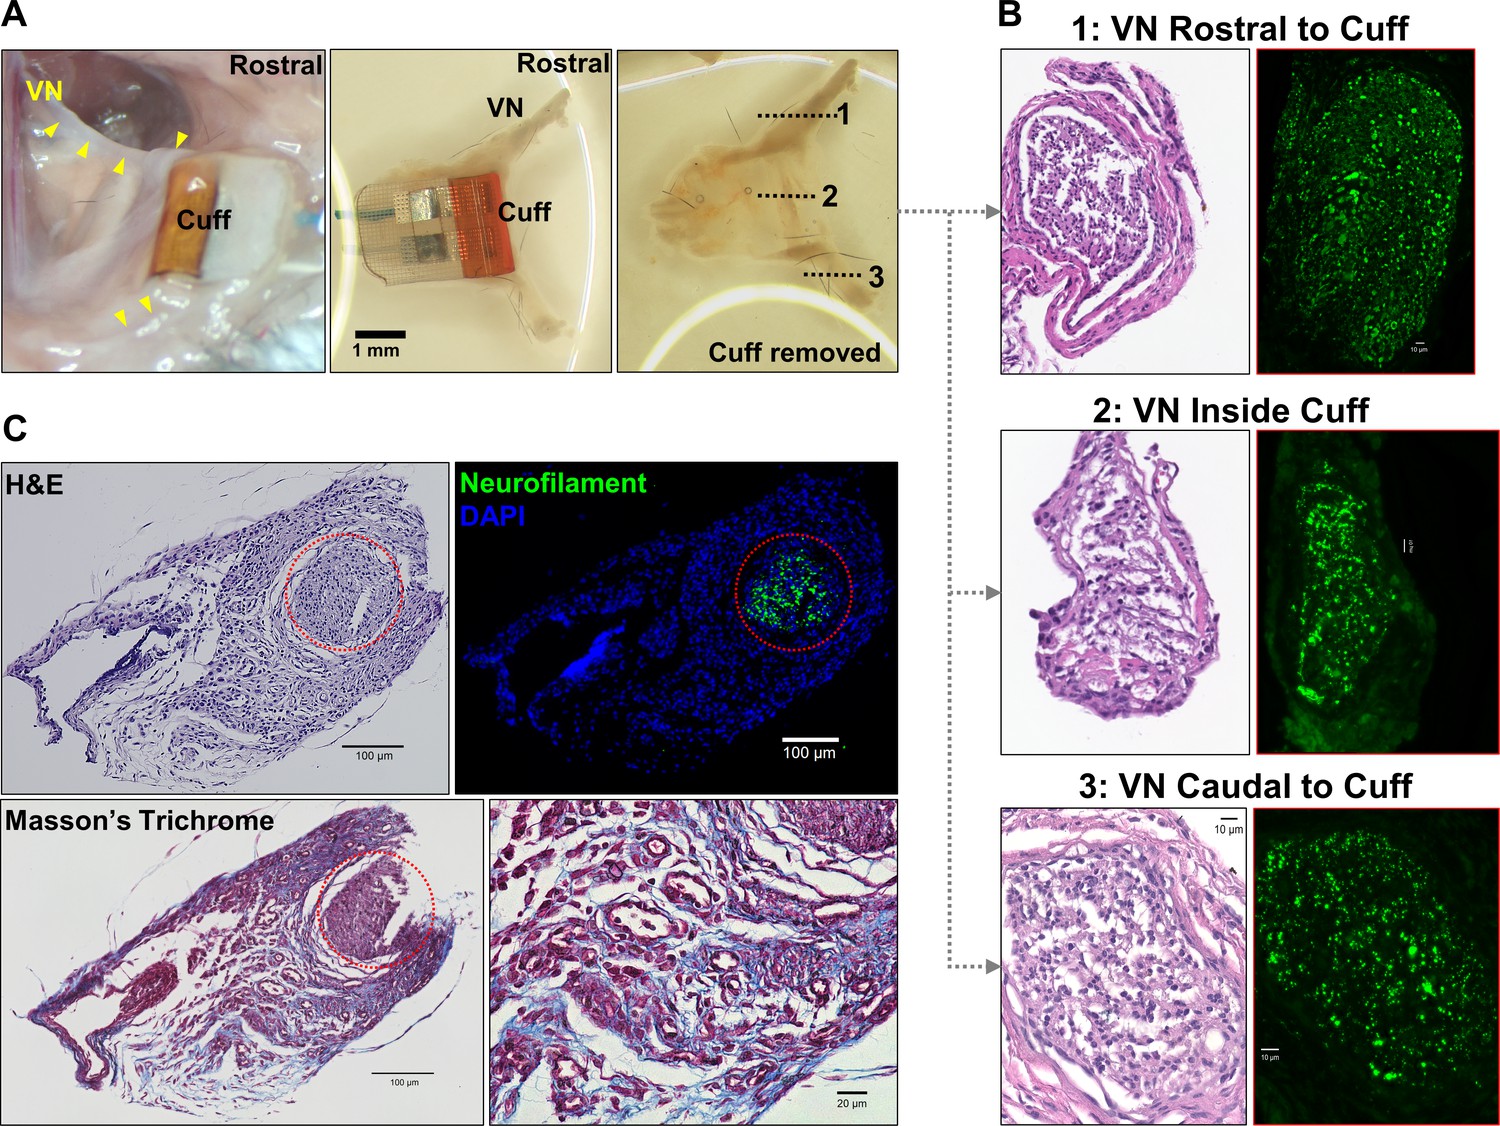
Gross anatomy and histology of cuffed nerve and surrounding tissues.
(A) 3-week-old micro-cuff electrode upon explantation (right panel). The cuff was carefully removed with intact rostral and caudal portions (middle panel) and nerve sectioned at three levels (dotted lines, left panel). (B) Cross-sections of cuffed vagus nerve at corresponding levels shown in (A) stained with hematoxylin and eosin (H&E) (left panels) and for axons (neurofilament, green; right panels). (C) Explanted cuffed vagus nerve (red dotted circle, upper left panel, H&E) stained for axons (upper right, neurofilament, green; DAPI nuclear stain, blue), and collagen (lower panel, Masson’s Trichrome).
Figure 6—figure supplement 1
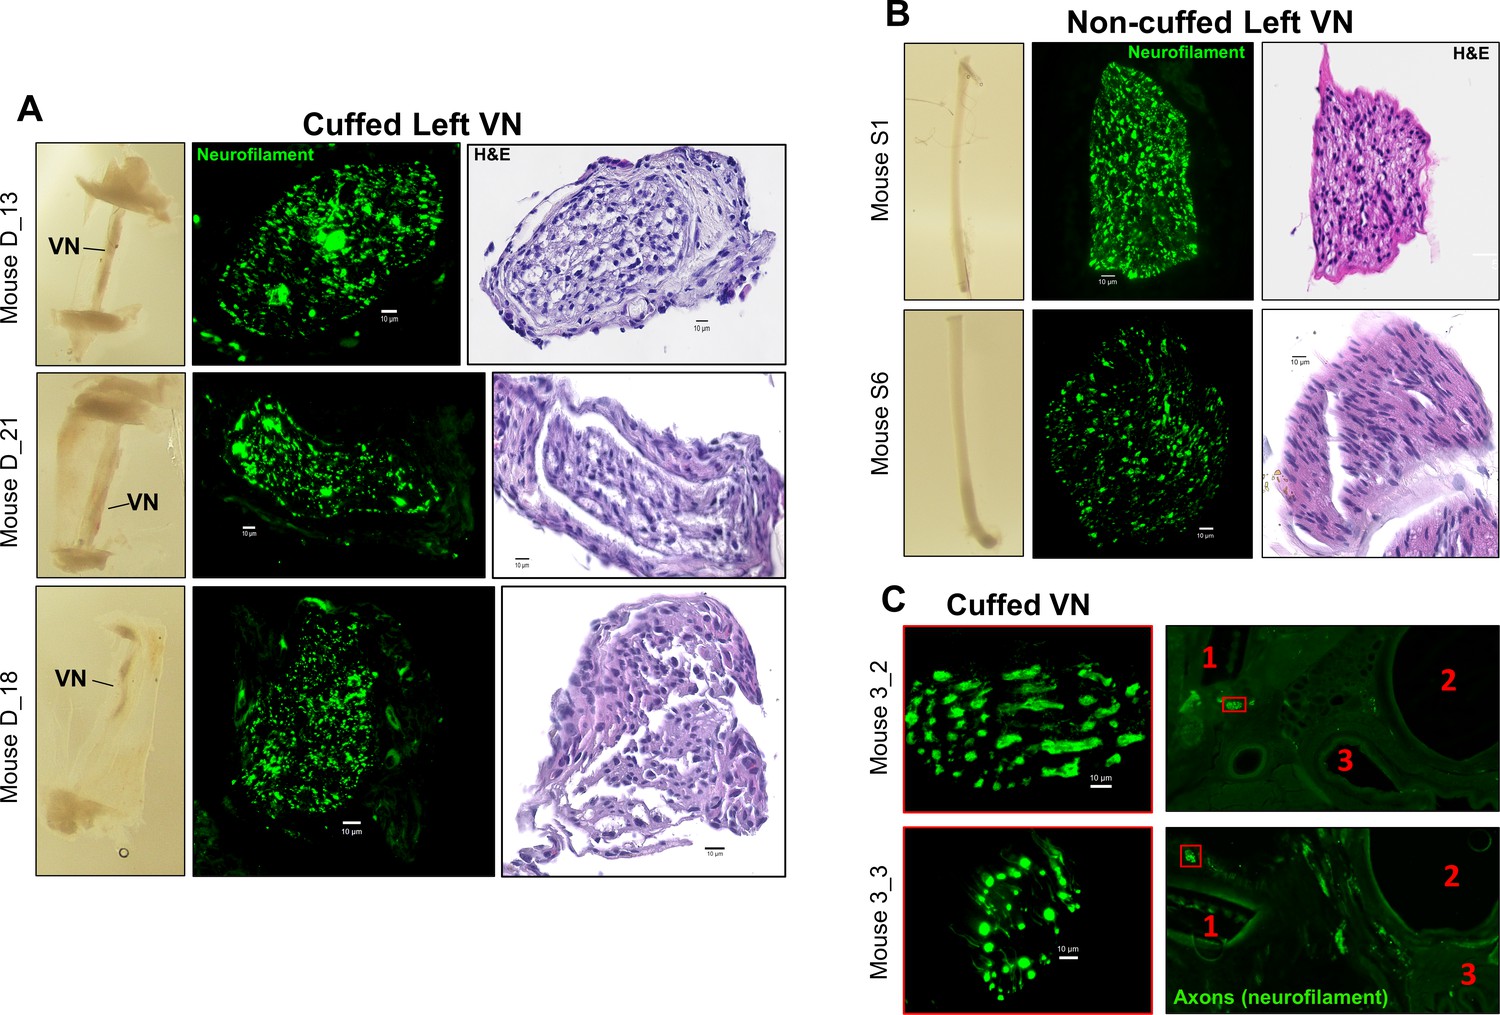
Histology examples of cuffed and non-cuffed VNs.
Cross-sections of (A) explanted cuffed left vagus nerves (VNs) (n = 3) and (B) non-implanted left VNs from naive animals (n = 2) at ~3 weeks post-implantation. Left panel shows gross fixed nerve before embedding and sectioning. Middle and right panels are cross-sections of the nerve stained with hematoxylin and eosin (H&E) and for axons (neurofilament, green), showing minor crush artifacts. Scale bars are 10 μm. (C) Cross-sections of the neck immediately rostral to the cuff (right panels) at 6 week post-implantation stained for axons (neurofilament, green) and showing landmarks: (1) rostral cuff margin; (2) trachea; and (3) esophagus. The left VNs are marked by a red box; scale bar is 100 μm. The cuffed left VN (magnified ×100, left panels) is located adjacent to the cuff (1). Scale bars are 10 μm.
Author response image 1
Videos
Video 1
Vagus nerve stimulation (VNS) in a conscious mouse.
Video clip showing a conscious mouse with a long-term VN implant and ECG leads, connected to a commutator and receiving VNS on post-implant day 15. The screen shows heart rate (HR; green trace) and a stimulation event (purple trace). VNS occurs at the 23 s time point.
Tables
Key resources table
| Reagent type (species) or resource | Designation | Source or reference | Identifiers | Additional information |
|---|---|---|---|---|
| Commercial assay, kit | Quick adhesive cement system (Metabond) | Parkell | Cat. # S380 | |
| Chemical compound, drug | Phenylephrine | West-Ward Pharmaceutical | NDC 0641-6229-01 | |
| Other | Lipopolysaccharide (LPS) from Escherichia coli 0111:B4 | Sigma-Aldrich | Cat. # L-4130 | |
| Commercial assay, kit | TNF-α mouse ELISA kit | Invitrogen | Cat. # 88-7324-88 | |
| Antibody | Rabbit anti-neurofilament heavy polypeptide | Abcam | Cat. # ab8135 RRID:AB_306298 | 1:500 |
| Antibody | Goat anti-rabbit Alexa 488 secondary antibody | Invitrogen | Cat. # A-11008 RRID:AB_143165 | 1:500 |
| Commercial assay, kit | Trichrome stain kit | Abcam | Cat. # ab150686 |
Table 1
Functional implants across time in several animal cohorts.
Implants were tested in four cohorts. In cohorts 1–3, implant functionality was determined based on heart rate threshold, and implant failure was defined as the absence of a physiological response upon stimulation with 3 mA or higher on three consecutive testing sessions. In cohort 4, functionality was determined based on a reduction in heart rate or breathing rate and failure was defined as absence of response with 1 mA on one occasion.
| Functional cuffs | ||||
|---|---|---|---|---|
| Days post-implantation: | 1–5 | 6–14 | 15–29 | 30+ |
| Cohort 1 (n = 10) | 8/10 (80%) | 6/10 (60%) | 4/10 (40%) | 4/10 (40%) |
| Cohort 2 (n = 10) | 10/10 (100%) | 7/10 (70%) | 7/10 (70%) | 6/10 (60%) |
| Cohort 3 (n = 9) | 9/9 (100%) | 8/9 (90%) | 8/9 (90%) | – |
| Cohort 4 (n = 52) | 50/52 (96%) | 38/50 (76%) | 17/18* | 11/13* |
-
*Group is a randomly selected subset of the (6–14 days) functional implants (n = 38).
Additional files
Download links
A two-part list of links to download the article, or parts of the article, in various formats.
Downloads (link to download the article as PDF)
Open citations (links to open the citations from this article in various online reference manager services)
Cite this article (links to download the citations from this article in formats compatible with various reference manager tools)
Development and characterization of a chronic implant mouse model for vagus nerve stimulation
eLife 10:e61270.
https://doi.org/10.7554/eLife.61270


