Epigenetic reprogramming rewires transcription during the alternation of generations in Arabidopsis
- Gregor Mendel Institute (GMI), Austrian Academy of Sciences, Austria
- Department of Genetics, University of Leicester, United Kingdom
Figures
Figure 1 with 4 supplements

Chromatin accessibility is extensively reprogrammed in pollen.
(A) Schematic of Arabidopsis pollen development. Microspores divide asymmetrically to produce a vegetative cell nucleus (VN, green) and germ cell nucleus (GN, purple). While the vegetative cell terminally differentiates, the germ cell divides to produce two sperm nuclei (SN, blue). Details of cellular membranes have been excluded for simplicity. ATAC-seq was performed on FACS-enriched microspores and on fluorescence-activated nuclear sorting (FANS)-isolated GN, SN, and VN. (B) Principal component analysis comparing Arabidopsis RNA-seq transcriptomes from sporophytic and male gametophytic cell types and tissues. Published RNA-seq data sets were reanalysed or described previously (Borg et al., 2020; Hofmann et al., 2019; Nodine and Bartel, 2012; Wang et al., 2020; Zhao et al., 2019). (C) Heatmap centred on pollen accessible chromatin regions (ACRs) comparing seedlings (SDL), microspore nuclei (MN), GN, SN, and VN. Clustering is based on ACR specificity to MN (orange), SN (blue), or VN (green). ACRs in common with seedlings are shown in grey. (D) Genome browser comparison of ATAC-seq tracks in MN, GN, SN, VN, and SDL. Examples of SN-specific (blue), VN-specific (green), and sporophyte and MN-specific (orange) ACRs are indicated with colour shading. ATAC-seq signal is normalised to 1× Arabidopsis genome coverage. (E) Pie chart summary of the specificity of pollen ACRs determined in this study. (F) Heatmap summarising the percentage of differential ACRs detected in pairwise comparisons between the MN, GN, SN, and VN. Differential accessibility was assessed within the 20,634 pollen ACRs shown in panel E. (G) Pairwise correlation of relative chromatin accessibly at promoters and relative mRNA levels of the associated transcribed genes between SN and VN. R represents Pearson’s correlation coefficient. (H) Genomic distribution of ATAC-seq peaks in each different group of ACRs. The log2 enrichment or depletion is calculated relative to the frequency of genomic features in the Arabidopsis genome.
Figure 1—figure supplement 1

Isolation of key cell types across Arabidopsis pollen development.
(A) Expression of ProVCK:NTF in mature Arabidopsis pollen, which specifically marks the vegetative cell nucleus (VN). A corresponding differential interference contrast (DIC) image is shown alongside an image captured in the fluorescence channel. Scale bar, 5 μm. (B) The population of VN isolated by fluorescence-activated nuclear sorting (FANS) from pollen of the ProVCK:NTF line. VN were clearly based on an increased signal in the GFP channel, with the VN gate highlighted in dark green. (C) Expression of ProHTR10:HTR10-Clover in mature Arabidopsis pollen, which specifically marks sperm cell nuclei (SN). A corresponding DAPI-stained image is shown alongside an image captured in the fluorescence channel. Scale bar, 5 μm. (D) The population of SN isolated by FANS from pollen of the ProHTR10:HTR10-Clover line. SN were identifiable based on an increased signal in the GFP channel, with the SN gate highlighted in green. (E) A distinct microspore (MSP) population was isolated by fluorescence-activated cell sorting of a crude spore preparation from wild-type Arabidopsis inflorescence. MSP were enriched by gating for their distinct size and auto-fluorescent properties (highlighted in pink). (F and G) FACS-isolated spores were inspected by microscopy after DAPI-staining to determine purity and integrity. The relative proportion of microspores and bicellular pollen (F) is summarised in the bar plot (G). Scale bar, 5 μm. (H) Expression of ProDUO1:MDB-NTF in developing Arabidopsis pollen grains, which specifically marks germ cell nuclei (GN). MDB-NTF includes the CYCB1;one destruction box that is susceptible to degradation by APC/C outside of the G2/M-phase (Borg et al., 2014). As germ cells progress through G2, reduced APC/C activity licenses the accumulation of MDB-NTF. As germ cells exit mitosis, APC/C is reactivated leading to rapid turnover of NTF in divided sperm. Scale bar, 5 μm. (I) The population of GN isolated by FANS from pollen of the ProDUO1:MDB-NTF line. GN were identifiable based on an increased signal in the GFP channel, with the GN gate highlighted in green.
Figure 1—figure supplement 2
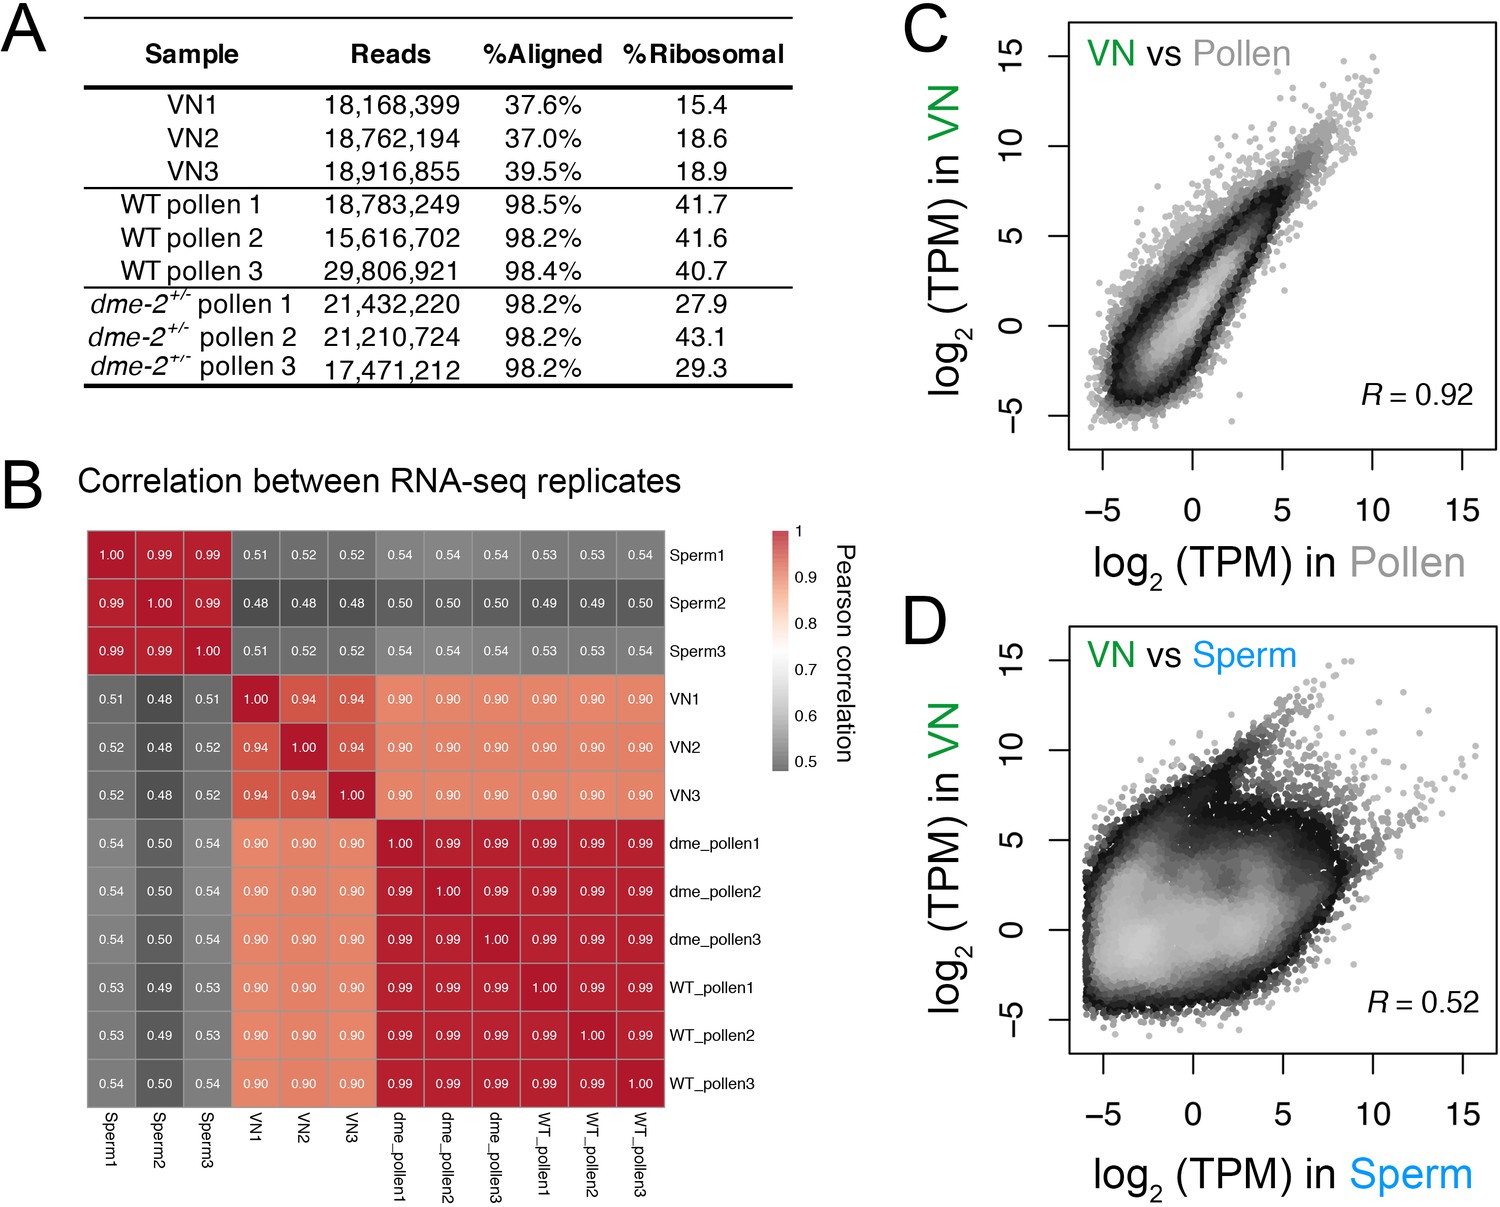
Transcriptomic profiling performed in this study.
(A) Table summarising the statistics of the RNA-seq libraries sequenced in this study. (B) Pearson cross-correlation matrix of the RNA-seq data sets generated in this study alongside sperm RNA-seq data described previously (Borg et al., 2020). (C and D) Pairwise correlation plots of the RNA-seq profiles generated from isolated VN. Plotted is the log2 transcripts per million (TPM) in VN versus mature pollen (C) or intact sperm cells (D). R represents Pearson’s correlation coefficient.
Figure 1—figure supplement 3
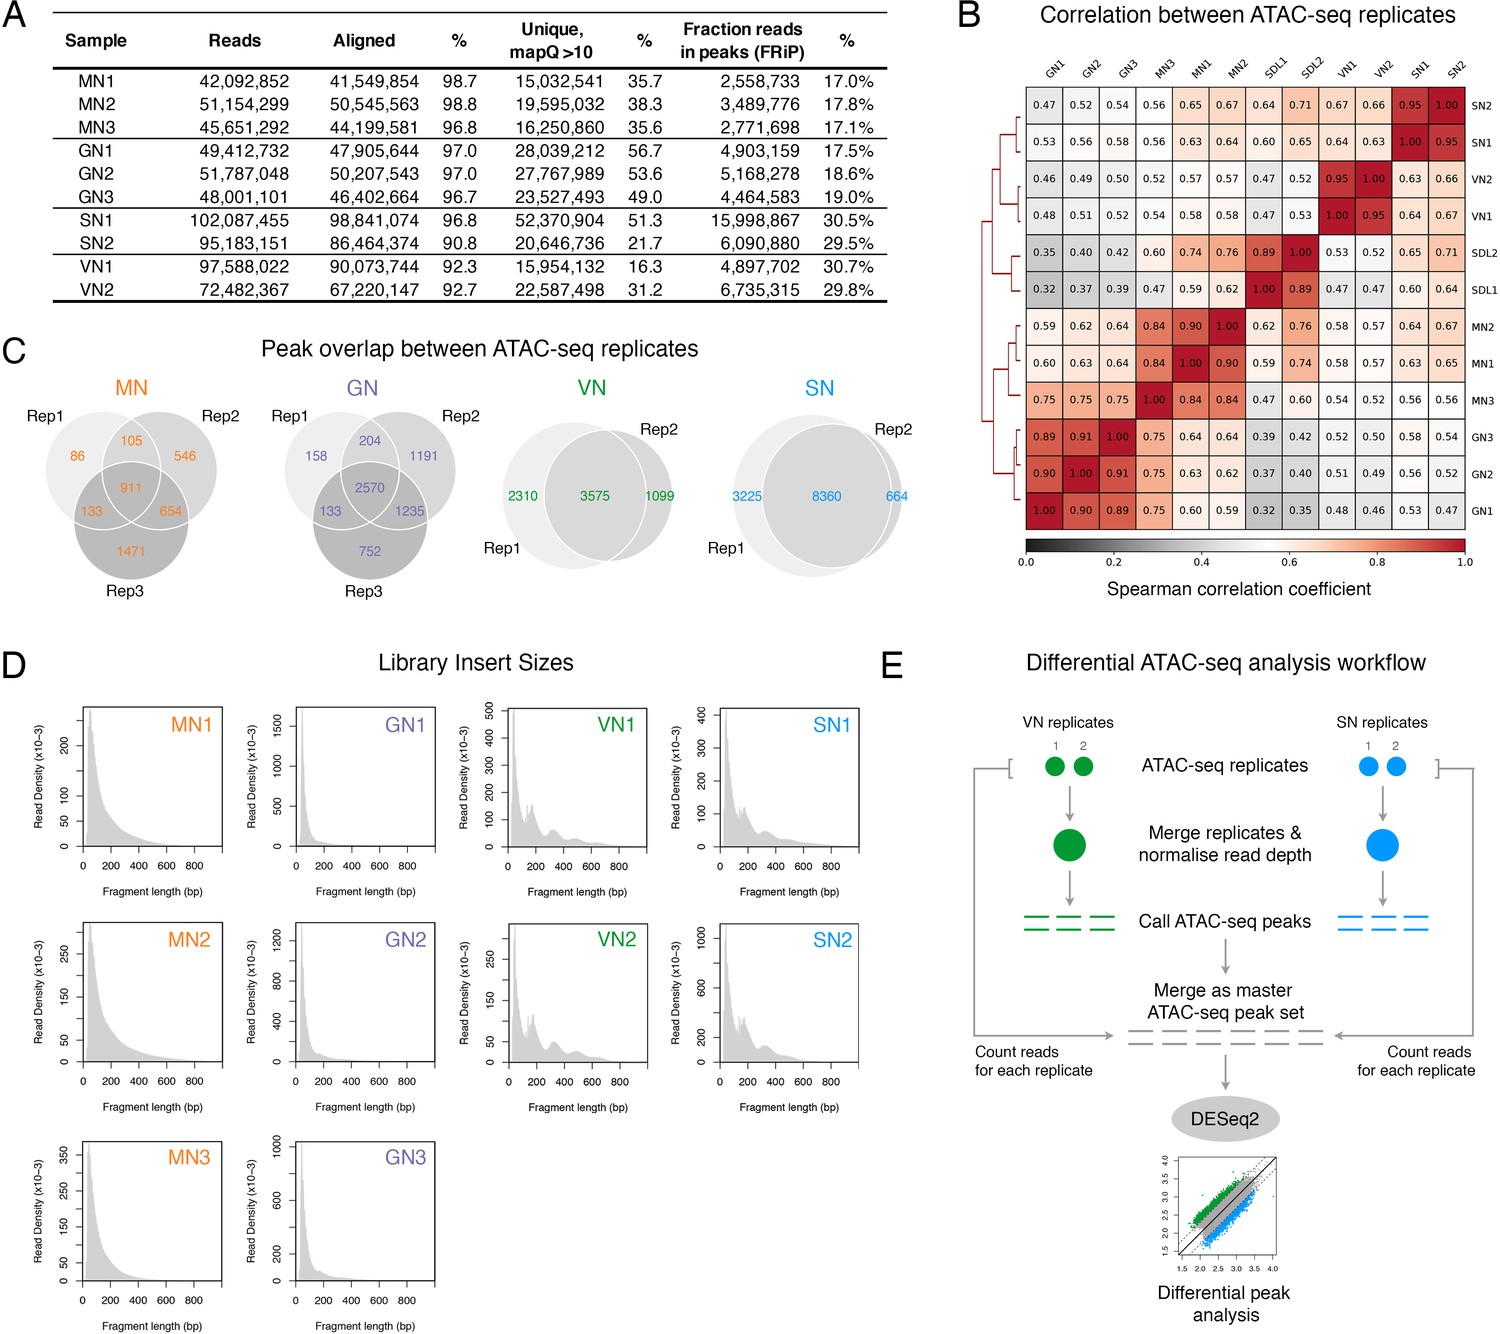
ATAC-seq profiling performed in this study.
(A) Table summarising the statistics of the ATAC-seq libraries sequenced in this study. (B) Spearman cross-correlation matrix of the pollen ATAC-seq data sets alongside published profiles from Arabidopsis seedlings (Lu et al., 2017). (C) Pie chart summarising the overlap of peaks among replicates of the pollen ATAC-seq profiles. (D) Fragment size distribution of each pollen ATAC-seq library. (E) Schematic diagram summarising the analysis workflow for the differential peak analysis of the pollen ATAC-seq profiles.
Figure 1—figure supplement 4
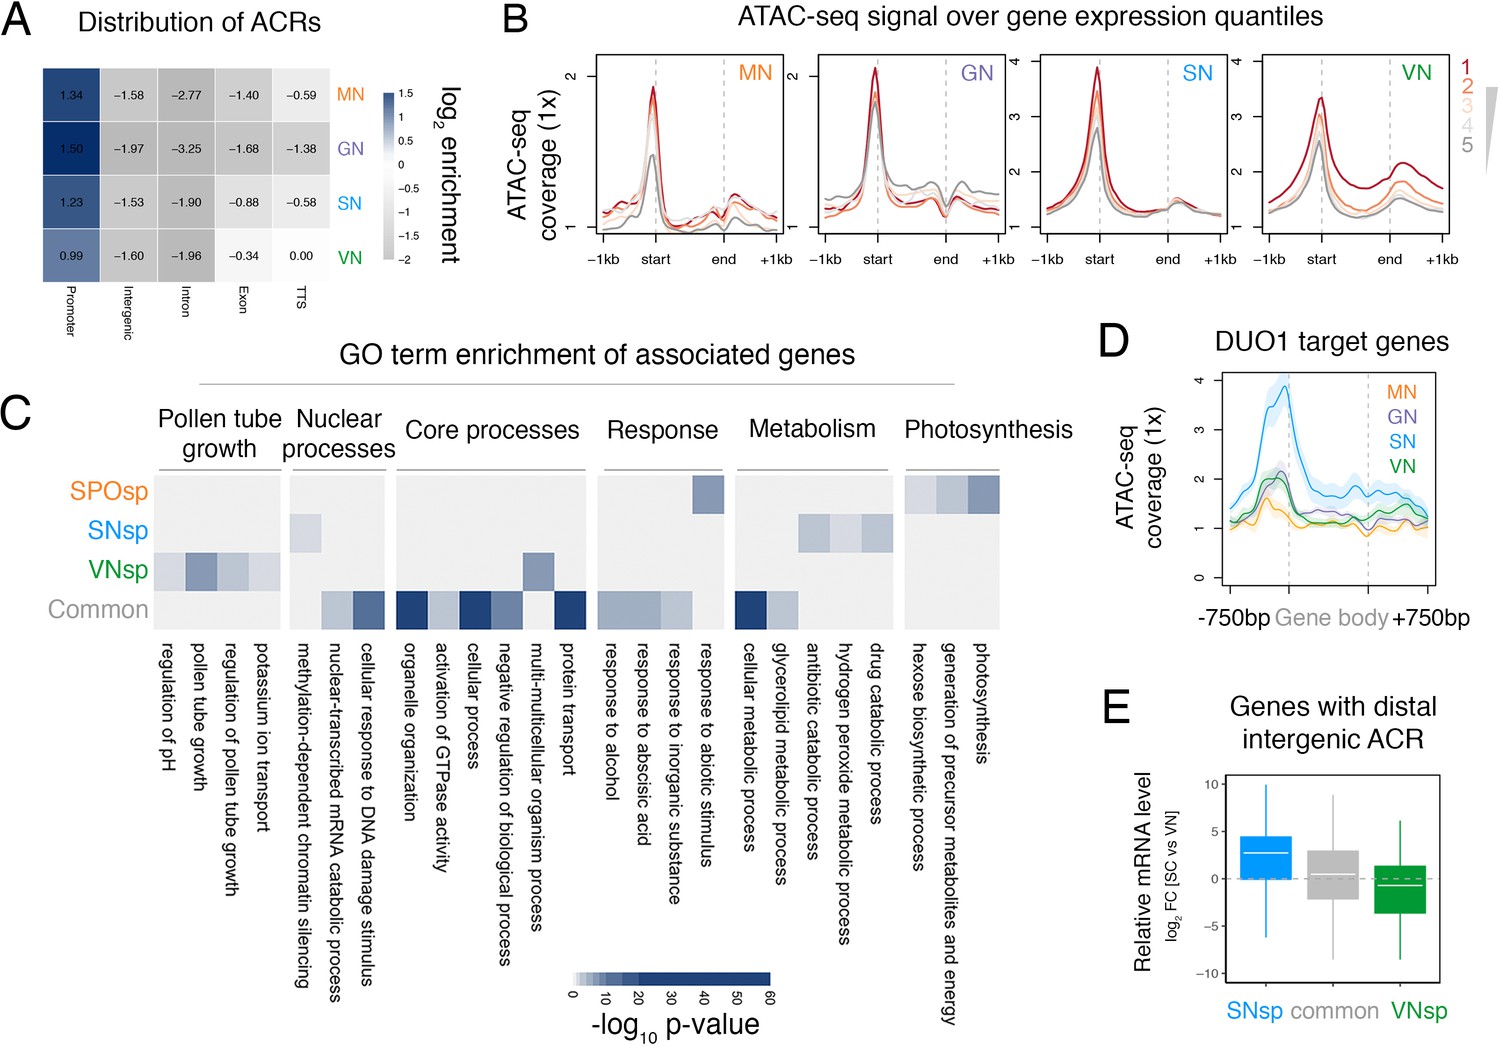
ATAC-seq profiling across Arabidopsis pollen development.
(A) Distribution of genomic features associated with ATAC-seq peaks recovered from nuclei of microspores (MN), germ cells (GN), sperm (SN), and vegetative cells (VN). (B) Distribution of ATAC-seq signal over genes sorted by expression level in each respective cell type. ATAC-seq signal for GN is plotted over quintiles of gene expression in sperm. (C) Heatmap summarising the gene ontology (GO) terms enriched within the different groups of accessible chromatin regions (ACRs) defined in Figure 1E. Significant enrichment was assessed using g:Profiler and controlled for the multiple testing problem using the in-built g:SCS (sets counts and sizes) correction. (D) Averaged ATAC-seq enrichment over direct DUO1 target genes (Borg et al., 2011). Plotted is the ATAC-seq signal normalised to 1× Arabidopsis genome coverage. Shading represents the standard error. (E) Boxplot summarising the relative expression level of genes closest to different groups of distal intergenic ACRs. Plotted is the relative expression level between sperm and the VN. Each boxplot indicates minimum and maximum values as well as 25th, 50th, and 75th quartiles.
Figure 2 with 1 supplement
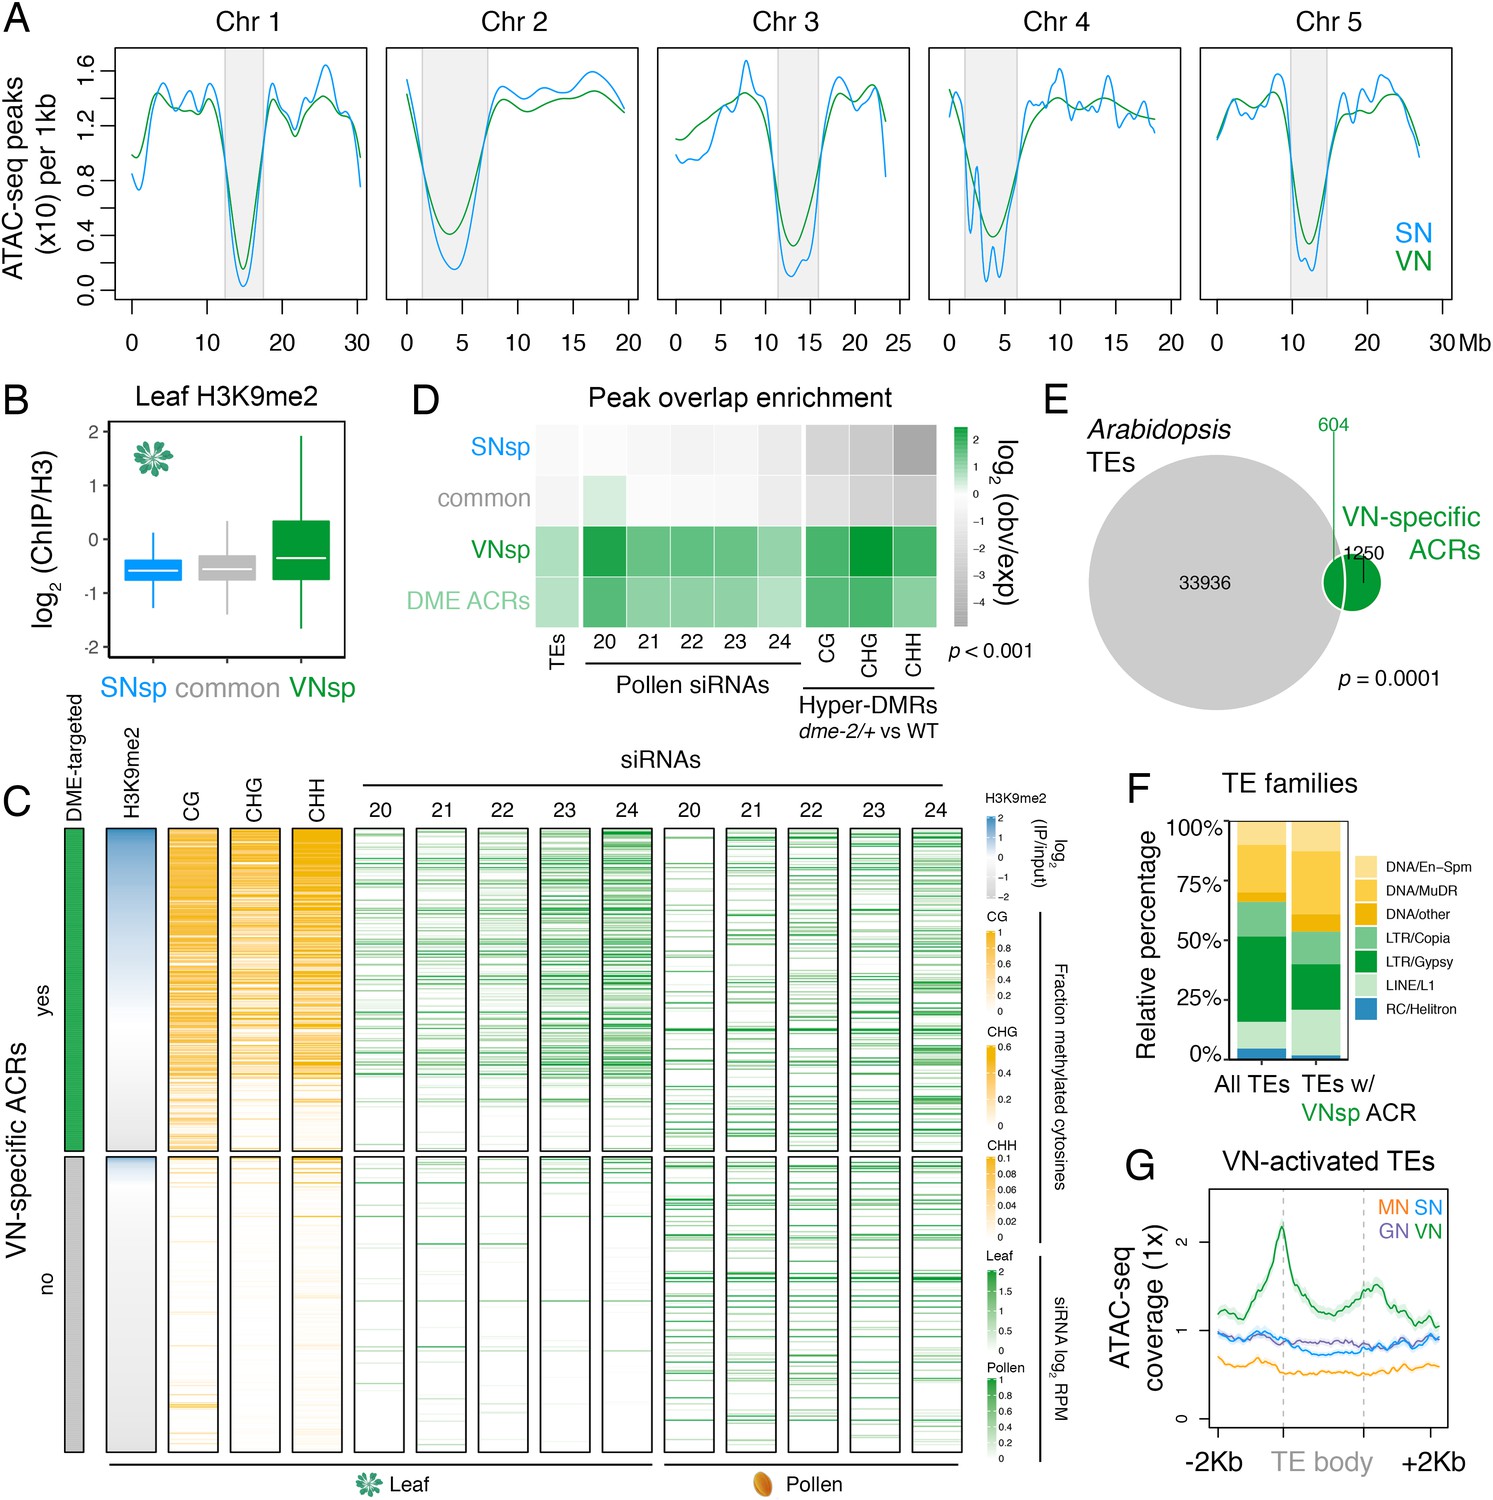
Pericentromeric sequences gain chromatin accessibility in the VN.
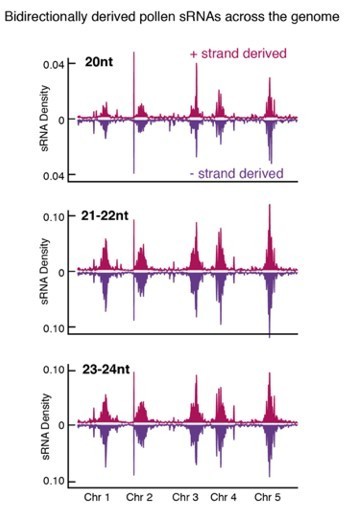
(A) Distribution of accessible chromatin region (ACR) density over the five Arabidopsis chromosomes calculated in 10 kb bins. Pericentromeric regions are indicated with grey shading. (B) Levels of H3K9me2 marks in leaf tissue (log2 ChIP-seq enrichment relative to H3) (Baerenfaller et al., 2016) at SN-specific, VN- specific, and common ACRs. Each boxplot indicates minimum and maximum values as well as 25th, 50th, and 75th quartiles. (C) Heatmap summarising the epigenetic state of VN-specific ACRs. Shown are the log2 enrichment of H3K9me2 (relative to H3), the proportion of CG, CHH, and CHG methylation (Stroud et al., 2013) and different size classes of short-interfering RNA (siRNAs) in leaves (Papareddy et al., 2020) alongside pollen siRNAs (Borges et al., 2018). VN-specific ACRs are grouped by the presence or absence of cytosines demethylated by DEMETER (DME) in the VN. (D) Heatmap summarising the overlap enrichment of SN-specific, VN-specific, DME-targeted, and common ACRs with TEs, pollen siRNAs (Slotkin et al., 2009), and dme-2/+ hyper-DMRs. Fold changes were determined using hypergeometric tests compared with random Arabidopsis genomic regions (n = 10,000,000 permutations). (E) Pairwise overlap between VN-specific ACRs and Arabidopsis transposable elements (TEs). Significance of the enriched overlap (p-value) was determined in the hypergeometric test shown in panel C. (F) Distribution of TE gene classes associated with VN-specific ACRs alongside the relative frequency in the Arabidopsis genome. (G) Averaged ATAC-seq enrichment over TE genes specifically re-activated in the VN. Plotted is the ATAC-seq signal normalised to 1× Arabidopsis genome coverage.
Figure 2—figure supplement 1

DEMETER (DME) demethylates accessible chromatin uniformly across the VN.
(A) Genome browser view of the ATAC-seq data sets over a TE-rich pericentromeric region of chromosome 2. Tracks represent the levels of H3K9me2 in leaf (log2 ChIP-seq enrichment relative H3) and the ATAC-seq signal normalised to 1× Arabidopsis genome coverage for nuclei of microspores (MN), germ cells (GN), sperm (SN), and vegetative cells (VN). (B) Levels of active H3K27ac and H3K4me3 marks in leaf tissue (log2 ChIP-seq enrichment relative H3) at SN-specific, VN-specific, and common accessible chromatin regions (ACRs). Each boxplot indicates minimum and maximum values as well as 25th, 50th, and 75th quartiles. (C) Levels of constitutive heterochromatin marks in leaf tissue centred over non-intergenic DME-targeted ACRs. Clustering is based on H3K9me2 levels. Plotted is the log2 ChIP-seq enrichment relative H3 (H3K9me1 and H3K27me1) or input (H1). Numbers of ACRs are n = 407 (cluster 1) and n = 1,966,966 (cluster 2). Genes mis-expressed in dme-2/+ mutant pollen compared to wild type (WT; green) and genes induced during pollen tube growth (grey) are marked. (D) Distribution of DME-targeted ACRs across all five chromosomes of the Arabidopsis genome. Expressed genes (TPM > 1) associated with a DME-targeted ACR are shown in green while non-expressed genes (TPM < 1) are shown in grey. Pericentromeric regions are indicated with grey shading. (E) Differentially expressed genes (DEGs) in dme-2/+ compared to WT (n = 101) and genes associated with non-intergenic DME-targeted ACRs (n = 2267) significantly overlap each other. Significance of the enriched overlap (p-value) was determined using a two-sided Fisher’s exact test. (F) Dry pollen expression of DME-targeted genes induced during semi in vivo pollen tube growth (Leydon et al., 2017).
Figure 3 with 2 supplements
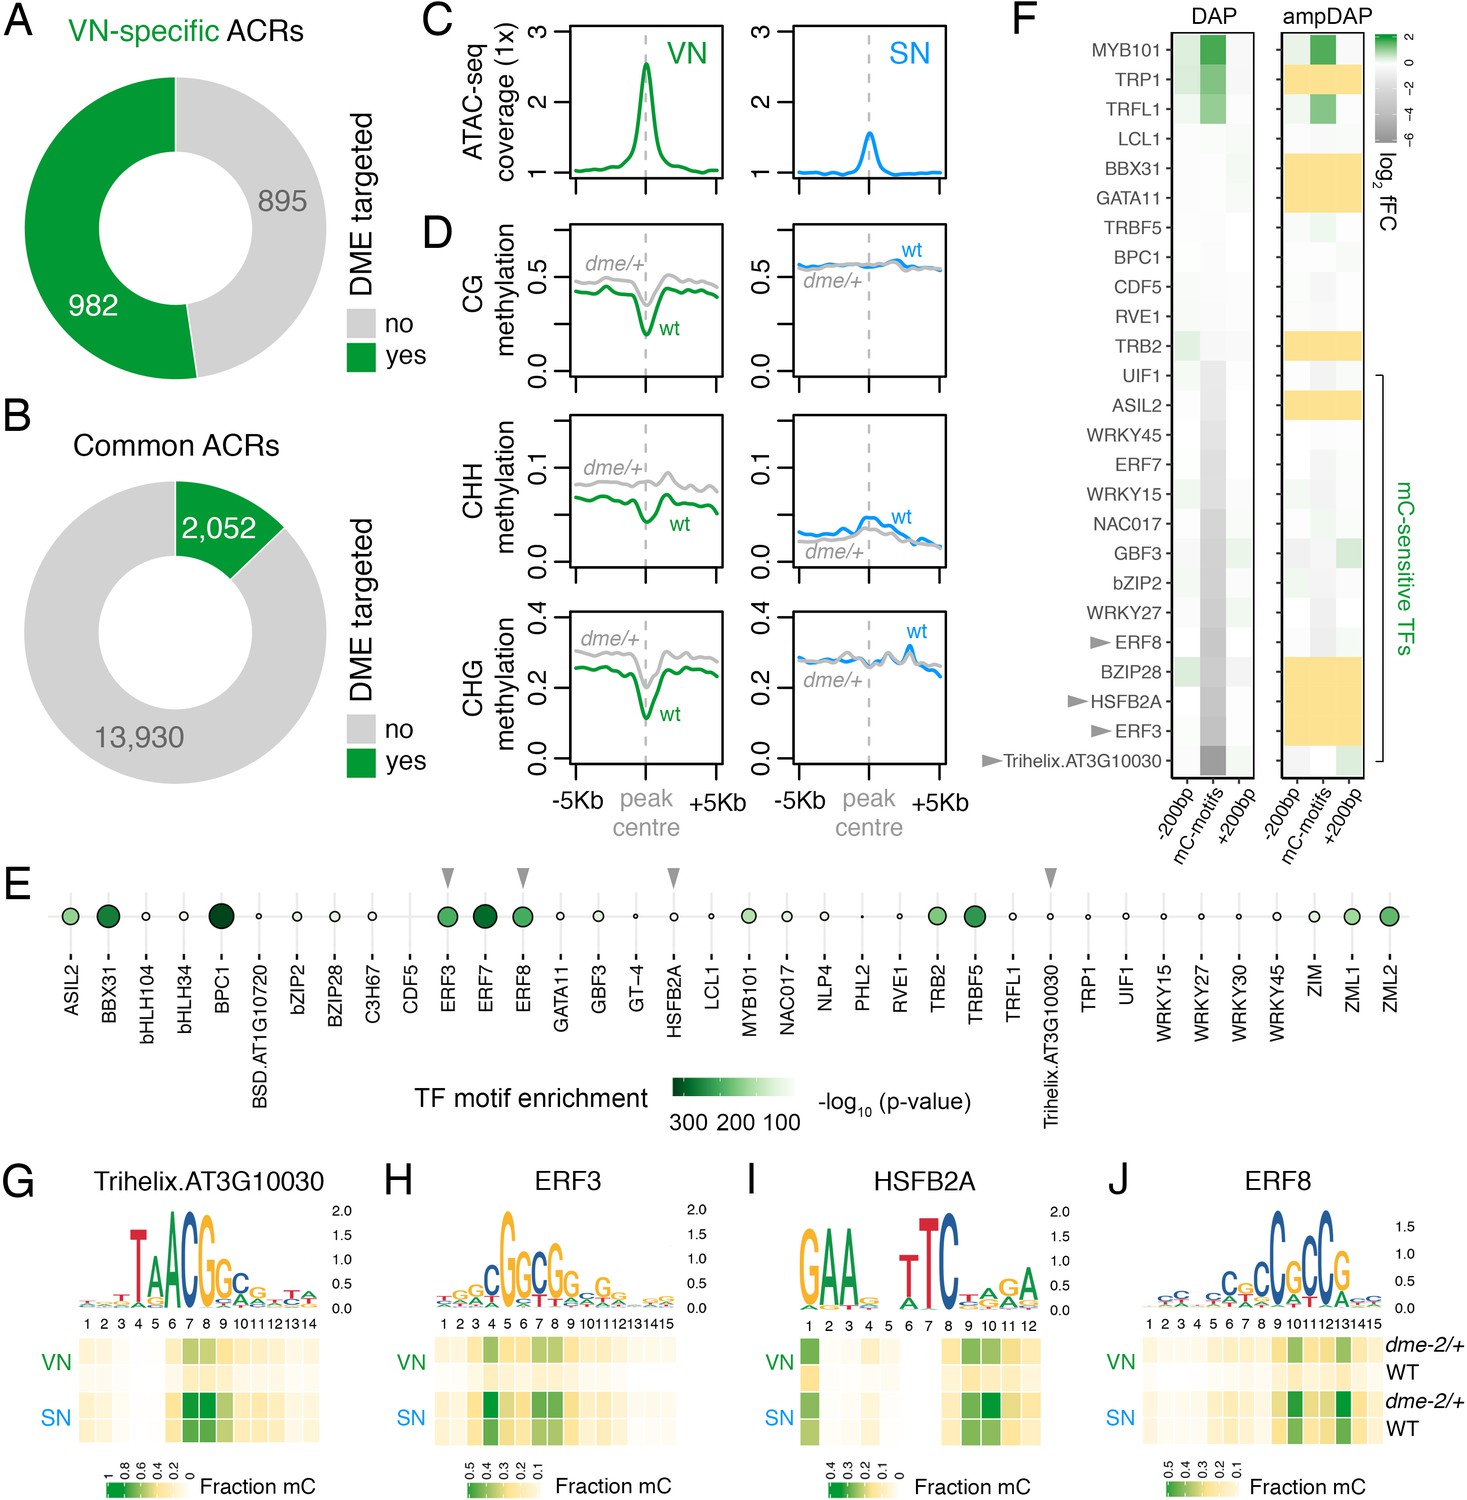
DEMETER (DME) demethylates predicted TF binding sites in accessible chromatin.
(A and B) Relative proportion of VN-specific accessible chromatin regions (ACRs) (A) and common ACRs (B) that overlap with cytosines demethylated by DME in the VN. (C and D) Averaged metaplots comparing ATAC-seq enrichment (C) and the proportion of CG, CHH, and CHG methylation (D) in sperm (blue) and the VN (green) over DME-targeted ACRs. Regions with at least five differentially methylated cytosines were plotted. Coloured lines represent wild-type (WT) levels while grey lines indicate the level in nuclei isolated from dme-2/+ mutant pollen. (E) Motifs of VN-expressed TFs enriched within DME-targeted ACRs. Significance (p-value) was assessed using a two-sided Fisher’s exact test. TFs shown in panels F–I are marked with grey triangles. (F) Binding preference for the VN-expressed TF motifs enriched within DME-targeted ACRs. Left: DAP-seq binding fold-change at methylated motifs (mC-motifs) relative to neighbouring motifs (±200 bp). Right: ampDAP-seq binding fold-change at the same mC-motifs without DNA methylation. Yellow boxes indicate TFs without a score due to too few motifs. Data is from previously published DAP-seq experiments (O'Malley et al., 2016). TFs shown in panels F–I are marked with grey triangles. (G–J) DNA methylation level at predicted binding sites within DME-targeted ACRs for the four highest methylation-sensitive TFs shown in panel E – Trihelix.AT3G10030 (G), ERF3 (H), HSFB2A (I), and ERF8 (J). Each heatmap summarises the proportion of methylated cytosines over predicted binding sites in VN and SN of WT and dme-2/+ pollen. Single nucleotides are indicated by the corresponding position frequency matrix logo plotted above each heatmap.
Figure 3—figure supplement 1
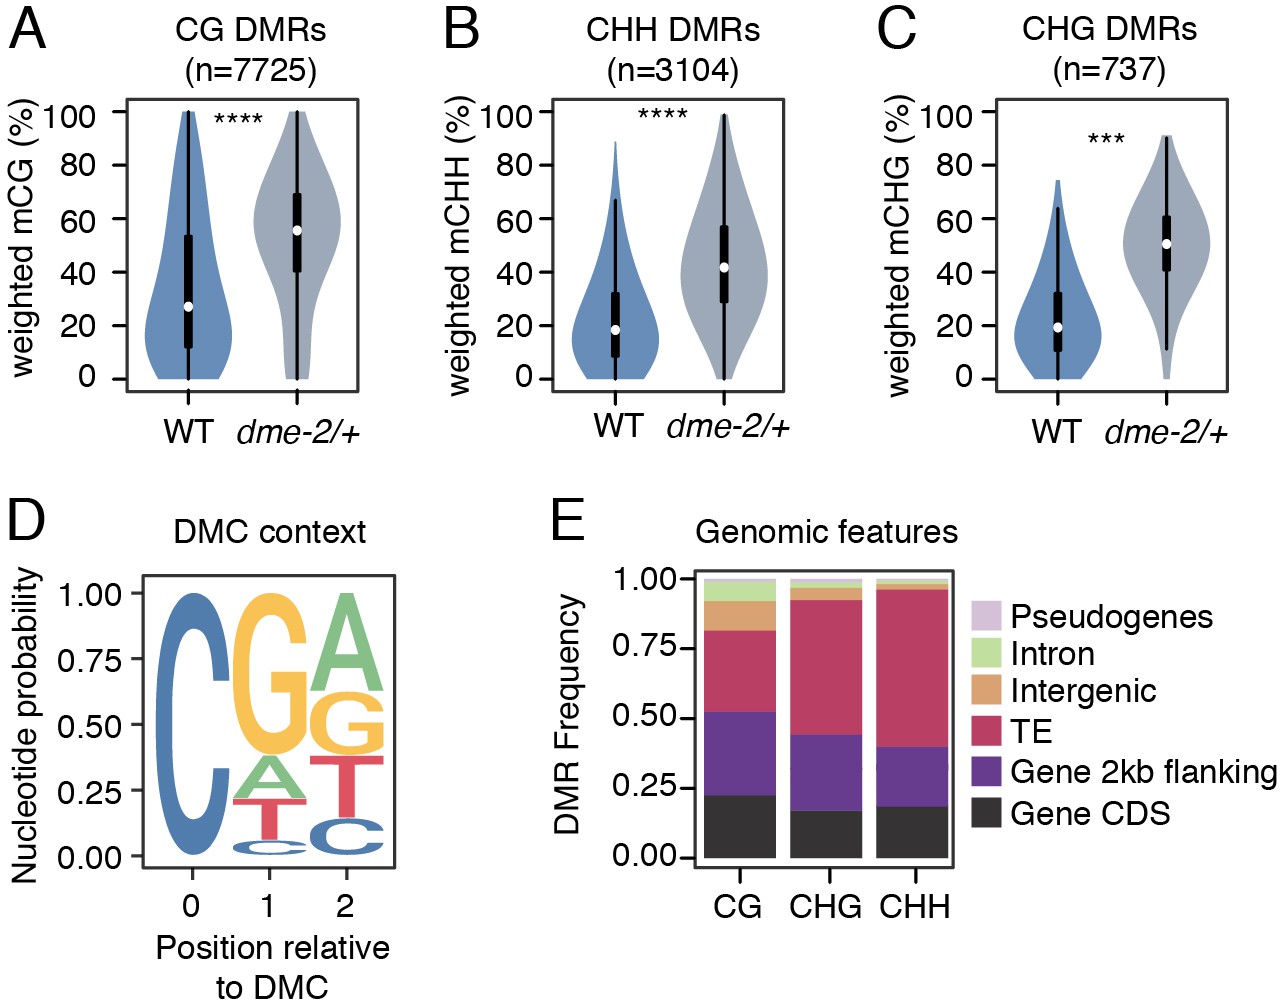
Differential methylated region (DMR) analysis between VN from wild-type (WT) and dme-2/+ mutant pollen.
(A–C) Violin plots showing weighted DNA methylation rates of DMRs in CG (A), CHH (B), and CHG (C) context. Each overlaid boxplot indicates minimum and maximum values as well as 25th, 50th, and 75th quartiles. p-values <2.2e-16 and <1.6e-4 based on Mann–Whitney U-test of methylation differences between WT and dme-2/+ are represented by **** and *** respectively. (D) Nucleotide probability of significant differentially methylated cytosines (DMCs) within DMRs in VN from dme-2/+ pollen compared to WT. (E) Proportion of genomic features overlapping CG, CHG, and CHH DMRs.
Figure 3—figure supplement 2

DEMETER (DME) demethylates predicted TF binding sites specifically in the VN.
(A–J) DNA methylation level at predicted binding sites within DME-targeted accessible chromatin regions (ACRs) for the remaining 10 methylation-sensitive TFs shown in Figure 4E – bZIP28 (A), WRKY27 (B), bZIP2 (C), GBF3 (D), NAC017 (E), WRKY15 (F), ERF7 (G), WRKY45 (H), ASIL2 (I), and UIF1 (J). Each heatmap summarises the proportion of methylated cytosines over the predicted binding sites in VN and SN of wild-type (WT) and dme-2/+ pollen. Single base pair positions are indicated by the corresponding position frequency matrix logo plotted above each heatmap.
Figure 4
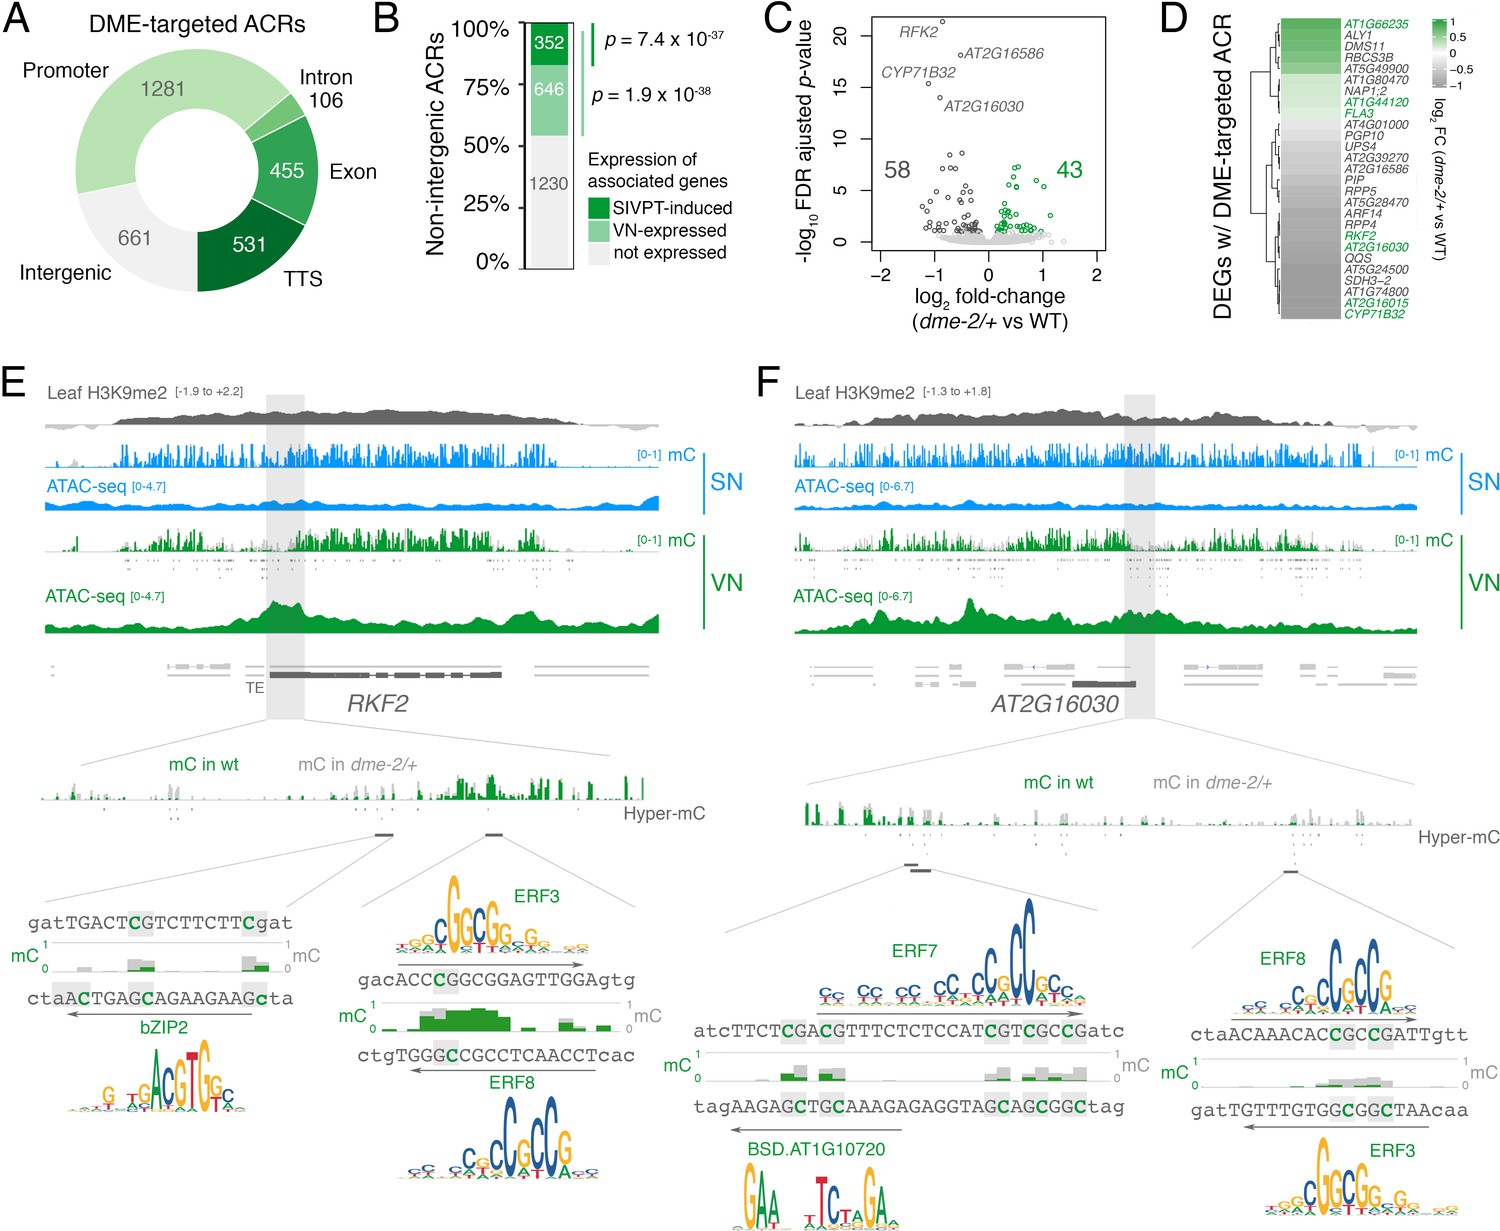
DEMETER (DME) activity regulates the expression of pollen tube-related genes.
(A) Distribution of genomic features associated with DME-targeted accessible chromatin regions (ACRs). (B) Expression status of genes lying in the vicinity (<900 bp) of a DME-targeted ACR. Genes were classified as being expressed in the VN (TPM >1, light green) or by being upregulated during semi in vivo pollen tube (SIVPT) growth (dark green) (Leydon et al., 2017). Statistical enrichment of the overlap was determined using pairwise two-sided Fisher’s exact tests. (C) Volcano plot of differentially expressed genes (DEGs) in dme-2/+ pollen compared to wild type (WT). Upregulated genes are shown in green while downregulated genes are shown in dark grey. DEGs were defined as having an FDR-adjusted p-value <0.1. The top four most significantly downregulated genes are labelled. (D) Heatmap illustrating the magnitude of expression changes for DME-dependent DEGs directly associated with a DME-targeted ACR. Plotted is the log2 fold-change in dme-2/+ pollen compared to WT. VN-specific genes are highlighted in green. (E and F) Browser view of two VN-specific direct DME target genes – RECEPTOR-LIKE SERINE/THREONINE KINASE (RFK2) (E) and the AT2G16030 locus encoding a SAM-dependent methyltransferase (F). Both genes are marked with H3K9me2 in the sporophyte (log2 ChIP-seq enrichment relative to H3). Tracks illustrate ATAC-seq signals and the proportion of methylated cytosines in all contexts (mC) in SN (blue) and VN (green), with DNA methylation levels in dme-2/+ overlaid in grey. DME-dependent hyper-methylated cytosines (HMCs) are marked below. Shading indicates the flanking promoter region shown in the close-up view. Sequences surrounding predicted TF binding sites are shown, with the level of cytosine methylation at HMCs highlighted in green and grey for WT and dme-2/+, respectively. Arrows indicate the orientation and position of TF motifs with a corresponding position frequency matrix logo plotted above.
Figure 5

Chromatin accessibility in sperm forecasts sporophytic development.
(A) Sperm ATAC-seq profiles reflect the reprogrammed state of sporophytic H3K27me3 target genes. Plotted are averaged levels of leaf H3K27me3 and sperm H3K4me3 (log2 ChIP-seq enrichment relative to control) together with sperm ATAC-seq signals. ChIP-seq data and clustering for the presence and absence of H3K4me3 enrichment in sperm were described previously (Borg et al., 2020). (B) Heatmap summarising the overlap enrichment of SN-specific, VN-specific, and common accessible chromatin regions (ACRs) with somatic Polycomb target genes, DUO1 target genes, and sperm-enriched genes. Fold-enrichment was determined using hypergeometric tests compared with random Arabidopsis genomic regions (n = 10,000,000 permutations). (C) Levels of H3K27me3 marks in leaf tissue (log2 ChIP-seq enrichment relative to H3) at SN-specific, VN-specific, and common ACRs. Each boxplot indicates minimum and maximum values as well as 25th, 50th, and 75th quartiles. (D) Relative proportion of SN-specific ACRs that overlap with a somatic H3K27me3 domain. (E) Distribution of genomic features associated with SN-specific ACRs. (F) Expression status of genes in the vicinity (<900 bp) of an SN-specific ACR with or without H3K27me3 in the sporophyte. Genes were classified as being expressed in sperm (TPM >1, light blue), by having enriched expression in sperm (dark blue), or by expression in the early zygote or embryos but not sperm (pink). Non-expressed genes in sperm are shown in grey. TPM >1 or <1 was used as a threshold for expressed and non-expressed genes, respectively. Statistical enrichment was determined using pairwise two-sided Fisher’s exact tests. (G) Chromatin accessibility at three sperm-specific genes associated with sperm differentiation – DUO1-ACTIVATED ZINC FINGER 1 (DAZ1), SHORT SUSPENSOR 1 (SSP1) and PLANT CADMIUM RESISTANCE 11 (PCR11). Tracks represent the ATAC-seq signal normalised to 1× Arabidopsis genome coverage for nuclei of the microspore (MN), germ cell (GN), sperm (SN), and vegetative cell (VN). (H) Differential expression between htr10, elf6;ref6;jmj13, and elf6;ref6;jmj13;htr10 pollen relative to wild type (WT). Each boxplot indicates the minimum and maximum values as well as 25th, 50th, and 75th quartiles. Sample size (n) of genes associated with an H3K27me3-repressed ACR (blue) and all sperm-expressed genes (grey) is shown. Plot is restricted to genes with >10 counts in at least one RNA-seq sample and/or replicate. Statistical analysis was performed using two-sided Kolmogorov–Smirnov tests. (I) Chromatin accessibility at four major developmental regulators transcribed during early sporophyte development – BABY BOOM (BBM), FLOWERING LOCUS C (FLC), LEAFY COTYLEDON 1 (LEC1), and WUSCHEL-RELATED HOMEBOX 2 (WOX2). Tracks represent the ATAC-seq signal normalised to 1× Arabidopsis genome coverage for nuclei of the microspore (MN), germ cell (GN), sperm (SN), and vegetative cell (VN). (J) Averaged ATAC-seq enrichment over genes with enriched expression during early (pink), mid (yellow), and late (grey) embryogenesis, which represent the pre-cotyledon phase, the transition phase, and the mature green phase, respectively (Hofmann et al., 2019). Plotted is the sperm ATAC-seq signal normalised to 1× Arabidopsis genome coverage.
Author response image 1
Additional files
-
Supplementary file 1
Pollen ATAC-seq accessible chromatin regions (ACRs) detailed in this study.
- https://cdn.elifesciences.org/articles/61894/elife-61894-supp1-v2.txt
-
Supplementary file 2
Differentially hyper-methylated cytosines (DMCs) in vegetative cell nucleus (VN) from dme-2/+ pollen compared to wild type (WT) described in this study.
- https://cdn.elifesciences.org/articles/61894/elife-61894-supp2-v2.txt
-
Supplementary file 3
DEMETER (DME)-targeted accessible chromatin regions (ACRs) described in this study.
- https://cdn.elifesciences.org/articles/61894/elife-61894-supp3-v2.txt
-
Supplementary file 4
Differential gene expression analysis of wild-type (WT) and dme-2/+ pollen.
- https://cdn.elifesciences.org/articles/61894/elife-61894-supp4-v2.txt
-
Supplementary file 5
Pollen-tube related genes directly regulated by DEMETER (DME)-dependent demethylation.
- https://cdn.elifesciences.org/articles/61894/elife-61894-supp5-v2.txt
-
Supplementary file 6
H3K27me3-repressed accessible chromatin regions (ACRs) described in this study.
- https://cdn.elifesciences.org/articles/61894/elife-61894-supp6-v2.txt
-
Transparent reporting form
- https://cdn.elifesciences.org/articles/61894/elife-61894-transrepform-v2.docx
Download links
A two-part list of links to download the article, or parts of the article, in various formats.
Downloads (link to download the article as PDF)
Open citations (links to open the citations from this article in various online reference manager services)
Cite this article (links to download the citations from this article in formats compatible with various reference manager tools)
Epigenetic reprogramming rewires transcription during the alternation of generations in Arabidopsis
eLife 10:e61894.
https://doi.org/10.7554/eLife.61894


