Structure of bacterial phospholipid transporter MlaFEDB with substrate bound
- Department of Cell Biology, Skirball Institute of Biomolecular Medicine, New York University School of Medicine, United States
- Applied Bioinformatics Laboratories, New York University School of Medicine, United States
- Department of Microbiology, New York University School of Medicine, United States
Figures
Figure 1 with 5 supplements
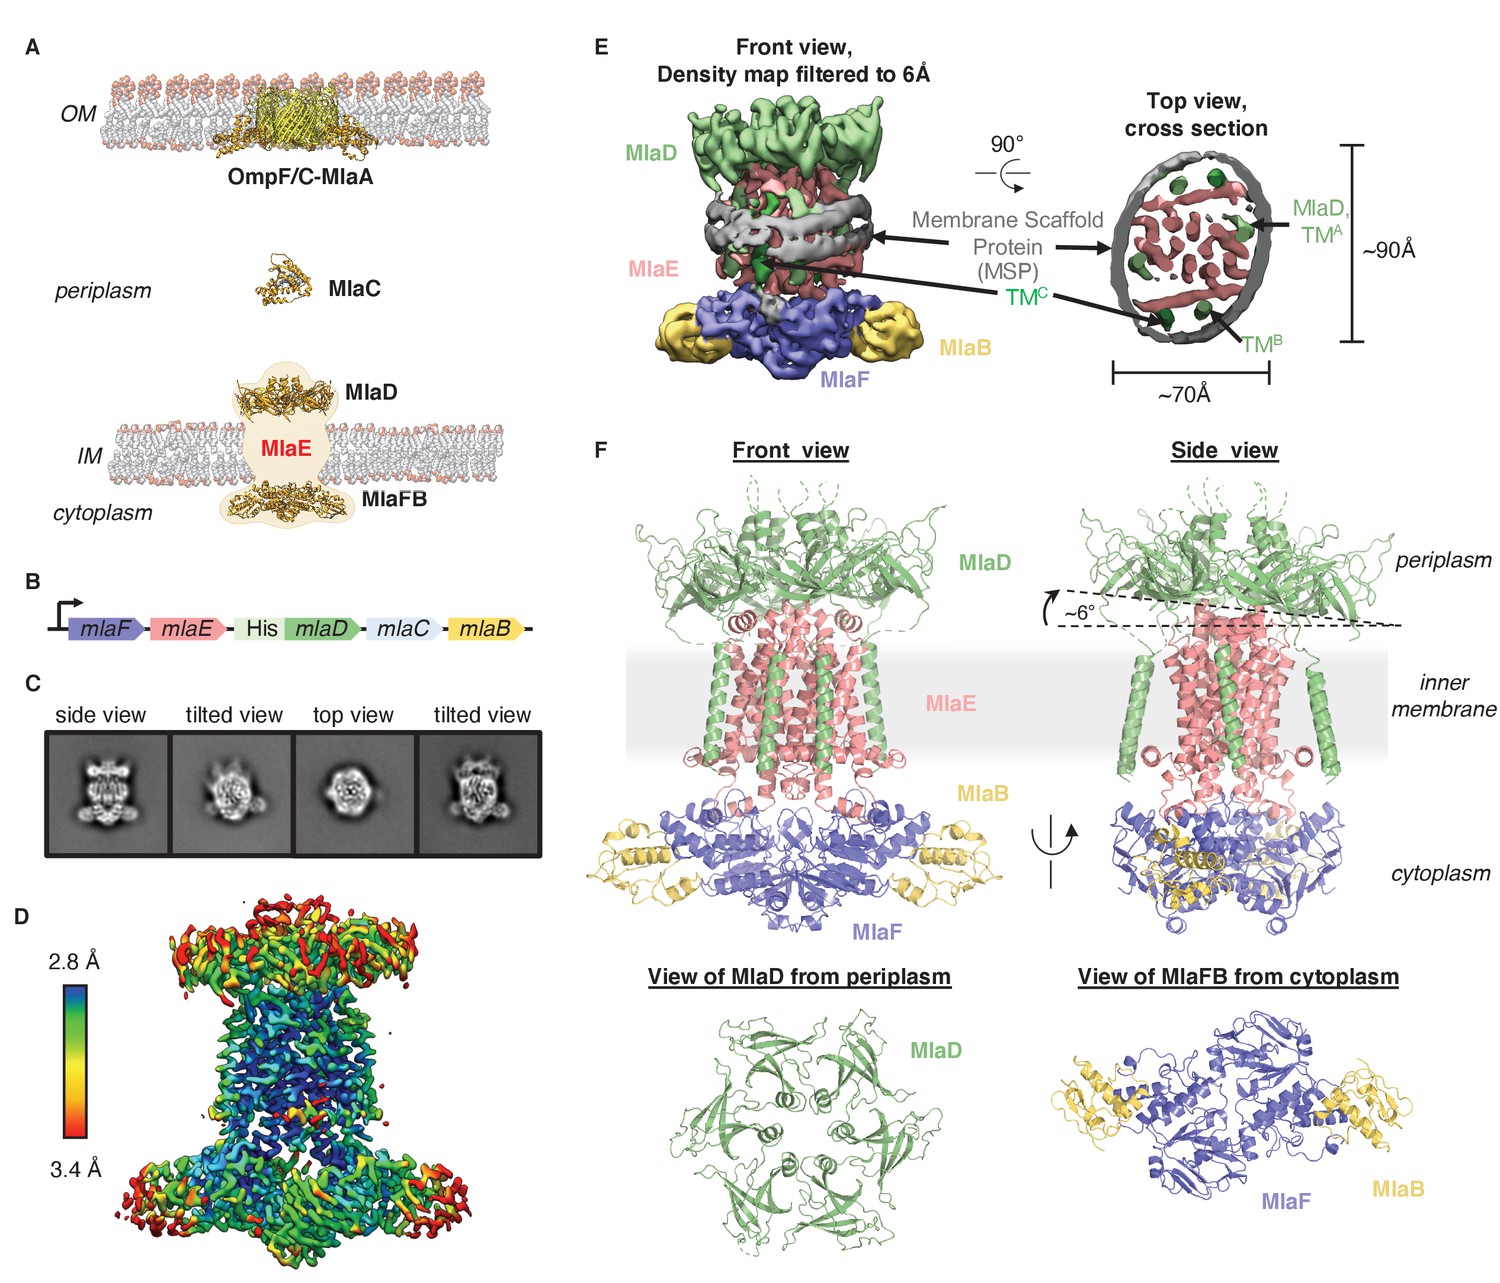
Cryo-EM structure of the MlaFEDB complex.
(A) Schematic of the Mla pathway (adapted from Kolich et al., 2020). The OmpC/F-MlaA complex (PDB 5NUP), periplasmic shuttle protein MlaC (PDB 5UWA), and MlaFEDB complex (PDB 5UW2 and 6XGY, EMDB-8610) are shown. (B) Schematic of the MlaFEDCB operon with N-terminal His-tag on MlaD, as reported previously (Ekiert et al., 2017). (C) 2D class averages from single-particle cryo-EM analysis of MlaFEDB in nanodiscs. (D) Final EM density map of MlaFEDB, colored by local resolution (EMD-22116). (E) Density map of MlaFEDB filtered to 6 Å, showing membrane scaffold protein (MSP) belts surrounding the edge of the lipid nanodisc. MlaF, slate blue; MlaE, pink; MlaD, green; MlaB, yellow; MSP, gray. The packing of the six TM helices from the MlaD subunits around the periphery of the MlaE core is apparent in the Top View. (F) Overview of the MlaF2E2D6B2 model (PDB 6XBD); colors as in E. Regions of disorder in MlaD linkers and C-termini are indicated by green dashed lines. The MlaD ring is tilted relative to MlaFEB, resulting in a complex that is asymmetric overall.
Figure 1—figure supplement 1
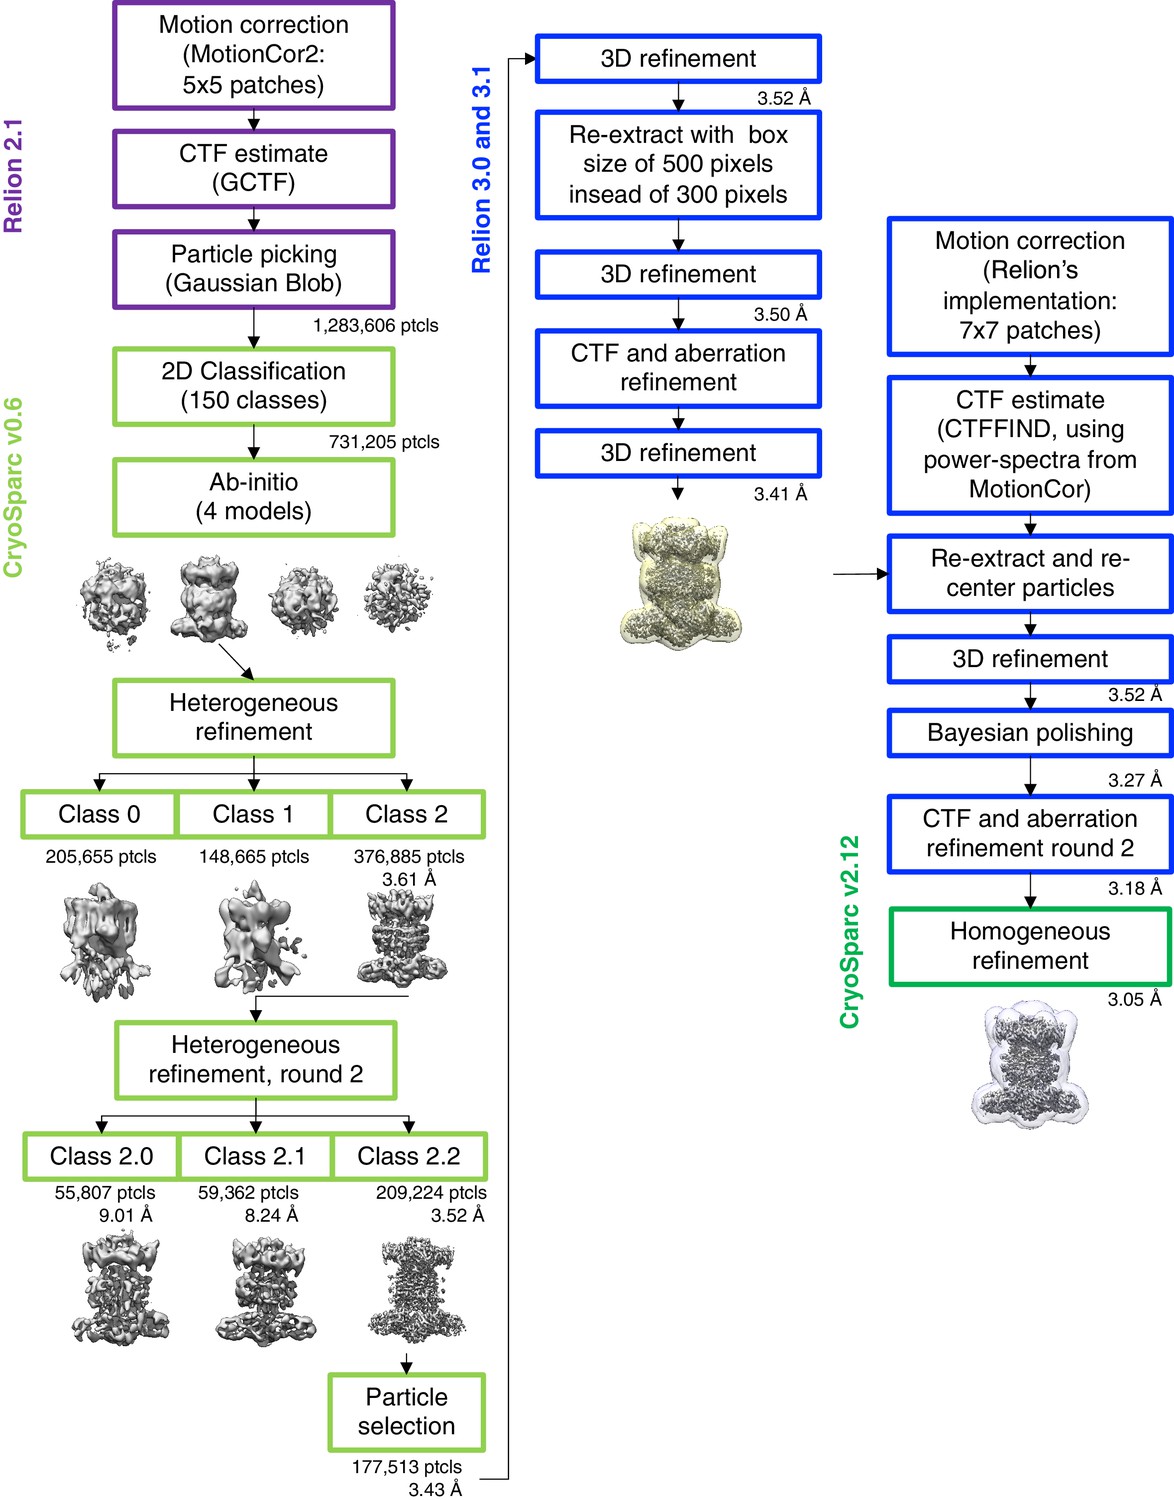
Cryo-EM data processing workflow.
In column 2, an intermediate map is shown with the mask used during reconstructions in RELION, and in column 3, the map is shown with the ‘mask_refine’ automatically computed by cryoSPARC.
Figure 1—figure supplement 2
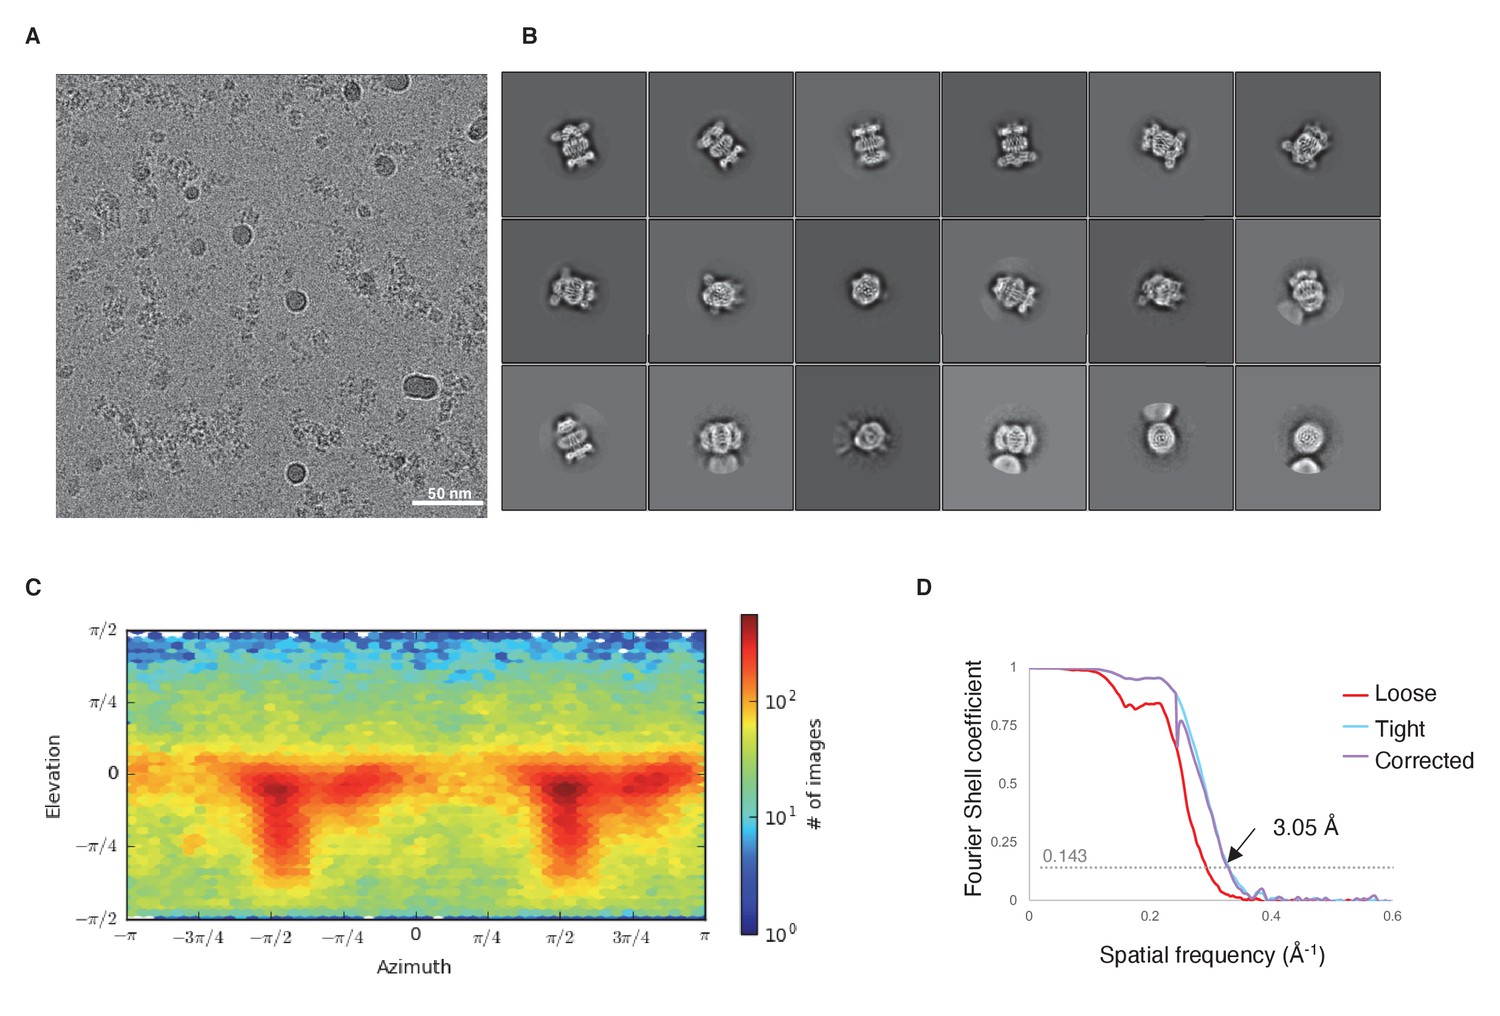
Cryo-EM data and analysis.
(A) Representative micrograph. (B) Representative 2D classes. (C) Viewing direction distribution of the final model from cryoSPARC. (D) Gold-standard FSC curve.
Figure 1—figure supplement 3
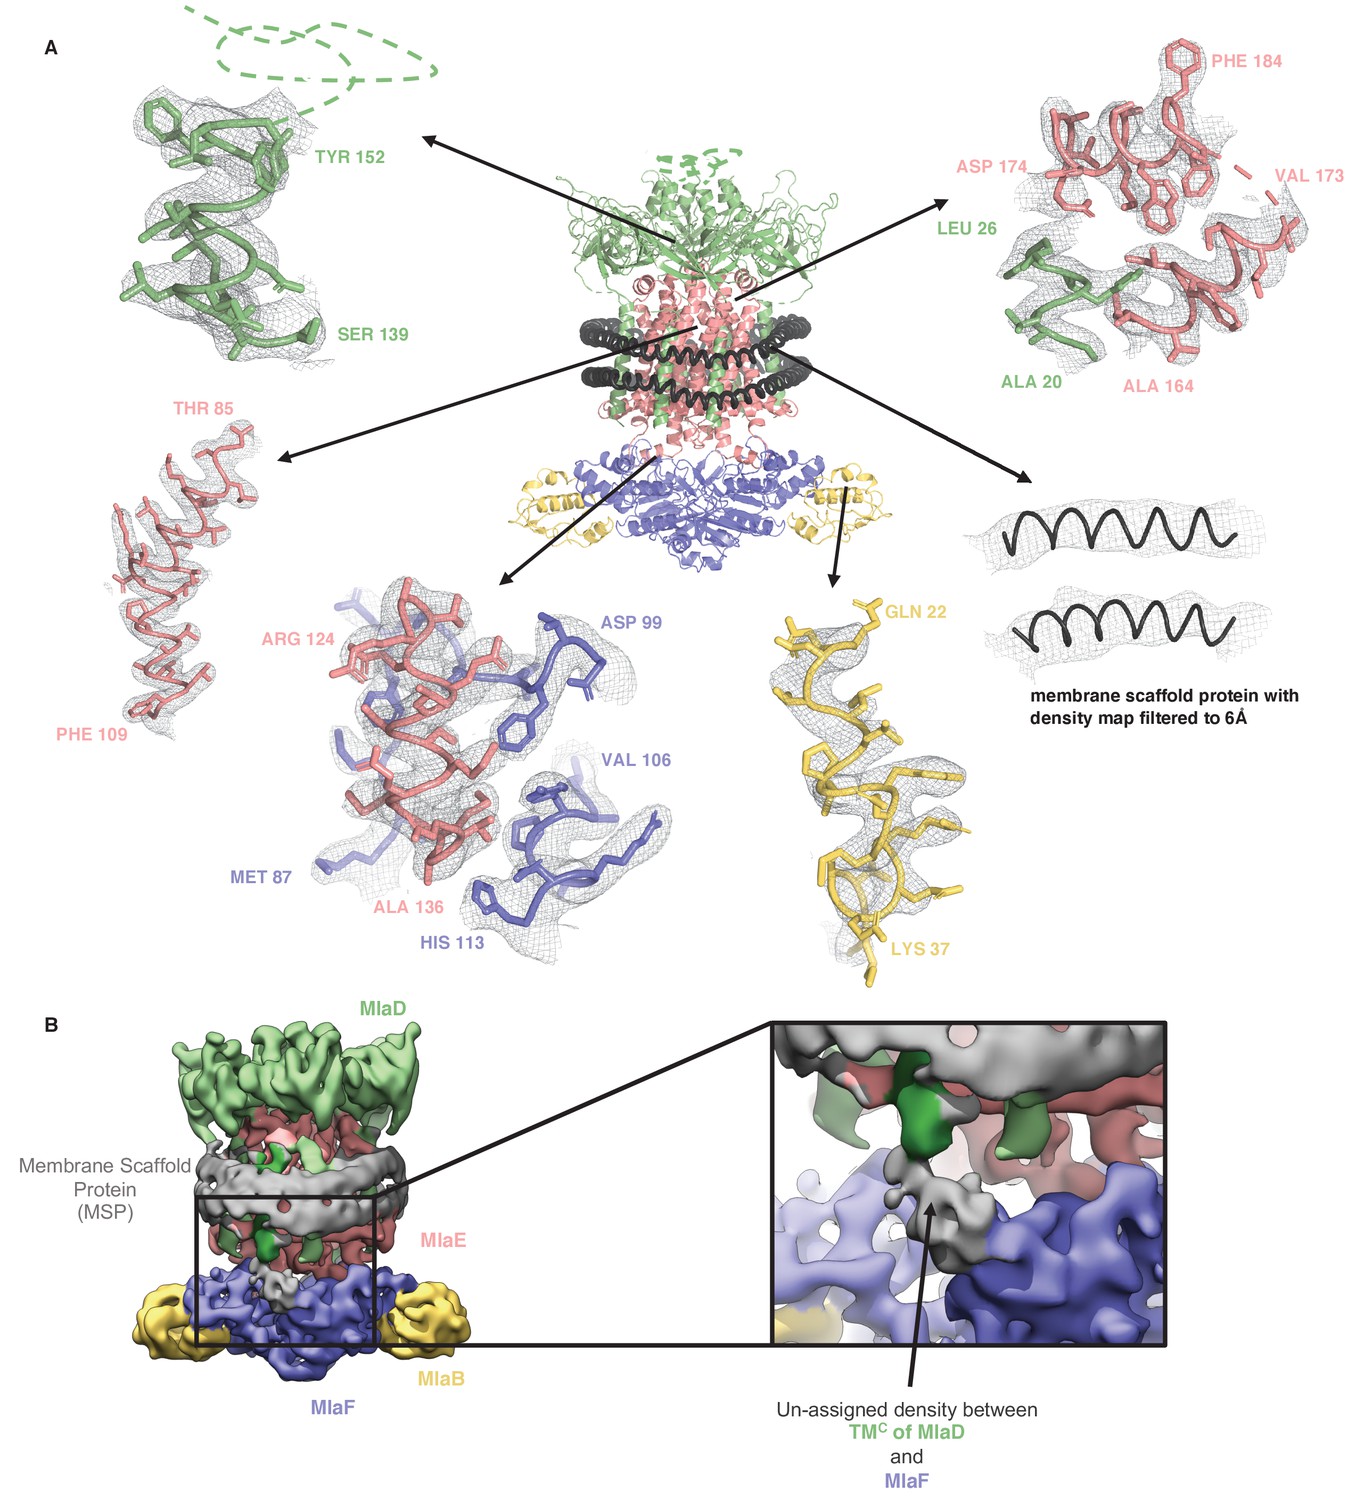
Representative density for MlaFEDB complex.
(A) Representative densities from the final map into which the model was built. (B) Density map filtered to 6 Å showing unmodeled density between TMC of MlaD (and TMF on the other side) and MlaF. This density is not well defined and may correspond to the His-Tag from MlaD, or an unknown ligand.
Figure 1—figure supplement 4
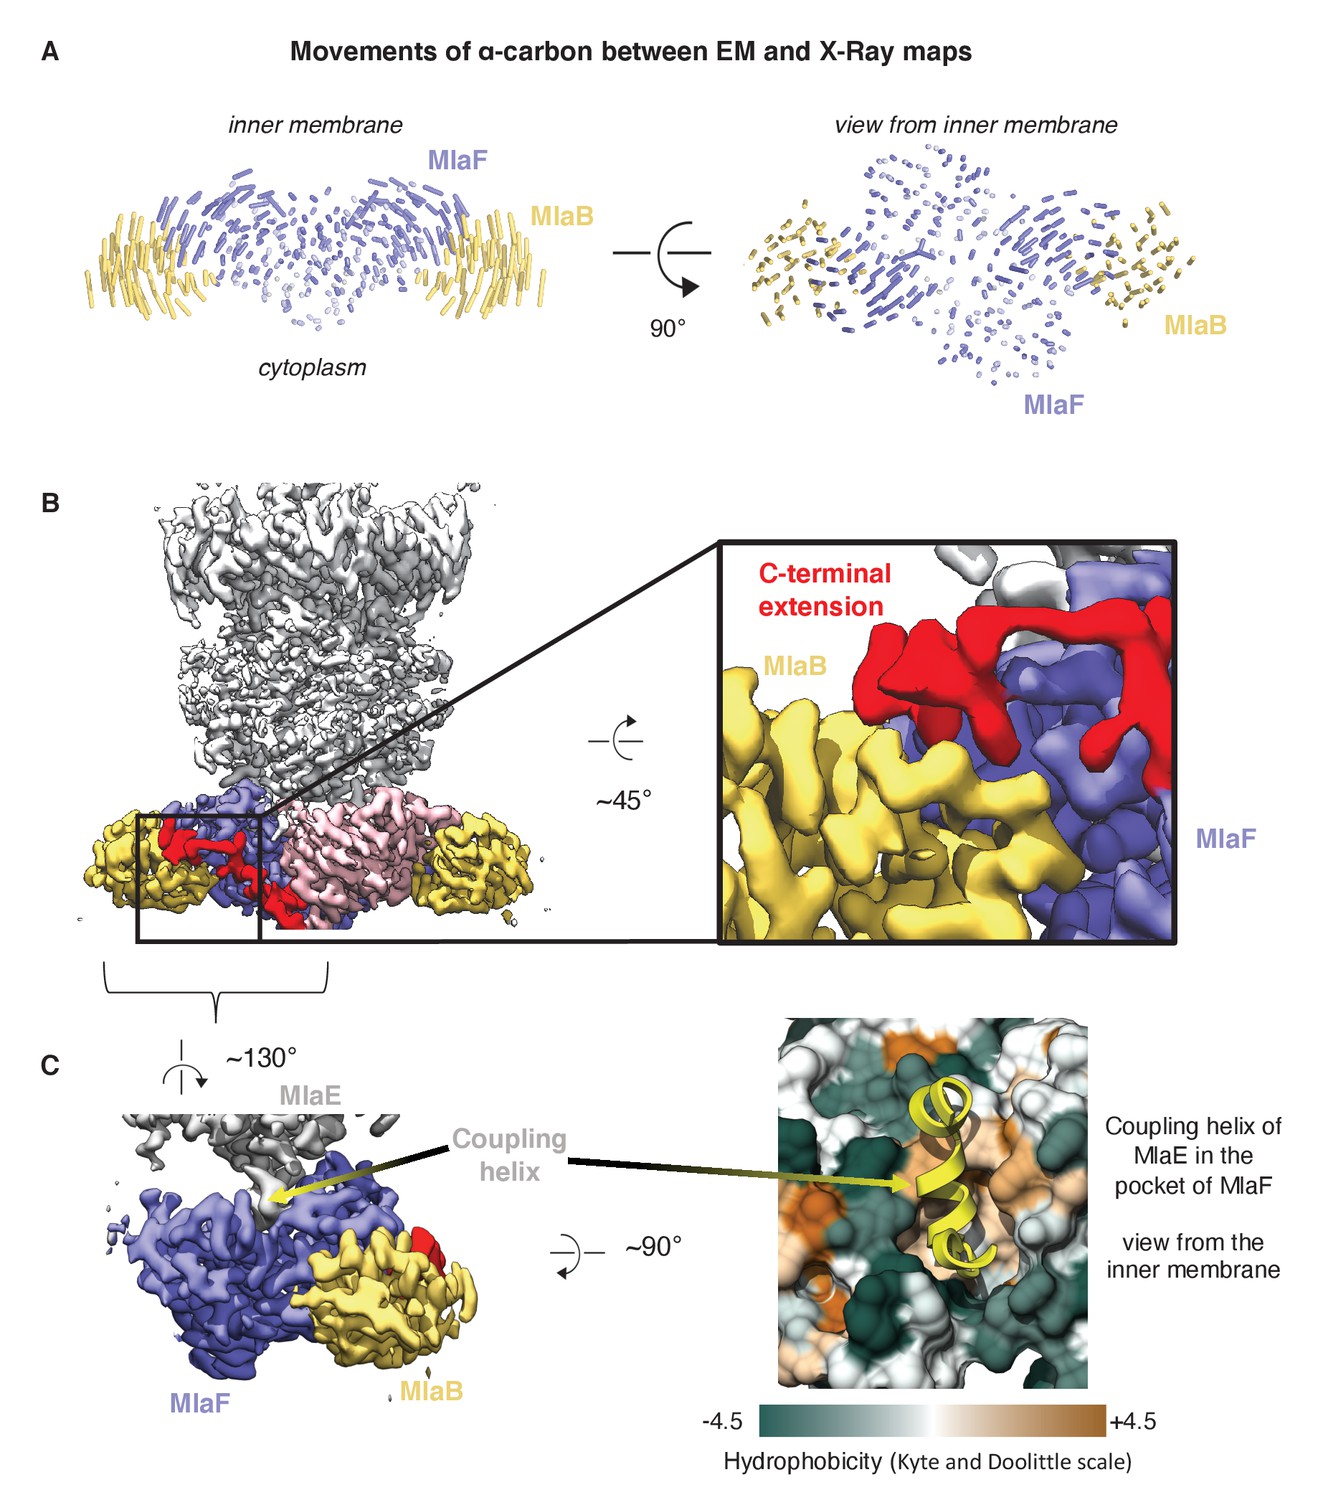
Comparison of MlaFB from X-ray and Cryo-EM structures.
(A) The EM (this study, PDB 6XBD) and X-ray ([Kolich et al., 2020] PDB: 6XGY) models were aligned on the MlaF dimer, and to illustrate differences, lines between alpha-carbons are shown using a modified version of the ColorByRMSD pymol script. (B) Cryo-EM density map of MlaFEDB. The C-terminal extension (red) of one MlaF monomer (pink) wraps around the other MlaF monomer (slate blue), placing a small helix at the MlaF/MlaB interface, consistent with the X-ray structure of MlaFB alone (Kolich et al., 2020). (C) Interaction between MlaF and the coupling helix of MlaE in the cryo-EM structure.
Figure 1—figure supplement 5
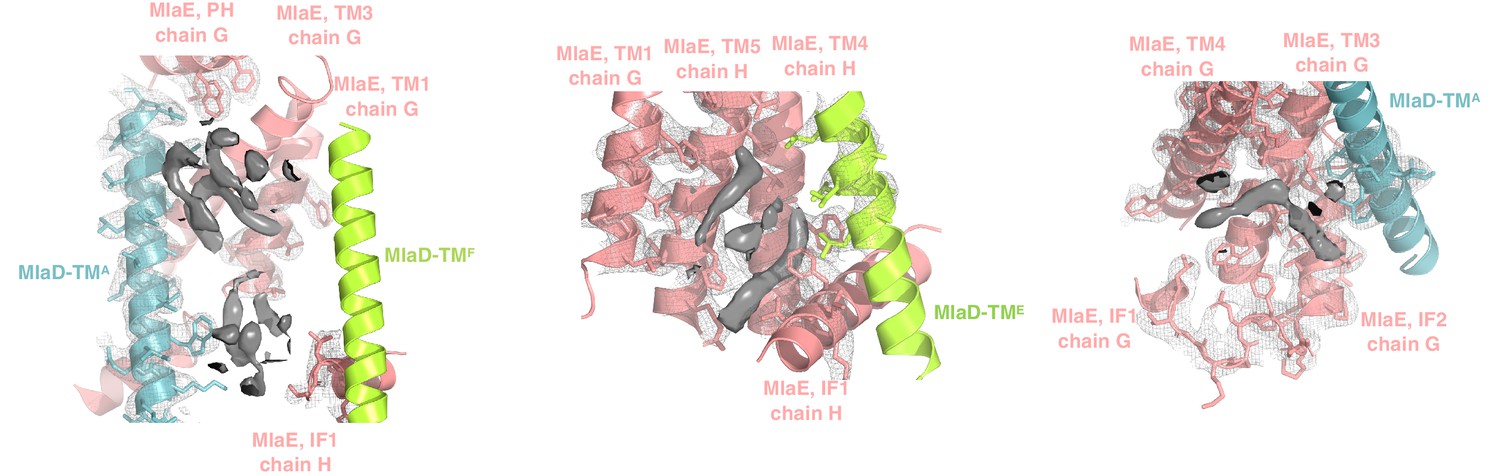
Extra densities in the transmembrane region.
Elongated densities around the TM region and in the cleft formed by IF1 are shown in solid gray, which could potentially be either phospholipids or other molecules. Due to the ambiguous nature of the densities, we have not modeled any coordinates in these regions.
Figure 2 with 2 supplements
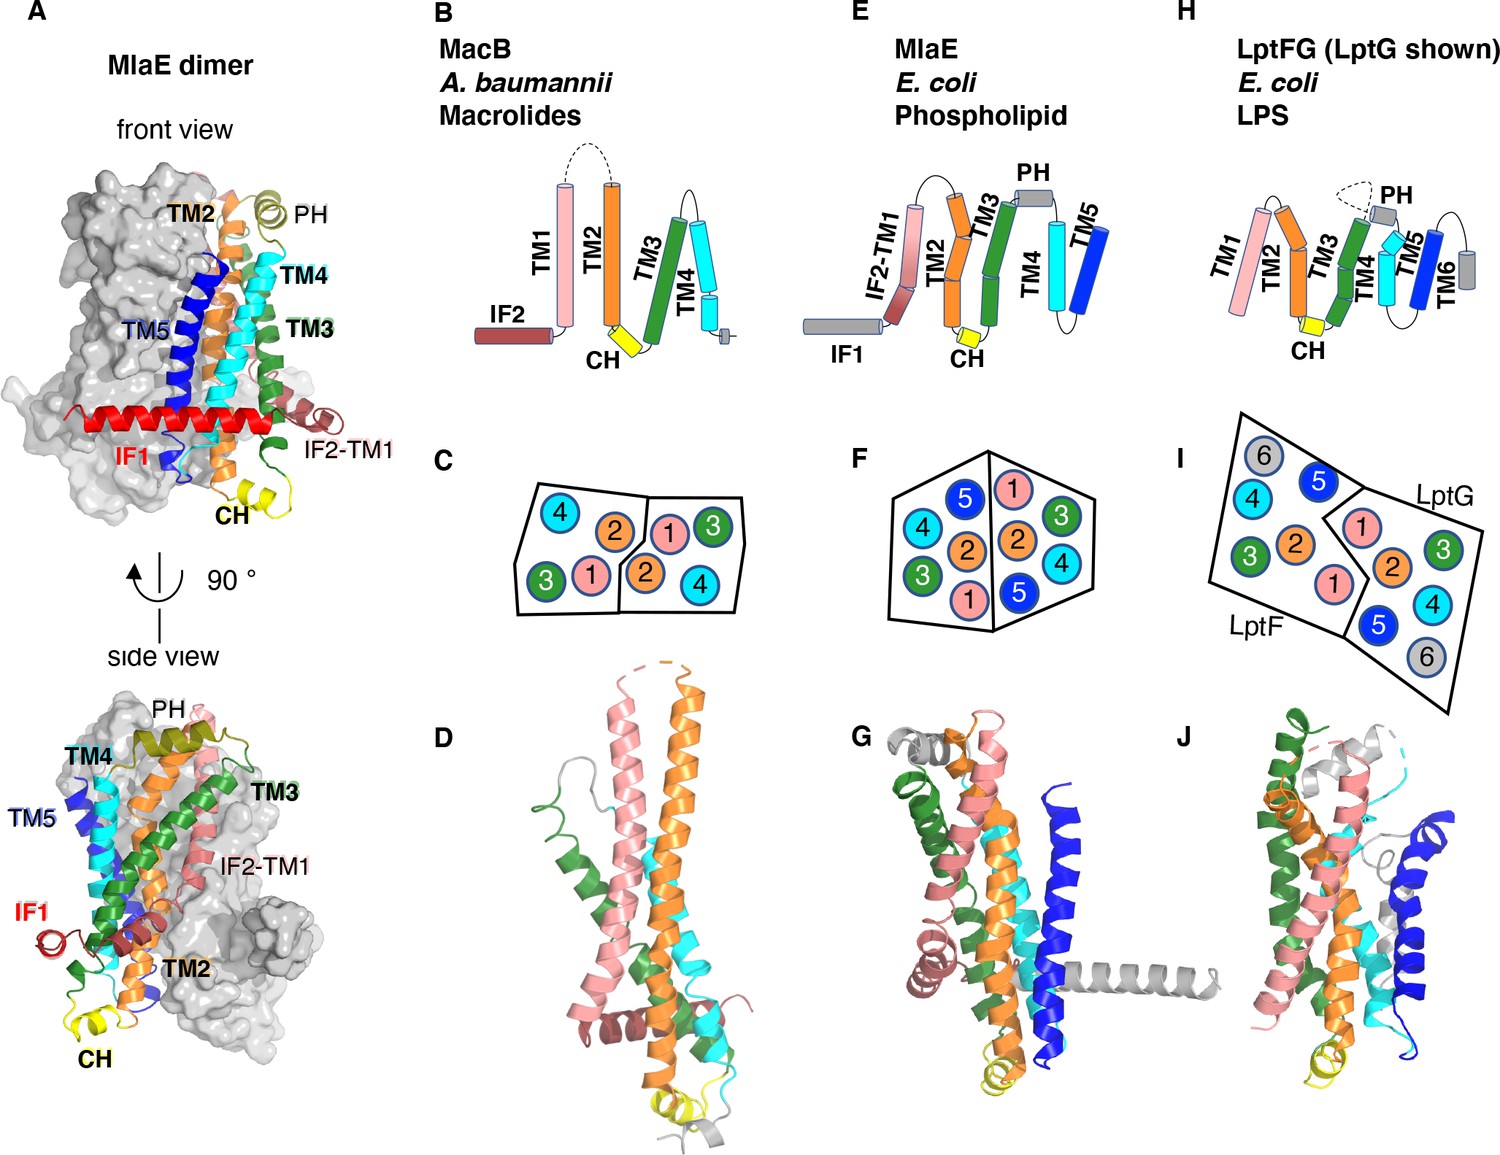
Topology and fold of MlaE.
(A) MlaE dimer, with one protomer represented as surface, and the other as cartoon. (B–J) comparison of MlaE (PDB 6XBD) with the related transmembrane domains of ABC transporters, MacB and LptFG (PDB 5GKO and 6MHZ). (B, E, H) Topology diagrams. CH, coupling helix; PH, periplasmic helix; IF, interfacial helix (also called connecting helix in ABCG transporters); TM, transmembrane helix. (C, F, I) Schematics representing helices at the dimer interface, viewed from the periplasm (each circle represents a helix). (D, G, J) Cartoon view of monomer. See Figure 2—figure supplement 1 for comparisons with additional related transporters.
Figure 2—figure supplement 1
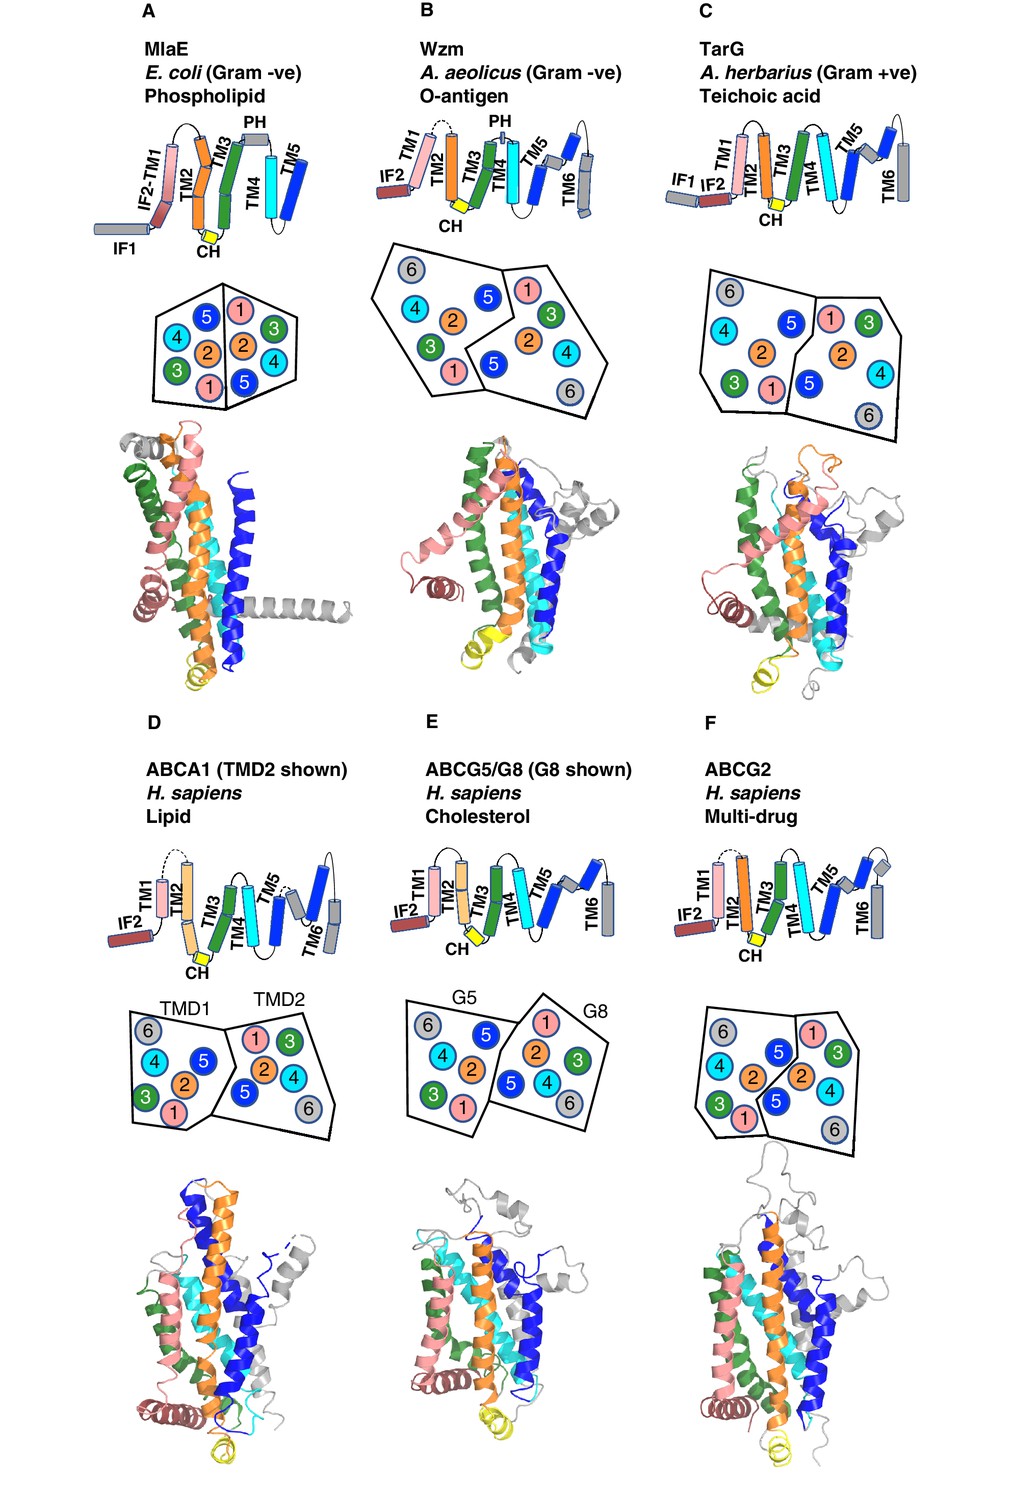
Comparison of MlaE to other ABC transporters.
(A) MlaE, this paper, PDB 6XBD; (B) O-antigen transporter, PDB 6OIH; (C) TarG, PDB 6JBH; (D) ABCA1, PDB 5XJY, TMD2 shown; (E) ABCG5/G8, PDB 5DO7, G8 shown; (F) ABCG2, PDB 6HBU. Topology diagrams (first row); schematics representing helices at the dimer interface, viewed from the periplasm (each circle represents a helix) (second row); and cartoon views of monomers (third row) are shown.
Figure 2—figure supplement 2
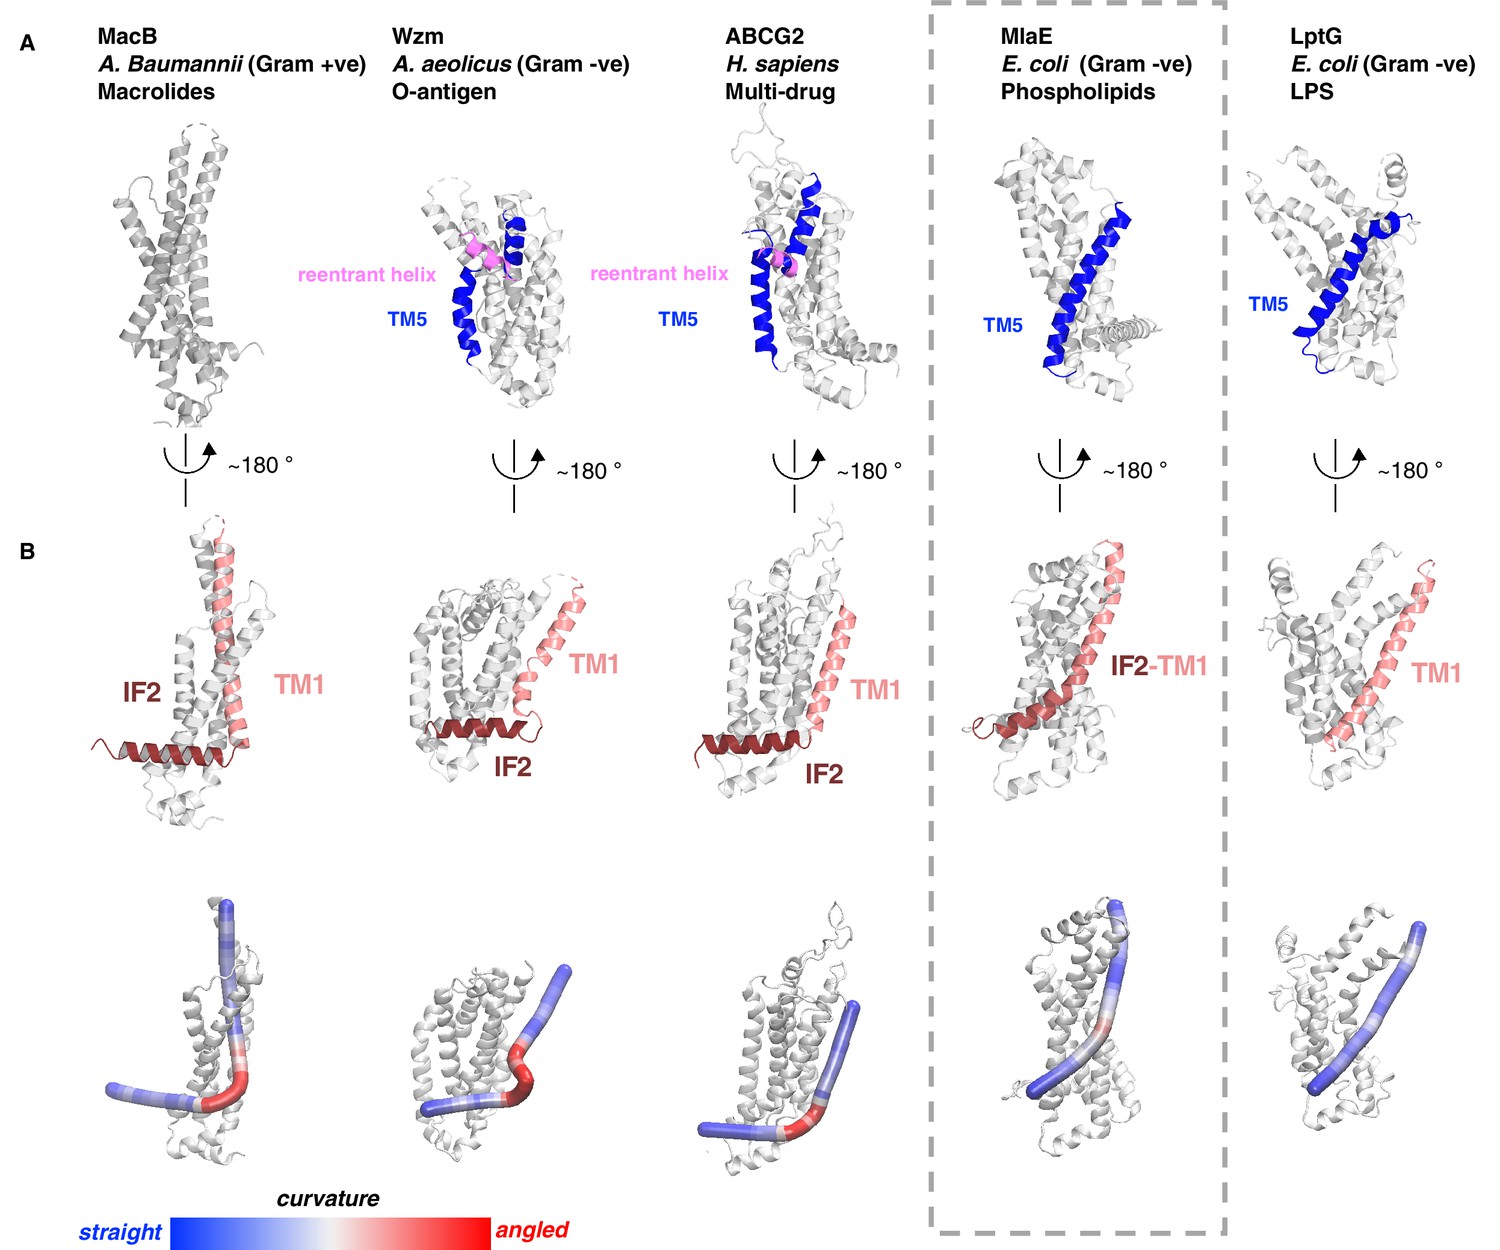
Structural variation in MlaE TMD compared to other ABC transporters.
(A) TM5 helices (blue) are either a single continuous helix (MlaE, PDB 6XBD; LptG, PDB 6MHZ), a reentrant helix insertion (pink) (Wzm, PDB 6OIH; ABCG2, PDB 6HBU), or no helix (MacB, PDB 5GKO). (B) IF2 (brown) and TM1 (salmon) helices adopt a range of conformations, from IF2 being parallel to the membrane interface and forming a sharp angle with TM1 (left) to one continuous smooth helix for LptG (right). Top row, cartoon representation; bottom row, curvature color coded using Bendix (Dahl et al., 2012).
Figure 3 with 3 supplements
TM helices of MlaD are important for interaction with MlaE.
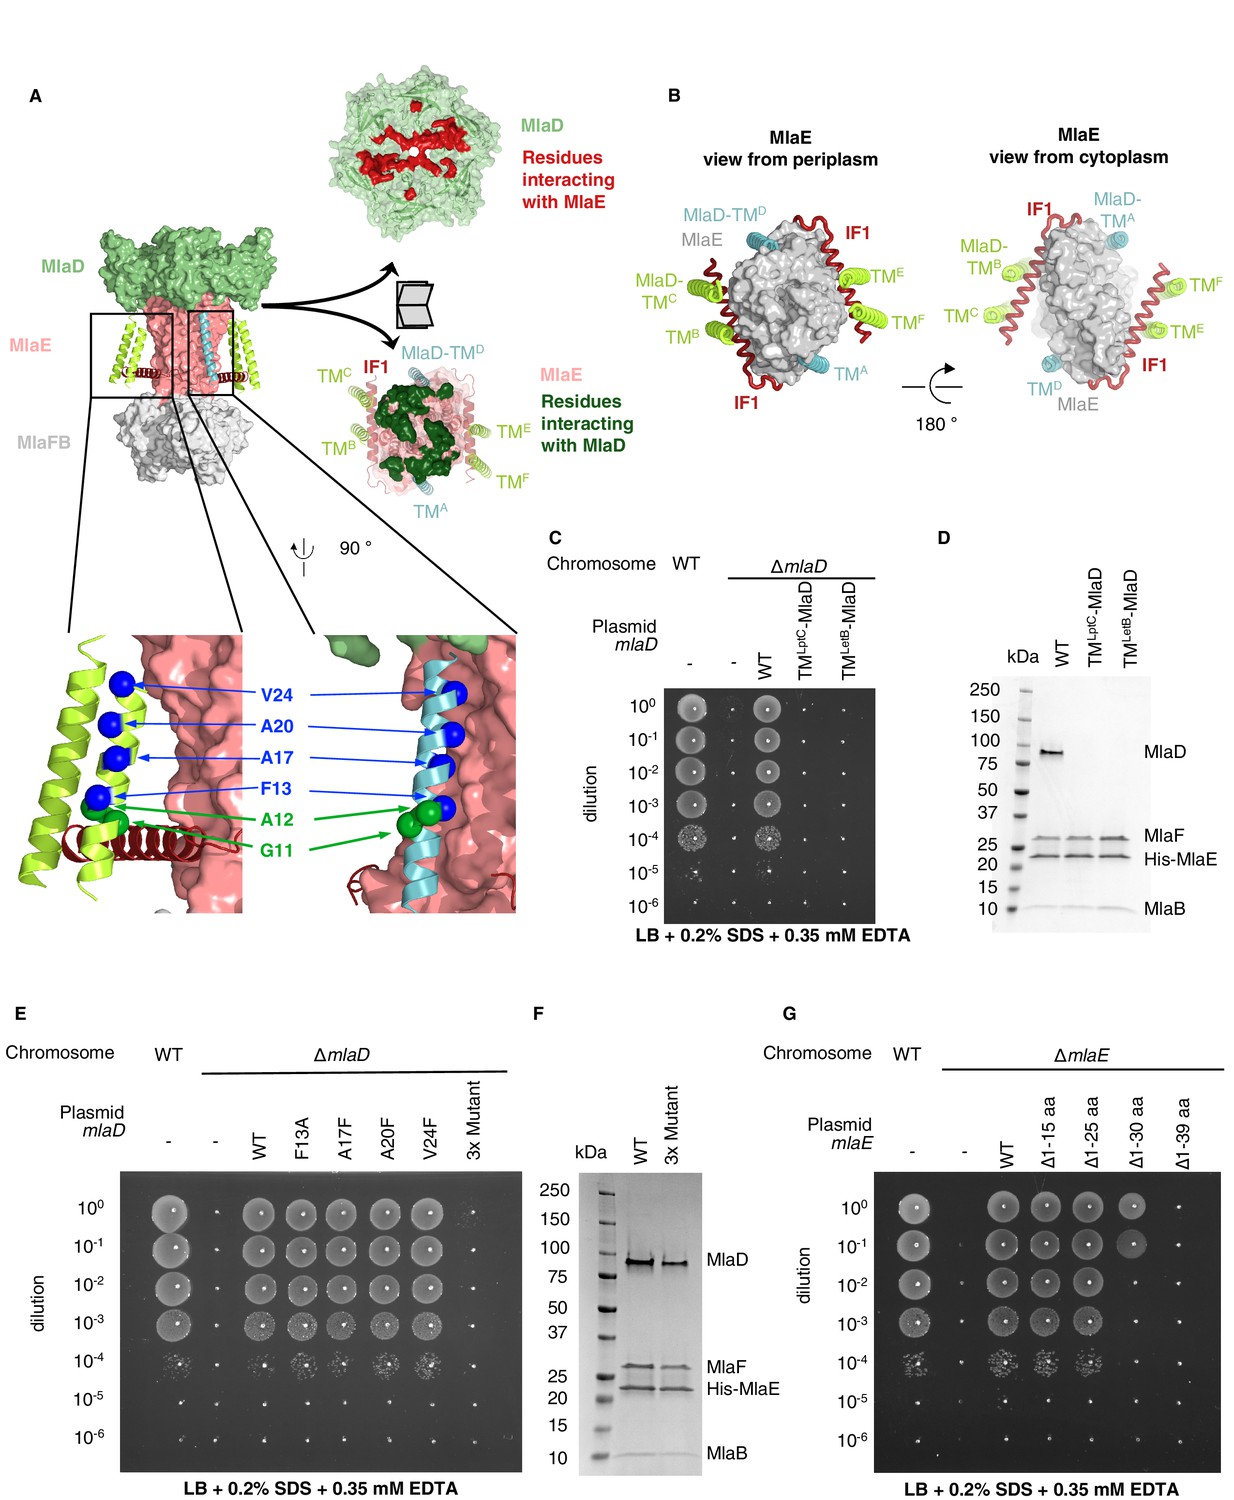
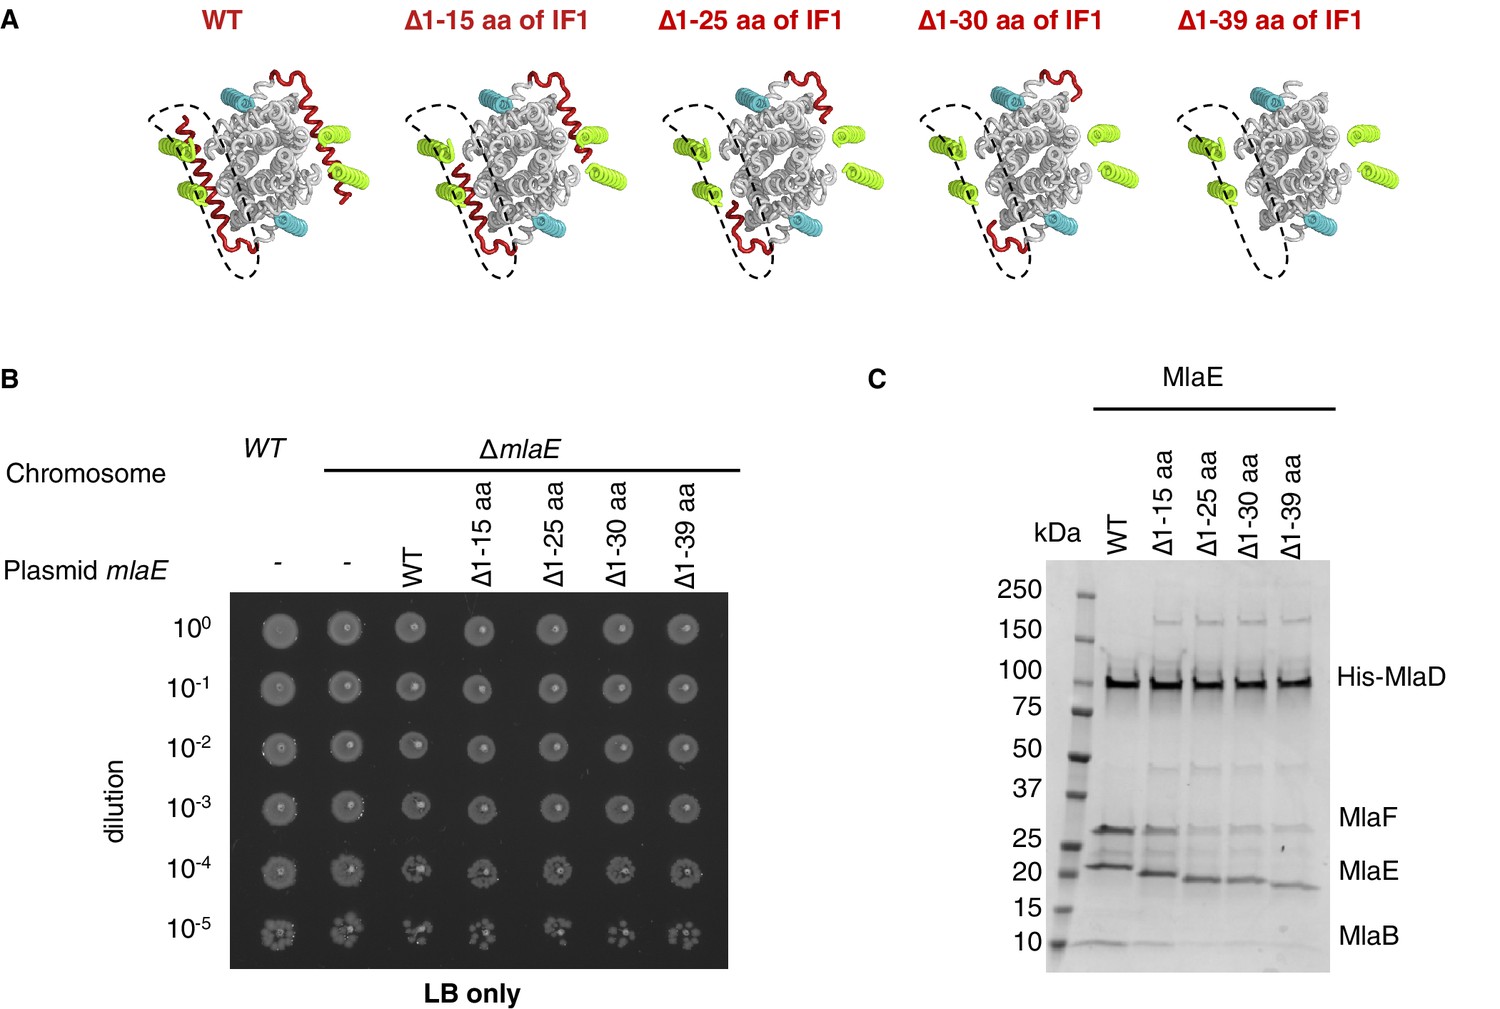
(A) Structure of MlaFEDB complex, highlighting interacting regions between MlaE and MlaD. MlaD-TMA/D (cyan helices) interact with the core domain of MlaE (pink surface); MlaD-TMB/C/E/F (green helices) interact mostly with IF1 (red helices). The periplasmic end of the MlaE dimer interacts with the MlaD ring (shown in ‘open book’ representation, right). MlaD residues that interact with MlaE are shown in red, and MlaE residues that interact with MlaD are shown in green, as determined using COCOMAPS (Vangone et al., 2011). Below, a zoom of the positions on the TM helices of MlaD mutated to test interactions either with IF1 (green spheres) or the TM helices of MlaE (blue spheres) (related to panel E), (F) and (Figure 3—figure supplement 2C-E). (B) Periplasmic and cytoplasmic views highlighting the interaction between helices of MlaE and MlaD. Helices colored as in (A). (C) Genetic complementation of mlaD knockout with MlaD TM chimeras. 10-fold serial dilutions of the indicated cultures spotted on LB plates containing SDS+EDTA at the concentrations indicated, and incubated overnight. The mlaD knockout does not grow in the presence of SDS+EDTA, but can be rescued by the expression of WT MlaD from a plasmid. MlaD chimeras containing LptC or LetB TM helices fail to complement. Corresponding controls plated on LB only can be found in Figure 3—figure supplement 2A. (D) SDS-PAGE of recombinantly expressed and purified complexes formed in the presence of WT MlaD or MlaD chimeras containing LptC or LetB TM helices. (E) Genetic complementation of mlaD knockout with MlaD TM mutants. The assay is performed as in (C). F13A, A17F, A20F, V24F mutants complement, while a triple mutant (A17F/A20F/V24F; ‘3x Mutant’) fails to complement. Corresponding controls plated on LB only can be found in Figure 3—figure supplement 2C. (F) SDS-PAGE of recombinantly expressed and purified complexes formed in the presence of WT MlaD or the MlaD 3x Mutant. (G) Genetic complementation of mlaE knockout with MlaE IF1 truncation mutants. The assay is performed as in (C). Small deletions of the N-terminus of MlaE IF1 are tolerated, while larger deletions impair or completely abolish growth. Corresponding controls plated on LB only can be found in Figure 3—figure supplement 2D.
Figure 3—figure supplement 1
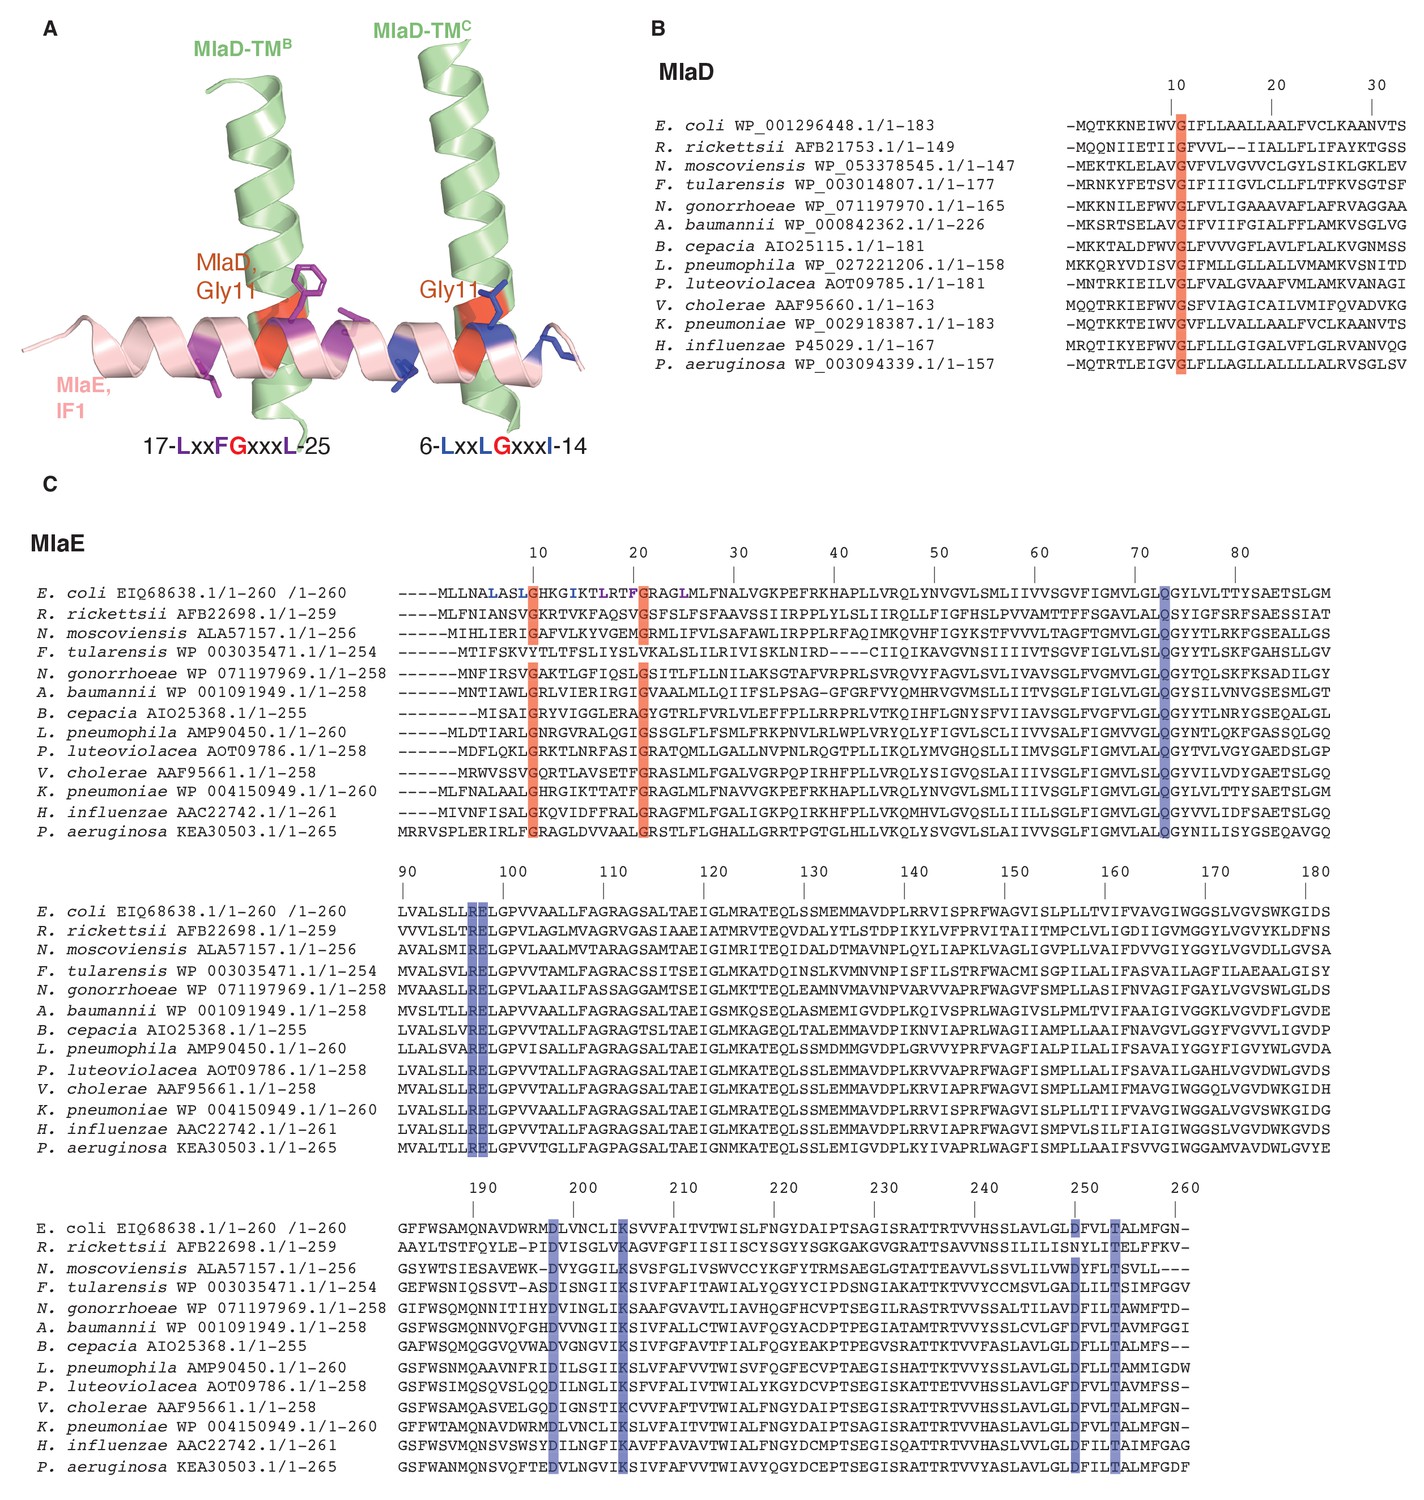
Sequence conservation in MlaD and MlaE.
(A) Conserved motifs are depicted at the interface between MlaE IF1 and the TM helices of MlaD. (B) Sequence alignment of MlaD (TM helix only) and (C) MlaE from 13 diverse bacterial species. Red, conserved glycine residues that are part of the interaction between IF1 and the TM helices of MlaD. Blue, the conserved residues that are part of the salt bridge and polar interactions around R97. Residue numbers correspond to E. coli sequences. Sequence alignments were done with MUSCLE (Edgar, 2004) implemented within Phenix.
Figure 3—figure supplement 2
Extended data for MlaD mutants.
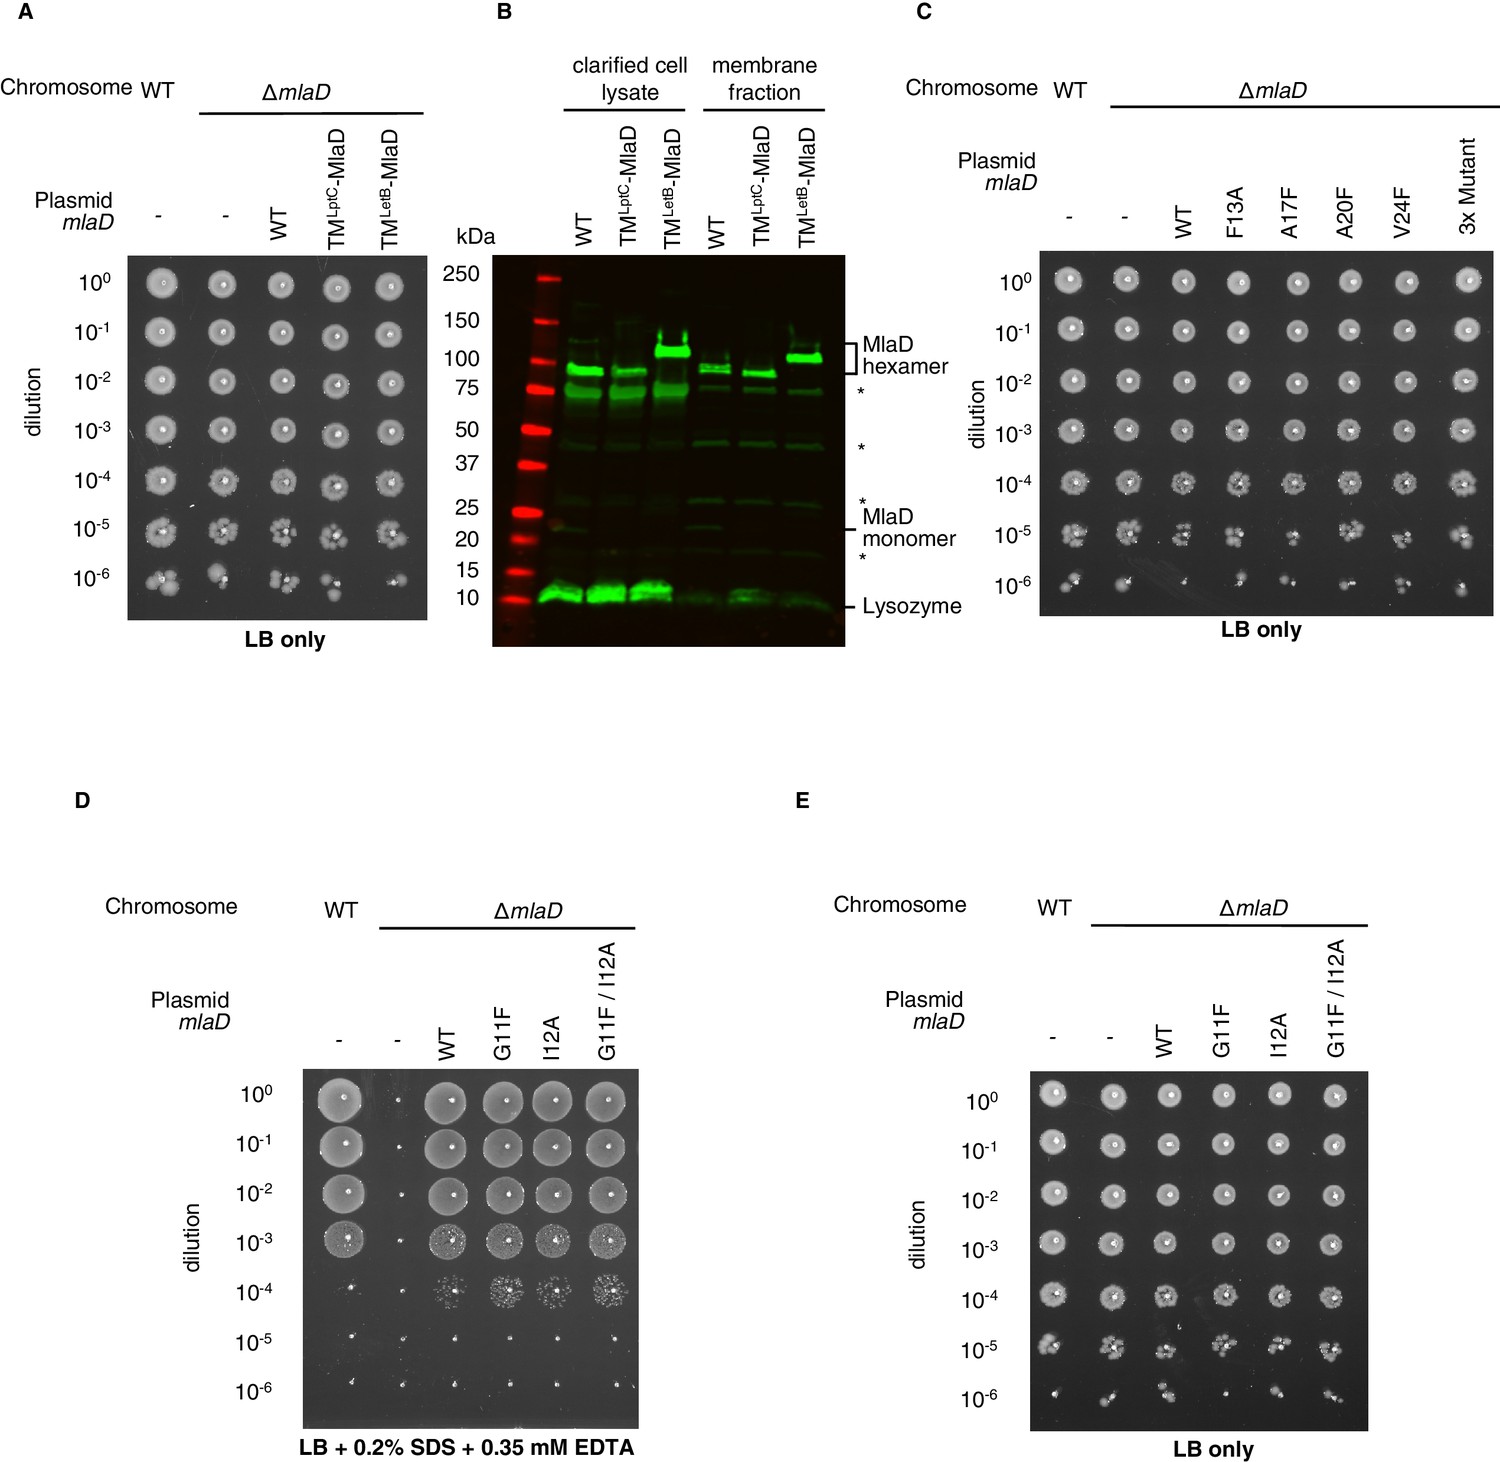
(A) Tenfold serial dilutions of the indicated cultures spotted on LB agar and incubated overnight (control for data in Figure 3C). (B) Western blot using an anti-MlaD antibody against wild-type and mutant forms of MlaD, showing expression levels in the cell lysate and membrane fraction after overexpression. Bands for MlaD monomer and hexamer are annotated, in addition to a band corresponding to lysozyme (used in the purification protocol). Asterisk denotes non-specific bands, also observed in an mlaD knockout strain. (C) Tenfold serial dilutions of the indicated cultures spotted on LB agar and incubated overnight (control for data in Figure 3E). (D) Genetic complementation of mlaD knockout with MlaD TM mutants. 10-fold serial dilutions of the indicated cultures spotted on LB plates containing SDS+EDTA at the concentrations indicated, and incubated overnight. The mlaD knockout does not grow in the presence of SDS+EDTA, but can be rescued by the expression of WT MlaD from a plasmid. All MlaD mutants complement. (E) Controls corresponding to (D), plated on LB only.
Figure 3—figure supplement 3
Extended data for MlaE mutants.
(A) Illustration of the IF1 truncation mutants used in genetic complementation assays (related to Figure 3G). (B) 10-fold serial dilutions of the indicated cultures spotted on LB agar and incubated overnight (control for data in Figure 3G). (C) SDS-PAGE of recombinantly expressed and co-purified MlaFEDB complexes with truncations of MlaE IF1 (as in (A)), purified by pulling down His-MlaD.
Figure 4 with 5 supplements
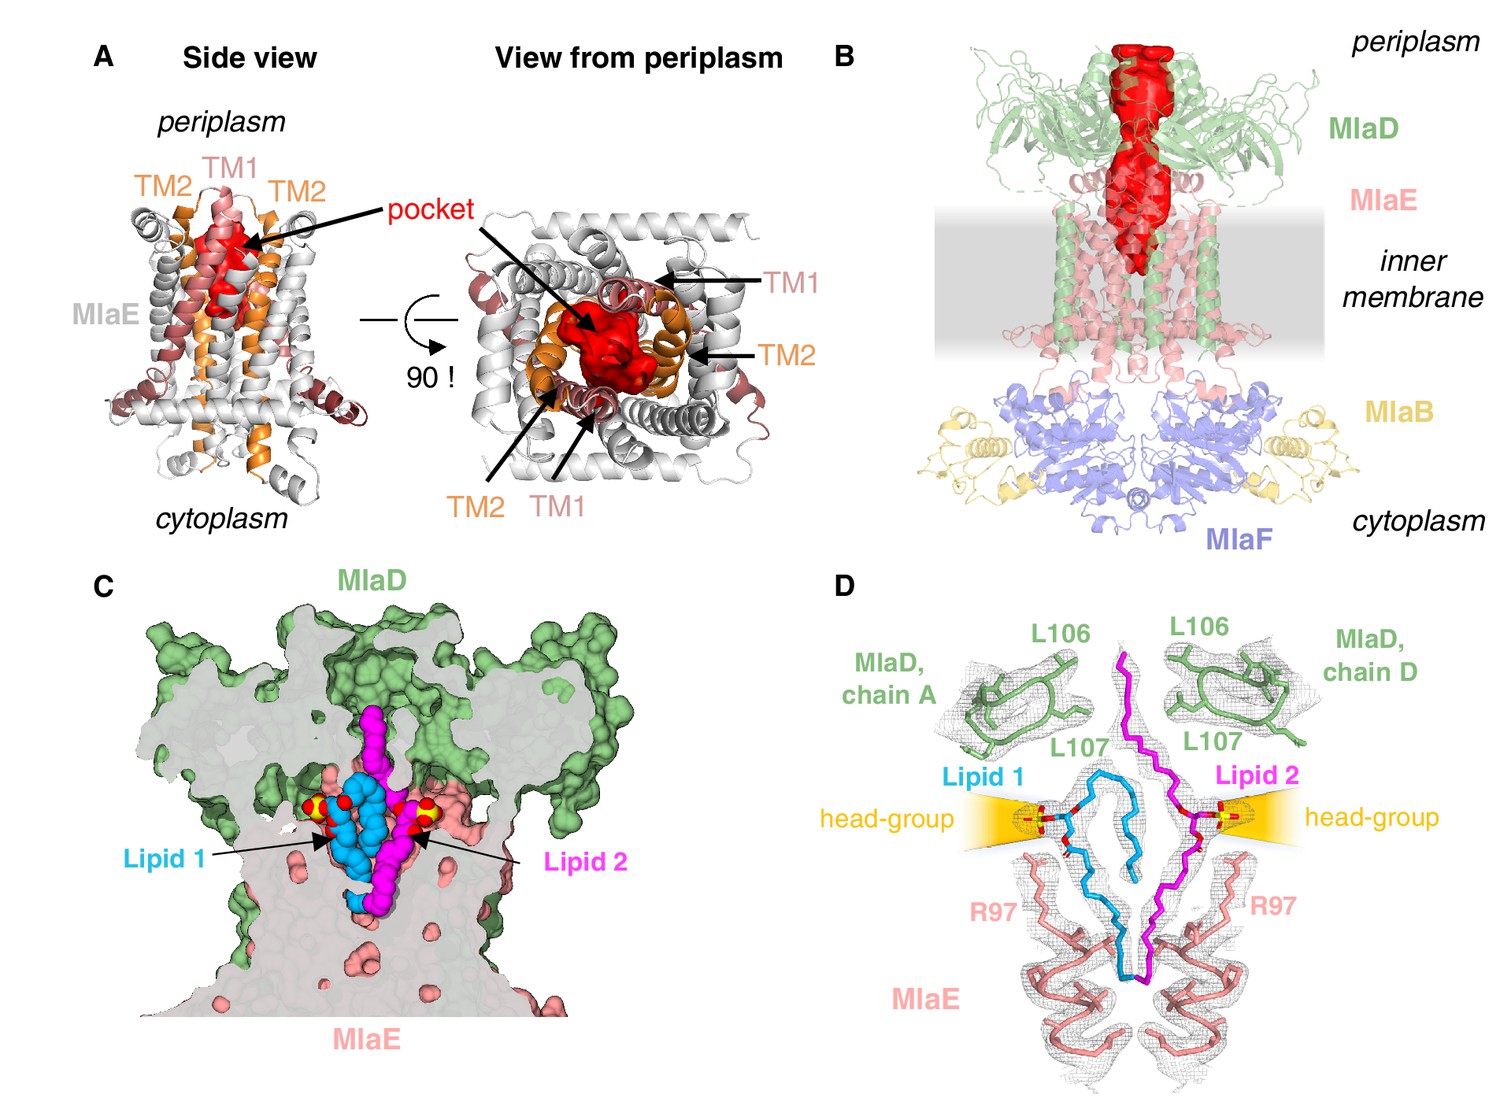
Lipids are bound in an outward-open pocket formed by MlaE and MlaD.
(A) Side view (left) and view from periplasm (right) of MlaE dimer highlighting the outward-open pocket formed by TM1 (salmon helices) and TM2 (orange helices). The boundary of the substrate-binding pocket was estimated using CASTp (Tian et al., 2018), and is displayed as a red surface. (B) Side view of MlaFEDB complex, showing the continuous hydrophobic channel running from the substrate-binding pocket in MlaE to the periplasmic space, through the pore of MlaD (red, tunnel boundary estimated with HOLLOW [Ho and Gruswitz, 2008]). (C) Side view cross-section of the hydrophobic channel between MlaE and MlaD showing two bound phospholipids in blue and magenta. (D) Lipids modeled with surrounding structural elements and key residues highlighted. EM density map is shown as mesh, at the same contour level for lipids and surrounding regions. The lateral channels that could accommodate lipid head groups are indicated by orange cones.
Figure 4—figure supplement 1
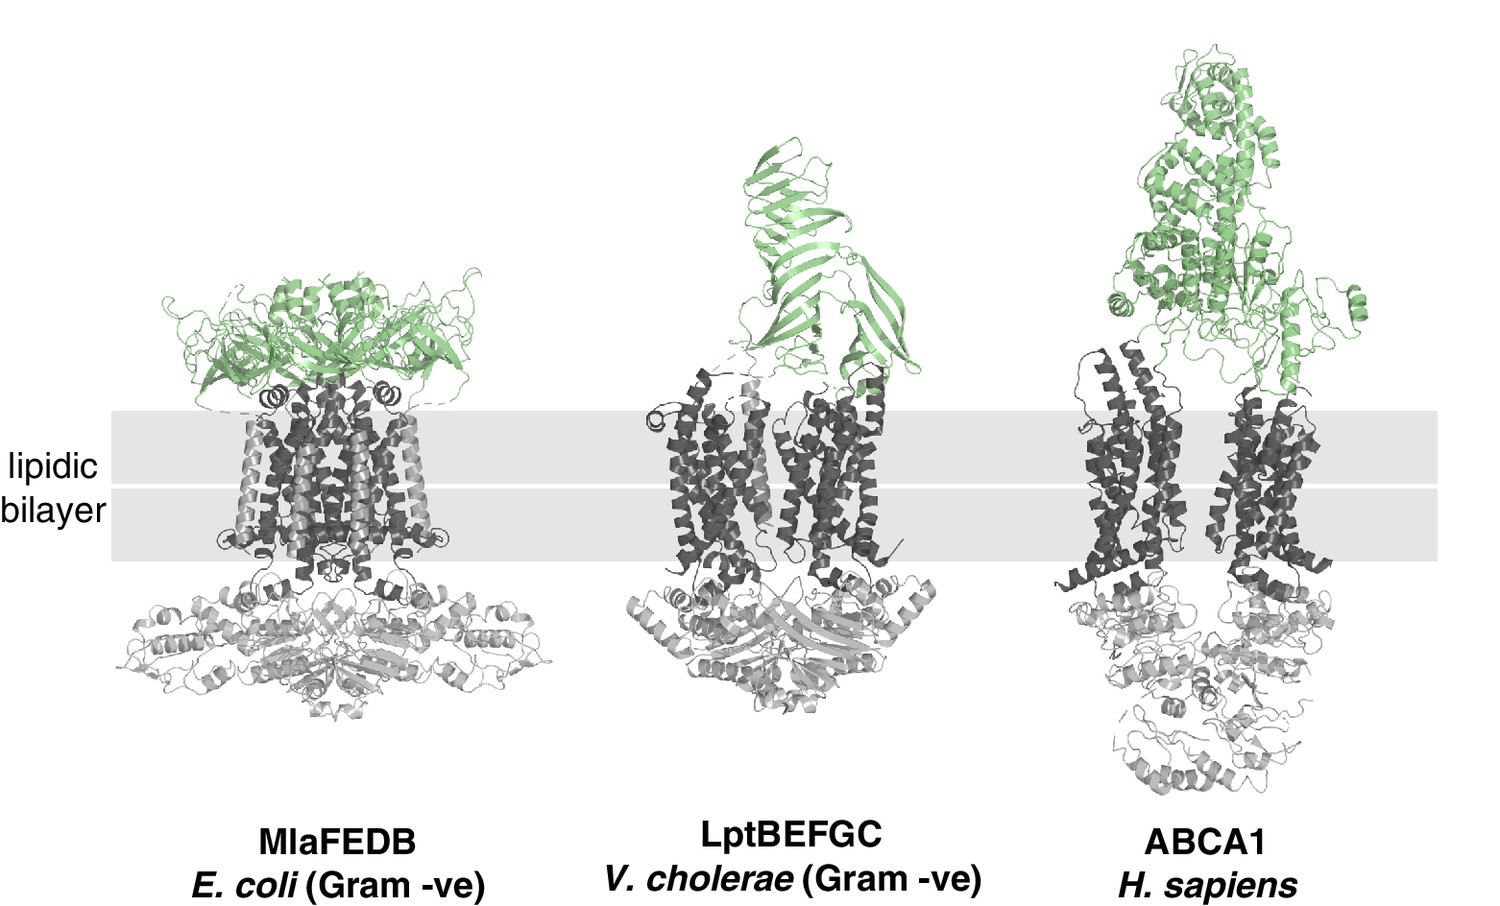
Structural diversity of extracytoplasmic lipid transport domains.
Extracytoplasmic lipid transport domains (green) from ABC transporters. MlaFEDB, PDB 6XBD; LptBEFGC, PDB 6MJP; ABCA1, PDB 5XJY.
Figure 4—figure supplement 2
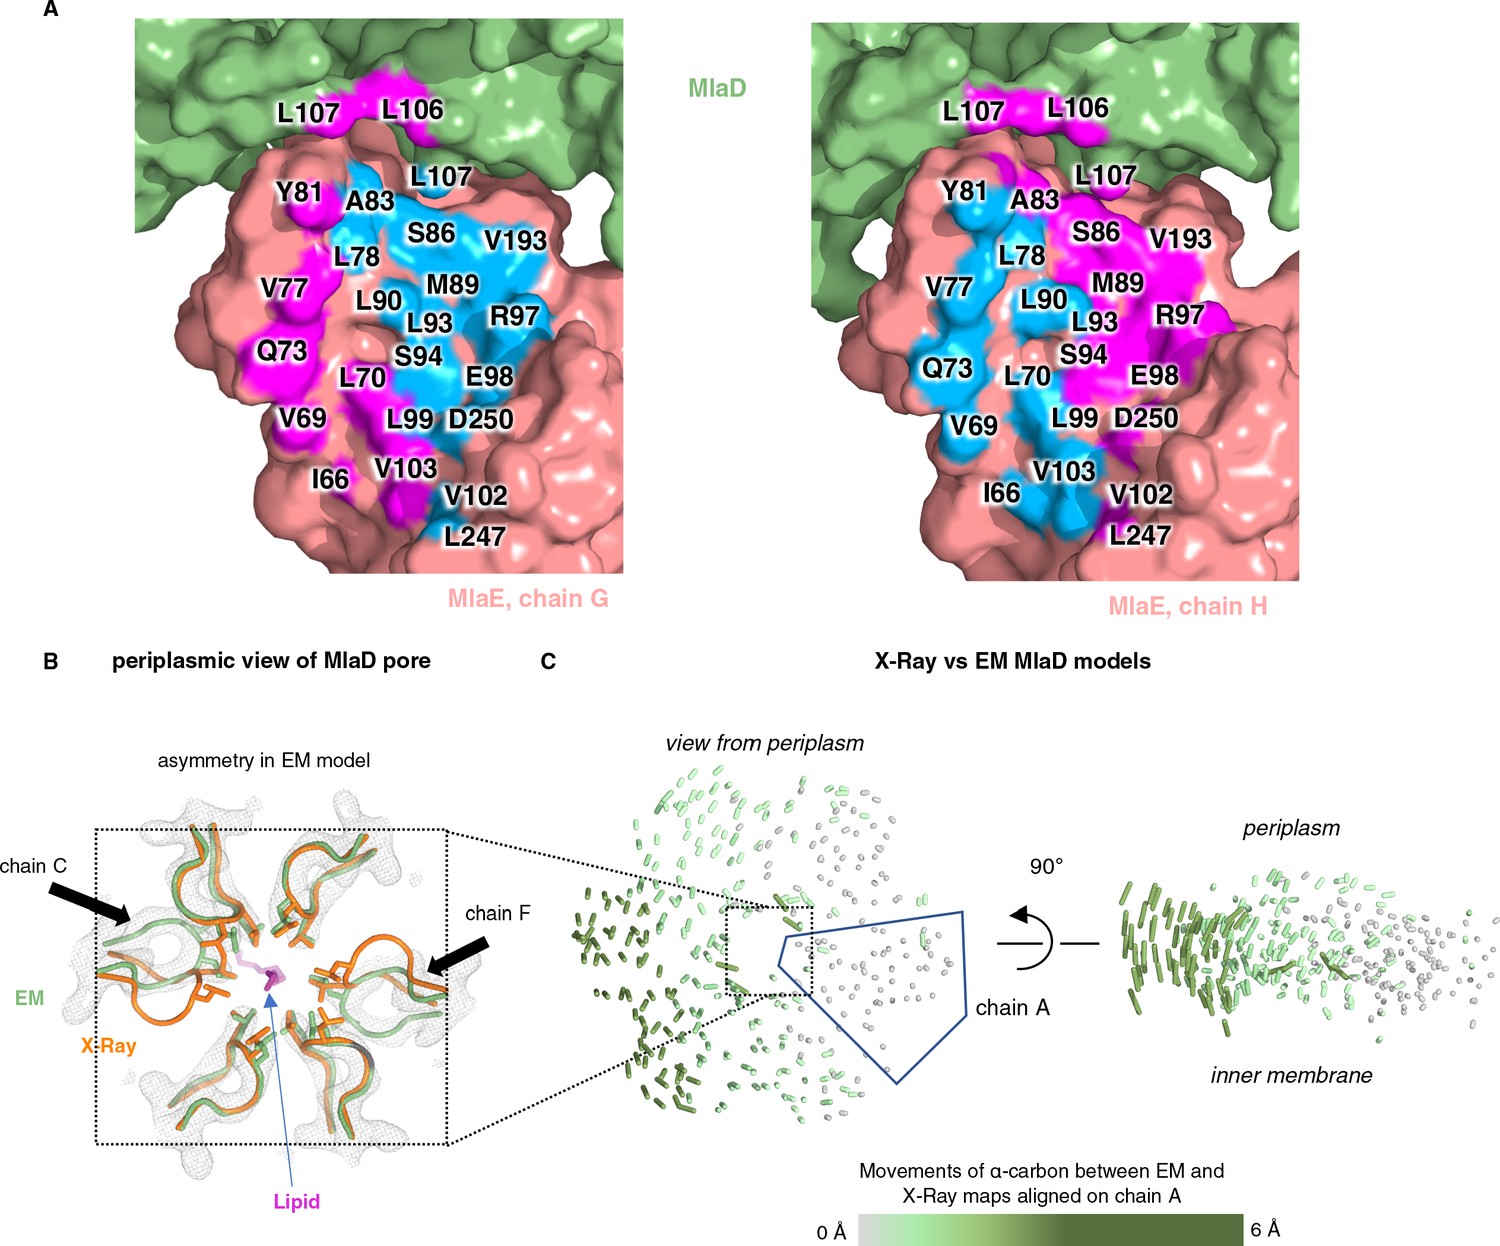
Asymmetry of lipid interactions and asymmetry of MlaD in the MlaFEDB complex.
(A) MlaE protomers (salmon) and nearby MlaD subunits (green) shown as a surface, with residues within 4.5 Å of lipid 1 colored blue and residues within 4.5 Å of lipid 2 colored magenta. (B) X-ray (orange, PDB 5UW2) and EM (green, PDB 6XBD) structures aligned on the whole hexamer, highlighting differences in the conformations of the pore lining loops of MlaD between the symmetric crystal structure and the asymmetric EM structure. (C) The EM and X-ray MlaD structures were aligned on chain A and, to illustrate the tilt and break in symmetry, lines were drawn between alpha-carbons using a modified version of the ColorByRMSD pymol script.
Figure 4—figure supplement 3
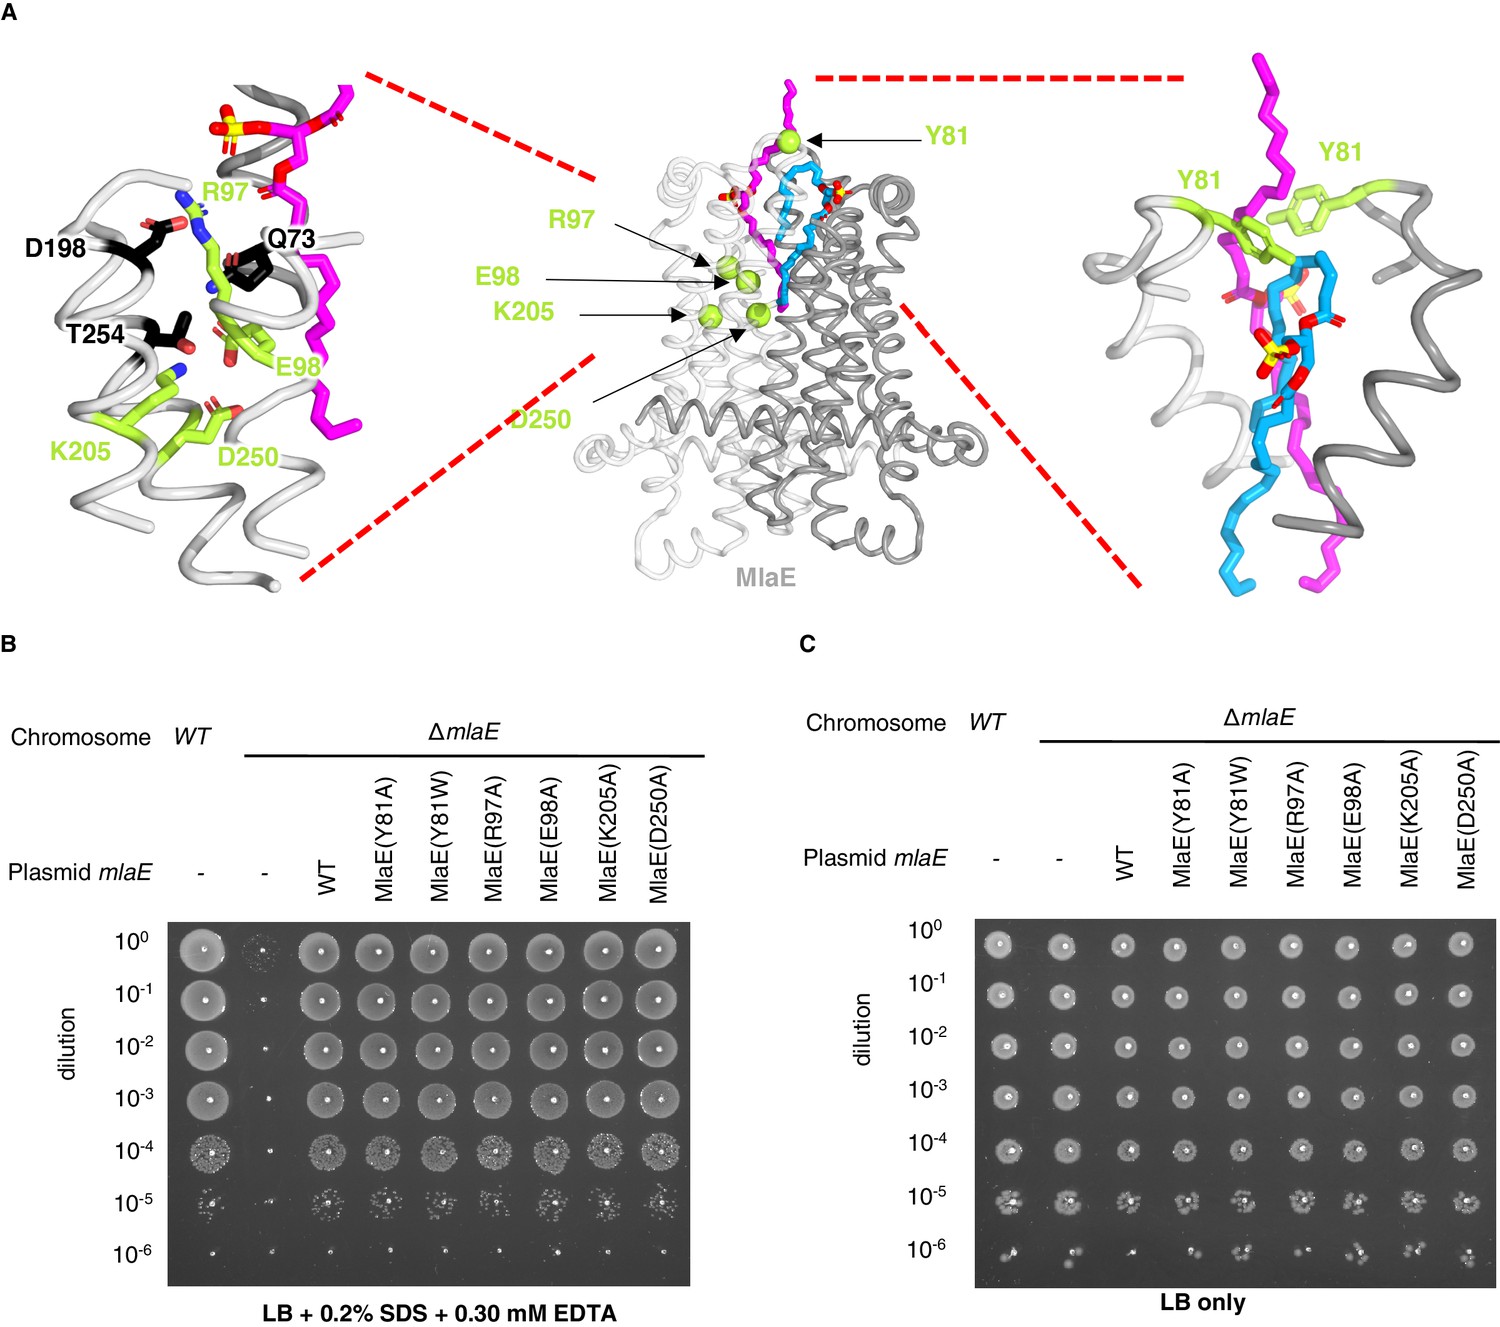
Point mutations in MlaE.
(A) Center, MlaE dimer (gray ribbons) with sites of mutations indicated by spheres (lime), and the two bound lipids (magenta and blue sticks). Left, zoomed in view of the salt bridges formed by residues Arg97, Glu98, Lys205, and Asp250 (lime sticks), part of a larger polar interaction network including Gln73, Asp198, and Thr254 (black sticks). Right, zoomed in view of interactions between Tyr81 (lime) and bound lipids (blue and magenta). (B) Tenfold serial dilutions of the indicated cultures spotted on LB plates containing SDS and EDTA at the concentrations indicated and incubated overnight. The mlaE knockout grows poorly in the presence of SDS+EDTA, but can be rescued by the expression of WT MlaE or MlaE mutants. (C) Same as in (B), but plated on LB only.
Figure 4—figure supplement 4
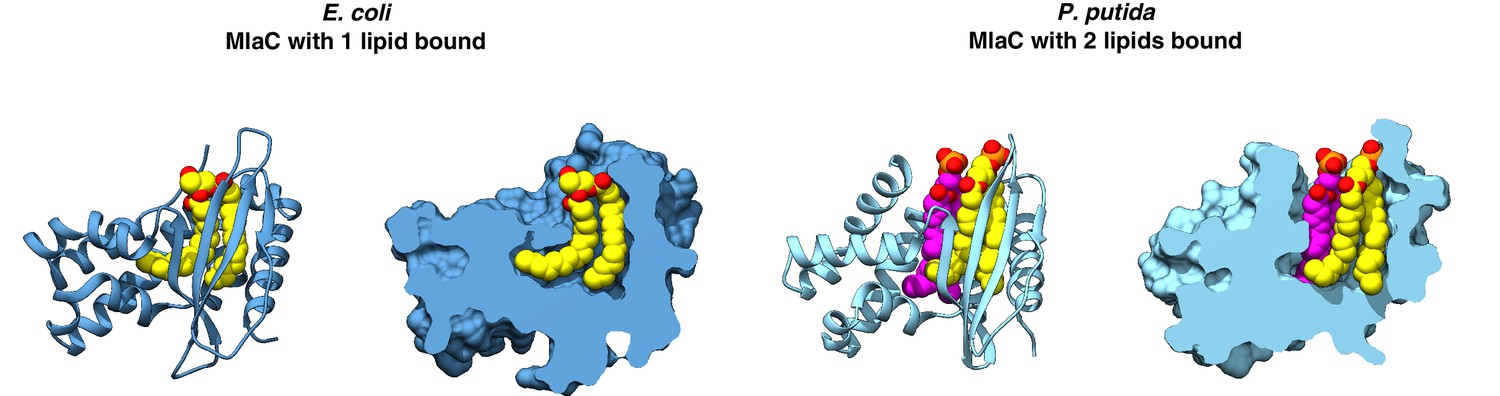
MlaC structures in which either one or two lipids are bound.
E. coli MlaC (PDB 5UWA) and P. putida MlaC (PDB 5UWB) are shown in cartoon representation and with a cross-section through the surface. Lipids are shown as yellow or magenta spheres.
Figure 4—figure supplement 5
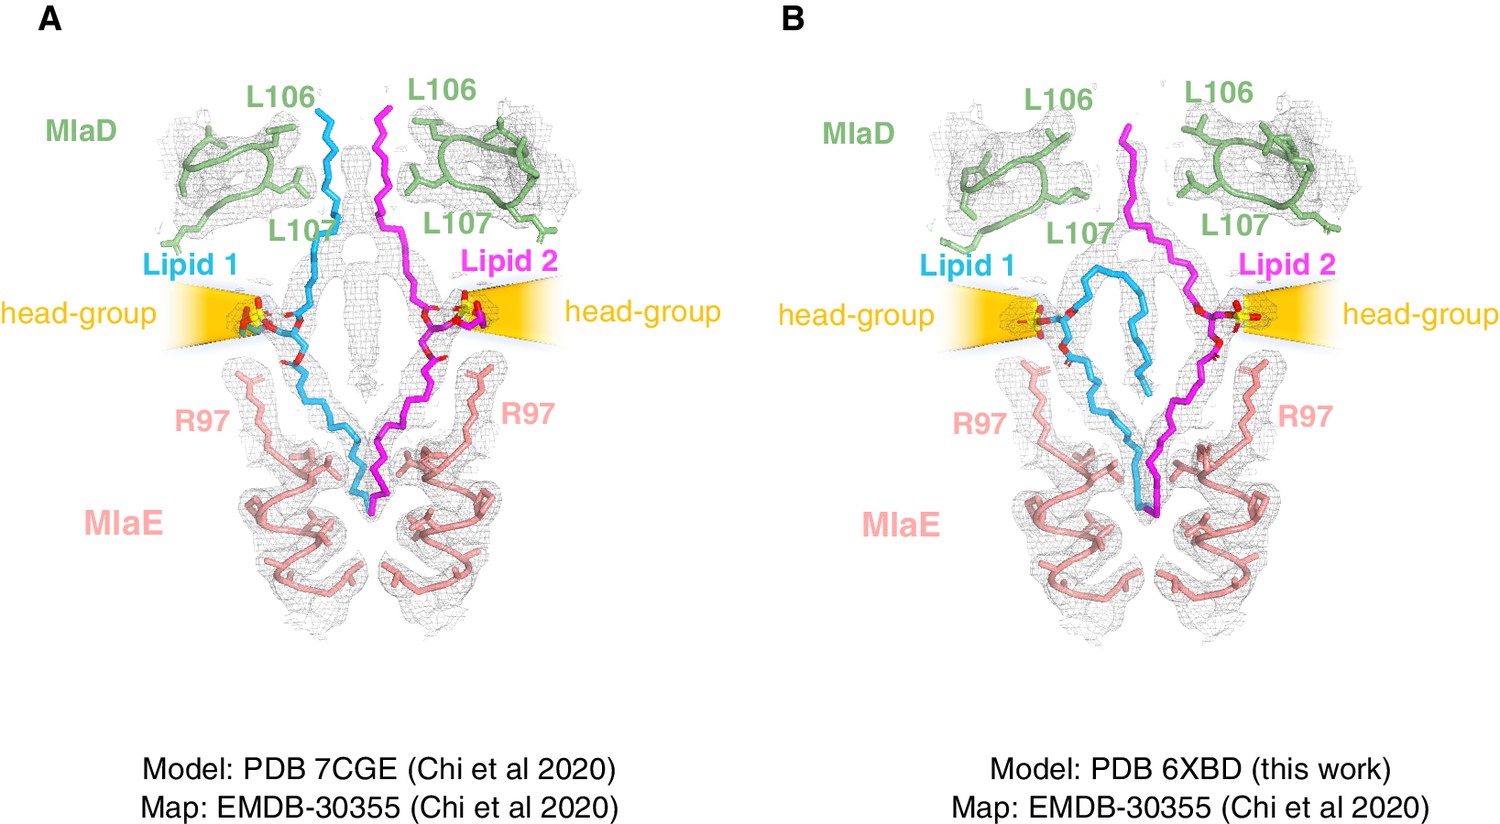
Comparison of lipid modeling into MlaFEDB map EMDB-30355 (Chi et al., 2020).
(A) The density map EMD-30355 deposited by Chi et al., 2020 shown with the corresponding model (PDB 7CGE). (B) Model from this work (PDB 6XBD) rigid-body docked into the same density map (EMD-30355).
Figure 5 with 2 supplements
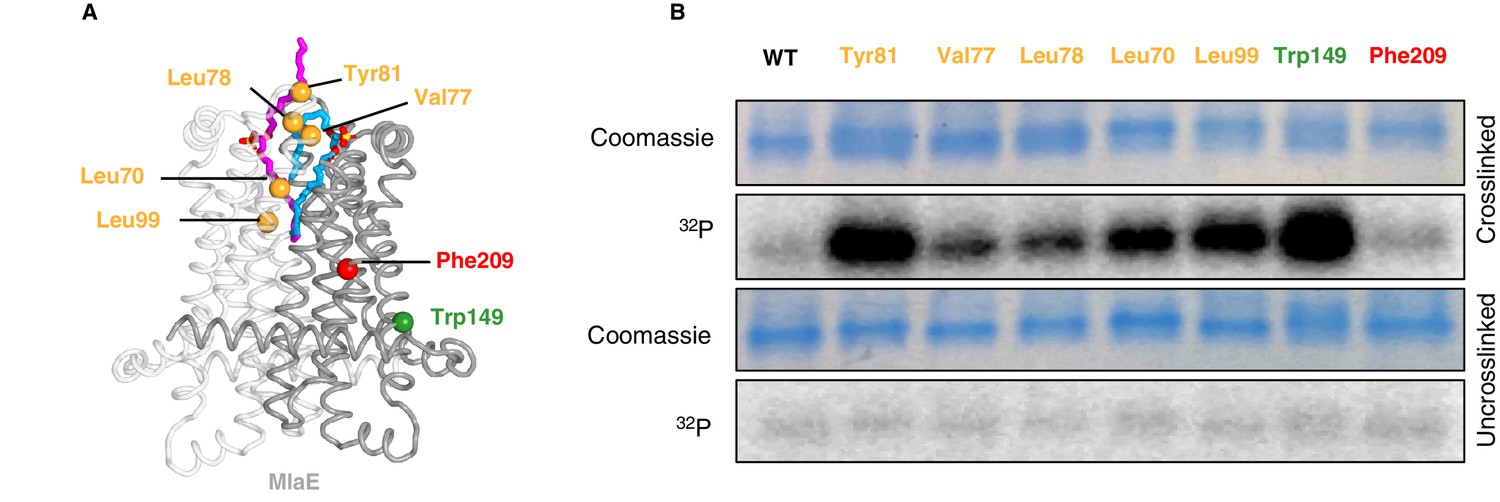
In vivo photocross-linking of substrates in MlaFEDB.
(A) MlaE dimer (gray cartoon) showing sites of BPA cross-linker incorporation (spheres). Orange, residues in the lipid-binding pocket; red, residue buried within the MlaE core, designed as a negative control; green, residue facing the membrane environment, designed as a positive control. Bound lipids are shown in magenta and blue sticks. (B) SDS-PAGE of purified WT MlaFEDB and BPA mutants, either cross-linked or uncross-linked, and visualized by Coomassie staining (protein) or phosphorimaging (32P signal). Band corresponding to the MlaE monomer is shown here, and full gels are shown in Figure 5—figure supplement 1.
Figure 5—figure supplement 1
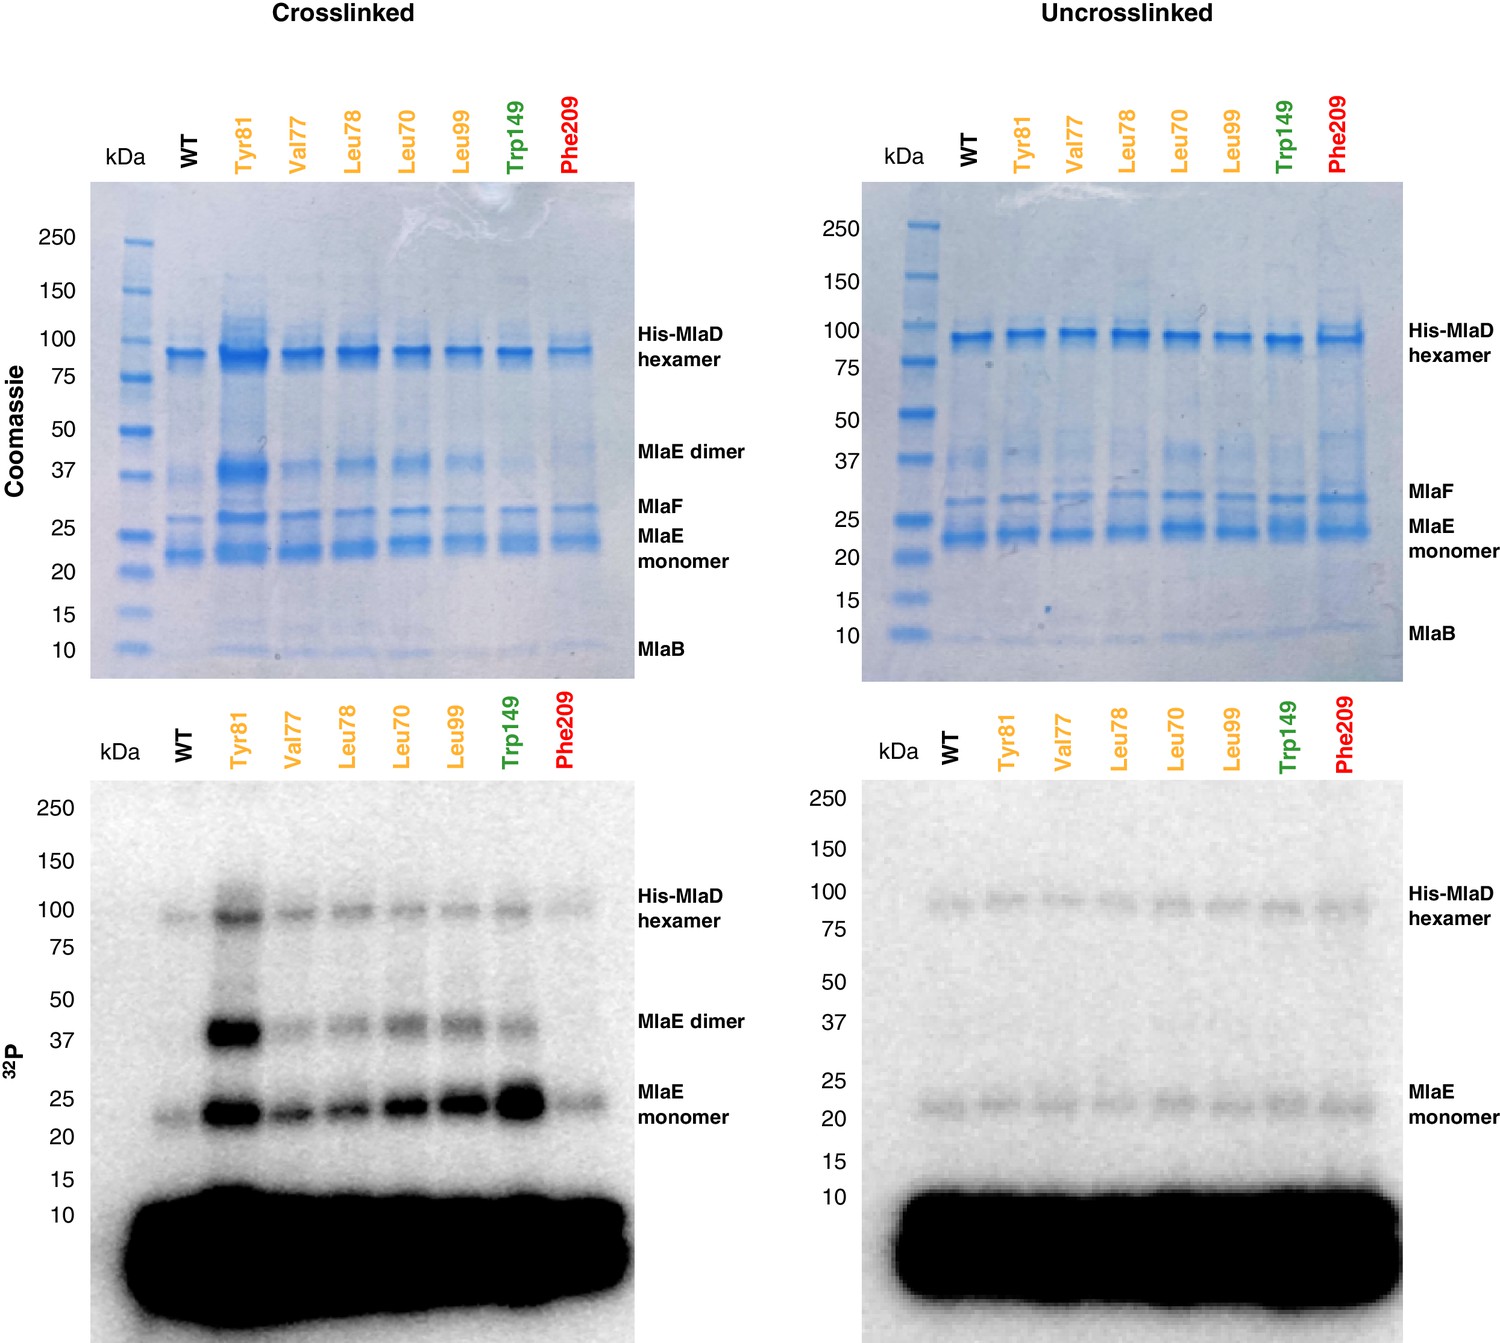
Uncropped gels of the in vivo photocross-linking assay shown in Figure 5.
Figure 5—figure supplement 2
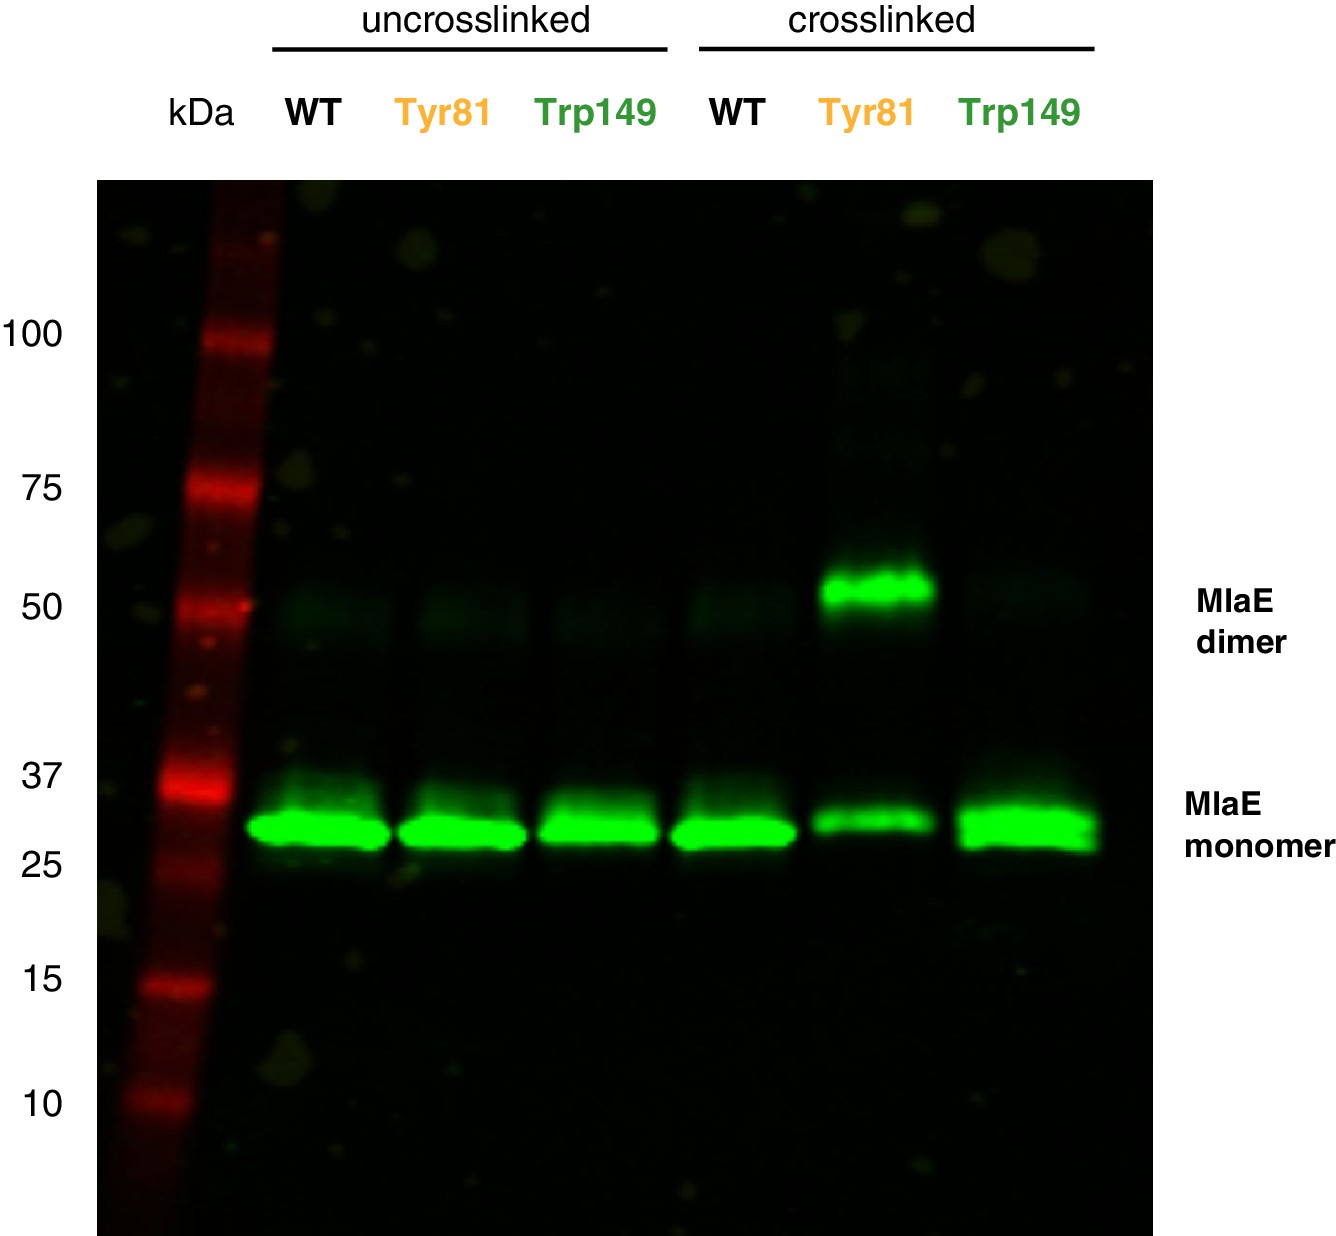
Western blot against MlaE, showing positions of MlaE monomer and cross-linked MlaE dimer.
Anti-His western blot against uncross-linked and cross-linked MlaE WT, and Tyr81BPA and Trp149BPA mutants.
Figure 6
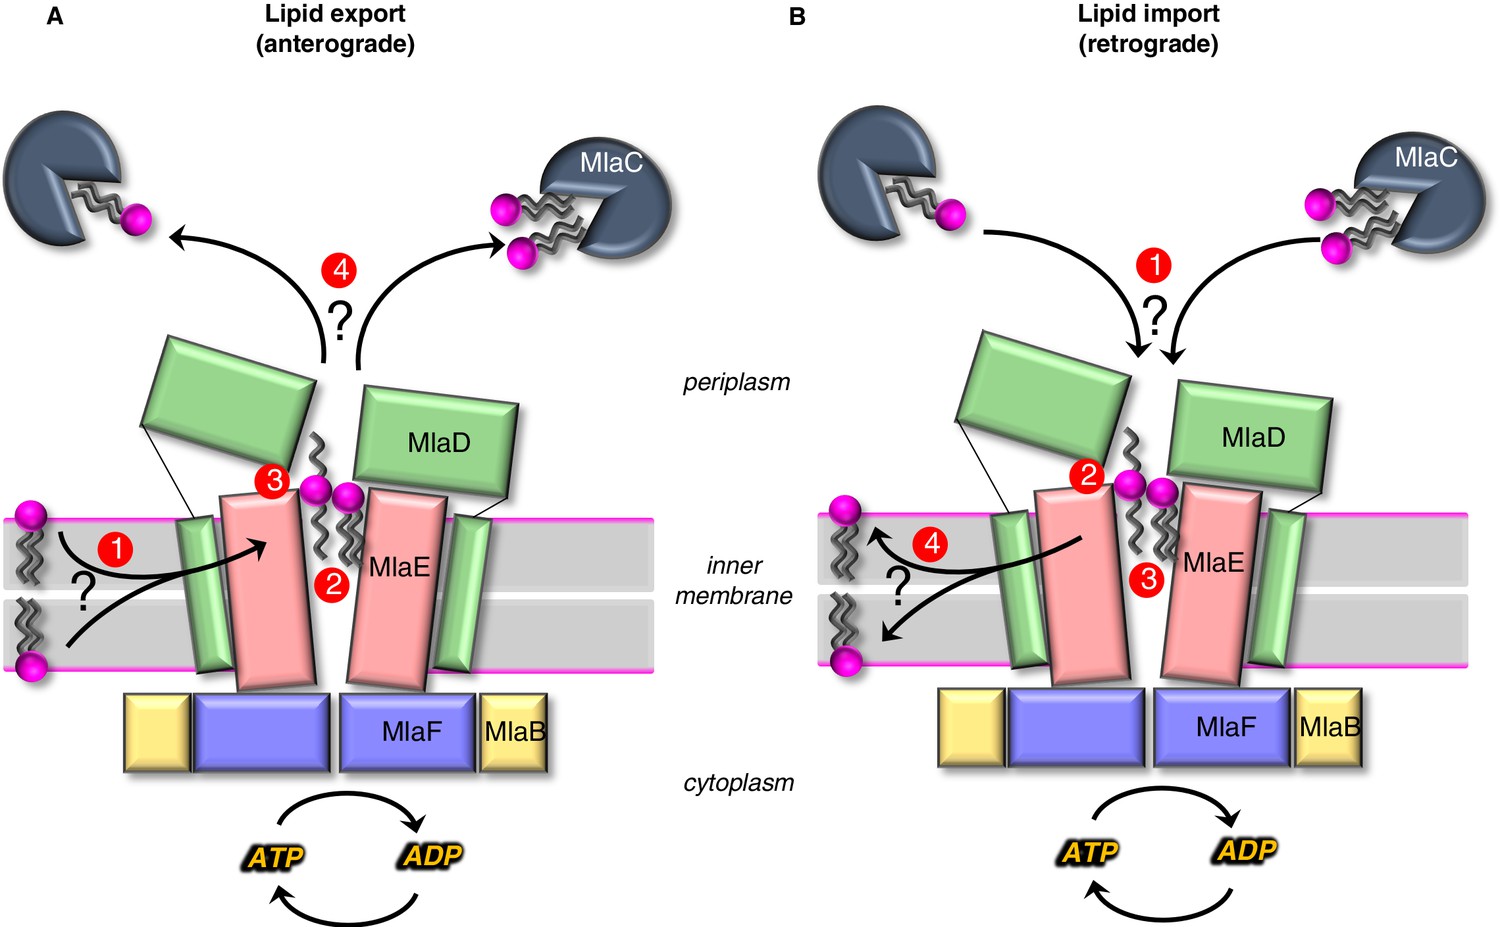
Models for lipid transport by MlaFEDB.
(A) Lipid export model: (1) Lipids are extracted from the IM and transferred to the outward-open pocket by an unknown mechanism. (2) Lipids are reoriented, from ‘tails-down’ to ‘extended’ or ‘tails-up’ configuration. (3) Conformational changes in MlaE coupled to the ATP hydrolysis cycle likely push lipids out of the MlaE pocket and into MlaD pore. (4) Lipids are transferred to MlaC to be shuttled across periplasm to the outer membrane MlaA-OmpC/F complex. MlaC may accommodate one or two phospholipids, or a single larger lipid. (B) Lipid import model: (1) Lipids from MlaC are transferred to MlaD, likely dependent on ATP-driven conformational changes in MlaD and MlaE. (2) Lipids travel through the continuous channel from MlaD and are transferred to the outward-open pocket of MlaE. (3) Phospholipids are reoriented ‘tails-down’, as they are transported between MlaD and MlaE. (4) Lipids are inserted into the inner membrane.
Tables
Key resources table
| Reagent type (species) or resource | Designation | Source or reference | Identifiers | Additional information |
|---|---|---|---|---|
| Strain, strain background (Escherichia coli) | Rosetta 2 (DE3) | Novagen | #71400 | |
| Strain, strain background (Escherichia coli) | E. coli K-12 BW25113/wild-type | Coli Genetic Stock Center | N/A | |
| Strain, strain background (Escherichia coli) | T7 express E. coli | New England Biolabs (NEB) | #C2566H | |
| Genetic reagent (Escherichia coli) | E. coli K-12 BW25113 ΔmlaD | This paper | bBEL182 | Can be obtained from Bhabha-Ekiert lab, NYU Langone. Please see Materials and methods section ‘Phenotypic assays for mla mutants in E. coli’ for details of strain construction |
| Genetic reagent (Escherichia coli) | E. coli K-12 BW25113 ΔmlaE | This paper | bBEL183 | Can be obtained from Bhabha-Ekiert lab, NYU Langone. Please see Materials and methods section ‘Phenotypic assays for mla mutants in E. coli’ for details of strain construction |
| Antibody | anti-MlaD (rabbit polyclonal) | Other | N/A | (1:10,000). Provided by Henderson lab, University of Queensland |
| Antibody | Anti-Rabbit IgG Antibody IRDye 800CW (Goat polyclonal) | LI-COR Biosciences | #925–32211 RRID:AB_2651127 | (1:10,000) |
| Antibody | Penta His Antibody, BSA-free (Mouse monoclonal) | Qiagen | #34660 RRID:AB_2619735 | (1:5000) |
| Antibody | Anti-Mouse IgG Antibody IRDye 800CW (Goat polyclonal) | LI-COR Biosciences | #926–32210 RRID:AB_621842 | (1:10,000) |
| Recombinant DNA reagent | For all plasmid info, please see Supplementary file 4 | For all plasmid info, please see Supplementary file 4 | ||
| Commercial assay or kit | Ni Sepharose 6 Fast Flow | GE Healthcare | #17531802 | |
| Commercial assay or kit | Bio-Beads SM-2 Adsorbent Media | Bio-Rad | #1523920 | |
| Commercial assay or kit | Superdex 200 Increase 10/300 | GE Healthcare | #28-9909-44 | |
| Chemical compound, drug | LB Broth, Miller | BD Difco | #244620 | |
| Chemical compound, drug | LB agar pre-mix | BD Difco | #244510 | |
| Chemical compound, drug | Sodium dodecyl sulfate (SDS) | Sigma | #L5750 | |
| Chemical compound, drug | Ethylenediaminetetraacetic acid (EDTA) | Sigma | #ED2SS | |
| Chemical compound, drug | p-benzoyl-l-phenylalanine (BPA) | Bachem | #F-2800.0005 | |
| Chemical compound, drug | 32P orthophosphoric acid | PerkinElmer | #NEX053010MC | |
| Chemical compound, drug | E. coli polar lipid extract | Avanti | #100600 | |
| Software, algorithm | cryoSPARC v0.6 to 2.12 | Punjani et al., 2017 | RRID:SCR_016501 | https://cryosparc.com/ |
| Software, algorithm | RELION2.1 to 3.1 | Kimanius et al., 2016; Fernandez-Leiro and Scheres, 2017 | RRID:SCR_016274 | https://www3.mrc-lmb.cam.ac.uk/relion/index.php/Main_Page |
| Software, algorithm | MotionCor2 | Zheng et al., 2017 | RRID:SCR_016499 | https://docs.google.com/forms/d/e/1FAIpQLSfAQm5MA81qTx90W9JL6ClzSrM77tytsvyyHh1ZZWrFByhmfQ/viewform |
| Software, algorithm | GCTF | Zhang, 2016 | RRID:SCR_016500 | https://www.mrc-lmb.cam.ac.uk/kzhang/ |
| Software, algorithm | UCSF Pyem | Asarnow et al., 2019 | https://github.com/asarnow/pyem or https://doi.org/10.5281/zenodo.3576630 | |
| Software, algorithm | Chimera | Pettersen et al., 2004 | RRID:SCR_004097 | https://www.cgl.ucsf.edu/chimera/ |
| Software, algorithm | Coot | Emsley et al., 2010 | RRID:SCR_014222 | https://www2.mrc-lmb.cam.ac.uk/personal/pemsley/coot/ |
| Software, algorithm | Phenix | Echols et al., 2012; Liebschner et al., 2019 | RRID:SCR_014224 | http://www.phenix-online.org |
| Software, algorithm | MUSCLE | Edgar, 2004 | RRID:SCR_011812 | |
| Software, algorithm | 3DFSC Processing Server | Tan et al., 2017 | https://3dfsc.salk.edu/ | |
| Software, algorithm | COCOMAPS | Vangone et al., 2011 | https://www.molnac.unisa.it/BioTools/cocomaps/ | |
| Software, algorithm | CASTp | Tian et al., 2018 | http://sts.bioe.uic.edu/castp/index.html?2pk9 | |
| Software, algorithm | HOLLOW | Ho and Gruswitz, 2008 | RRID:SCR_005729 | http://hollow.sourceforge.net/ |
| Software, algorithm | Bendix | Dahl et al., 2012 | https://www.ks.uiuc.edu/Research/vmd/plugins/bendix/ | |
| Software, algorithm | PyMOL | Schrödinger, LLC | RRID:SCR_000305 | https://pymol.org/2/ |
| Software, algorithm | DALI | Holm, 2019 |
Additional files
-
Supplementary file 1
Data collection parameters for cryo-EM structure of MlaFEDB.
- https://cdn.elifesciences.org/articles/62518/elife-62518-supp1-v2.docx
-
Supplementary file 2
Data refinement statistics for cryo-EM structure of MlaFEDB.
- https://cdn.elifesciences.org/articles/62518/elife-62518-supp2-v2.docx
-
Supplementary file 3
Species included in analysis of Mla sequence conservation.
- https://cdn.elifesciences.org/articles/62518/elife-62518-supp3-v2.xlsx
-
Supplementary file 4
Plasmids used in this study.
- https://cdn.elifesciences.org/articles/62518/elife-62518-supp4-v2.docx
-
Transparent reporting form
- https://cdn.elifesciences.org/articles/62518/elife-62518-transrepform-v2.docx
Download links
A two-part list of links to download the article, or parts of the article, in various formats.
Downloads (link to download the article as PDF)
Open citations (links to open the citations from this article in various online reference manager services)
Cite this article (links to download the citations from this article in formats compatible with various reference manager tools)
Structure of bacterial phospholipid transporter MlaFEDB with substrate bound
eLife 9:e62518.
https://doi.org/10.7554/eLife.62518


