Slowing the body slows down time perception
- University of California, Davis, United States
- George Mason University, United States
Figures
Figure 1 with 2 supplements
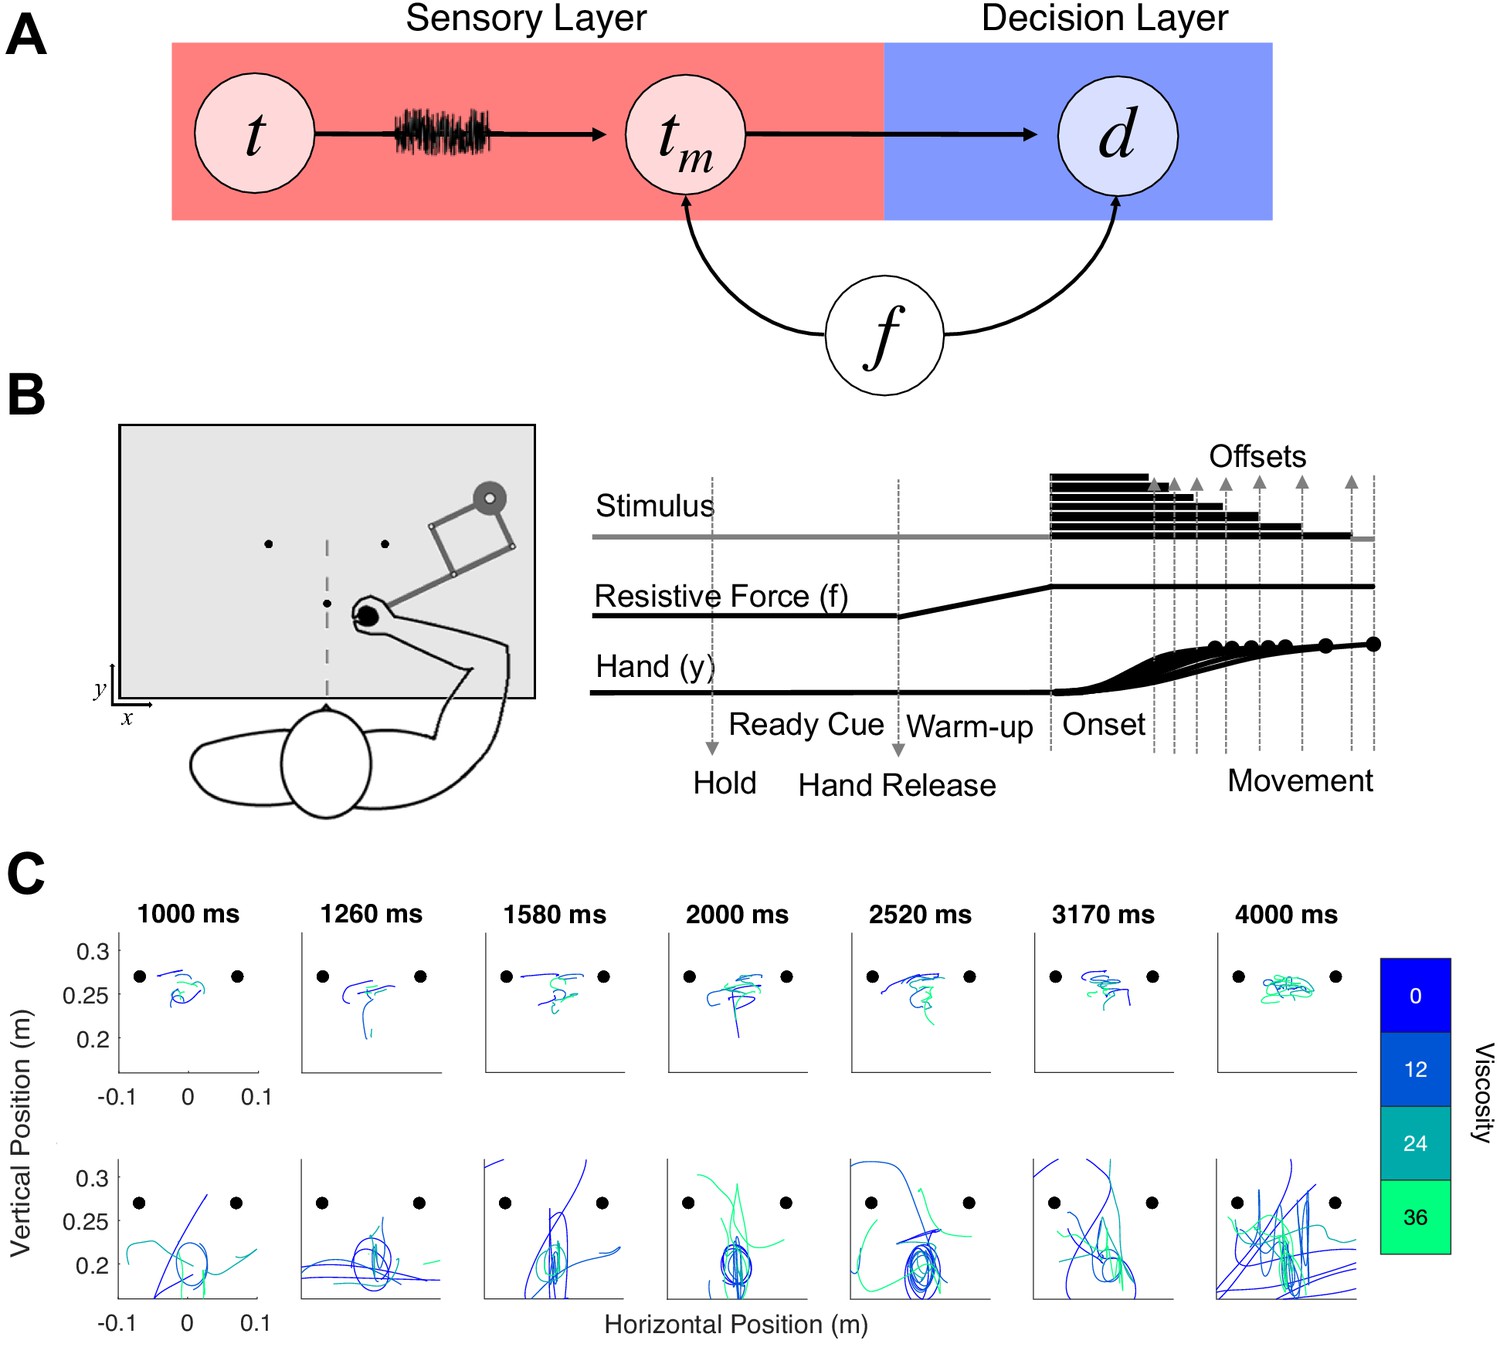
Hypothesis and design of Experiment 1.
(A) Potential pathways in which movement (f) could influence timing. The first possibility is that f specifically alters the sensory layer, in which a stimulus presented for an amount of time (t) is perceived with noise as a temporal estimate (tm); here, f could specifically alter the measurement process, either by shifting the way that estimate is perceived or by altering the level of noise. The second possibility is that f shifts the decision layer, such that decisions about time (d) are biased to one choice or another (e.g. more likely to choose ‘long’). (B) Task schematic of Experiment 1. Participants began each trial with the robotic handle locked in a centralized location. The trial was initiated by a warm-up phase in which the hold was released and viscosity was applied in a ramping fashion until the target viscosity was reached. Participants were allowed to move throughout the workspace during warm-up and tone presentation, and reach to one of two choice targets to indicate their response (Hand y data shows hypothetical paths to the chosen target). (C) Example trajectory data; each row displays sample trajectories from two subjects. The trajectories include movement during the tone for the seven possible tone durations for each of the four viscosities.
Figure 1—figure supplement 1
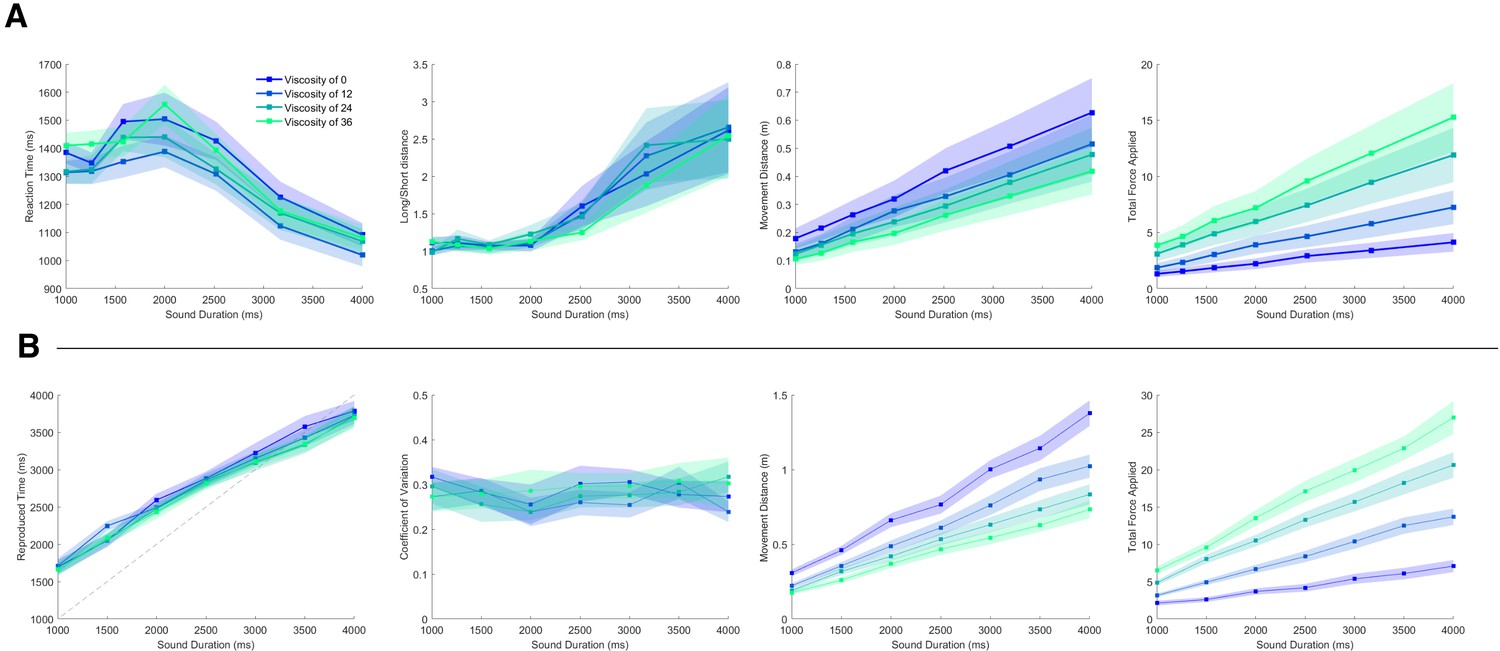
Additional effects for categorization and reproduction tasks.
(A) Data from the temporal categorization task of Experiment 1. Left panel: Mean chronometric functions of reaction time against tested durations for all four viscosity levels. Inner Left panel: Ratio of Euclidean distance to the long and short target locations at interval offset. Inner Right panel: Movement Distance as a function of tested duration. Right panel: Total Force applied as a function of tested duration. (B) Data from the temporal reproduction task of Experiment 2. Left panel: Mean reproduced durations as a function of tested duration; dashed line represents the identity. Inner Left panel: Coefficient of Variation (CV) values as a function of tested duration. Inner Right panel: Movement Distance as a function of tested duration. Right panel: Total Force applied as a function of tested duration. Shaded regions represent standard error.
Figure 1—figure supplement 2
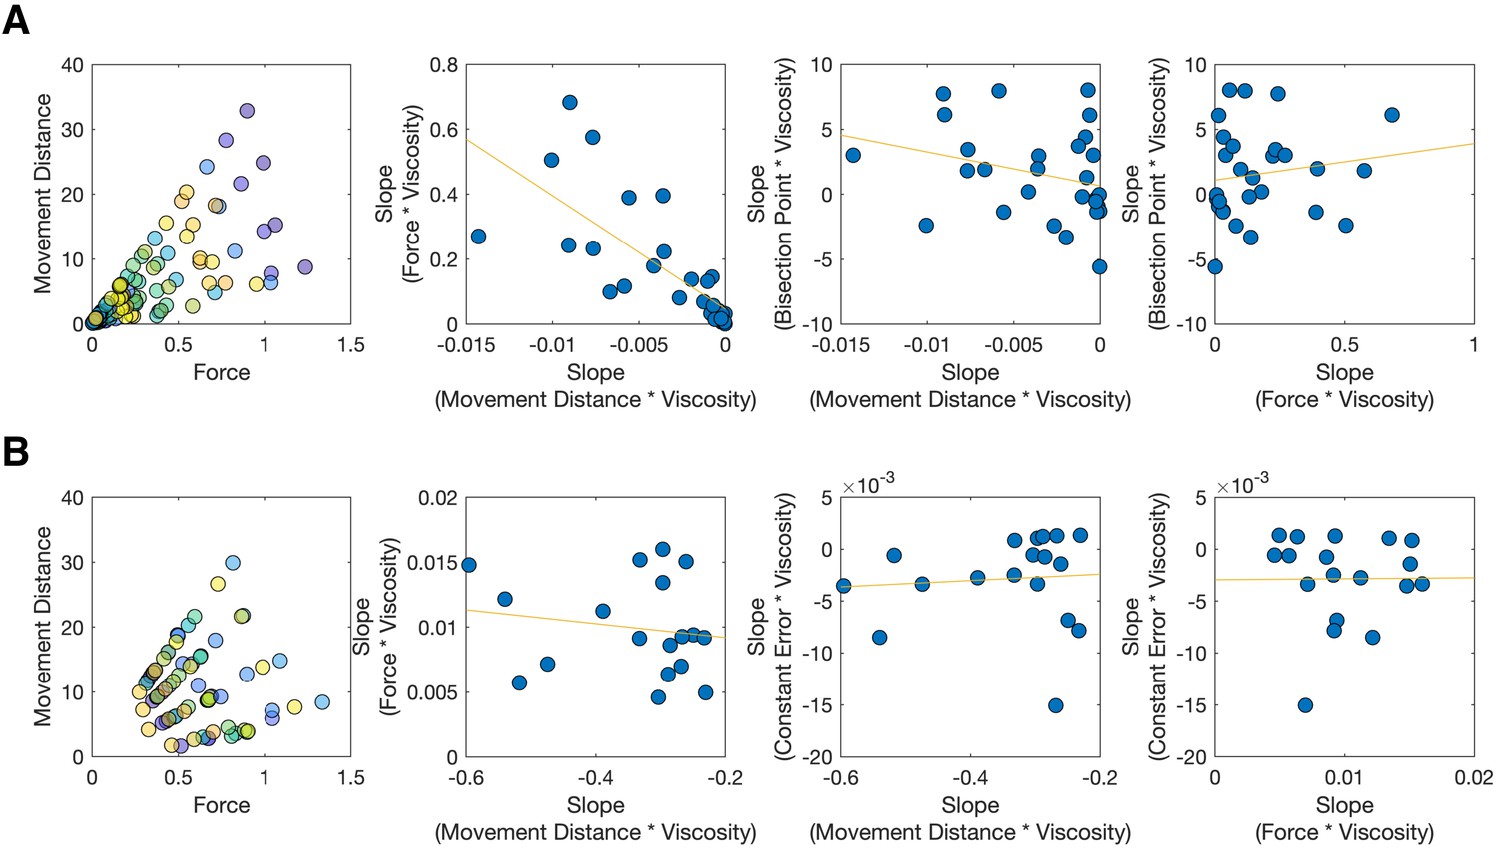
Individual differences in movement parameters for categorization and reproduction tasks.
(A) Individual movement parameters for the temporal categorization task of Experiment 1. Left panel: Average values of Movement Distance and Total Force for each individual subject (each unique color represents a single subject). Offsets between diagonal clusters represent different viscosity levels; as viscosity increases, Movement Distance and Force decrease, although subjects tend to stay within the same range of each. Inner Left panel: Correlation between the slope of Movement Distance x Viscosity and Force x Viscosity. Inner Right panel: Correlation between the slope of Movement Distance x Viscosity by Bisection Point x Viscosity. Right panel: Correlation between the slope of Force x Viscosity by Bisection Point x Viscosity. (B) Individual movement parameters for the temporal reproduction task of Experiment 2. Left panel: Average values of Movement Distance and Total Force for individual subjects, as presented in (A); note the lack of very low values for either measure compared to Experiment 1. Inner Left panel: Movement Distance and Force, same as for (A). Inner Right panel: Movement Distance against Constant Error effect, same as for (A). Right panel: Total Force against Constant Error effect, same as for (A). Orange lines represent best fit regression lines.
Figure 2
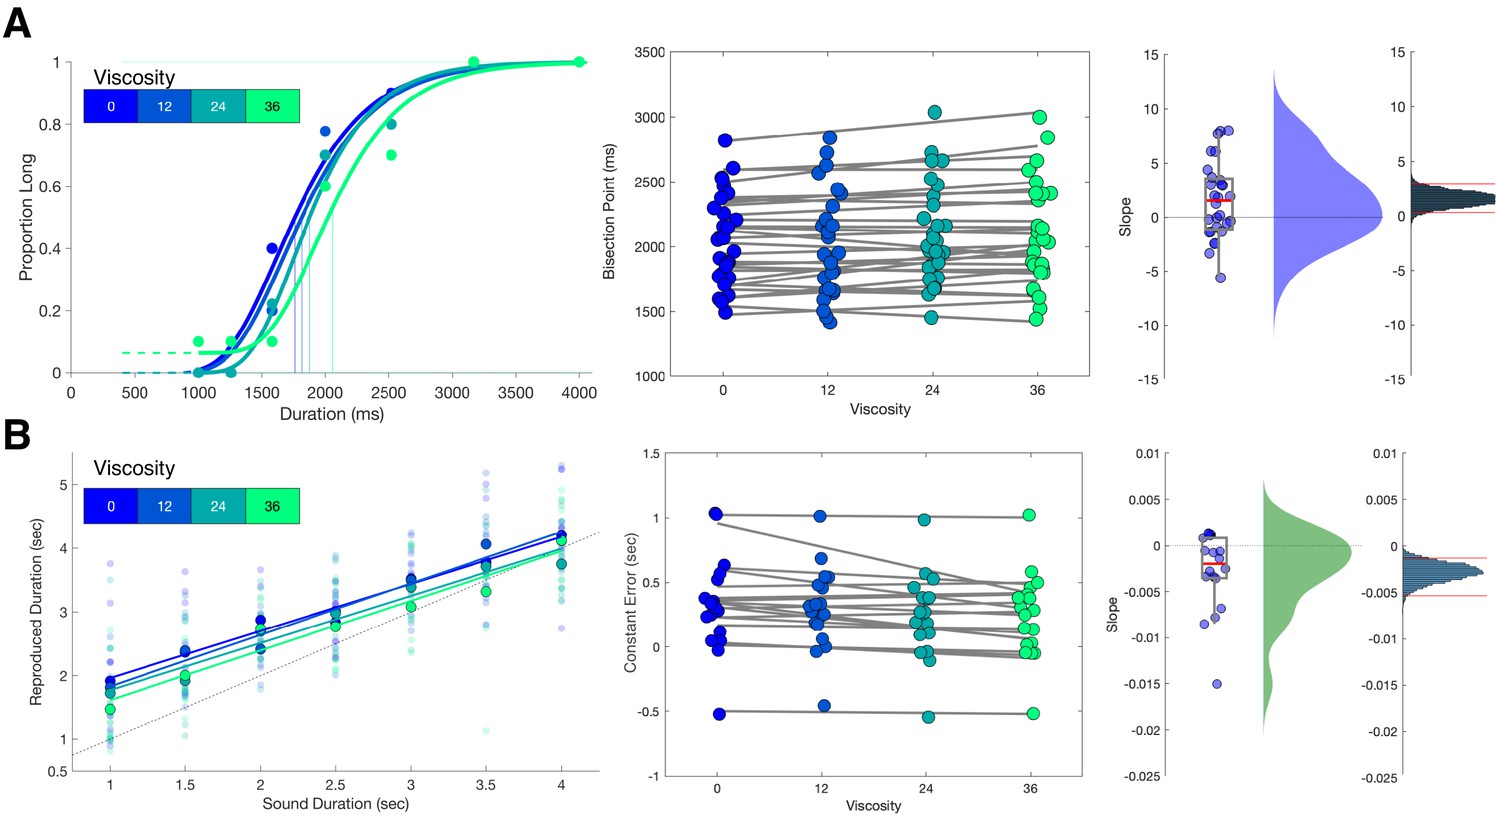
Viscosity shifts time responses.
(A) Results from Experiment 1 (Temporal Categorization). Left panel: psychometric curves fit to response proportions for a representative subject exhibiting a rightward shift with increasing viscosity; vertical lines indicate the Bisection Point (0.5 probability of classifying ‘long’). Middle panel: Bisection points for all subjects across viscosities; gray lines represent best fitting linear regressions. Right panels: boxplots and kernel densities of slope values for linear regressions, along with bootstrapped distributions of the mean slope (rightmost panel) with 95% confidence intervals. (B) Results from Experiment 2 (Temporal Reproduction). Left panel: Reproduction performance for a representative subject exhibiting progressively shorter reproduced time estimates with higher viscosities; faded points represent single trials, solid points represent means, lines represent best fitting linear regressions. Middle panel: Mean Constant Error (difference between reproduced and presented interval) for all subjects across viscosities; gray lines represent best fitting linear regressions. Right panels: boxplots and kernel densities of slope values for linear regressions, along with bootstrapped distributions of the mean slope (rightmost panel) with 95% confidence intervals.
Figure 3
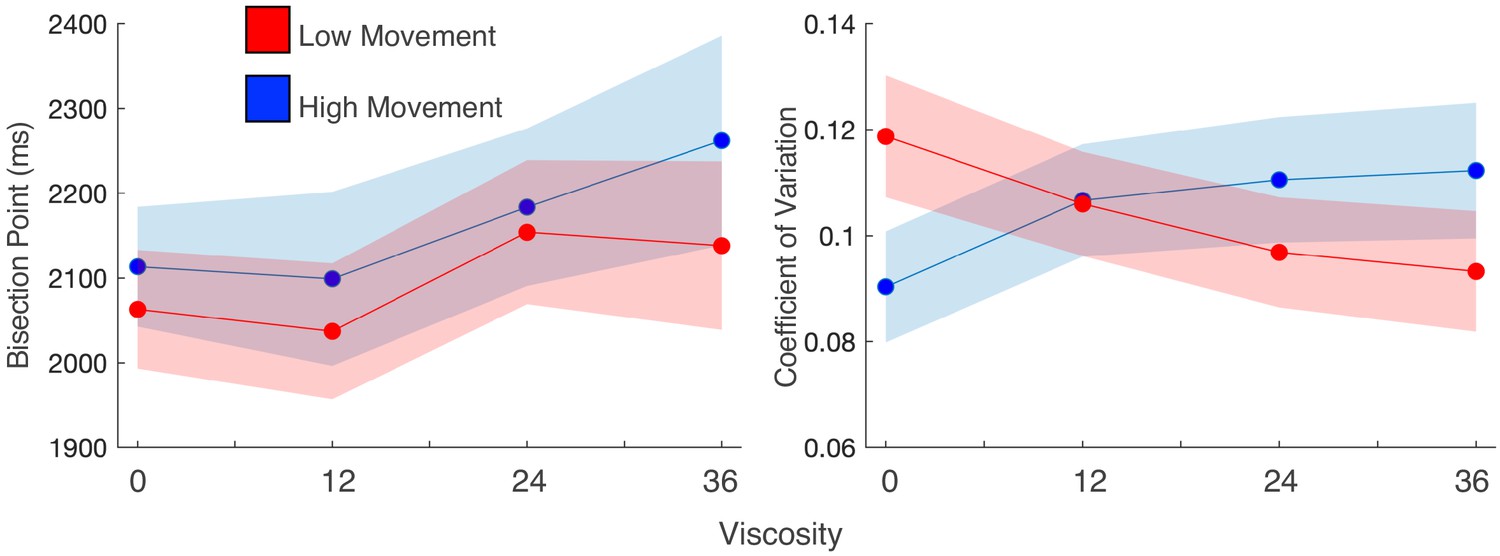
Movement speed does not change viscosity effects, but does influence precision.
(a) Mean bisection points and (b) coefficients of variation for participant trials divided into high and low movement via a median split. Viscosity shifted the bisection point across both movement types (left); however, precision was influenced by movement, but only when no viscosity existed.
Figure 4 with 2 supplements
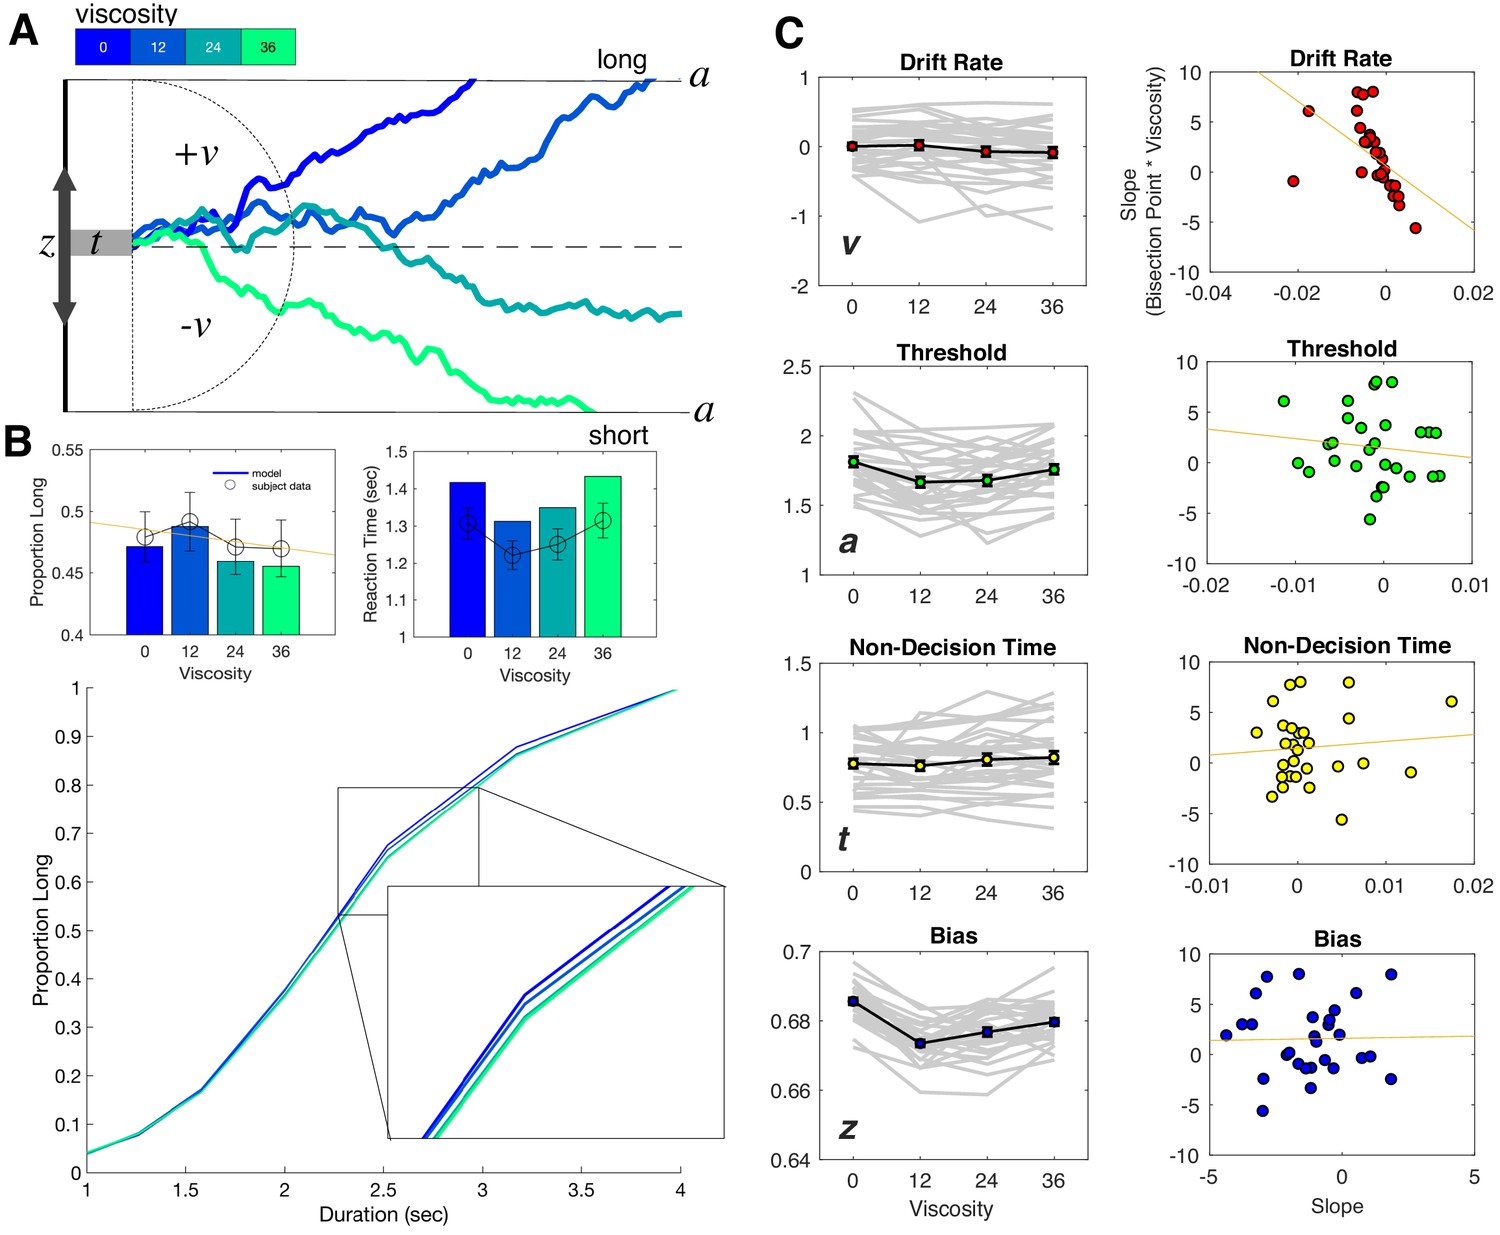
Drift diffusion modeling of categorization performance and viscosity.
(A) Example Viscosity DDM model, in which evidence is accumulated to one of two decision bounds (‘long’ and ‘short’), separated by a. Evidence accumulation drifts at particular rate (v) that can be positive or negative, depending on the direction of the drift to a particular boundary. The drift rate is additionally delayed by non-decision time (t) and may be biased toward one of the boundaries by a certain amount (z). Viscosity was specifically found to influence the drift rate, in which higher viscosities were associated with a shift in drift from the long to short decision boundary (presented traces represent example simulations). (B) Top Panels: Posterior predictive checks for the Viscosity Model, displaying simulated data (bars) against average subject data for choice (left) and reaction time (right). Bottom Panel: Psychometric curves from simulations of the ‘Full’ Model, combining Viscosity and Duration; inset displays a shift in Viscosity in choosing ‘long’ (C) Fitted Viscosity Model results for all four parameters (left panels), showing that viscosity linearly shifted the drift rate, but also modulated threshold and bias parameters in a nonlinear (stepwise) manner. Right panels demonstrate the correlation between the slope of the viscosity effect on each parameter and the slope of the viscosity effect on behavior; only drift rate exhibited a significant correlation (see also Table 1 for Fisher Z comparisons between correlations).
Figure 4—figure supplement 1

Comparison of hierarchical and non-hierarchical fits for Experiment 1.
(A) Scatterplots of parameter estimates for all four parameters from the Viscosity Model fit using hierarchical or non-hierarchical methods. Blue lines represent the identity. Parameter estimates exhibited strong concordance between hierarchical and non-hierarchical methods. (B) Correlations between viscosity effects on non-hierarchical parameters estimated from the Viscosity Model and the behavioral effect of viscosity on the bisection point (same as in Figure 4C). Similar to the hierarchical findings, the only parameter to exhibit a significant correlation with the effect on behavior was the drift rate (z) [Pearson r = 0.807, p<0.001; Spearman r = −0.874, p<0.001]. No other parameters were significant (all p>0.05). Orange lines represent best fitting linear regressions.
Figure 4—figure supplement 2
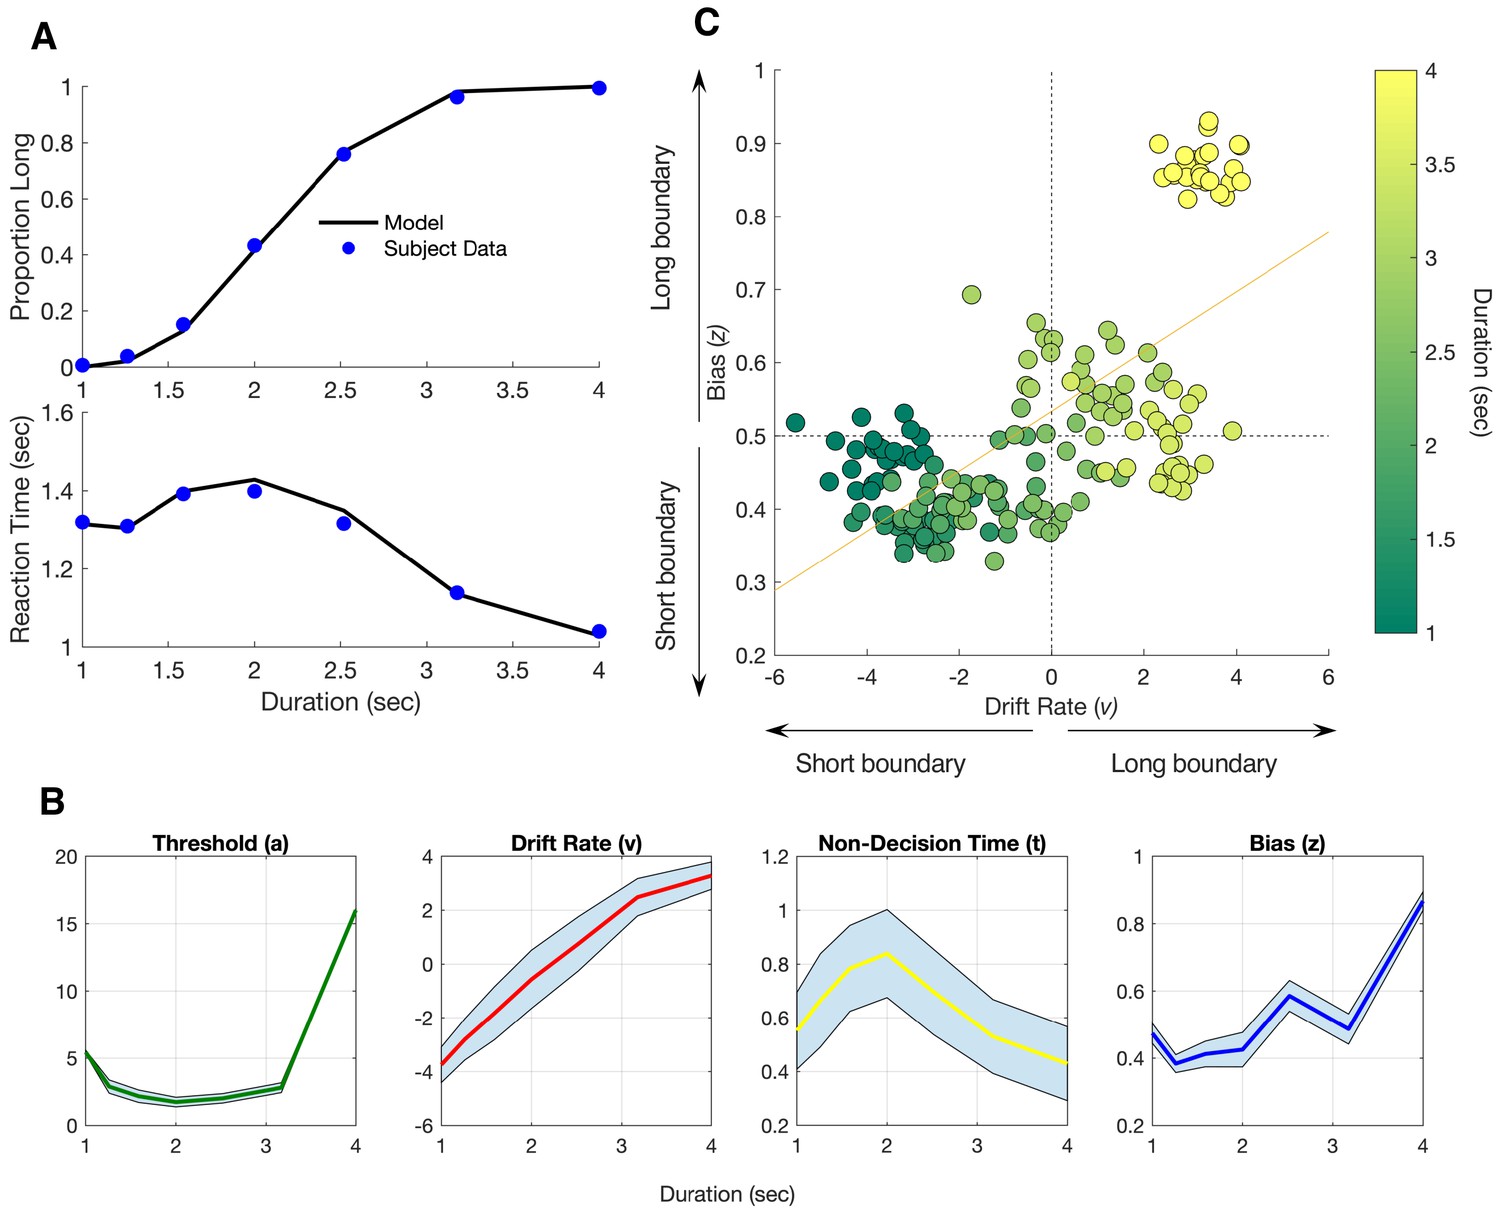
Parameters and simulations of the Duration Model for Experiment 1.
(A) Posterior predictive checks of simulated Duration Model against average subject data. Top and bottom panels display psychometric and chronometric curves, respectively. (B) Average Parameter estimates for the Duration Model for all four parameters as a function of tested duration. Shaded regions represent standard error. (C) Scatterplot of individual subject parameter estimates for drift rate (v) and bias (z) for each tested duration, displaying the predicted correlation between each with increasing duration. Arrows indicate if the plotted values are closer to the short or long decision boundary for each parameter.
Figure 5
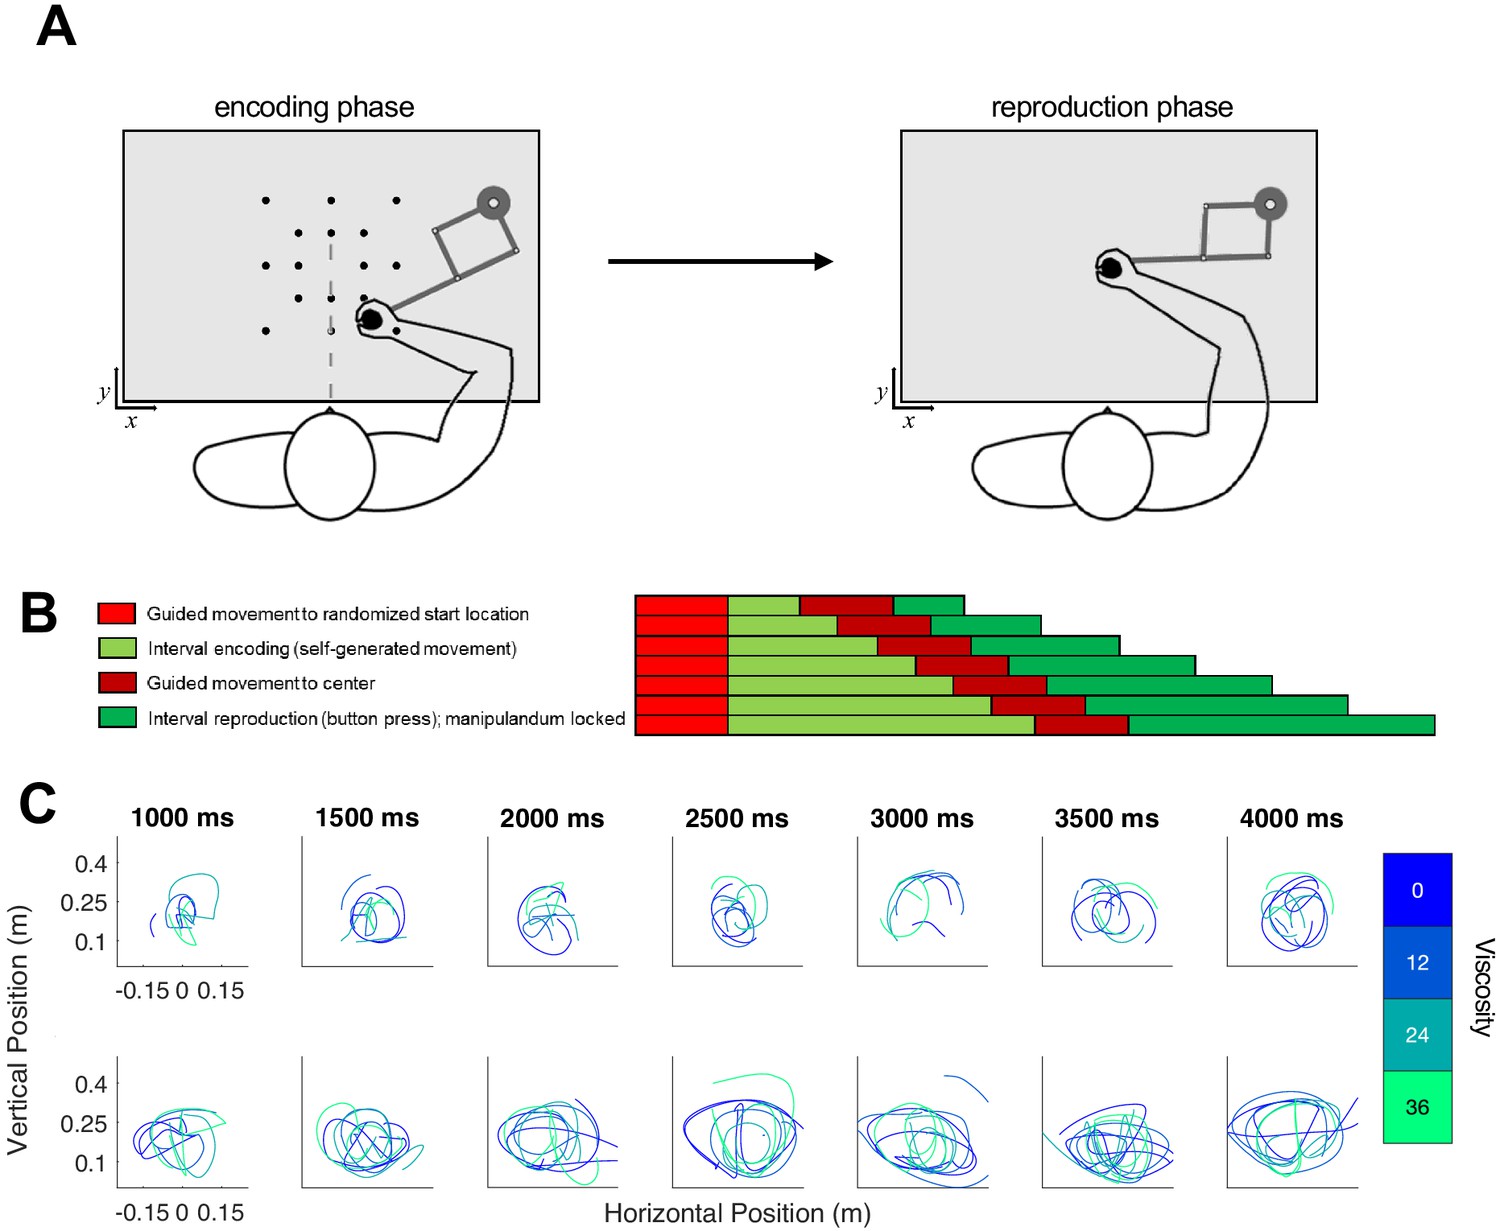
Task schematic of Experiment 2.
(A) Participants began each trial at a randomized start location and were required to initiate movement in order for the test duration to play (encoding phase). Unlike Experiment 1, the desired viscosity was applied immediately rather than in a ramping fashion. Then, the handle was brought to a central location where participants reproduced the duration by holding and releasing a button attached to the handle. (B) Timeline for each of the seven tested intervals. (C) As in Experiment 1, each row displays sample trajectories from two subjects for the seven possible tone durations, with separate lines indicating different viscosities.
Figure 6
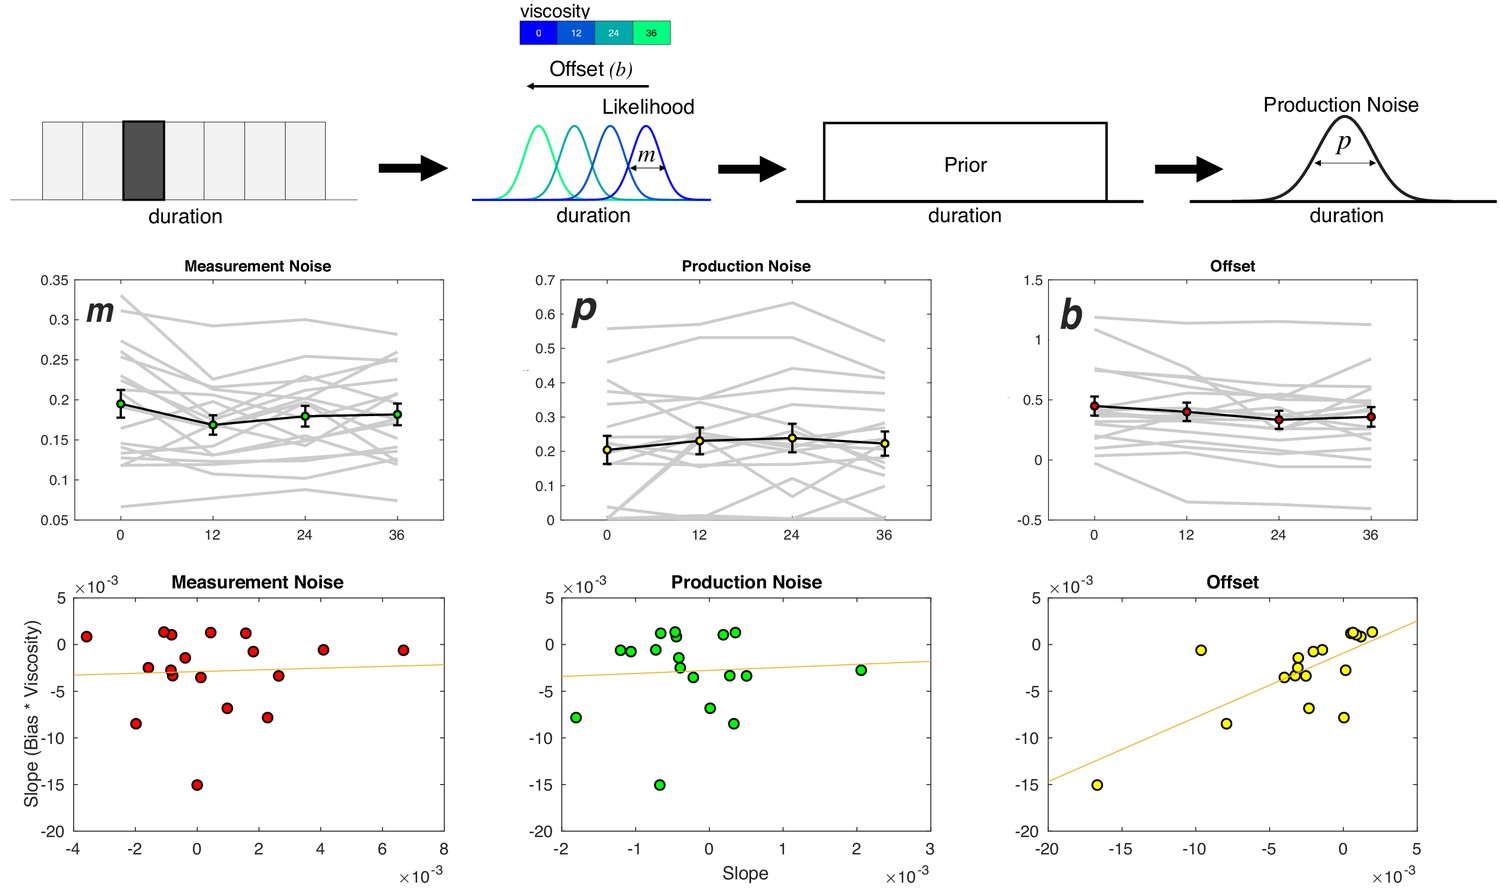
Viscosity shifts time reproduction.
Top: Bayesian Observer Model. On a given trial, a presented duration is drawn from a likelihood distribution with scalar variance leading to a measurement estimate (m) that is shifted by an offset parameter (b). The measurement estimate is combined with a uniform prior distribution of presented durations, and then finally affected by production noise (p). Viscosity was found to specifically shift b in a linear manner, with greater viscosities associated with shorter perceived durations. Middle panels: Fitted results for all three parameters, demonstrating a linear effect of offset, no effect of measurement noise, and a nonlinear (stepwise) shift in production noise with greater viscosities. Bottom panels display correlations with the behavioral effect of viscosity; only the offset parameters exhibited a significant effect (see Table 1 for Fisher Z comparisons). Right panel was additionally significant after outlier removal.
Figure 7
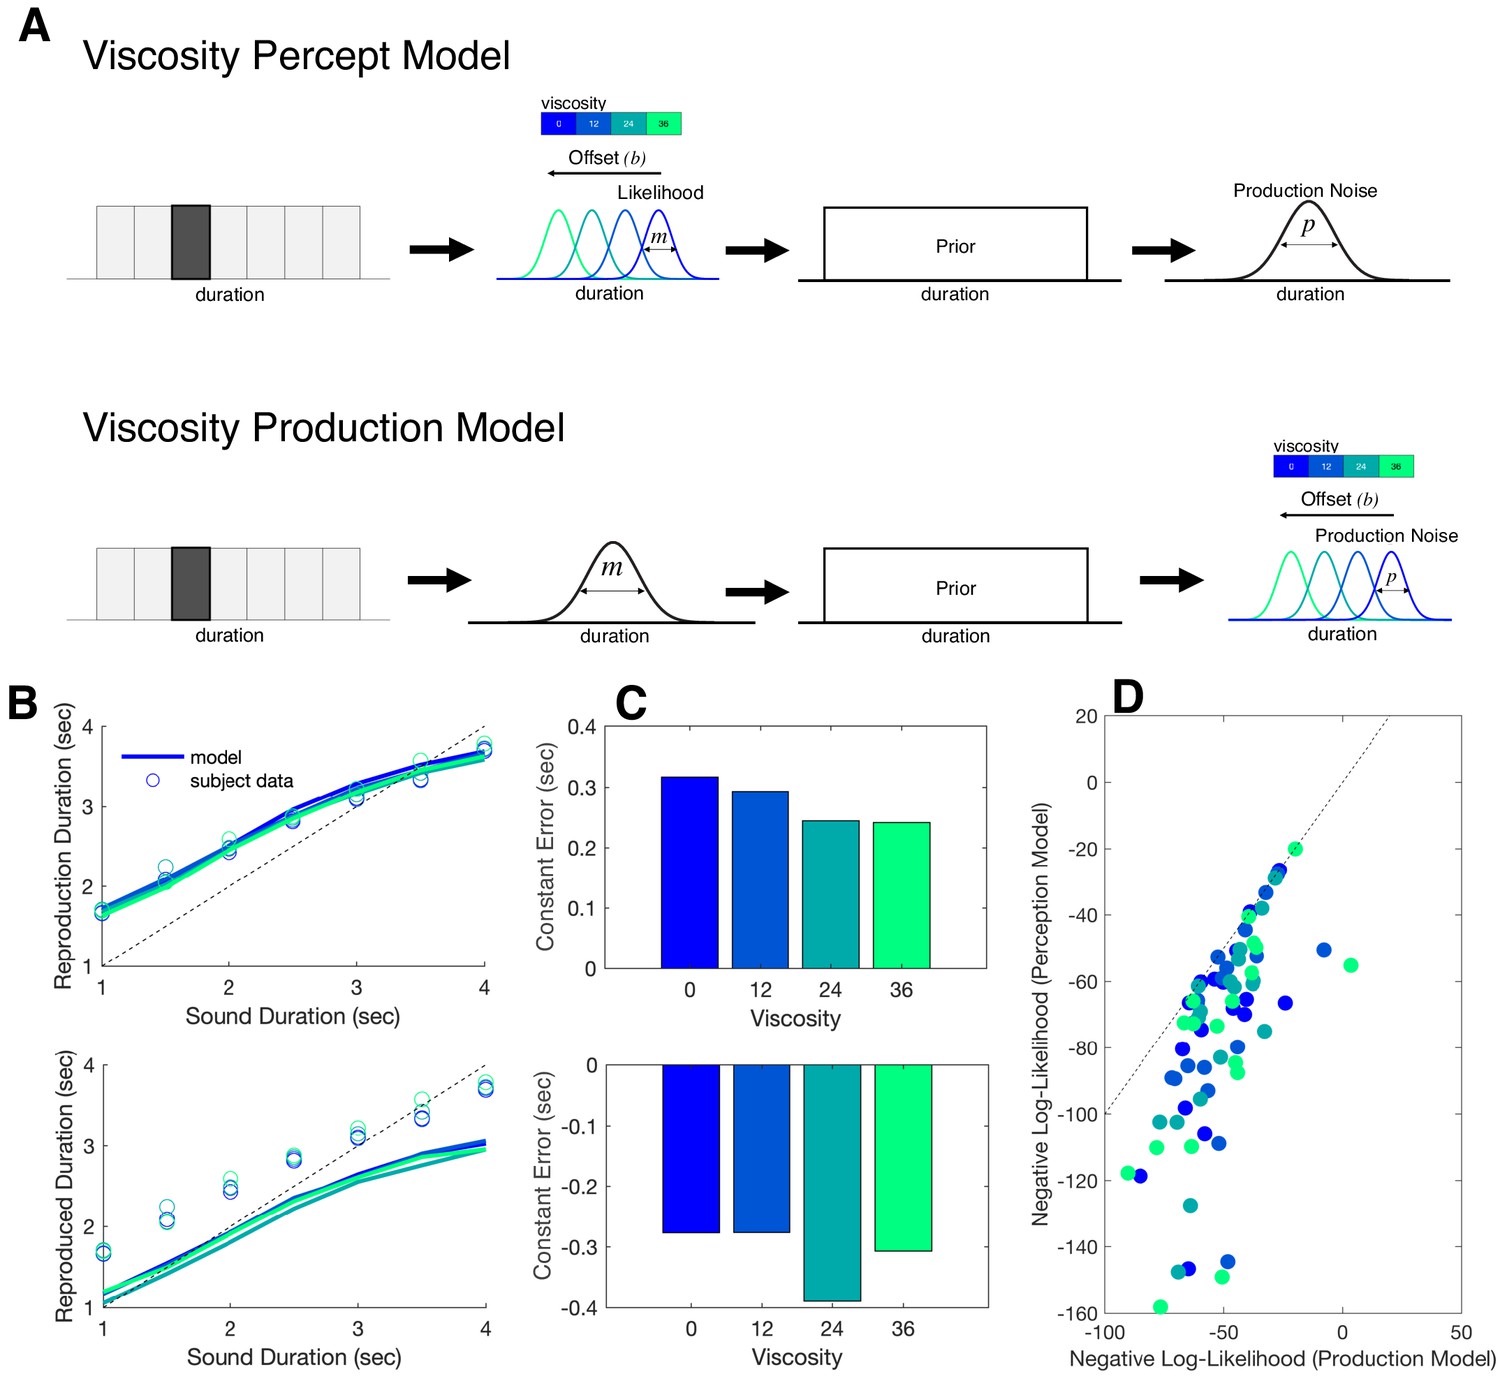
Bayesian observer model of reproduction performance and viscosity.
(A) Schematics for separate Bayesian models, in which the offset term could occur at either measurement level (Perception Model) or the production level (Production Model). (B) Predictive checks for both models, in which model simulations are presented with average subject data for Perception Model (top) and Production Model (bottom). (C) Average Constant Error for Perception (top) and Production (bottom) model simulations. (D) Comparison of Negative Log-Likelihood values for model fits for each model; individual data points represent single subjects, with each color representing a different viscosity. Dashed line represents the identity.
Author response image 1
Tables
Table 1
Correlation coefficients and Fisher Z comparisons between fitted parameters and behavioral effects.
| Experiment 1 - Correlation with Viscosity Effect | Experiment 2 - Correlation with Viscosity Effect | ||||||||
|---|---|---|---|---|---|---|---|---|---|
| drift (v) | threshold (a) | starting point (z) | non decision time (t) | offset (b) | production (p) | measurement (m) | |||
| Pearson | *0.5132 | 0.1211 | 0.0196 | 0.0926 | Pearson | *0.7332 | 0.0626 | 0.0509 | |
| Spearman | *0.7865 | 0.168 | 0.0252 | 0.0733 | Spearman | *0.709 | -0.1022 | -0.0299 | |
| Fisher Z compare Pearson with drift | -3.491 | -1.588 | -2.424 | Fisher Z compare Pearson with drift | 2.508 | 2.545 | |||
| Fisher Z compare Spearman with drift | -5.312 | -3.242 | -3.886 | Fisher Z compare Spearman with drift | 2.711 | 2.263 | |||
Additional files
Download links
A two-part list of links to download the article, or parts of the article, in various formats.
Downloads (link to download the article as PDF)
Open citations (links to open the citations from this article in various online reference manager services)
Cite this article (links to download the citations from this article in formats compatible with various reference manager tools)
Slowing the body slows down time perception
eLife 10:e63607.
https://doi.org/10.7554/eLife.63607


