Evolutionary shifts in taste coding in the fruit pest Drosophila suzukii
- Department of Molecular, Cellular and Developmental Biology, Yale University, United States
Figures
Figure 1
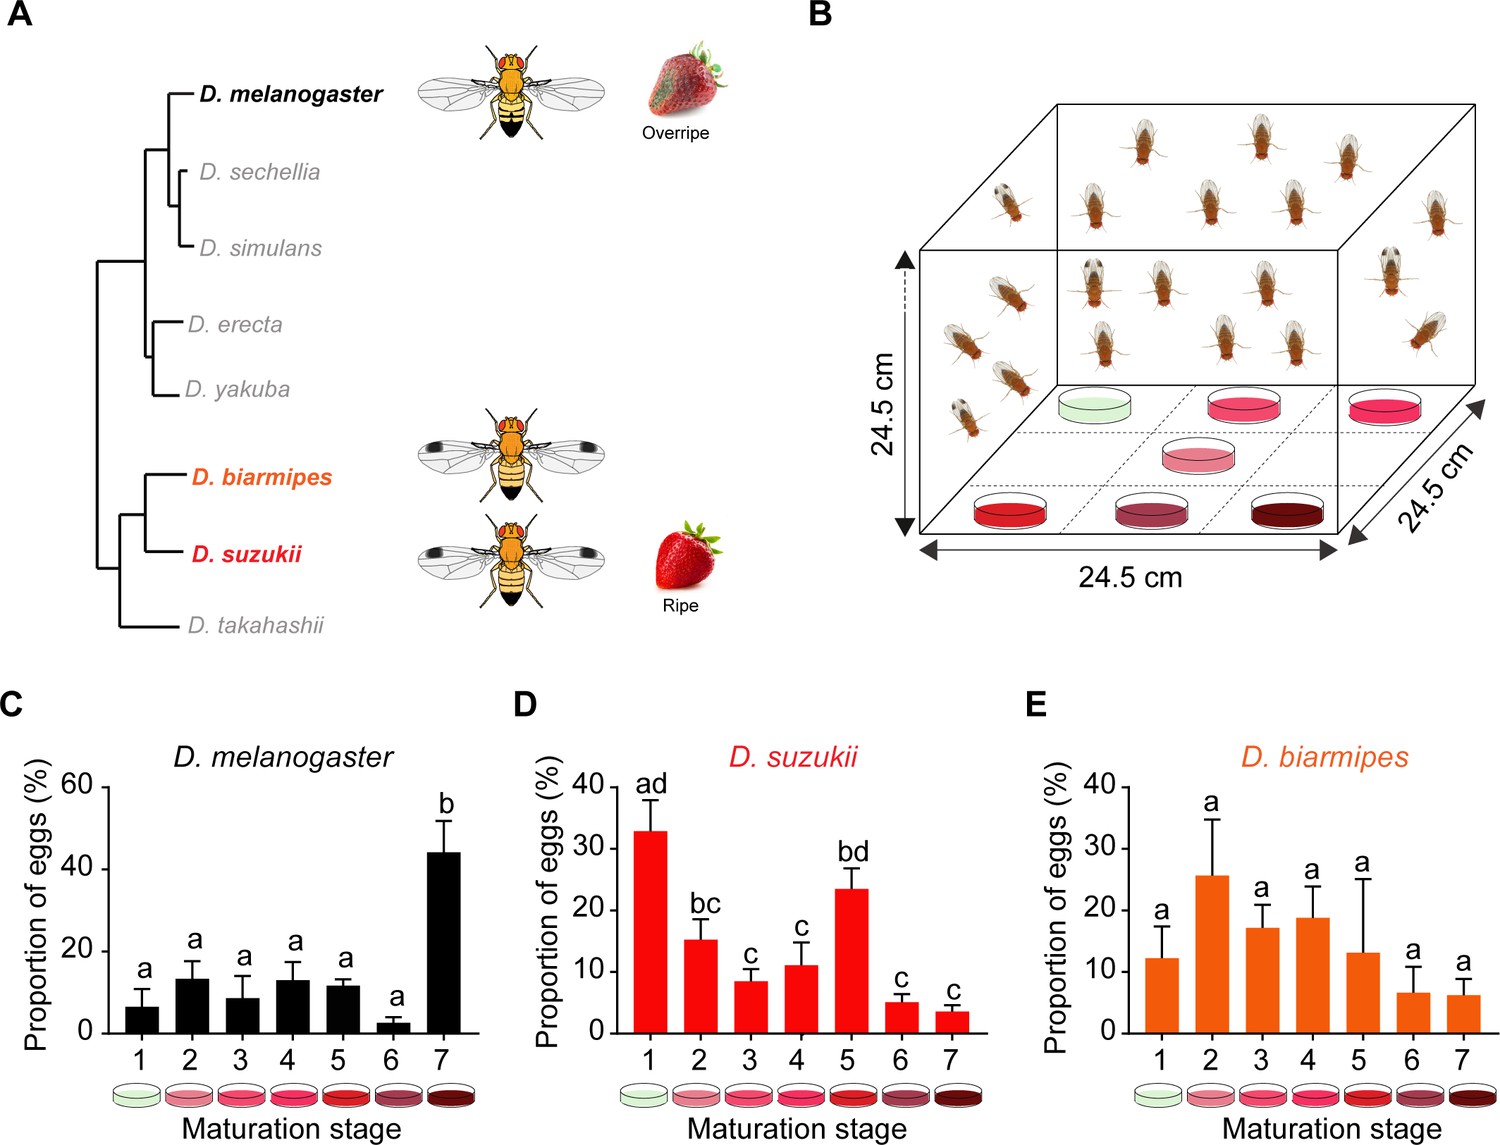
Oviposition preferences of Drosophila suzukii among a broad range of ripening stages.
(A) Phylogenetic tree depicting the relationship between D. suzukii and closely related Drosophila species. From http://spottedwingflybase.org/. (B) The multiple-choice oviposition assay. (C–E) Oviposition preferences of Drosophila melanogaster (C), D. suzukii (D), and Drosophila biarmipes (E) for different ripening stages: 1 = white-green, 2 = mature first blush, 3 = light red, 4 = dark red, 5 = ripe, 6 = early fermented, and 7 = fermented. One-way ANOVA followed by Tukey’s multiple comparison test; n = 5. Error bars are SEM. Values indicated with different letters are significantly different (p<0.05).
-
Figure 1—source data 1
Source data for number of eggs laid on each stage of ripening in Figure 1.
- https://cdn.elifesciences.org/articles/64317/elife-64317-fig1-data1-v1.xlsx
Figure 2
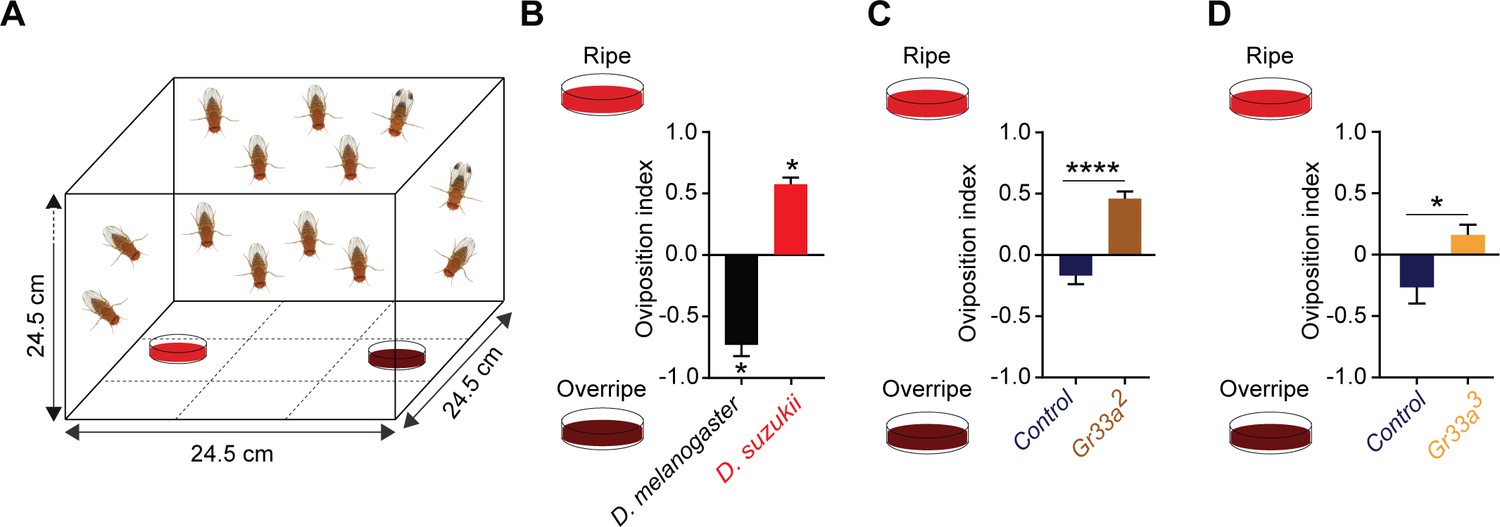
Taste contributes to the oviposition difference between Drosophila suzukii and Drosophila melanogaster.
(A) The two-choice oviposition assay. (B) Oviposition preferences of D. suzukii and D. melanogaster for ripe and overripe strawberry. *p<0.05, Mann-Whitney test, n = 7. The numbers of eggs laid were 43 ± 7 for D. melanogaster and 77 ± 12 for D. suzukii. Error bars are SEM. (C,D) Preferences of two Gr33 mutants and control w1118 Canton-S flies for ripe and overripe strawberry. The strawberries used in (D) were from a different source than those in all other experiments. **p<0.01, ****p<0.0001, Mann-Whitney test; n = 18 for Gr33a2 and n = 19–20 for Gr33a3 and control. In (C) the numbers of eggs laid were 156 ± 15 for the control and 90 ± 10 for Gr33a2; in (D) the numbers were 56 ± 7 for the control and 173 ± 25 for Gr33a3. Error bars are SEM.
Figure 3 with 1 supplement
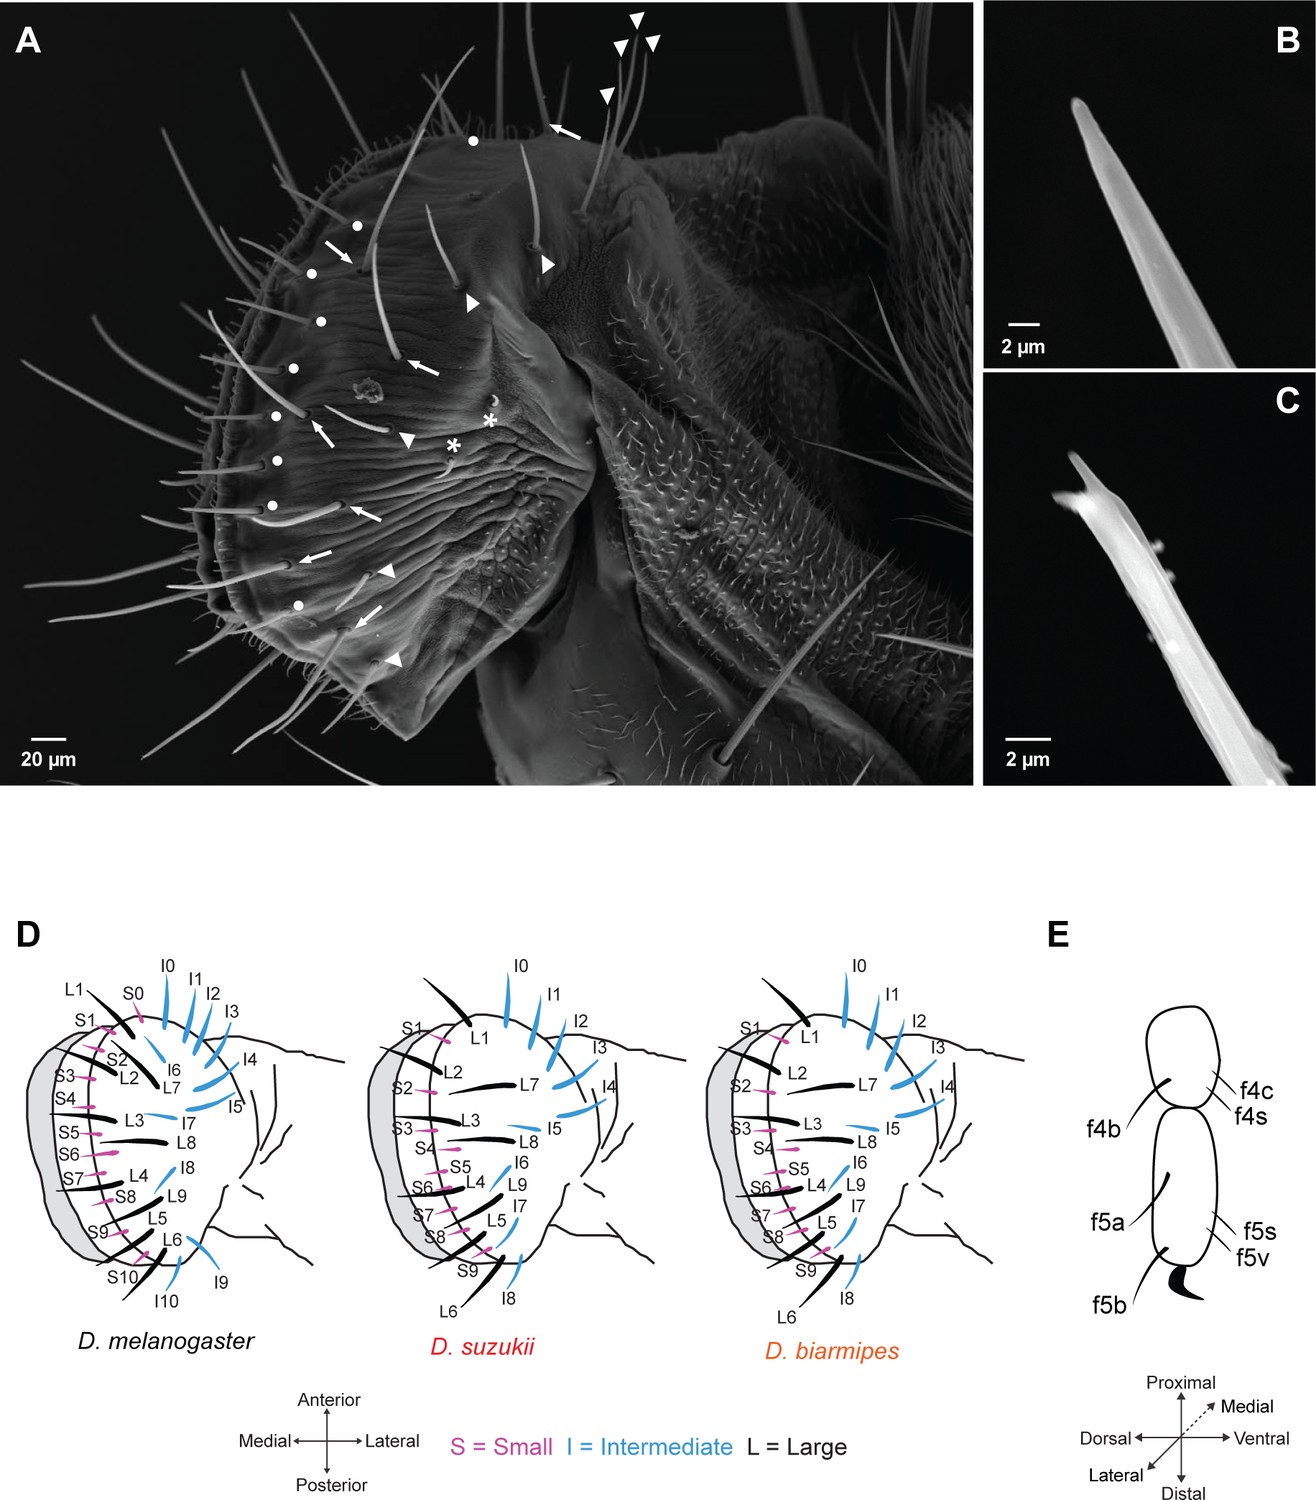
Taste sensilla on the labellum and leg.
(A) Scanning electron micrograph of the labellum of D. suzukii showing short taste sensilla (white dots), intermediate taste sensilla (white arrowheads), long taste sensilla (white arrows), and sensilla that have no terminal pores (asterisks). (B) Scanning electron micrograph of an intermediate taste sensillum with a straight tip. (C) Scanning electron micrograph of a long taste sensillum with a forked tip. (D) Maps of labellar taste sensilla in the three species. (E) Map of taste sensilla on the two most distal tarsal segments of the female foreleg; the map applies to all three species.
Figure 3—figure supplement 1
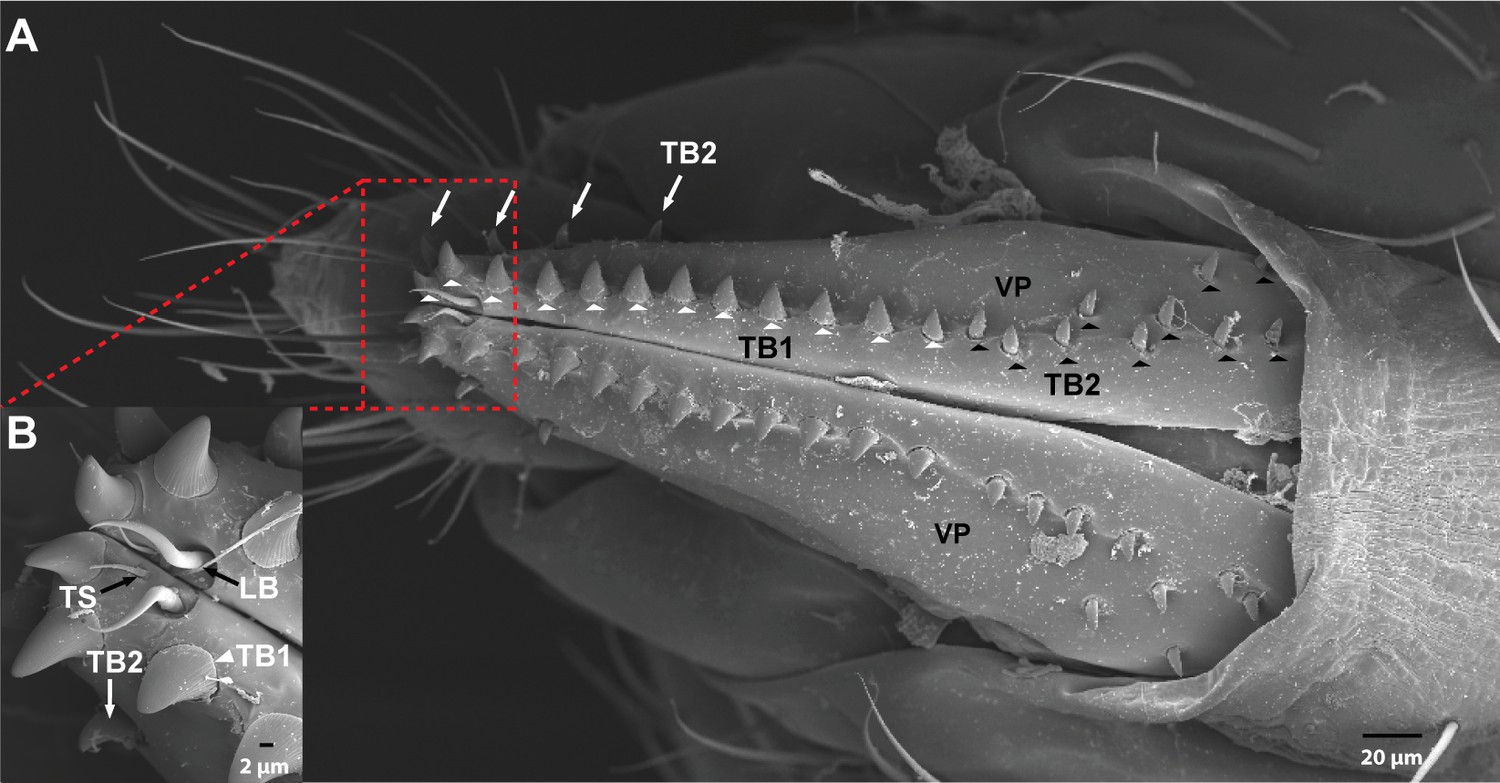
The ovipositor in Drosophila suzukii.
(A) Scanning electron micrograph of the ovipositor of D. suzukii showing bristles on each vaginal plate (VP). White arrowheads = thorn bristles type 1. White arrows and black arrowheads = thorn bristles type 2. (B) The distal part of the ovipositor of D. suzukii showing trichoid sensillum (TS), long bristle (LB), and thorn bristle type 1 (TB1). Extended description: Three TS are at the distal end of each VP (B). Each is inserted in a basal socket, is ~10 μm in length, and tapers to a fine tip. One LB, ~25 μm in length, is at the distal end of each VP (B). Each LB has a large socket and a smooth, slender, curved shaft that ends in a fine tip. TB1 are stout, blunt-tipped bristles ~14 μm in length (white arrowheads in A). There are 12–14 TB1 in a row, close to the distal lower margin of each vaginal plate. They have a longitudinally grooved shaft inserted in a narrow socket. This type of bristle has no counterpart in D. melanogaster, and could conceivably function in evaluation of the stiffness of oviposition sites; D. suzukii differs from related species in its preference for substrate stiffness. TB2 are similar to TB1 but are less stout, have wider sockets, and are located in two groups. The first group is a row of four bristles of variable size (A, white arrows), located on the upper margin of the distal half of each vaginal plate. The second group consists of 10–15 bristles (A, black arrowheads) in variable locations on the proximal half of each vaginal plate. In D. melanogaster, this type of bristle is represented only by a row of 10–15 bristles along the length of each vaginal plate (Hodgkin and Bryant, 1978; Lauge, 1982).
Figure 4 with 2 supplements
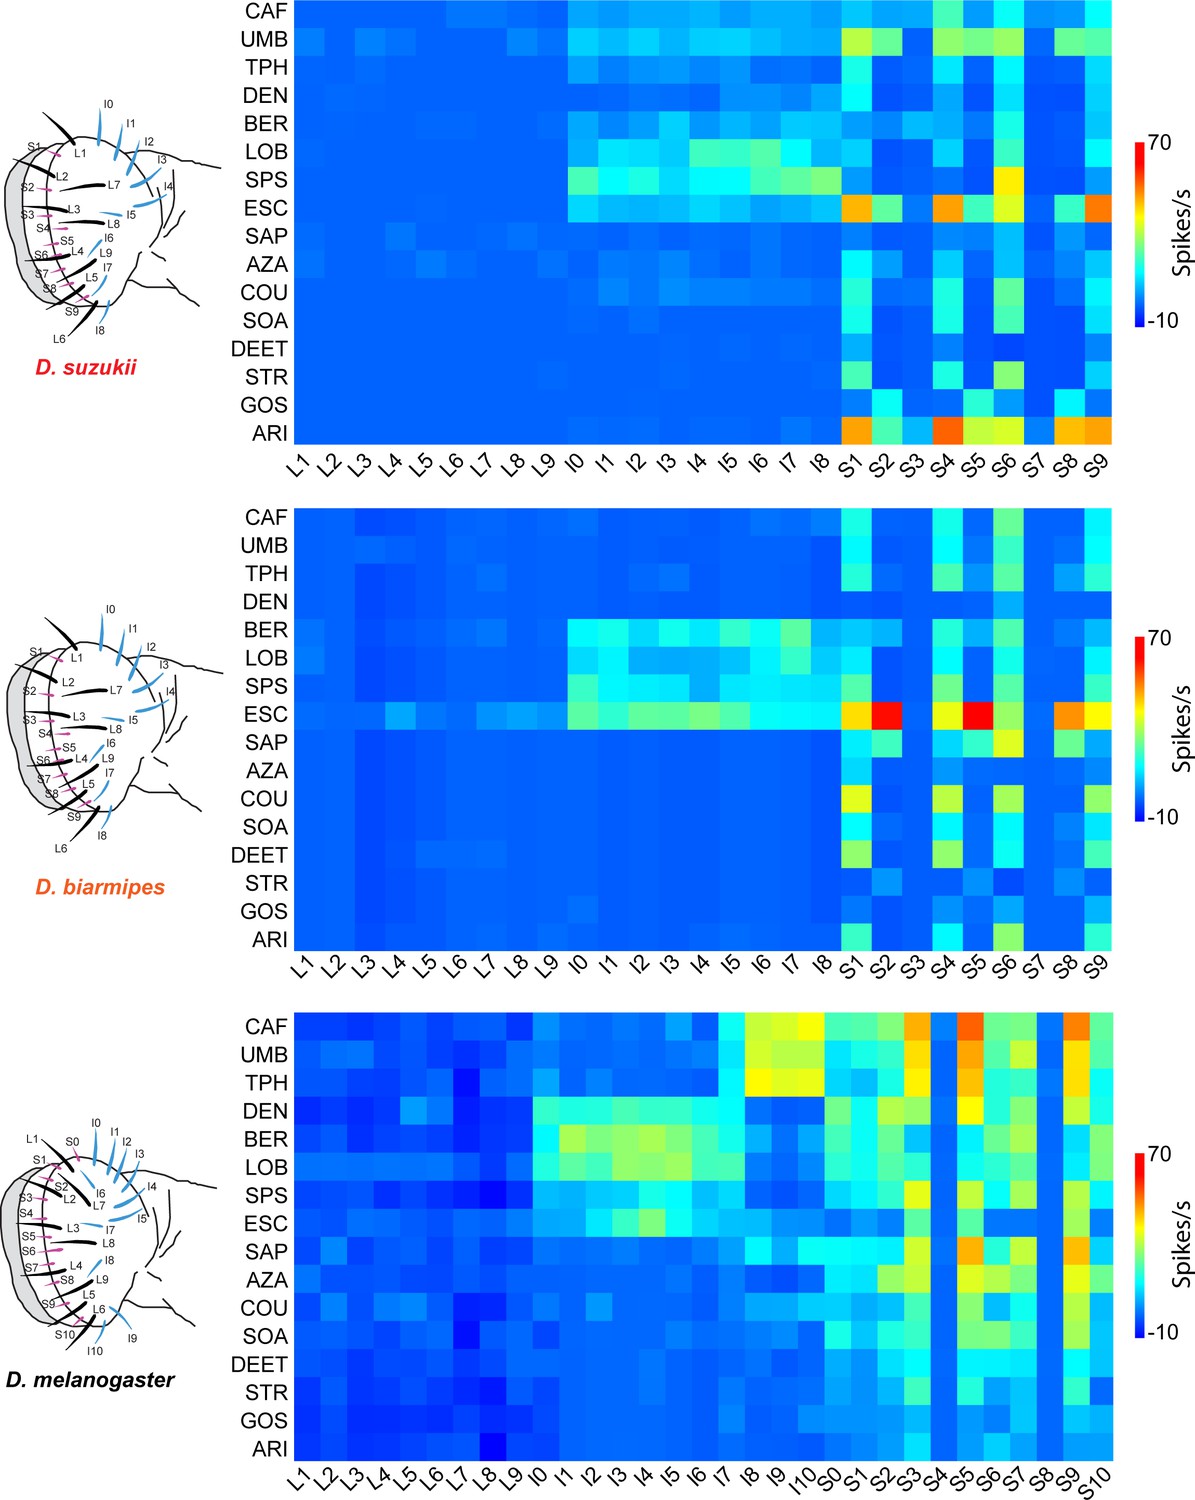
Electrophysiological responses to bitter compounds in labellar sensilla of the three Drosophila species.
For Drosophila suzukii, n = 5–10 for 84% of the 459 tastant-sensillum combinations; n > 10 for the remaining 16%. For Drosophila biarmipes, n = 5–10 for 96% of the 459 tastant-sensillum combinations; n > 10 for the remaining 4%. Responses of Drosophila melanogaster are adapted from Weiss et al., 2011. Responses to the diluent control, tricholine citrate (TCC), were subtracted. Values for D. suzukii and D. biarmipes are in a Supplementary file.
-
Figure 4—source data 1
Responses to bitter compounds across species.
(A) Responses in spikes/s of labellar sensilla of three species to bitter compounds. Values represent the mean responses in spikes per second as measured by the number of action potentials generated over a 500 ms interval. For Drosophila suzukii, n = 5–10 for 84% of the 459 tastant-sensillum combinations; n > 10 for the remaining 16%. For Drosophila biarmipes, n = 5–10 for 96% of the 459 tastant-sensillum combinations; n > 10 for the remaining 4%. Responses to the tricholine citrate (TCC) diluent have been subtracted from the tastant responses. (B) SEMs of responses shown in (A). Data from Drosophila melanogaster are from Weiss et al., 2011.
- https://cdn.elifesciences.org/articles/64317/elife-64317-fig4-data1-v1.pdf
Figure 4—figure supplement 1
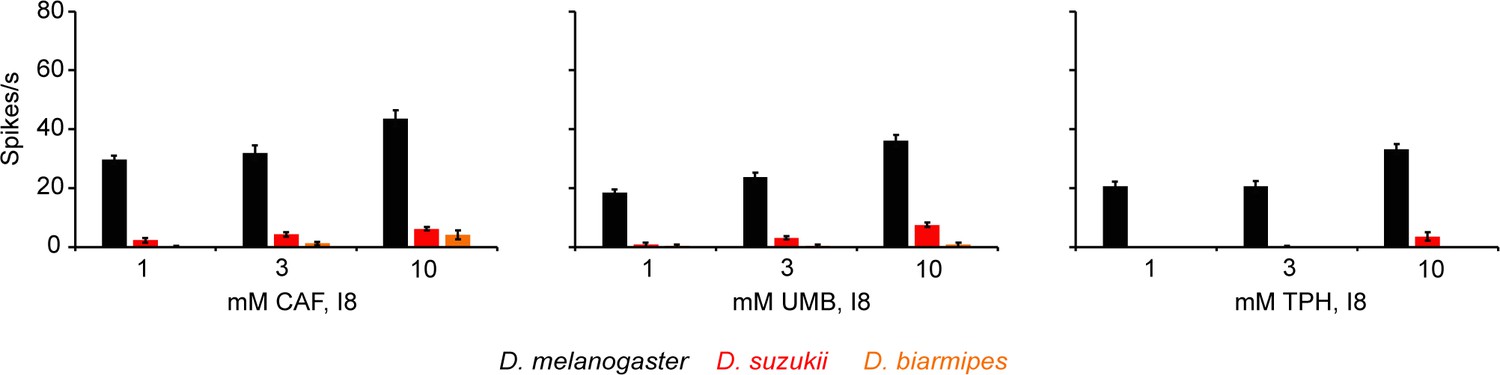
Dose response curves of caffeine (CAF), umbelliferone (UMB), and theophylline (TPH) from I8 in all three species.
Some values are too small to be seen.
Figure 4—figure supplement 2
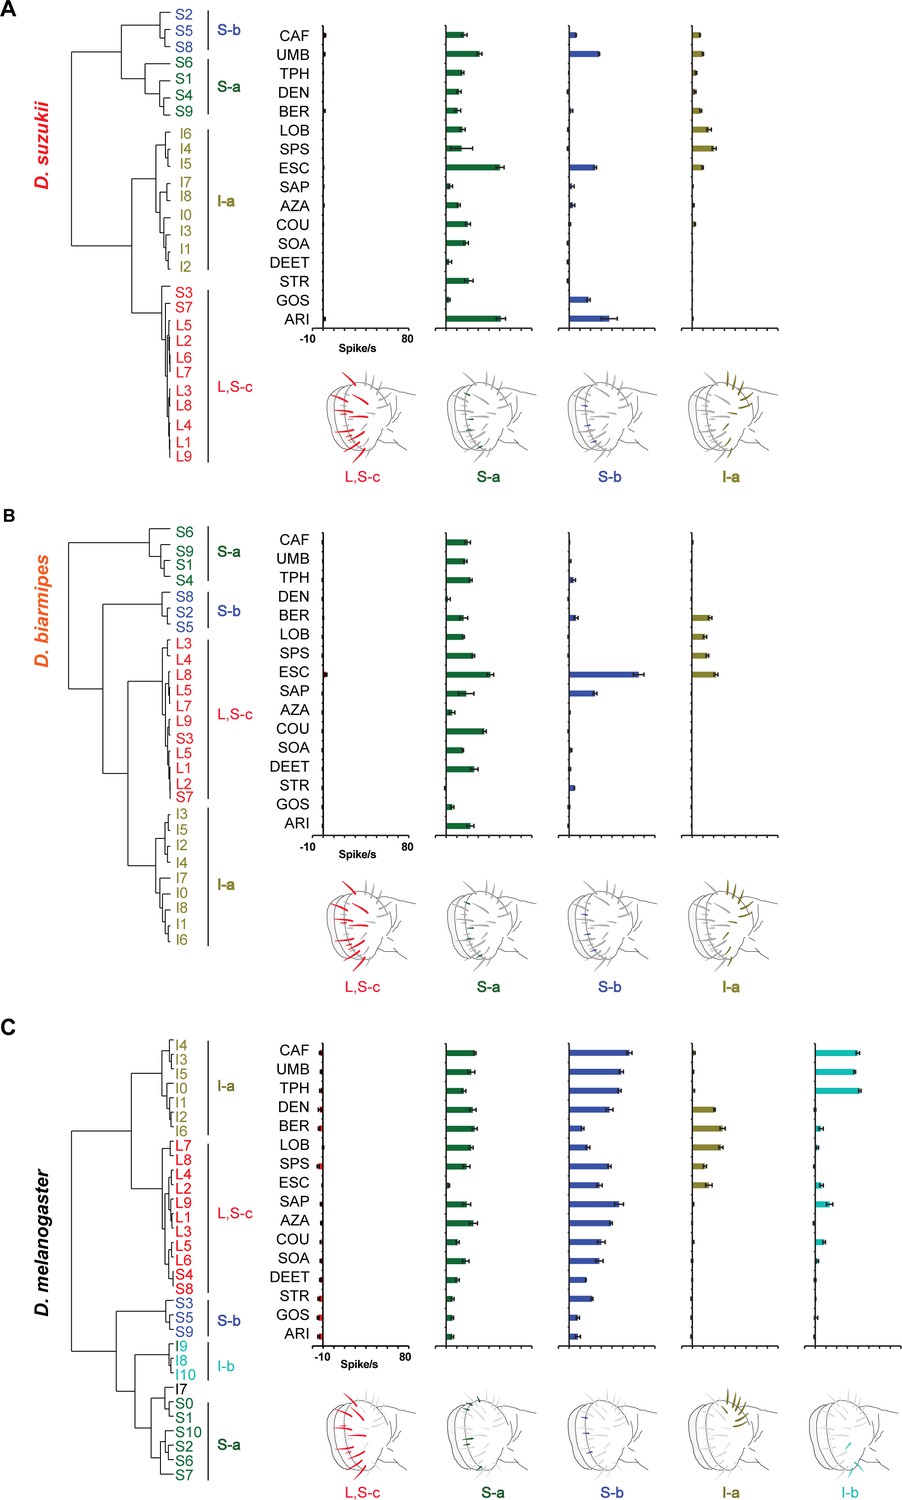
Hierarchical cluster analysis, based on Ward's method, of labellar sensilla in Drosophila suzukii (A), Drosophila biarmipes (B), and Drosophila melanogaster (C).
The diluent control was subtracted from each response. Although the S-a and S-b sensilla occupy similar map positions in Drosophila simulans and D. biarmipes, there are two fewer S sensilla in these species than in D. melanogaster and the positions of the remaining S sensilla do not align precisely with those in D. melanogaster; we acknowledge that it is accordingly more difficult to correlate with confidence each S cluster of D. melanogaster with a particular S cluster of the other two species. In D. melanogaster, values are taken from Figure 4 and Figure 4—figure supplement 1; data from D. melanogaster are from Weiss et al., 2011.
Figure 5
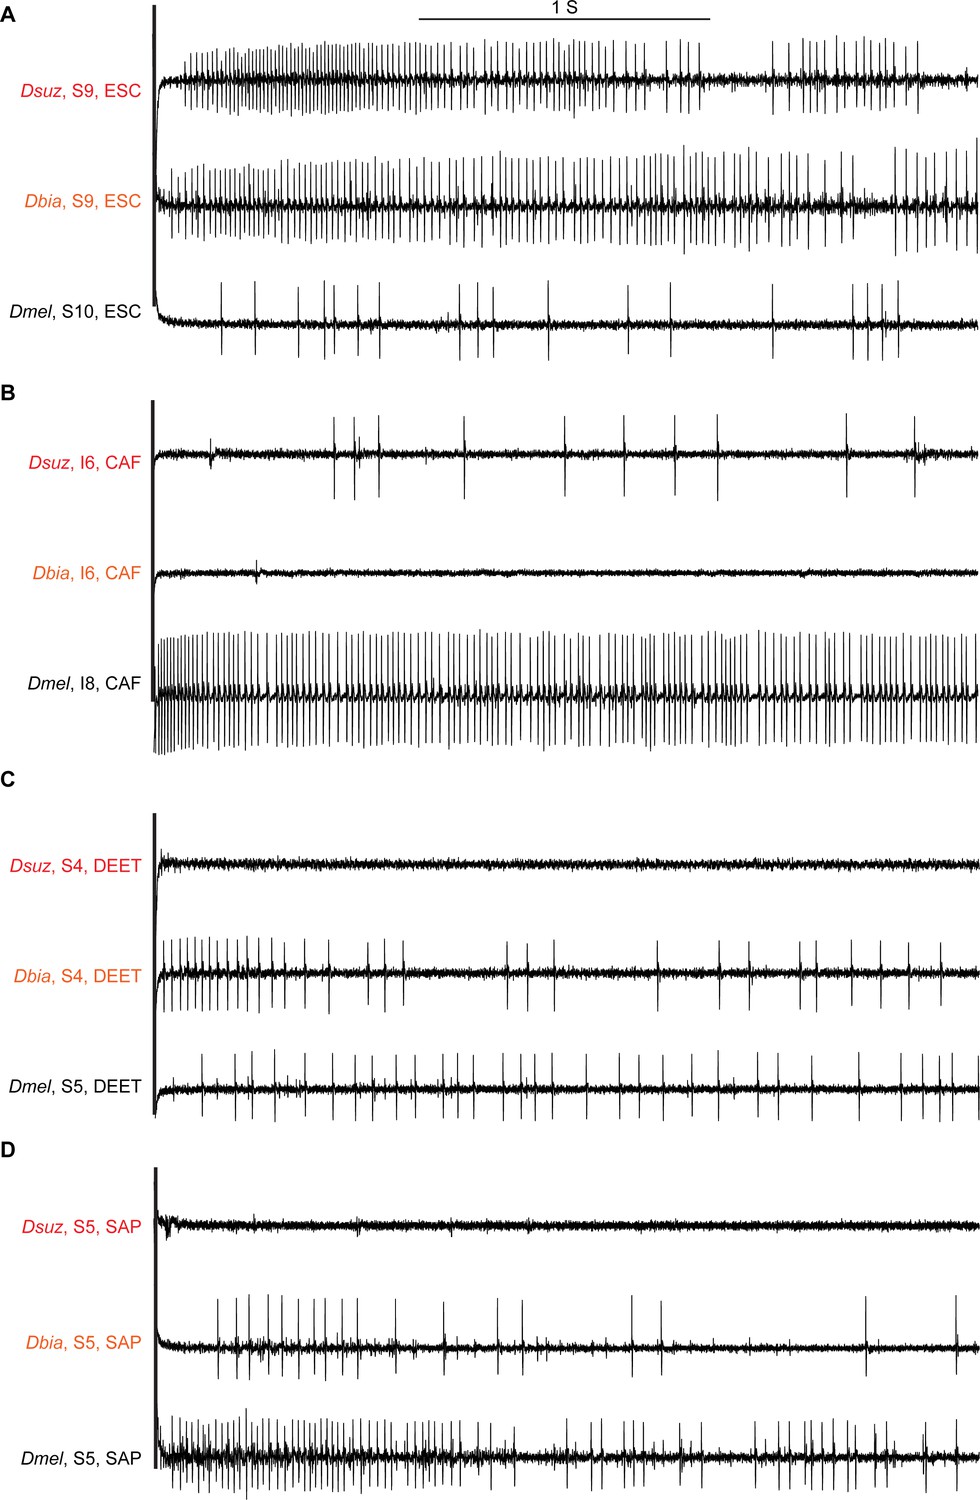
Sample electrophysiological traces from labellar sensilla of the three species.
(A) Escin (ESC) elicits strong responses from S9 in Drosophila suzukii and Drosophila biarmipes but a weak response from S10 in Drosophila melanogaster, which is at approximately the same position as S9 in the other species. (B) Caffeine (CAF) elicits little, if any, response from I6 in D. suzukii and D. biarmipes but a strong response from I8 in D. melanogaster, which is at approximately the same position as I6 in the other species. (C) N,N-Diethyl-meta-toluamide (DEET) elicits little, if any, response from any S sensillum in D. suzukii but elicits responses from several S sensilla in D. biarmipes and D. melanogaster. (D) Saponin (SAP) elicits little, if any, response from any S sensillum in D. suzukii but elicits responses from most S sensilla in D. biarmipes and D. melanogaster.
Figure 6 with 2 supplements
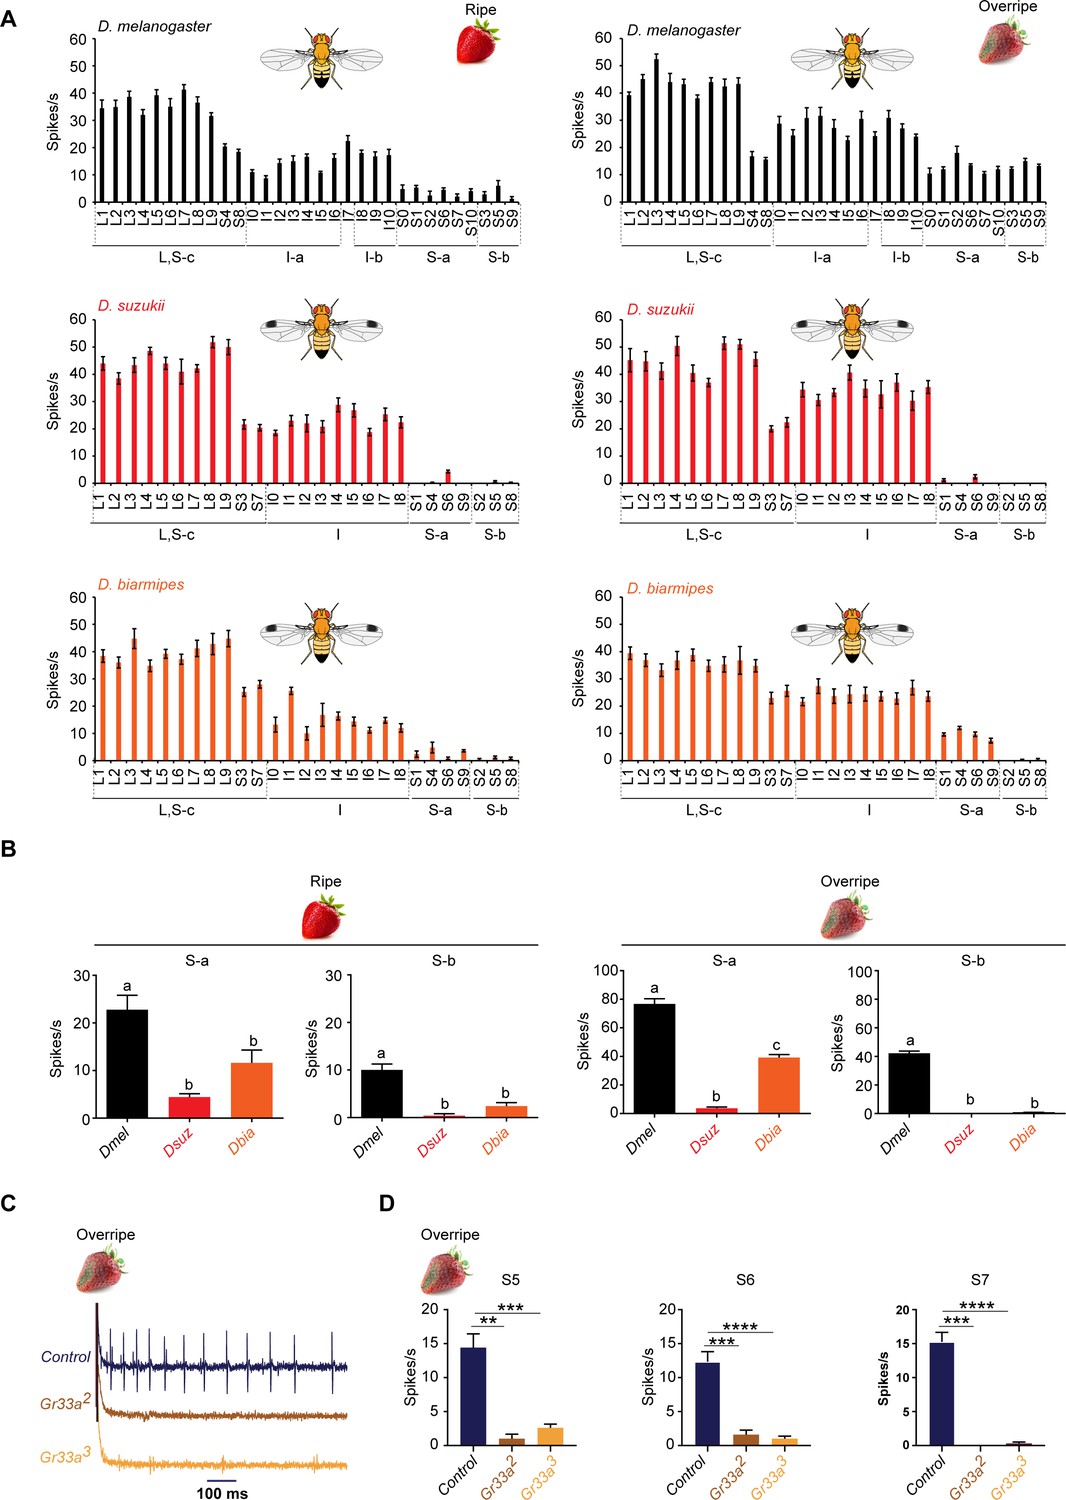
Strawberry extracts elicit different labellar responses from Drosophila suzukii than from other species.
(A) Labellar taste responses of Drosophila melanogaster, D. suzukii, and Drosophila biarmipes to ripe and overripe strawberry. The strawberry extracts were those used as stages 5 and 7 in the experiment shown in Figure 1. n = 5–15. Error bars are SEM. (B) Summed responses of S-a and S-b sensilla to ripe and overripe strawberry. One-way ANOVA followed by Tukey’s multiple comparison test; n = 5. Error bars are SEM. Values indicated with different letters are significantly different (p<0.05). (C) Sample traces of electrophysiological recordings from S7 of the control w1118 Canton S, Gr33a2, and Gr33a3 to overripe strawberry. (D) Electrophysiological responses of S5, S6, and S7 of w1118 Canton S, Gr33a2, and Gr33a3 to overripe strawberry (**p=0.001, ***p=0.0001, ****p<0.0001; Mann-Whitney test; n = 5–14).
-
Figure 6—source data 1
Source data for spike numbers in Figure 6.
- https://cdn.elifesciences.org/articles/64317/elife-64317-fig6-data1-v1.xlsx
Figure 6—figure supplement 1
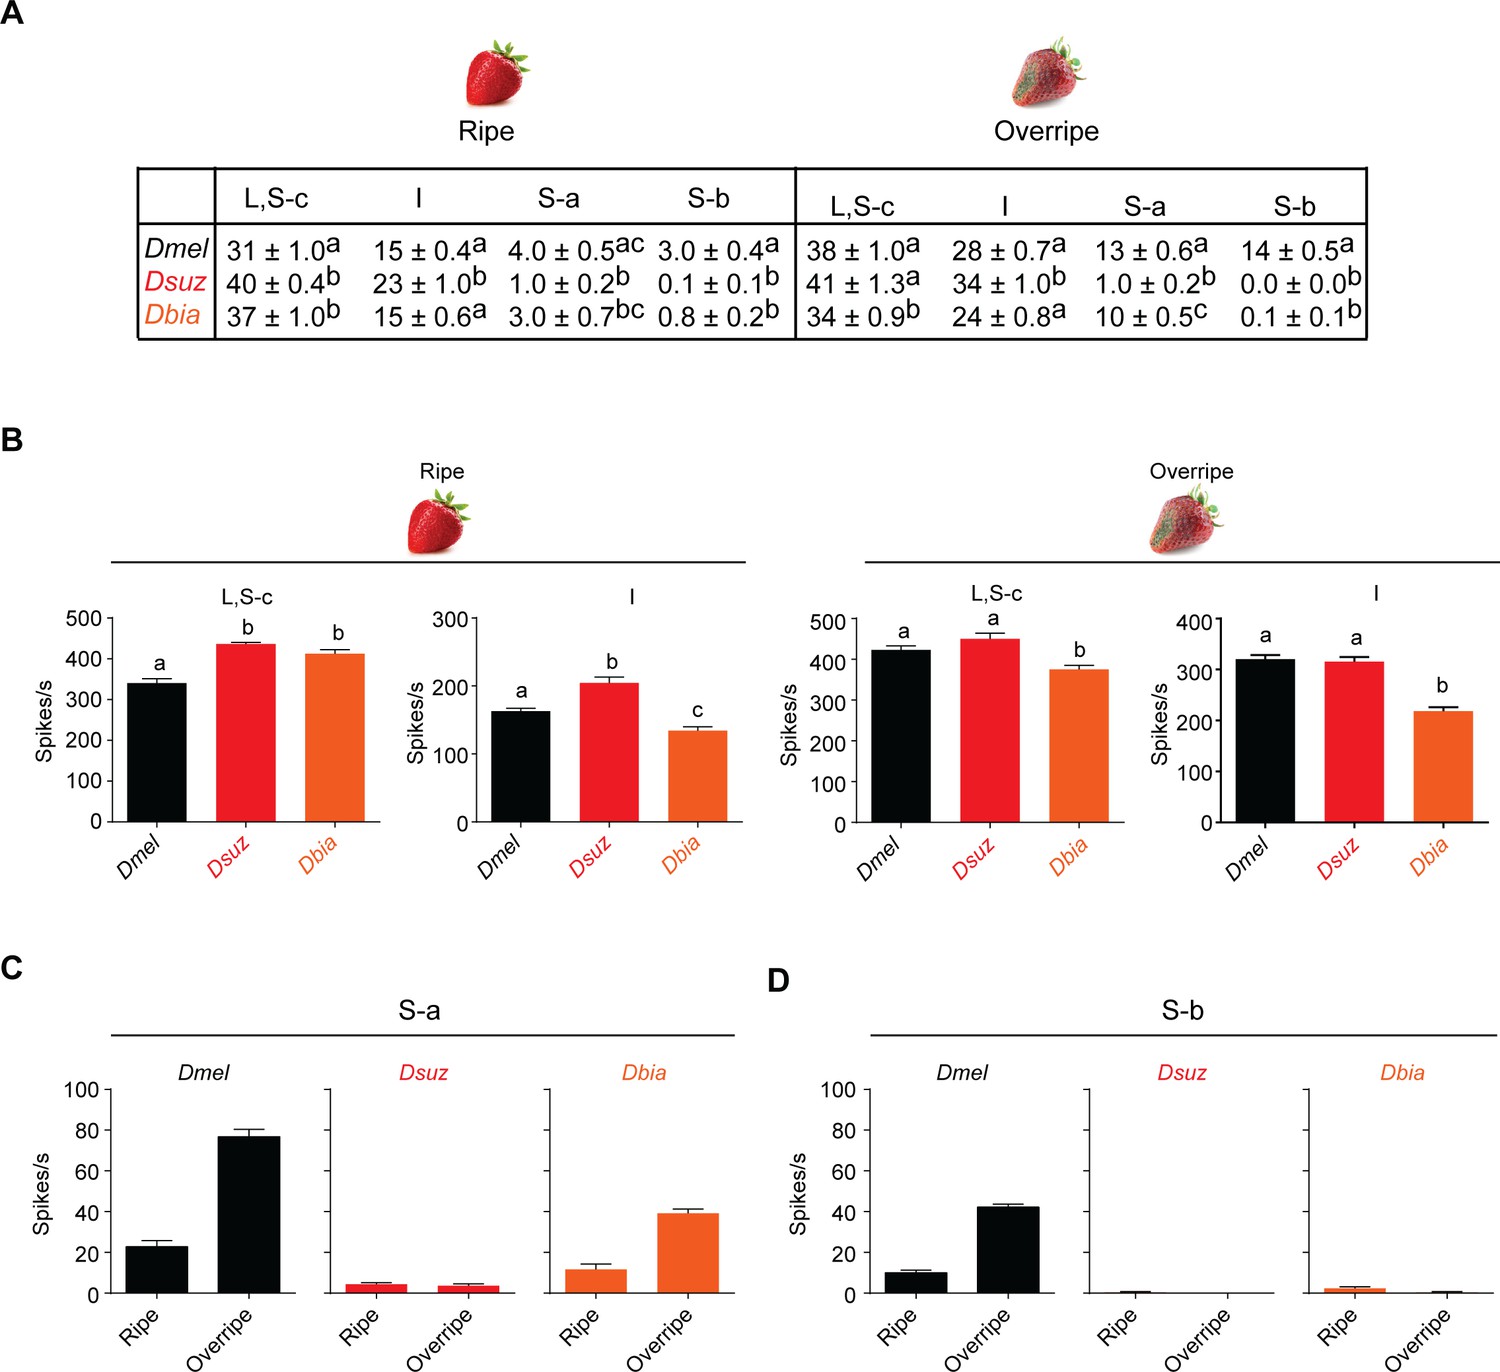
Strawberry extracts elicit different labellar responses from Drosophila suzukii than from other species.
(A) Mean labellar responses of each functional class to ripe and overripe strawberry in all three species. Labellar taste responses of Drosophila melanogaster, D. suzukii, and Drosophila biarmipes to ripe and overripe strawberry. n = 5–15. Error bars are SEM. 'S-c' refers to the two S sensilla that show little or no response to any of the tested bitter compounds and that cluster with L sensilla. Data for I sensilla of D. melanogaster include I7. (B) Summed responses of L, S-c, and I sensilla to ripe and overripe strawberry. One-way ANOVA followed by Tukey’s multiple comparison test; n = 5. Error bars are SEM. Responses of S sensilla are shown in Figure 6B. Values indicated with different letters are significantly different. (C,D) Data from Figure 6B plotted as a comparison of responses to different extracts.
Figure 6—figure supplement 2
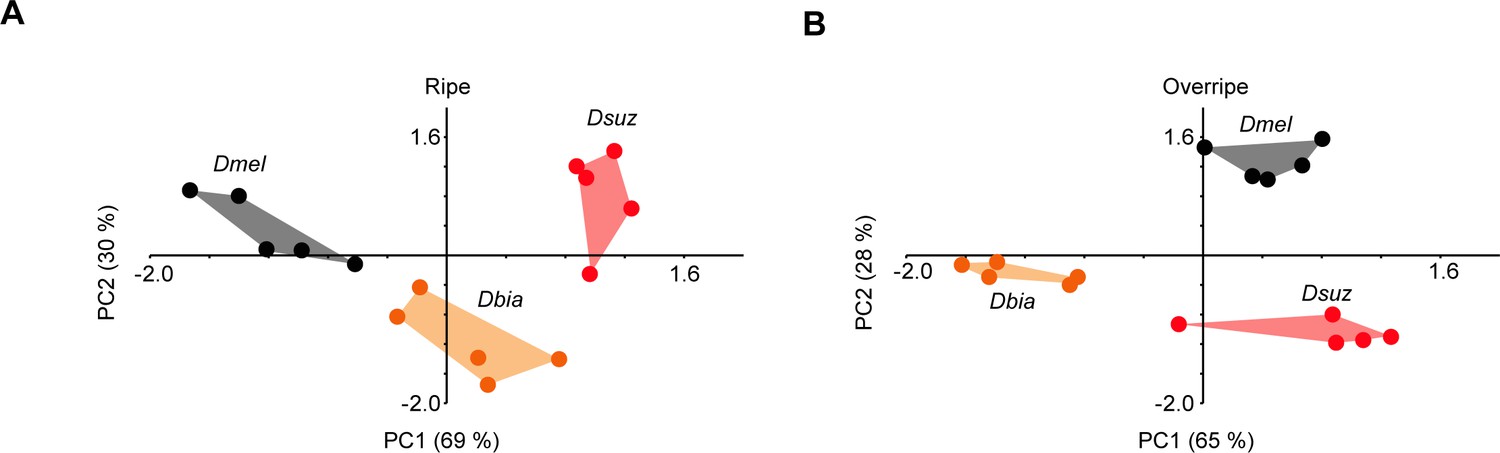
All three species are distinguishable based on their responses to extracts of ripe and overripe strawberry.
Principal component analysis (PCA), calculated from labellar responses to extracts of ripe (A) or overripe strawberry (B).
Figure 7 with 1 supplement
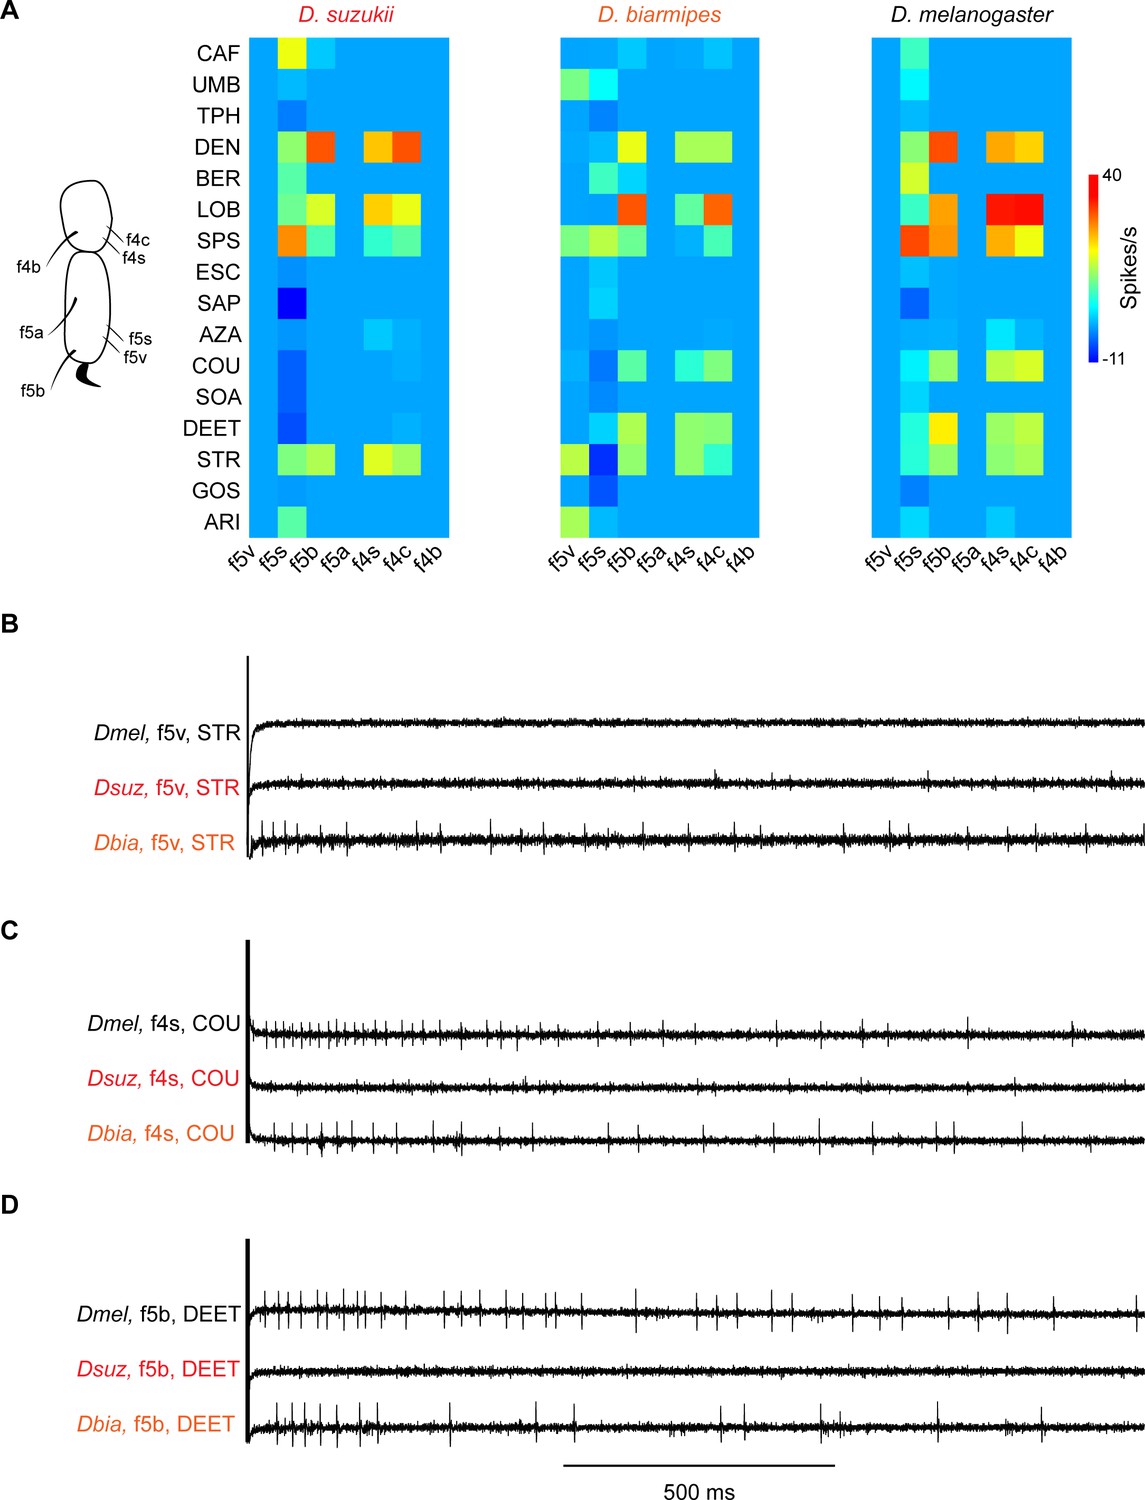
Coding of bitter compounds in the female foreleg of Drosophila suzukii and related species.
(A) Heat map of electrophysiological responses to bitter compounds. n = 5–17. Responses to the diluent control, tricholine citrate (TCC), were subtracted. (B) Sample electrophysiological traces. Strychnine nitrate salt (STR) elicits little, if any, response from f5v in Drosophila melanogaster and D. suzukii but elicits a response from f5v in Drosophila biarmipes. (C) Coumarin (COU) elicits response from f4s in D. melanogaster and D. biarmipes but elicits little, if any, response from f4s in D. suzukii. (D) N,N-Diethyl-meta-toluamide (DEET) elicits a response from f5b in D. melanogaster and D. biarmipes but elicits little, if any, response from f5b in D. suzukii.
-
Figure 7—source data 1
Responses in spikes/s of tarsal sensilla of three species to bitter compounds.
Values represent the mean ± SEM responses of spikes/s. n = 5–17. Responses to the diluent control, tricholine citrate (TCC), were subtracted.
- https://cdn.elifesciences.org/articles/64317/elife-64317-fig7-data1-v1.pdf
Figure 7—figure supplement 1
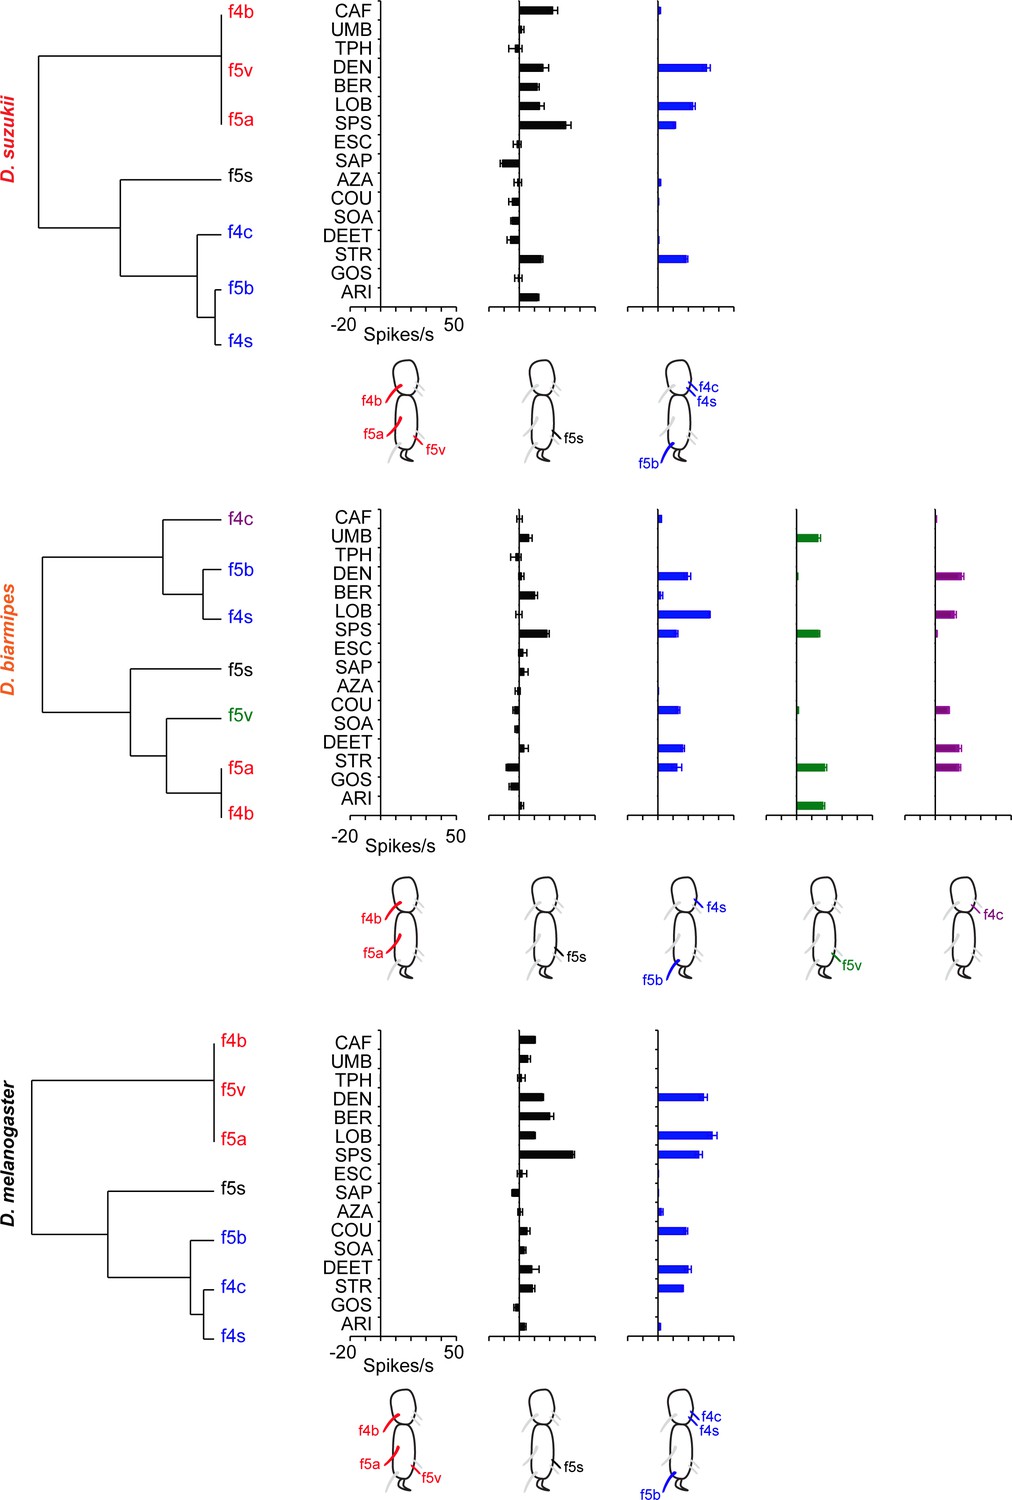
Clustering of taste sensilla in the last two tarsal segments of the female foreleg into functional classes in all three species.
Cluster analysis, based on the bitter compounds and the sensilla tested in Figure 7, using Ward’s method. The diluent control was subtracted from each response. Values are taken from Figure 7 and Figure 7—source data 1.
Figure 8
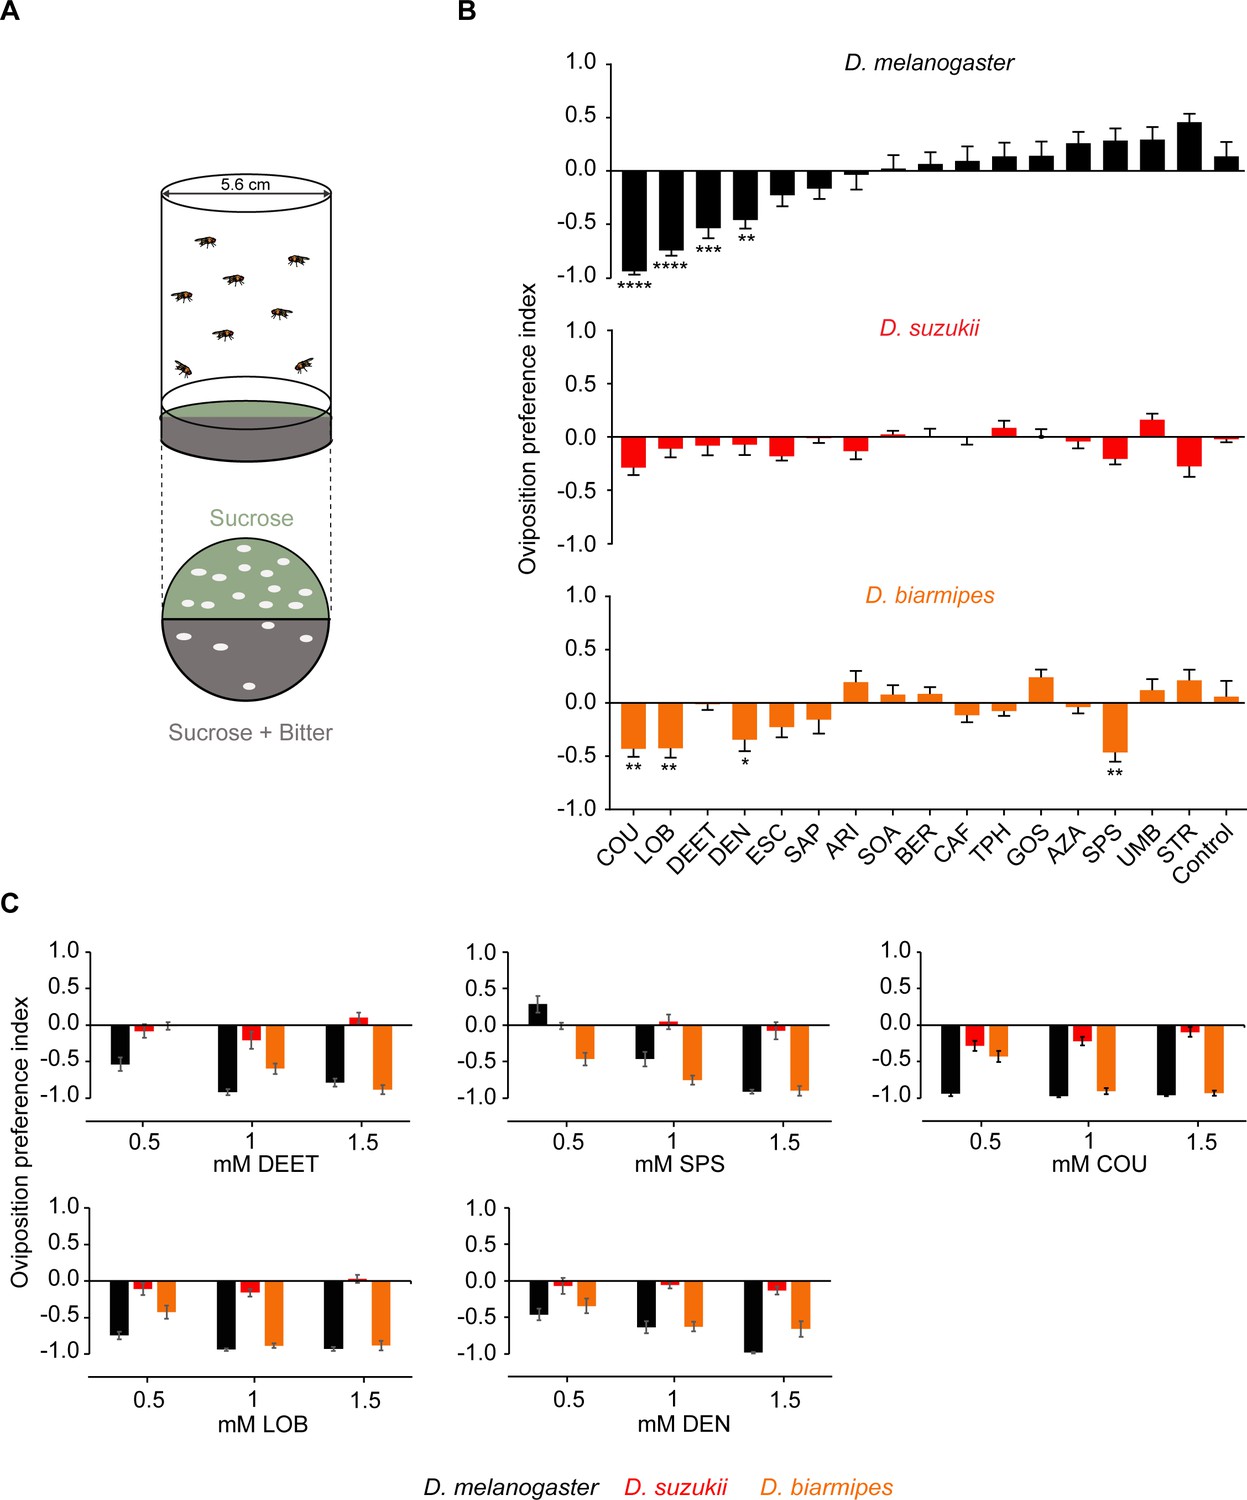
Drosophila suzukii oviposition is not deterred by bitter compounds that deter its close relatives.
(A) The two-choice oviposition assay. The oviposition preference is defined as: (number of eggs on sucrose substrate – number of eggs on sucrose+bitter substrate)/(total number of eggs on both substrates). (B) Oviposition preferences of Drosophila melanogaster, D. suzukii, and for individual bitter compounds. One-way ANOVA followed by Dunnett’s multiple comparison test; n = 15–21. Error bars are SEM. (C) Oviposition preferences for three different concentrations of N,N-Diethyl-meta-toluamide (DEET), sparteine sulfate salt (SPS), coumarin (COU), (-)-lobeline hydrochloride (LOB), and denatoniumbenzoate (DEN). Data for 0.5 mM concentrations were taken from panel B. n = 6–11. Error bars are SEM. *p<0.05, **p<0.01, ***p<0.001, ****p<0.0001.
Figure 9 with 3 supplements
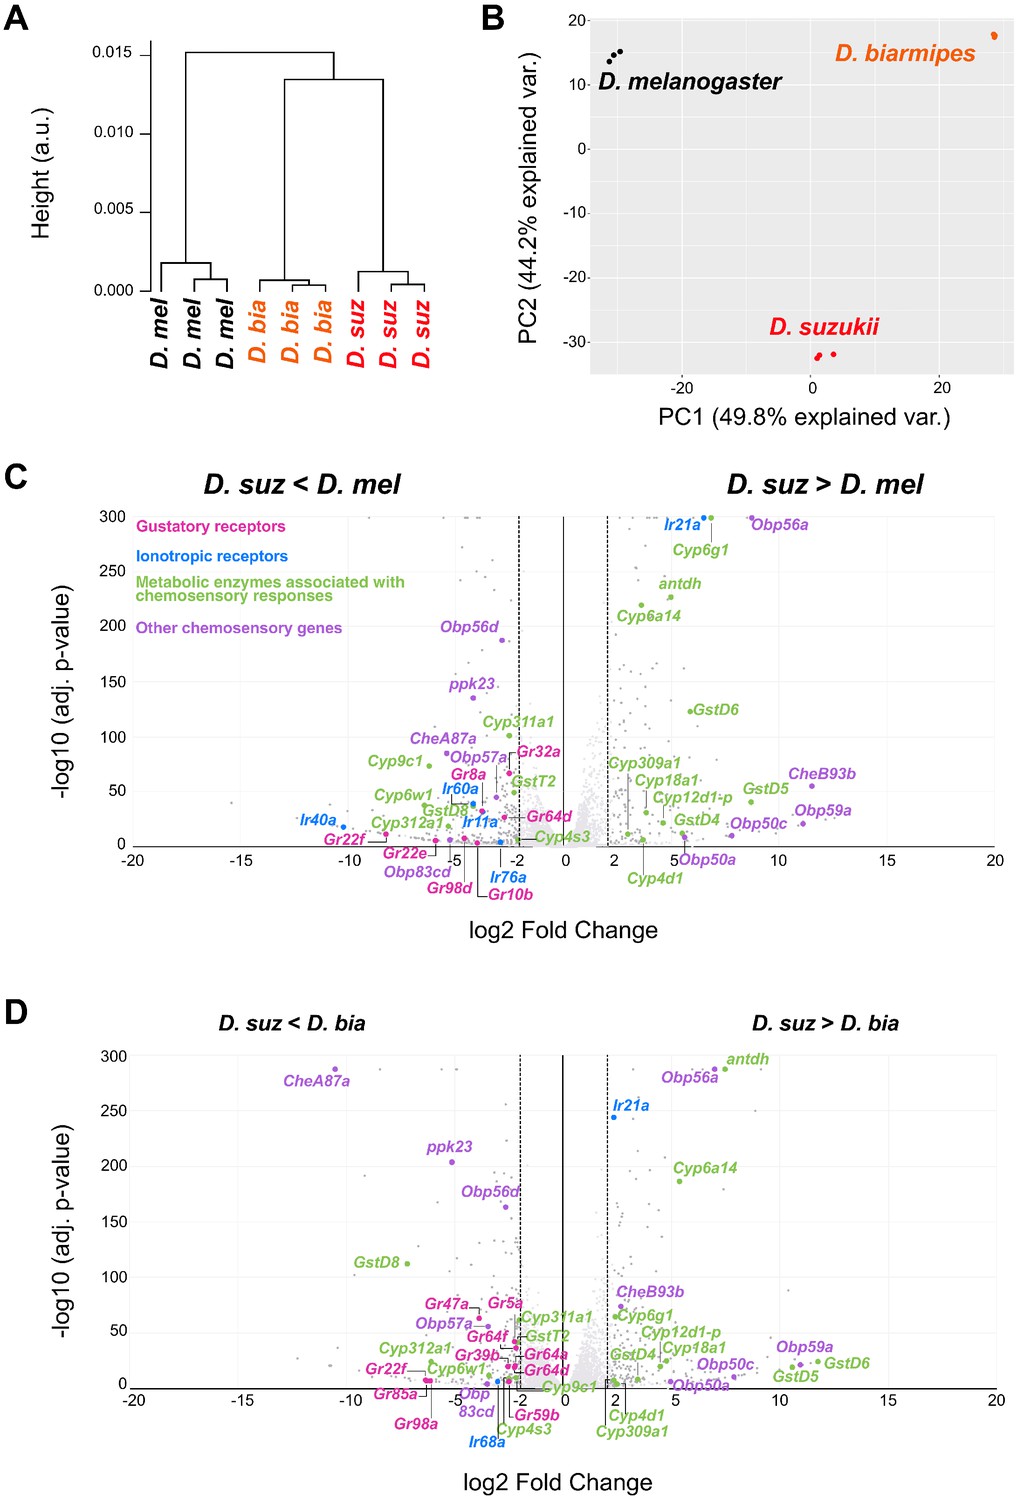
Distinct labellar transcriptomes across the Drosophila species.
(A) Hierarchical clustering of the Drosophila melanogaster, Drosophila suzukii, and Drosophila biarmipes labellar transcriptomes. (B) Principal component analysis of the D. melanogaster, D. suzukii, and D. biarmipes labellar transcriptomes. (C) Volcano plot highlighting differentially expressed chemosensory-related genes between D. suzukii and D. melanogaster (|log2FC| ≥ 2, q < 0.01). All differentially expressed gustatory receptors (Grs) (pink) and ionotropic receptors (IRs) (blue) are labeled; metabolic enzymes (green) and other chemosensory genes (purple) are labeled only if differentially expressed between D. suzukii and both of the other species. We note that the genes indicated here belong to families of genes associated with chemosensation, but not all individual members have been implicated in chemoreception. (D) Volcano plot highlighting differentially expressed chemosensory-related genes between D. suzukii and D. biarmipes (|log2FC| ≥ 2, q < 0.01). For convenience of illustration we have plotted the log2 Fold Change but we note that in some cases, such as Gr22f and IR40a expression in D. suzukii, the expression level is extremely low, so that the fold-change is not informative.
Figure 9—figure supplement 1
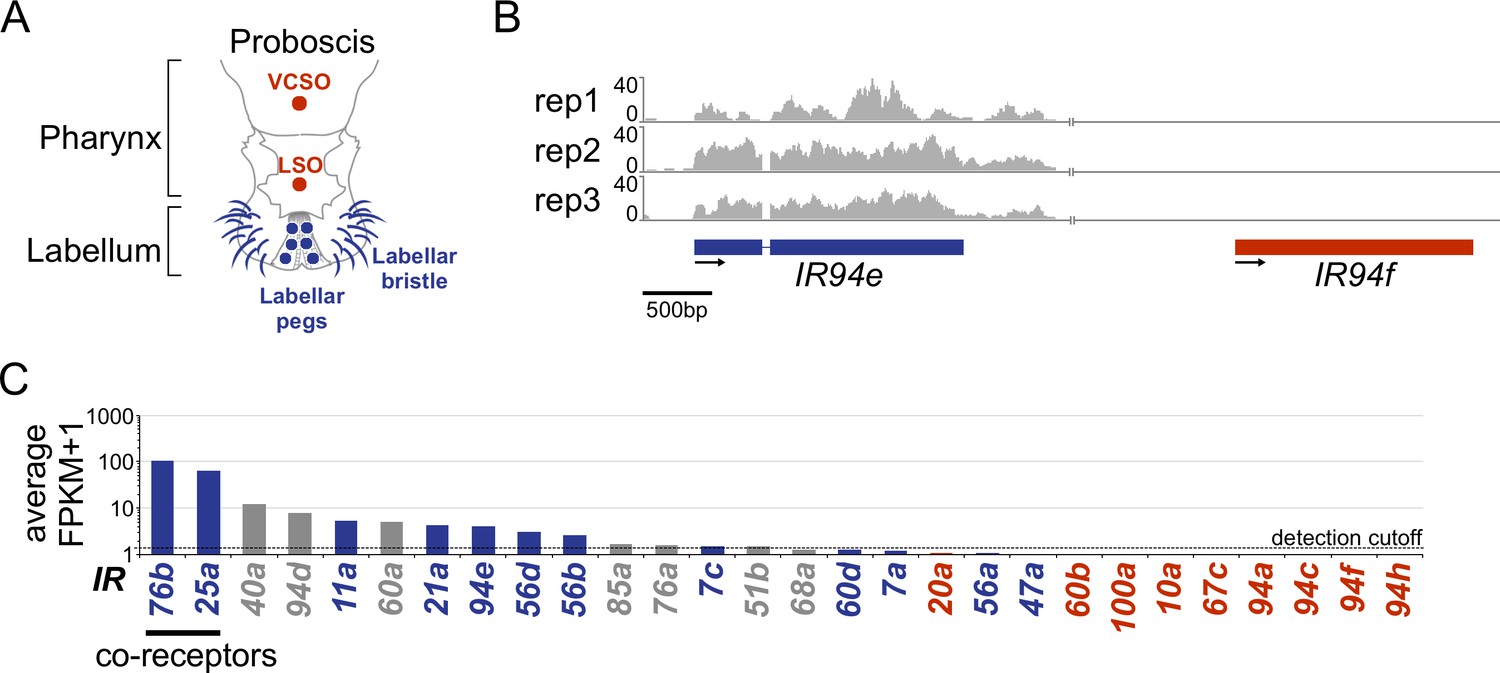
Ionotropic receptor transcript detection in the labellum.
(A) Diagram of the Drosophila mouthparts and the labellar (blue) and pharyngeal (red) taste sensilla (adapted from Koh et al., 2014). (B) RNAseq coverage of typical labellar (blue) and pharyngeal (red) ionotropic receptor (IR) genes (n=3). (C) Drosophila melanogaster labellar expression (average Fragments Per Kilobase per Million mapped reads (FPKM)+1 values). Expression of IR62a was not determined because it could not be distinguished from CG12090 transcripts. IRs detected in the D. melanogaster mouthparts in previous studies (Koh et al., 2014; Sánchez-Alcañiz et al., 2018) are indicated in different font colors (detection in the labellum, blue; absence in the labellum and detection in the pharynx, red; previous detection in neither labellum nor pharynx, gray). Genes with an FPKM value ≥ 0.5 were considered expressed; the detection cutoff is denoted by the black dotted line.
Figure 9—figure supplement 2

Gustatory receptor (Gr) and odorant binding protein (Obp) expression in the labellum of Drosophila melanogaster.
D. melanogaster labellar expression level of Grs (A) and Obps (B) average FPKM values ≥0.5; detection in the labellum in previous studies (Galindo and Smith, 2001; Moon et al., 2009; Weiss et al., 2011, blue).
Figure 9—figure supplement 3
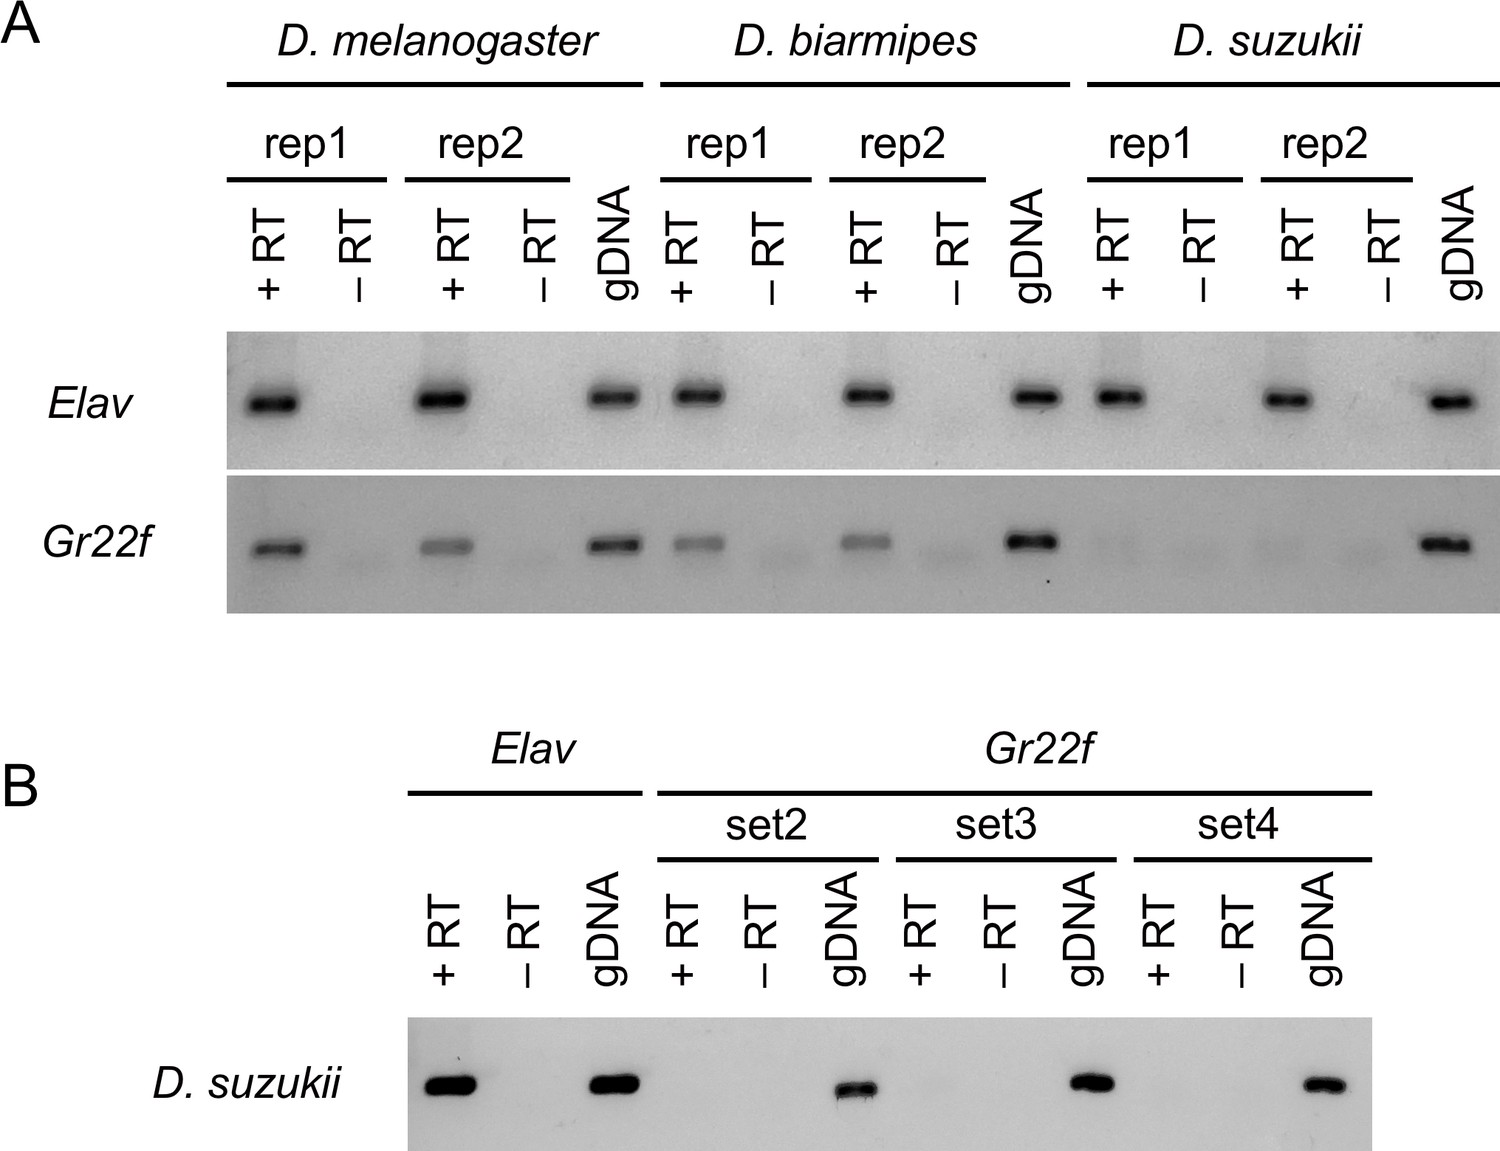
Gr22f is detected in Drosophila melanogaster and Drosophila biarmipes but not in Drosophila suzukii labella.
(A) RT-PCR (reverse transcription-polymerase chain reaction) analysis of Gr22f from labellar preparations of all three species. The same amount of RNA was used for RT-PCR amplification of elav (control) and Gr22f. 15 ng of genomic DNA (gDNA) was used to test the efficiency of the primer sets. In some reactions, primer dimers were detected (lower weak bands detected in all lanes: +RT, -RT, and gDNA). (B) Three additional Gr22f primer sets were tested and no product could be amplified from 15 ng D. suzukii labellar cDNA.
Tables
Key resources table
| Reagent type (species) or resource | Designation | Source or reference | Identifiers | Additional information |
|---|---|---|---|---|
| Strain (Drosophila melanogaster) | Canton-S | Koh et al., 2014 | NA | DOI:10.1016/j.neuron. 2014.07.012 |
| Strain (Drosophila melanogaster) | Canton-S w1118 | Koh et al., 2014 | NA | DOI:10.1016/j.neuron. 2014.07.012 |
| Strain (Drosophila melanogaster) | Gr33a2 | Dweck and Carlson, 2020 | NA | DOI:10.1016/j.cub.2019.11.005 |
| Strain (Drosophila melanogaster) | Gr33a3 | Dweck and Carlson, 2020 | NA | DOI:10.1016/j.cub.2019.11.005 |
| Strain (Drosophila biarmipes) | Dbia | Drosophila species stock center | 14023–0361.04 | Drosophila species stock center |
| Strain (Drosophila suzukii) | Dsuz | This paper | NA | Connecticut |
| Chemical compound | Aristolochic acid (ARI) | MilliporeSigma | Cat # A5512 | CAS # 313-67-7 |
| Chemical compound | Azadirachtin (AZA) | MilliporeSigma | Cat # A7430 | CAS # 11141-17-6 |
| Chemical compound | Berberine chloride (BER) | MilliporeSigma | Cat # Y0001149 | CAS # Y0001149 |
| Chemical compound | Caffeine (CAF) | MilliporeSigma | Cat # C1778 | CAS # 58-08-2 |
| Chemical compound | Coumarin (COU) | MilliporeSigma | Cat # C4261 | CAS # 91-64-5 |
| Chemical compound | N,N-Diethyl-meta- toluamide (DEET) | MilliporeSigma | Cat # 36542 | CAS # 134-62-3 |
| Chemical compound | Denatonium benzoate (DEN) | MilliporeSigma | Cat # D5765 | CAS # 3734-33-6 |
| Chemical compound | Escin (ESC) | MilliporeSigma | Cat # E1378 | CAS # 6805-41-0 |
| Chemical compound | (±)-Gossypol from cotton seeds (GOS) | MilliporeSigma | Cat # G8761 | CAS # 303-45-7 |
| Chemical compound | (-)-Lobeline hydrochloride (LOB) | MilliporeSigma | Cat # 141879 | CAS # 134-63-4 |
| Chemical compound | Saponin (SAP) | MilliporeSigma | Cat # 47036 | CAS # 8047-15-2 |
| Chemical compound | D-(+)-sucrose octaacetate (SOA) | MilliporeSigma | Cat # W303801 | CAS # 126-14-7 |
| Chemical compound | Sparteine sulfate salt (SPS) | MilliporeSigma | Cat# 234664 | CAS # 6160-12-9 |
| Chemical compound | Strychnine nitrate salt (STR) | MilliporeSigma | Cat # S2880 | CAS # 66-32-0 |
| Chemical compound | Theophylline (TPH) | MilliporeSigma | Cat # T1633 | CAS # 58-55-9 |
| Chemical compound | Tricholine citrate (TCC) | MilliporeSigma | Cat # T0252 | CAS # 546-63-4 |
| Chemical compound | Umbelliferone (UMB) | MilliporeSigma | Cat # H24003 | CAS # 93-35-6 |
Additional files
-
Supplementary file 1
FPKM values for Drosophila melanogaster.
- https://cdn.elifesciences.org/articles/64317/elife-64317-supp1-v1.xlsx
-
Supplementary file 2
TPM values for the three replicates of Drosophila melanogaster, Drosophila suzukii, and Drosophila biarmipes.
- https://cdn.elifesciences.org/articles/64317/elife-64317-supp2-v1.xlsx
-
Supplementary file 3
DESeq2 differential gene expression analysis between Drosophila suzukii and Drosophila melanogaster.
Log2FCs are described in the 3rd column, adjusted p-values in the 6th column, and whether a gene was considered a hit in all four differential expression (DE) analysis pipelines (‘yes’) or not (‘no’).
- https://cdn.elifesciences.org/articles/64317/elife-64317-supp3-v1.xlsx
-
Supplementary file 4
DESeq2 differential gene expression analysis between Drosophila suzukii and Drosophila biarmipes.
Log2FCs are described in the 3rd column, adjusted p-values in the 6th column, and whether a gene was considered a hit in all four differential expression (DE) analysis pipelines (yes) or not (no).
- https://cdn.elifesciences.org/articles/64317/elife-64317-supp4-v1.xlsx
-
Transparent reporting form
- https://cdn.elifesciences.org/articles/64317/elife-64317-transrepform-v1.docx
Download links
A two-part list of links to download the article, or parts of the article, in various formats.
Downloads (link to download the article as PDF)
Open citations (links to open the citations from this article in various online reference manager services)
Cite this article (links to download the citations from this article in formats compatible with various reference manager tools)
Evolutionary shifts in taste coding in the fruit pest Drosophila suzukii
eLife 10:e64317.
https://doi.org/10.7554/eLife.64317


