Single-cell RNA analysis identifies pre-migratory neural crest cells expressing markers of differentiated derivatives
- Department of Craniofacial Biology, University of Colorado, United States
- Department of Cell and Developmental Biology, University of Colorado, United States
Abstract
The neural crest is a migratory population of stem-like cells that contribute to multiple traits including the bones of the skull, peripheral nervous system, and pigment. How neural crest cells differentiate into diverse cell types is a fundamental question in the study of vertebrate biology. Here, we use single-cell RNA sequencing to characterize transcriptional changes associated with neural crest cell development in the zebrafish trunk during the early stages of migration. We show that neural crest cells are transcriptionally diverse and identify pre-migratory populations already expressing genes associated with differentiated derivatives, specifically in the xanthophore lineage. Further, we identify a population of Rohon–Beard neurons in the data. The data presented identify novel genetic markers for multiple trunk neural crest cell populations and Rohon–Beard neurons providing insight into previously uncharacterized genes critical for vertebrate development.
Introduction
A fundamental question in developmental biology concerns how multipotent cell precursors produce diverse cell types (Waddington, 1957). This question is particularly relevant for the study of the vertebrate neural crest, a transient population of stem-like cells that contribute to multiple traits and form numerous cell types. Neural crest cells (NCCs) make the cartilages and bones of the skull, neurons of the peripheral nervous system (PNS), glial cells, and pigment cells among other derivatives (Anderson, 1989; Theveneau and Mayor, 2012). How and when NCCs acquire these diverse fates are long-standing questions in the study of vertebrate development and have direct implications for both our understanding of vertebrate evolution as well as the origins of NCC-derived hereditary diseases such as cleft lip and palate.
NCC development is classically conceived as a stepwise series of bifurcating cell fate decisions (Anderson, 1989; Klymkowsky et al., 2010; Simoes-Costa et al., 2014). NCCs are specified at the neural plate border, a region of ectoderm in the gastrula stage embryo that also produces cranial placodes, and in fishes and frogs, Rohon–Beard sensory neurons. Once specified, NCCs undergo an epithelial-to-mesenchymal transition, migrate throughout the embryo, and differentiate into multiple cell types. When and how NCCs differentiate into these derivative lineages remains unclear. Early studies in chick and frog suggested that migratory NCCs are multipotent, requiring cues from the migratory environment to initiate differentiation (Bronner-Fraser and Fraser, 1988; Bronner-Fraser and Fraser, 1989; Collazo et al., 1993). Other studies in zebrafish and quail suggested that NCCs are often lineage restricted prior to migration, and thus interactions among NCCs in the neural tube must somehow specify cells to different lineages before cells become migratory (Henion and Weston, 1997; Raible and Eisen, 1994; Raible and Eisen, 1996; Schilling and Kimmel, 1994).
Current understanding of the transcriptional changes associated with different stages of NCC development has largely been built from analysis of gene expression in whole tissues (Simoes-Costa et al., 2014). However, developing tissues are often transcriptionally heterogeneous, a fact highlighted by recent developments in single-cell RNA sequencing (scRNA-seq) (Briggs et al., 2018; Farnsworth et al., 2020; Farrell et al., 2018; Morrison et al., 2020; Morrison et al., 2017; Saunders et al., 2019; Soldatov et al., 2019; Wagner et al., 2018; Zalc et al., 2021). Furthermore, as cells within tissues are often at different stages of fate specification, scRNA-seq has the potential to expose transcriptional changes associated with differentiation that would have been missed by bulk sequencing experiments (Farrell et al., 2018; Soldatov et al., 2019). For instance, in chick, scRNA-seq studies of migrating cranial NCCs identified unique transcriptional signatures associated with a morphologically cryptic population of cells at the leading migratory edge (Morrison et al., 2020; Morrison et al., 2017). Thus, an emerging picture is that NCCs are more transcriptionally heterogeneous than once thought, and that a complete understanding of NCC biology must account for this heterogeneity.
Here, we use scRNA-seq to characterize the transcriptional landscape of trunk neural crest cells (tNCCs) during the early stages of migration in zebrafish. We sampled NCCs at a stage in zebrafish development when both migratory and pre-migratory tNCC populations are present in the embryo. In the trunk, NCCs migrate along one of two paths that are temporally and spatially separated. Early migrating tNCCs move between the neural tube and somitic mesoderm along the medial path (Figure 1A). These cells give rise to neurons of the PNS, glia, and pigment cells. Later migrating tNCCs follow the dorsolateral path between the skin ectoderm and somitic mesoderm to produce pigment cells. Thus, our experiment aims to capture transcriptional changes associated with the onset of migration and the splitting of NCCs into a neuronal or pigment lineage. We show that tNCCs are a transcriptionally diverse population of cells, and that some pre-migratory tNCCs are already expressing genes associated with a differentiated xanthophore pigment lineage. In addition, we identify a unique population of Rohon–Beard neurons (RBs) that expresses sox10 and comment on the developmental similarity among RBs and NCCs. Ultimately these data create a foundation for future genetic work studying the roles of previously uncharacterized genes during NCC and RB development.
Figure 1 with 4 supplements see all

Single-cell RNA analysis identifies transcriptionally heterogeneous sox10:eGFP population.
(A) Schematic of zebrafish trunk neural crest cell (tNCC) migration. Medial route migrating tNCCs produce peripheral nervous system and pigment cells, while tNCCs migrating along the dorsal-lateral path produce pigment cells. (B) Schematic of experimental design. NCCs were sampled by dissecting the trunks of 80 sox10:eGFP+ zebrafish at 24 hr post fertilization. GFP+ NCCs were FAC sorted and sequenced using 10X Genomics. Representative image shows sox10:eGFP transgene in a dissected trunk used for cell dissociation. YE: yolk extension. (C) Uniform Manifold Approximation and Projection (UMAP) and clustering of cells reveals multiple transcriptionally unique sox10:eGFP+ cell clusters. Numbers and labels correspond to main text. (D) Expression of select genes in UMAP space shows variable expression across different clusters. (E) RNA velocity connects cells in developmental pseudotime. Direction and length of arrows represent predicted direction of differentiation as calculated by Velocyto (see Materials and methods). Note cells predicted to be differentiating from tNCC progenitor cluster one into xanthoblast cluster 3. (F) Heatmap shows expression of top 10 most differentially expressed genes (log2Fold) for each cluster.
-
Figure 1—source code 1
Annotated text file of R code used to generate analyses presented in Figures 1 and 2.
Data deposited in NCBI GEO GSE112294.
- https://cdn.elifesciences.org/articles/66078/elife-66078-fig1-code1-v1.zip
Results
scRNA-seq identifies transcriptionally unique populations of NCCs
We used 10X Genomics to characterize the transcriptomes of 607 tg(–4.9sox10:eGFP)-positive cells from the dissected trunks of 20–24 hr post fertilization (hpf) zebrafish embryos (25 somite stage; hereafter 24 hpf; Figure 1B). At this developmental stage, the sox10:eGFP transgene labels NCCs as well as the otic organ and lateral line (Carney et al., 2006). tNCCs in the anterior segments of the body are beginning to migrate along the medial path (Figure 1A and B), while most tNCCs that populate the posterior segments of the body and dorsolateral pathway are pre-migratory. Thus our sample represents the early stages of tNCC migration and includes a mixed population of migratory and pre-migratory tNCCs.
Our scRNA-seq analysis identified a transcriptionally heterogeneous population of sox10:eGFP+ cells (Figure 1C–F). Most cells were assigned to the NCC lineage based on expression of genes known to label NCCs at this stage (crestin, sox10, foxd3, and tfap2a; Figure 1C and D). We also identified a cluster of cells (cluster 7, 39 cells, Figure 1C) that belongs to the otic organ or lateral line (epcam, cldn7b, f11r.1, otomp, otog). A small cluster of cells (cluster 6, 28 cells), expressing multiple collagen genes, were assigned to a ‘mesenchymal’ NCC type found in other datasets (Howard et al., 2021; Soldatov et al., 2019), and some cells were assigned as posterior arch cranial NCCs based on the expression of genes known to mark these regions of the embryo (prdm1a, grem2b, dlx2a, and fli1a).
These posterior arch cells were split across two clusters (clusters 4 and 5, 116 and 94 cells, respectively), one of which (cluster 5) are proliferating cells expressing genes involved in cell cycle (e.g., cdk1, mki67, plk1; Figure 1F). Regressing out cell cycle confirms that most cluster 5 cells are mitotic posterior arch cells, though a small number of these mitotic cells are assigned as tNCCs (Figure 1—figure supplement 1). Importantly, we recover the same biologically relevant groupings of cells and marker genes whether regressing out variables such as cell cycle or not indicating that the biological signal of cell type in the data is robust to different analysis parameters (Figure 1—figure supplement 1; Materials and methods). Since our main interest is on NCCs in the trunk, we do not further analyze the otic, mesenchymal, and posterior arch tissues at length below.
Despite sampling zebrafish embryos during the early stages of tNCC migration, we observed multiple transcriptionally unique populations of tNCCs. One cluster of tNCCs (cluster 1, 112 cells) expresses genes that mark NCCs (e.g., crestin, sox10, foxd3, sox9a, tfap2a), and multiple Hox genes (e.g., hoxb8a, hoxa11b, hoxb7a) that place these cells in the posterior section of the zebrafish trunk (Figure 1C, D and F). Cells in cluster 1 express genes associated with tNCC migration (e.g., snai1b, prickle1a, wnt11) and genes with unknown function including a predicted cdc42 effector protein (zgc:150493) and cytokine-associated factor crlf1a. As tNCCs in this cluster lack expression of genes identifying these cells to a differentiated lineage, we hypothesize cluster 1 as multipotent tNCC progenitors.
We found a large number of tNCCs already expressing genes associated with differentiated pigment cells spread across two clusters (Figure 1C, D and F). This was surprising as these cells are presumably pre-migratory based on the sampled stage. Cells in cluster 2 (79 cells) express melanophore/pan-pigment genes including mitfa, gpr143, trpm1b. We hypothesize these cells as pan-pigment-cell progenitors. In contrast to these pigment progenitors, cells in cluster 3 (82 cells) express genes enriched in differentiated xanthophores (red/orange pigment cells) including aox5, pax7a/b, and gch. We hypothesize cluster 3 as xanthoblast cells (e.g., pre-xanthophore), and these data identify novel markers of the early xanthophore lineage including solute carrier paralogs slc2a15a/b and gap junction protein gjp8 (Figure 1—figure supplement 2).
These data suggest that a subset of tNCCs begin expressing gene regulatory networks (GRNs) associated with pigment cell lineages prior to migration. This raises the possibility that the sequencing data reflect transcriptional profiles of cells at different stages of differentiation. To explore this further, we inferred RNA velocity (Velocyto) as a measure of developmental pseudotime (Bergen et al., 2020). This method uses estimates of RNA splicing to infer how cells may be transitioning across different transcriptional states. RNA velocity showed a strong signal of tNCCs differentiating from NCC progenitor cluster 1 into xanthoblast pigment cluster 3 (Figure 1E) consistent with a hypothesis that some tNCCs initiate a pigment differentiation program prior to migration.
Identification of neural-like cells and Rohon–Beard neurons
Two clusters (clusters 8 and 9) are distinguished from other cells by expression of genes enriched in the developing spinal cord and differentiated neurons (e.g., elavl3, elavl4). Cells in cluster 8 (21 cells) express genes associated with the neural plate and neural tube including olig3, olig4, sox3, boc, cdon, and multiple zic family transcription factors (zic1, zic2a, zic2b, zic4, zic5, zic6). Intriguingly some of these genes (e.g., zic2a/b, zic5) are also expressed by a subset of tNCC progenitors (Figure 1—figure supplement 3). Cells assigned to this neural cluster may represent ‘early’ NCCs still enriched in genes associated with the neural plate/neural plate border. Alternatively, these cells may be differentiating glia or other neuronal subtype precursors.
Cells in cluster 9 (36 cells) were transcriptionally distinct from all other cells in the dataset and express genes known to mark RBs including isl1, isl2a/b, scrt2, prdm14, and drgx (Figure 1C, D and F; Figure 1—figure supplement 2). RBs are a non-migratory population of cells in the dorsal neural tube that innervate the skin of embryonic and larval zebrafish. Like NCCs, RBs are also specified at the neural plate border and genes critical for the proper specification of NCCs are also critical for specification of RBs (Artinger et al., 1999; Hernandez-Lagunas et al., 2005; Hernandez-Lagunas et al., 2011). While we cannot fully rule out that RB neurons are represented in our dataset due to the proximity of RBs and NCCs to each other in the neural tube, we find this explanation unlikely. Our FACS sorting gated for doublets, and our bioinformatic pipeline further filtered out putative doublets based (Figure 1—figure supplement 4). With the exception of three mitfa expressing cells, RBs do not express genes associated with other NCC clusters, which would be expected if these cells are due to incomplete dissociation from NCC tissue. Instead, our data recovering a putative RB population in an experiment targeting tNCCs may reflect a common developmental origin between these two cell types.
Cross-dataset integration confirms cell identities and expression of marker genes
To further investigate the transcriptional identities of sox10:eGFP+ cells in our dataset, we integrated our data with an existing scRNA-seq atlas of sox10:eGFP tNCCs from 48 to 50 (hereafter 48 hpf) and 68-70 hpf (hereafter 68 hpf) zebrafish embryos (Howard et al., 2021). These complementary data sampled tNCCs using the same transgene allowing us to directly study tNCC identity across developmental time. For these analyses, we used the Seurat integrate datasets function to combine data from cells isolated from the trunks of 24 hpf, 48 hpf, and 68 hpf zebrafish.
Our analysis of these combined datasets found tNCCs clustering by cell type across developmental time (Figure 2). Cells assigned to the otic organ from 24 hpf embryos cluster with cells independently assigned to the otic organ from 48 and 68 hpf embryos. Similarly, mitotic cells from all three datasets group together, as do mesenchymal cell types. Cells assigned as tNCC progenitors at 24 hpf (cluster 1) group proximate to migratory tNCCs from 48 hpf embryos (e.g., ‘Migratory/enteric neural crest’). Posterior arch cells from 24 hpf embryos are split across these NCC progenitor groups and mesenchymal cell types, perhaps reflecting the early developmental stage sampled. Importantly, NCCs from 24 hpf embryos do not group with differentiated neural derivatives from 48 and 68 hpf embryos, suggesting that tNCCs delay initiating a neural differentiation program until post-migratory developmental stages.
Figure 2 with 2 supplements see all

Integrated analysis of sox10:eGFP+ cells from 24, 48, and 68 hr post fertilization (hpf) zebrafish embryos shows pre-migratory trunk neural crest cells (tNCCs) expressing markers of derivative cell types.
(A) Uniform Manifold Approximation and Projection (UMAP) of integrated datasets showing cells colored by age. (B) UMAP of integrated datasets with cells colored and labeled by annotated category. Annotations of 48 and 68 hpf cells from Howard et al., 2021 are indicated with regular text. Annotations for 24 hpf cells from the current study are boxed and bolded. Points representing cells from 24hpf embryos are larger and outlined in black for visualization. Note that cells group by cell identity across developmental time. (C) Same UMAP as in panel (B) with cells split by age. (D) Representative genes expressed at higher levels in mature xanthophores from 68 hpf embryos than xanthoblasts from 24 hpf embryos. Expression is shown in UMAP space and as violin plots for the 24 hpf xanthoblast and 68 hpf xanthophore cluster cells. p values are from Wilcoxon rank-sum tests. (E) Dotplot of select genes that mark NCCs, pigment progenitors, xanthophores, and Rohon–Beard neurons. Clusters from 24 hpf sox10:eGFP+ cells are bolded. Note that xanthoblasts and xanthophores express the same marker genes. Rohon–Beard neurons express a unique set of genes unlike other neural derivatives from older embryos.
Concordance across tNCCs sampled at different stages is striking for pigment cells (Figure 2). Pigment cell progenitors from 24 hpf embryos group with pigment cell progenitors and melanophores from 48 hpf and 68 hpf embryos (Figure 2B and C). Xanthoblasts sampled from 24 hpf embryos form a bridge connecting this pigment progenitor/melanophore cluster to differentiated xanthophores sampled from 68 hpf embryos. Critically, we find that differentiated xanthophores at 68 hpf and xanthoblasts at 24 hpf express the same set of genes including gjb8, rgs2, pax7a/b, aox5, slc2a15a/b (Figure 2E; Figure 2—figure supplement 1). These data further indicate that 24 hpf xanthoblasts are expressing a differentiated xanthophore GRN.
While 24 hpf pigment cells are expressing markers of differentiated derivatives, some differences between early and late pigment cells exist (Figure 2—figure supplement 1). For instance, pigment cells at all developmental stages express critical transcription factors such as mitfa, but downstream targets such as dct and tyrp1a/b that effect melanin biosynthesis are only expressed in cells isolated from 48 hpf and 68 hpf embryos (Figure 2—figure supplement 1). To investigate gene expression changes associated with xanthophore maturation, we looked for differentially expressed genes between 24 hpf xanthoblasts and 68 hpf xanthophores. This test identified genes upregulated in xanthophores at 68 hpf including aqp3a, slc22a7a, cilia-associated protein ccdc39, and prdx1/2/5/6 genes associated with redox state (Figure 2D; Figure 2—figure supplement 1). Xanthoblasts in contrast express genes associated with EMT and melanophore cell types at higher levels including tfap2e and zeb2a (Figure 2—figure supplement 1). Thus, these data suggest that there is biological maturation that occurs during this time frame of xanthophore development. Xanthoblasts at 24 hpf retain a pan-pigment transcriptional state while also expressing a mostly complete differentiated xanthophore GRN.
In these analyses, RBs cluster with neuronal cell types (e.g., enteric neurons and spinal cord neurons) sampled from 48 and 68 hpf embryos (Figure 2B). This reflects similar transcriptomes across different neurons. While these other neuronal cells co-express some shared genes with RBs (e.g., elavl3, elavl4, vim), RBs express a unique set of genes (Figure 2E). For instance, RBs and enteric neuron cells from 68 hpf embryos both express fgf13a/b ligands at appreciable levels. RBs, however, also express cxcr4b and islet genes that are lacking in enteric neurons. Sensory neuronal progenitor cells (potential dorsal root ganglia) sampled at 48 hpf express islet genes, but these same cells lack expression of other RB genes such as pou4f4 and express cxcr4b and fgf13a/b at very low levels (Figure 2E).
To further investigate cell types in our dataset, and RB cell identity, we next integrated our data with a scRNA-seq atlas of whole zebrafish embryos sampled at 14 hpf, 18 hpf, and 24 hpf (Wagner et al., 2018). Both NCCs and RBs are annotated in these whole embryo datasets. As expected, NCCs from our sox10:eGFP dataset grouped with annotated NCCs sampled from whole embryos at these other stages. We again find that cells assigned to the xanthoblast cluster group with annotated ‘xanthophores’ from these other data. RBs isolated from sox10:eGFP cells cluster with cells annotated as RBs in these other datasets (Figure 2—figure supplement 2). Furthermore, we recover a putative RB GRN across datasets and time points. RBs in all four datasets predict restricted expression of a unique RB set of genes that includes cxcr4b, fgf13a/b, isl1/2a/2b, prdm14, and pou4f4.
In situ hybridization confirms novel genetic markers in xanthoblast and RB lineages
Single-cell transcriptomes identify previously uncharacterized genes that are uniquely expressed in pre-migratory xanthoblast and RB cell populations at 24 hpf. We sought to confirm expression of some novel genes predicted to these cell populations using fluorescent quantitative hybridization chain reaction (qHCR) in situ hybridization (Choi et al., 2018).
slc2a15b and gjb8 are co-expressed in pre-migratory xanthoblast tNCCs
In addition to known markers of the xanthophore lineage, scRNA-seq identified slc2a15b and gjb8 as among the most highly expressed and restricted to the xanthoblast lineage cluster (Figure 1D and F). The solute carrier slc2a15b is known to affect leucophore (white pigment cells) development in medaka (Fukamachi et al., 2006; Kimura et al., 2014; Lynn Lamoreux et al., 2005), and is expressed in the xantholeuocophore cells of adult zebrafish (Lewis et al., 2019). Leucophores and xanthophores are thought to be developmentally related (Kimura et al., 2014; Lewis et al., 2019), suggesting that slc2a15b is a good candidate for future study. The connexin protein, gjb8 (previously cx30.3), is known to be expressed in the skin, otic, and neural tube of zebrafish (Chang-Chien et al., 2014; Tao et al., 2010). To our knowledge, no functional role for gjb8 in NCC development has been proposed, but the importance of other gap junction proteins in pigment pattern development in zebrafish (Irion et al., 2014) makes this gene a good candidate for future study.
To confirm expression of these novel xanthoblast genes to NCCs, we used aox5 expression to label putative xanthoblasts, and the tg(sox10:TagRFP) zebrafish line to mark NCCs. At 24 hpf, we found that both slc2a15b and gjb8 were co-expressed with aox5 in a subset of tNCCs (Figure 3A–G; Pearson’s r = 0.91 and 0.95, respectively). We also observed gjb8 expression in the skin as previously reported (Tao et al., 2010), and both gjb8 and slc2a15b expression in medial tissue ventral to the neural tube. Within the NC, many of these aox5/slc2a15b/gjb8 expressing cells were in the dorsal neural tube. We first observe expression of these genes in the NC at the 15–20 somite stage, suggesting that these genes are expressed by NCCs as they become migratory (Figure 3—figure supplement 1). Furthermore, we observed higher expression of aox5/slc2a15b/gjb8 in anterior NCCs of 20 somite stage embryos, suggesting that these genes are expressed in an anterior-posterior wave associated with the onset of NCC migration (Figure 3—figure supplement 1). Thus aox5, slc2a15b, and gjb8 are co-expressed in pre-migratory and early-migrating tNCCs supporting a hypothesis that tNCCs initiate a xanthoblast GRN prior to migrating from the neural tube.
Figure 3 with 2 supplements see all
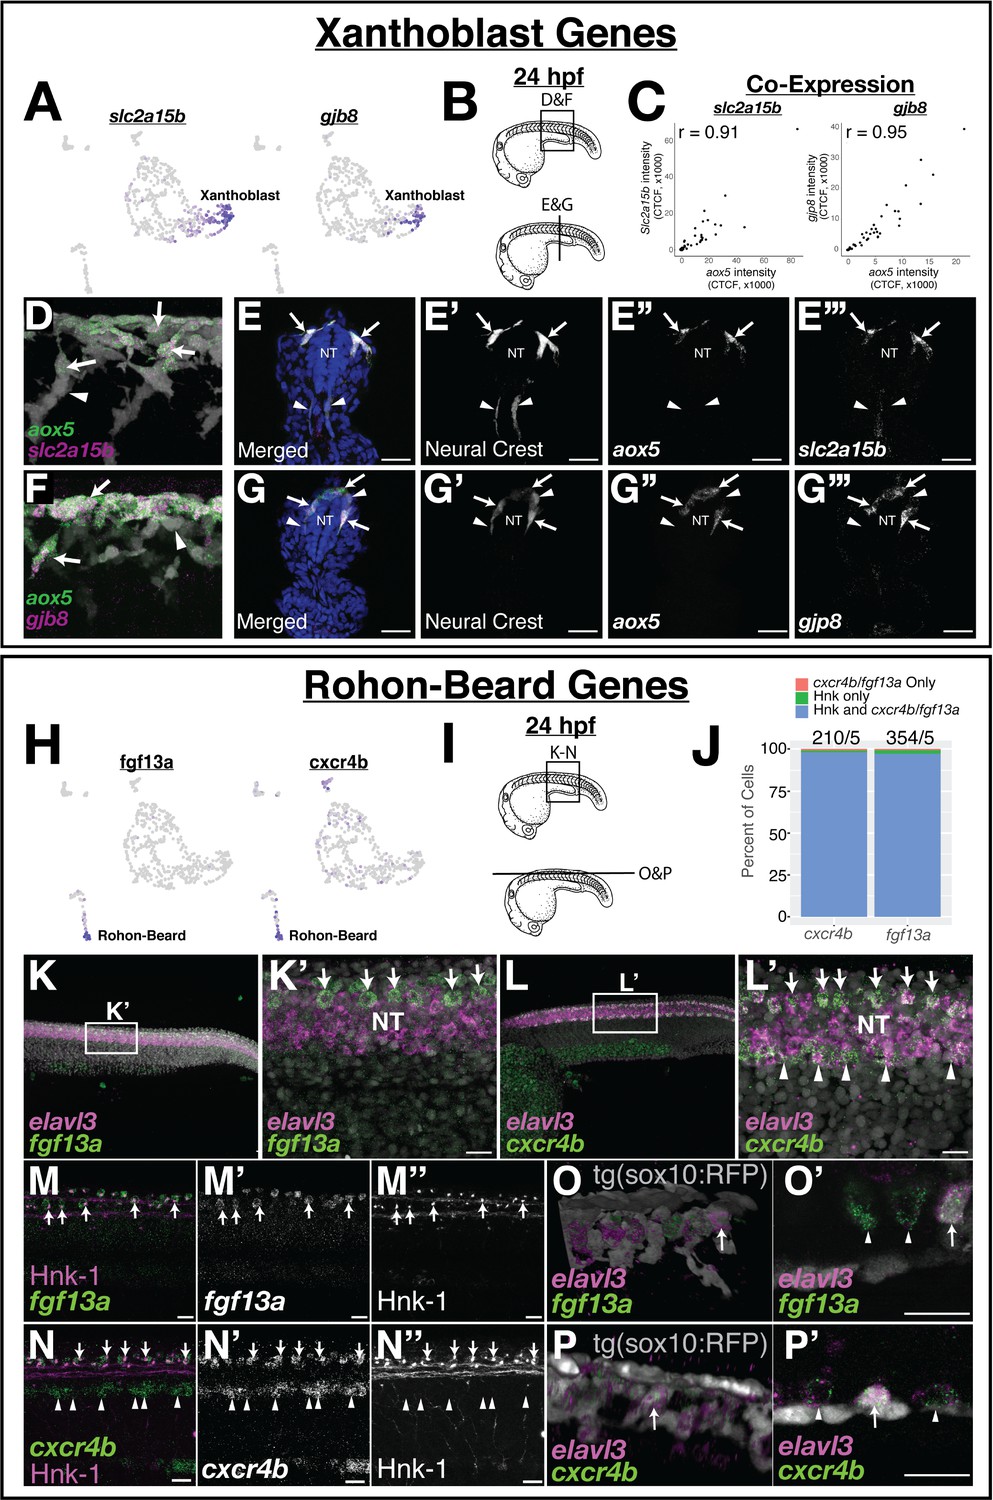
Expression of novel marker gene expression in the pre-migratory xanthoblast and Rohon–Beard cell populations.
(A) Both slc2a15b and gjb8 are predicted to be expressed in pre-migratory xanthoblast cells. (B–G) Quantitative single-molecule in situ hybridization (hybridization chain reaction [HCR]) confirms expression of these genes to aox5 expressing xanthoblasts. (B) Schematic of 24 hr post fertilization (hpf) embryos labeling region of embryos shown in subsequent panels. (C) Quantification of RNA expression (corrected total cell fluorescence [CTCF]) in neural crest cells (NCCs) from sections shows novel marker genes slc2a15b and gjb8 are strongly co-expressed with aox5. Sections were taken every 15 µM and analyses were limited to sections over the yolk extension. Each dot represents a cell (slc2a15b = 3 embryos, 9 slides, 49 cells; gjb8 = 3 embryos, 9 slides, 58 cells). (D–G) Representative whole mount (D, F) and sections (E, G) show expression of slc2a15b (D, E) and gjb8 (F, G) in 24 hpf embryos. DAPI (blue, E, G) labels nuclei. Arrows point to NCCs co-expressing xanthoblast marker genes, while arrowheads point to NCCs that lack expression of these same genes. Note that a number of aox5/slc2a15b/gjb8 NCCs are pre-migratory in the dorsal neural tube (NT). (H) Both fgf13a and cxcr4b are predicted to be expressed in Rohon–Beard neurons (RBs). (I–P) HCR confirms expression of these genes to RBs. (I) Schematic labeling region of trunk shown in subsequent panels. (J) Percent of HNK-1-positive RBs also expressing cxcr4b and fgf13a indicates that these genes are co-expressed in RB cells. The number of HNK-1, cxcr4b, and fgf13a-positive cells in the dorsal NT was counted. Note almost all fgf13a/cxcr4b expressing cells co-localize to HNK-1-positive RB cells. Sample size reported above bars (#cells/#embryos). (K, L) Representative confocal images of whole-mount in situ hybridization for elavl3, fgf13a, and cxcr4b show expression of fgf13a and cxcr4b as two rows of cells in the dorsal NT (arrows). Elavl3 marks the NT, and DAPI (gray) labels nuclei. Note ventral NT expression of cxcr4b (arrowheads in L’). (M, N) Dual immunolabeling for HNK-1 and in situ hybridization for fgf13a (M) or cxcr4b (N) shows gene expression overlaps with HNK-1 labeling in RBs in the dorsal NT (arrows). Arrowheads mark ventral expression of cxcr4b in panel (N). (O, P) While fgf13a and cxcr4b expression was never observed in NCCs, a subset of putative RB cells express the tg(sox10:tagRFP) transgene (gray in panels O and P). Shown are whole-mount 3D projections (O, P) and single slice through z-stack (O’, P’) showing fgf13a/cxcr4b/elavl3-positive cells co-labeled with the sox10 transgene. Note that sox10-positive cells are positioned topologically similar to sox10-negative RB cells. Scale bars for all panels are 20 µM.
-
Figure 3—source data 1
_Excel file of quantified hybridization chain reaction intensity of aox5/slc2a15b/gjb8 cells used to generate plots shown in Figure 3C.
- https://cdn.elifesciences.org/articles/66078/elife-66078-fig3-data1-v1.xlsx
-
Figure 3—source data 2
_Excel file of quantified HNK-1/cxcr4b/fgf13a co-localization used to generate plot in Figure 3J.
- https://cdn.elifesciences.org/articles/66078/elife-66078-fig3-data2-v1.xlsx
Rohon–Beard neurons express fgf13a/b and cxcr4b
Our data identify a number of genes not previously known to be expressed by RBs, including non-canonical fgf13a/b ligands, the chemokine receptor cxcr4b, and the transcription factor pou4f4 (Figure 1—figure supplement 1). Our analyses also found these genes co-expressed in predicted RB cell clusters in independent zebrafish scRNA-seq datasets further supporting these genes as putatively novel RB markers (Figure 1—figure supplement 2). While many novel RB genes appear intriguing, two stand out in particular. Cxcr4b is a chemokine receptor import for cell-cell signaling. Fgf13a/b were among the most differentially expressed RB genes and are non-canonical Fgf ligands that play roles in neuron function and migration, possibly through binding microtubules or voltage-gated sodium channels (Ornitz and Itoh, 2015; Pablo et al., 2016). Thus both genes are candidates for future functional studies.
To confirm the expression of predicted novel RB marker genes, we investigated the expression of fgf13a and cxcr4b using HCR in situ hybridization. We found that fgf13a and cxcr4b were expressed in two rows of cells running along the lateral edges of the dorsal neural tube (elavl3 expression) coincident with the known location of RB neurons (Figure 3F–N). We additionally observed strong cxcr4b expression in the ventral neural tube (arrowheads in Figure 3L) and diffuse expression of fgf13a in the body. We never observed appreciable levels of fgf13a/cxcr4b expression in migrating NCCs. To confirm the identity of these fgf13a/cxcr4b expressing cells, we labeled RBs with HNK-1 immunofluorescence (Olesnicky et al., 2010). In all embryos, dorsal trunk expression of both fgf13a and cxcr4b co-localized to HNK-1 labeled cells (Figure 3J, M and N), confirming these fgf13a/cxcr4b expressing cells as RBs. We observed expression of these genes in earlier segmentation stage embryos, suggesting that both fgf13a and cxcr4b are expressed by RBs as these cells differentiate (Figure 3—figure supplement 1). The function of fgf13 ligands or the cxcr4b receptor in RBs is unknown and a focus of future research.
These data raise an intriguing question: why are RBs present in a dataset that used FAC sorting to enrich for NCCs? The answer may be that during our experimentation we occasionally observed RBs labeled with the tg(sox10:TagRFP) transgene (Figure 3O–P). In this zebrafish line, these RFP+ RBs were in the same topological position in the neural tube with other RBs, indicating to us that these cells are unlikely to be NCCs. We thus hypothesize that RBs may be represented in our dataset because a small percentage of these cells express the sox10 transgene similar to NCCs. This hypothesis is supported by low-level expression of both sox10 and eGFP by RBs in the scRNA-seq data (Figure 3—figure supplement 2). Further, we note that RBs in an independent scRNA-seq dataset (Wagner et al., 2018) also express some NCC genes including crestin at low levels (Figure 2—figure supplement 2). These data are intriguing as RBs and NCCs share a developmental origin in the neural plate border (Artinger et al., 1999; Cornell and Eisen, 2000; Fritzsch and Northcutt, 1993; Hernandez-Lagunas et al., 2005), and thus our data are consistent with a literature of developmental similarity between these two cell types.
Expression of novel xanthophore and RB neuron markers is lost in Prdm1a mutants
Both NCCs and RBs are specified in the neural plate border during gastrulation. Fate determination for both cell types requires expression of the transcription factor prdm1a (Figure 4A). Loss of prdm1a function leads to loss of both RB and NCC identity (Hernandez-Lagunas et al., 2005; Hernandez-Lagunas et al., 2011; Olesnicky et al., 2010; Powell et al., 2013). To confirm expression of slc2a15b/gjp8 in NCC-derived xanthoblasts and fgf13a/cxcr4b in RBs, and to place these genes within known NCC and RB GRNs, we examined the expression of these genes in the NRD/prdm1a mutant zebrafish line. Prior studies have shown that mutant prdm1a-/- fail to specify NCCs and RBs at 24 hpf and have a reduction of melanocytes at 48 hpf (Artinger et al., 1999; Hernandez-Lagunas et al., 2005; Olesnicky et al., 2010). We thus reasoned that if expression of these genes is restricted to NCCs and RBs respectively then we should see loss of expression of these genes in prdm1a-/- mutants and this is exactly what we found. Dorsal neural tube expression of slc2a15b, gjp8, fgf13a, and cxcr4b were all lost in prdm1a-/- embryos (Figure 4B–I). Expression of these genes in areas of the embryo other than NCCs and RBs was not affected (e.g., cxcr4b expression in ventral neural tube shown in Figure 4H,I). These data suggest that loss of expression was due to loss of NCC and RB cell specification, confirming expression of these genes to NCCs and RBs and placing these genes downstream of the neural plate border specifier Prdm1a.
Figure 4

Expression of novel xanthoblast and Rohon–Beard neuron (RB) marker genes is lost in the Prdm1a mutant.
(A) Schematic of neural crest cell (NCC) and RB specification. Both NCCs and RBs are specified in the neural plate border (NPB) of gastrulating embryos. NCC and RB specification share a similar gene regulatory network (GRN) that includes notch/delta and prdm1a expression in the NPB. RBs may transiently express sox10 at low levels (gray). (B–H) Whole-mount confocal images of hybridization chain reaction (HCR) shows expression of xanthoblast (aox5, slc2a15b, gjp8) and RB marker genes (fgf13a, cxcr4b) in wild type (B, D, F, H) and Prdm1a-/- (C, E, G, I) embryos at 24 hr post fertilization (hpf). Hnk-1 staining marks RB cells in all images (note loss of HNK-1 in Prdm1a-/- embryos). Expression of all marker genes is lost from the dorsal neural tube (NT) in Prdm1a-/- embryos that show NCC and RB specification defects. Arrows point to expression of marker genes in dorsal neural tube NCCs (B, D) and RBs (F, H). Expression of genes in regions of the embryo other than the NC and RB is still present. For example, expression of cxcr4b in the ventral neural tube is not altered in the Prdm1a mutant (arrowheads). All images are 3D projections of lateral views of the neural tube taken over the yolk extension of 24 hpf embryos.
Discussion and conclusion
We found that tNCCs are a transcriptionally heterogeneous population during the early stages of migration and identify a number of previously uncharacterized genes for further study. Our data identify both presumptive multipotent tNCC progenitor cells and a subset of tNCCs already expressing genes associated with differentiated pigment cells prior to migration and at relatively early developmental stages (see also Ling and Sauka-Spengler, 2019; Soldatov et al., 2019). Cells specified towards the xanthophore lineage, in particular, may be one of the earliest tNCC derivatives to begin differentiating.
While we find NCCs expressing markers of differentiated pigment cells, we did not find tNCCs beginning to express genes associated with the PNS. This observation was supported in analyses that compare tNCCs from 24, 48, and 68 hpf embryos (Figure 2). Cells expressing genes associated with PNS are only observed at 48 and 68 hpf when these post-migratory NCCs are already differentiating/differentiated. Thus, while genes associated with pigment cell derivatives are expressed at pre-/early migratory stages, NCCs delay expression of genes associated with PNS cell types until post-migratory stages.
Identification of pre-migratory pigment NCCs is consistent with results from some cell labeling experiments in zebrafish, suggesting that NCCs are lineage restricted prior to migration (Raible and Eisen, 1994; Raible and Eisen, 1996; Schilling and Kimmel, 1994). In these experiments, pre-migratory NCCs labeled in the neural tube only make a single NCC derivative. While these classic cell labeling experiments could not identify whether pre-migratory NCCs were beginning to differentiate, our data extend these studies by showing that some pre-migratory NCCs are already expressing a pigment cell GRN. Whether presumptive pigment cells identified in our scRNA-seq data are truly fate restricted, however, is unknown and would require additional experimental manipulation.
Some scRNA-seq studies have observed multipotent cells transiently expressing genes associated with two or more differentiated fates (Farrell et al., 2018; Soldatov et al., 2019). These data challenge a classical bifurcating model of cell specification, suggesting that instead multipotent cells begin initiating GRNs characteristic of multiple fates before becoming committed to one lineage over others. We do not observe populations of cells expressing multiple fate derivatives in our data, though we do note that xanthoblasts have a more pan-NCC gene expression signature than differentiated xanthophores from 68 hpf embryos. However, we also note that our relatively small sample size for scRNA-seq datasets (607 cells) and lack of multiple sampled developmental stages may prohibit identifying multi-fate expressing cells. Future work sampling earlier stages is likely to provide further insight into how NCC early specification occurs in zebrafish and complement other studies in both mouse and chick (Ling and Sauka-Spengler, 2019; Soldatov et al., 2019; Zalc et al., 2021).
Other studies have used scRNA-seq to identify transcriptionally cryptic populations of cells associated with the leading edge of the cranial NCC migratory front in chick (Morrison et al., 2020; Morrison et al., 2017). In zebrafish, cell tracking studies in the trunk similarly suggest that a subset of migrating tNCCs act as leader cells forging a path along which follower NCCs migrate (Richardson et al., 2016). While we identify multiple transcriptionally unique populations of NCCs in our data, we do not identify a cluster of cells associated with this ‘leader’ cell type. Neither do we find any cluster in our data characterized by expression of orthologous genes that identify trailblazer NCCs in chick (Morrison et al., 2020; Morrison et al., 2017). Thus the identification of zebrafish trunk leader cell transcriptome remains open.
Though our experimental design targeted NCCs, we also sequenced a population of RB neurons and show that in zebrafish some RBs express sox10 and sox10 transgenes. While these data do not directly test for a shared progenitor, it is intriguing to consider these data in the context of other studies showing that NCCs and RBs share a similar developmental origin at the neural plate border (Artinger et al., 1999; Hernandez-Lagunas et al., 2005; Olesnicky et al., 2010). Cells at the neural plate border are thought to be an equivalence group, able to differentiate into both NCCs and RBs (Cornell and Eisen, 2002). Interactions among neural plate border cells, mediated in part by notch signaling, bias cells towards one fate over the other (Appel and Eisen, 1998; Cornell and Eisen, 2000; Cornell and Eisen, 2002). Our data suggesting that RBs express both sox10 and sox10 transgenes seems to be in line with this idea of a shared developmental potential.
To what extent NCCs and RBs share a common progenitor and whether the evolution of these two tissues is temporally coincident at the root of the vertebrate phylogeny are questions that have long captured the imagination of scholars of vertebrate biology (Artinger et al., 1999; Bone, 1960; Cornell and Eisen, 2000; Fritzsch and Northcutt, 1993). The neural crest is a novel migratory cell population unique to vertebrates with no known homology to tissues in non-vertebrate chordates (Gans and Northcutt, 1983), though see Jeffery et al., 2008; Jeffery et al., 2004. RBs are a non-migratory neuron with uncertain homology to morphologically similar motor neurons in non-vertebrate chordates (Baker and Bronner-Fraser, 1997; Bone, 1960; Gans and Northcutt, 1983). Here, we identify a zebrafish RB transcriptome providing unique insight into the RB GRN. Future work identifying whether orthologous genes are expressed by motor neurons in non-vertebrate chordates could provide further insight into whether these morphologically similar neurons are homologous or homoplastic to vertebrate RB neurons (McCune and Schimenti, 2012; Wagner, 2007). Whether emerging technologies like scRNA-seq will help illuminate the evolutionary origins of new tissue types such as RBs and NCCs only time will tell.
Ultimately, our data suggest that pre-migratory tNCCs are transcriptionally heterogenous and that some pre-migratory NCCs express differentiated pigment cell GRNs. Importantly, this finding is concordant with results from other recent studies in mouse and chick that similarly find NCCs expressing differentiation programs at pre-/early-migratory stages (Ling and Sauka-Spengler, 2019; Soldatov et al., 2019; Zalc et al., 2021). Taken together, these single-cell genomic studies are challenging some classic models of NCC development that emphasize the role of environmental signals from the migratory environment in biasing NCCs towards one derivative state over another (Bronner-Fraser and Fraser, 1988; Bronner-Fraser and Fraser, 1989; Collazo et al., 1993; Trainor and Krumlauf, 2000). In contrast, this emerging work emphasizes interactions among NCC progenitors in the neural tube as critical for specifying at least some NCCs towards different fates prior to migration (Raible and Eisen, 1996).
What mechanisms may be driving these data are speculative and an area of active interest in the field. Notch signaling plays a role in early NCC specification at the neural plate border (Cornell and Eisen, 2000; Cornell and Eisen, 2002), but whether notch signaling continues to play a role in specifying pre-migratory NCCs to different fates at later time points is unknown. Furthermore, there is a temporal component to NCC development. In most taxa, PNS NCCs migrate first and there is a delay before pigment NCC migration occurs. Thus, differences in signals that pre-migratory NCCs receive in the neural tube over time may play a role in biasing cells towards different fates. Ultimately, our and others’ data suggest that unknown interactions in the neural tube are critical for understanding NCC development, and that this pre-migratory period represents an area that deserves continued research attention.
Materials and methods
Key resources table
| Reagent type (species) or resource | Designation | Source or reference | Identifiers | Additional information |
|---|---|---|---|---|
| Gene (Danio rerio) | Prdm1a | GenBank | ZFIN:ZDB-GENE-030131-2193, Gene ID: 323473 | |
| Strain, strain background (D. rerio) | AB | ZIRC | ZDB-GENO-960809-7, RRID:ZIRC_ZL1 | |
| Genetic reagent (D. rerio) | tg(–4.9sox10:eGFP)ba2 | Carney et al., 2006 | RRID:ZFIN_ZDB-ALT-050913-4 | |
| Genetic reagent (D. rerio) | Tg(sox10:TagRFP)co26 | Blasky et al., 2014 | RRID:ZFIN_ZDB-GENO-150316-2 | |
| Genetic reagent (D. rerio) | Prdm1am805 | Artinger et al., 1999 | RRID:ZFIN_ZDB-ALT-980621-8 | |
| Antibody | Anti HNK-1/N-CAM(mouse, monoclonal) | Sigma-Aldrich | Cat#: C0678, RRID:AB_1078473 | IF:(1:20) |
| Sequence-based reagent | Aox5 RNA Probe | Molecular Instruments | Custom | WM ISH(2 µL/500 µL) |
| Sequence-based reagent | Slc2a15b RNA Probe | Molecular Instruments | Custom | WM ISH(2 µL/500 µL) |
| Sequence-based reagent | Gjb8 RNA Probe | Molecular Instruments | Custom | WM ISH(2 µL/500 µL) |
| Sequence-based reagent | Elavl3 RNA Probe | Molecular Instruments | Custom | WM ISH(2 µL/500 µL) |
| Sequence-based reagent | Fgf13a RNA Probe | Molecular Instruments | Custom | WM ISH(2 µL/500 µL) |
| Sequence-based reagent | Cxcr4b RNA Probe | Molecular Instruments | Custom | WM ISH(2 µL/500 µL) |
| Chemical compound, drug | Accumax | Innovative Cell Technologies | Cat# AM105-500 | |
| Software, algorithm | Velocyto.R (v0.6) | Bergen et al., 2020 | RRID:SCR_018167 | R implementation |
| Software, algorithm | Velocyto.py (v0.17.17) | Bergen et al., 2020 | RRID:SCR_018167 | Python implementation |
| Software, algorithm | Seurat (v4.0.1) | Butler et al., 2018 | RRID:SCR_007322 | R implementation |
| Software, algorithm | Code for analyses | Current study | Source data file: Figure 1&2_RCode.txt | |
| Software, algorithm | R (v4.0.3) | CRAN | RRID:SCR_003005 | |
| Software, algorithm | RStudio | http://www.rstudio.com/ | RRID:SCR_000432 | |
| Software, algorithm | CellRanger (v3.2 & v5.0.1) | 10X Genomics | RRID:SCR_017344 | |
| Software, algorithm | Fiji | http://fiji.sc | RRID:SCR_002285 | |
| Software, algorithm | Napari | https://napari.org/ |
Zebrafish lines and husbandry
Request a detailed protocolAll zebrafish lines were maintained at the University of Colorado Denver | Anschutz medical school under common zebrafish husbandry conditions. Lines have been previously described and include the tg(sox10:eGFP)ba2 (Carney et al., 2006), tg(sox10:TagRFP)co26TG (Blasky et al., 2014), and NRDm805/prdm1a mutant line (Hernandez-Lagunas et al., 2005).
Single-cell RNA sequencing
Request a detailed protocolFertilized zebrafish eggs were collected in the morning, stage matched, and reared at 30°C overnight until embryos were at approximately the 25 segment stage corresponding to embryos of ~20–24 hpf at 28.5°C. GFP-positive embryos were dissected posterior to the otic organ using forceps in cold 1x PBS. Trunks from 80 dissected embryos were pooled for dissociation and FAC sorting.
Dissected trunks were dissociated in Accumax (Innovative Cell Technologies) plus DNaseI (1 µL/100 µL). Cells were triturated every 15 min using decreasing-sized pipette tips until a homogenous solution was observed. Cells were filtered through a 40 µM mesh, spun, and resuspended in Sorting buffer (1% FBS/1 mM EDTA/25 mM HEPES in 1× Dullbecco’s PBS; Sigma D8537;). GFP-positive cells were FAC sorted on a MoFlow XDP100 cell sorter into sorting buffer and diluted to approximately 700–1100 cells/µL.
Cells were captured and prepared for sequencing using the 10X Genomics platform by the University of Colorado Denver | Anschutz Genomics Core by loading approximately 10,000 cells. Libraries were sequenced on two lanes of an Illumina NovaSEQ 6000 to an average depth of 159,520 reads per cell and a median of 666 genes per cell. After filtering and quality control, we obtained cells expressing a median of 4255 UMI and 32,425 genes.
Single-cell analysis
Request a detailed protocolReads were mapped to the Ensembl build of the zebrafish genome (GRCz11) and UMI barcodes were assigned to unique identifiers using CellRanger (v3.2). Primary analyses were conducted using the Seurat package v4.0.1 as implemented in R v4.0.3 (Butler et al., 2018). Cells were filtered for quality based on mitochondrial gene expression (≤6% and ≥0.5%) and number of unique transcripts expressed (≥5000 and ≤16,000) in order to remove low-quality cells as well as any possible doublets. Data was normalized using the sctransform function in Seurat (variable features = 3000). Cells were clustered (resolution = 0.6) and projected with the Uniform Manifold Approximation and Projection (UMAP) method using the first 15 principal component analysis (PCA) axes as implemented in Seurat. To find marker genes associated with cell clusters, we performed differential expression using the Wilcoxon rank-sum test as implemented by the FindAllMarkers command in Seurat (logfc.threshold = 0.5, min.pct = 0.25). Changing cell filtering, clustering, and UMAP projection parameters had minor affects and does not change major results of the study (Figure 1—figure supplement 1).
To further explore mitotic cells in cluster 5, we reanalyzed our data regressing out variation due to cell cycle, mitochondrial expression, and ribosomal expression either in combination (Figure 1—figure supplement 1) or individually (not shown). For these analyses, we first calculated an estimate of cell cycle for each cell with the CellCycleScoring function in Seurat using zebrafish orthologs of cell cycle genes available from the Seurat website. We then regressed out the effects of these variables using the SCTransform function prior to clustering and analysis. The primary difference across different analyses is that most mitotic cells in cluster 5 (Figure 1) group with other posterior arch cells from cluster 4 when cell cycle is removed (Figure 1—figure supplement 1). A smaller number of mitotic cells cluster with tNCC progenitors from cluster 1. Importantly, in all analyses we recover similar clusters of cells and marker genes, indicating that the major conclusions from these data are robust to differences in analysis (Figure 1—figure supplement 1).
We used the package Velocyto to infer developmental pseudotime from our data (Bergen et al., 2020). This method uses estimates of RNA splicing from scRNA-seq data to infer how cells may be transitioning across different transcriptional states; the analysis assumes that the ratio of spliced to unspliced transcripts should provide an estimate of the time since a cell has started expressing a new set of genes associated with a different transcriptional state. We used the Python implementation of Velocyto to infer RNA splicing with default parameters, and the R implementation of Velocyto to infer RNA velocity (e.g., pseudo-time) with default parameters and plot velocities onto UMAP space.
To quantify GFP expression in RB cells, reads were aligned to the Aequorea victoria green fluorescence protein sequence (EBI accession #AAA27722.1) using cell ranger (v5.0.1). The same analysis parameters as above were used to generate plots.
Dataset integration
Request a detailed protocolWe integrated our scRNA-seq data with complementary scRNA-seq atlases from Howard et al., 2021 and Wagner et al., 2018. For Howard et al., 2021, we remapped sequences downloaded from SRA (BioProject PRJNA640816) to the Ensembl build of the zebrafish genome (GRCz11) using CellRanger v5.0.1. Cell annotations were downloaded from UCSC Cell browser (cells.ucsc.edu). Cells were filtered to only include those used in the original Howard et al., 2021 study. For Wagner et al., 2018, data and annotations were downloaded directly from NCBI GEO (GSE112294). We only analyze data obtained from 14, 18, and 24 hpf embryos from Wagner et al., 2018.
Datasets were integrated using Seurat IntegrateData function on anchors identified from 2000 genes using log normalized data. We present data integrated with Howard et al., 2021 using the first 30 PCAs for analyses. We present data integrated with Wagner et al., 2018 using the first 100 PCAs for analyses. We get similar results with different parameters when integrating and analyzing the data (not shown). For all analyses, we annotate cells with the original annotations given in Howard et al., 2021 and Wagner et al., 2018, respectively. Differential expression was performed using the Wilcoxon rank-sum test in Seurat on log normalized data.
Code for all analyses is available as source data file: Figure 1—source code 1.
In situ hybridizations and immunofluorescence
Request a detailed protocolTo confirm expression of genes, we used fluorescent qHCR in situ hybridization (Choi et al., 2018). Custom RNA probes were purchased from Molecular Instruments. Probes were designed using either the B2 or B3 hairpin loop sequences with adaptor fluorophores of either Alexa Fluor 488 (B3) or Alexa Fluor 647 (B2). In situ hybridizations were conducted following Molecular Instruments protocol for whole-mount zebrafish. Samples from 25 somite (24 hpf), 8 somite, 15 somite, and 20 somite embryos were fixed in 4% paraformaldehyde and stored in methanol at –20°C. Samples were rehydrated in phosphate buffered solution (PBS) and permeabilized for 5 min in 1 µg/mL proteinase K at room temperature. Hybridization was conducted using RNA probes diluted to 4 picamols/mL at 37°C overnight. Amplification was performed diluting hairpins to 60 picamols/mL at room temperature overnight.
Following in situ hybridization, Rohon–Beard cells were identified by HNK-1 immunofluorescence. Samples were blocked in IF blocking buffer (2% normal goat serum, 2% BSA, 1× PBS) at room temperature for a minimum of 1 hr. Primary mouse anti-HNK-1 antibody (Sigma) was diluted 1:20 in blocking buffer, and samples were incubated in this primary antibody at 4°C for 24–48 hr (Hernandez-Lagunas et al., 2011), and visualized using secondary goat anti-mouse IgM conjugated to Alexa Fluor 594.
Samples were imaged on a Leica SP8 confocal microscope. For whole-mount images, samples were mounted in 0.2% agarose and imaged at either 10× or 40× magnification. For co-expression of xanthophore genes, samples were cryosectioned every 15 µM and imaged at 63× magnification. For both whole-mount and sectioned samples, we imaged over the yolk extension in order to make images comparable.
Unless noted, all images are 3D projections from either whole-mount or sectioned material produced using either ImageJ or Napari. Image quantification was performed using ImageJ. To calculate co-expression of aox5 with slc2a15b and gjb8, we calculated corrected total cell fluorescence (CTCF) from 15 µM sections. Briefly, RNA expression by a cell is proportional to relative fluorescence intensity of the HCR in situ signal within a cell (Choi et al., 2018). NCCs were manually segmented in three dimensions using the segmentation editor in ImageJ based on the expression of the tg(sox10:TagRFP) transgene. Average cell fluorescence intensity of aox5/slc2a15b/gjb8, and cell volume, was calculated using the ImageJ 3D suite (Ollion et al., 2013). Average background fluorescence intensity was estimated using regions of the embryo where no signal was observed. CTCF was calculated as
We noticed that expression of fgf13a and cxcr4b in the dorsal neural tube was more binary than quantitative. Thus we simply counted the number of HNK-1-positive cells in the dorsal neural tube that were also fgf13a/cxcr4b positive.
All plots, and the calculation of Pearson’s correlation coefficient, were produced in R (v.4.0.3). A minimum of three embryos were quantified for all analyses. Sample sizes are reported in relevant figure legends and text. Data is available in source data files: Figure 3—source data 1 and Figure 3—source data 2.
Data availability
Sequencing data have been deposited in GEO under accession code GSE163907.
-
NCBI Gene Expression OmnibusID GSE163907. Single cell RNA analysis of trunk neural crest cells in zebrafish.
References
-
Regulation of neuronal specification in the zebrafish spinal cord by Delta functionDevelopment 125:371–380.
-
Zebrafish narrowminded suggests a genetic link between formation of neural crest and primary sensory neuronsDevelopment 126:3969–3979.
-
The origins of the neural crest Part II: an evolutionary perspectiveMechanisms of Development 69:13–29.https://doi.org/10.1016/s0925-4773(97)00129-9
-
Generalizing RNA velocity to transient cell states through dynamical modelingNature Biotechnology 38:1408–1414.https://doi.org/10.1038/s41587-020-0591-3
-
The central nervous system in amphioxusThe Journal of Comparative Neurology 115:27–51.https://doi.org/10.1002/cne.901150105
-
Vital dye labellin of Xenopus laevis trunk neural crest reveals multipotency and novel pathways of migrationDevelopment 118:363–376.
-
A single-cell transcriptome atlas for zebrafish developmentDevelopmental Biology 459:100–108.https://doi.org/10.1016/j.ydbio.2019.11.008
-
Mechanisms driving neural crest induction and migration in the zebrafish and Xenopus laevisCell Adhesion & Migration 4:595–608.https://doi.org/10.4161/cam.4.4.12962
-
Pigment pattern formation in the medaka embryoPigment Cell Research 18:64–73.https://doi.org/10.1111/j.1600-0749.2005.00216.x
-
The Fibroblast Growth Factor signaling pathwayWiley Interdisciplinary Reviews. Developmental Biology 4:215–266.https://doi.org/10.1002/wdev.176
-
Regulative interactions in zebrafish neural crestDevelopment 122:501–507.https://doi.org/10.1242/dev.122.2.501
-
Zebrafish cx30.3: identification and characterization of a gap junction gene highly expressed in the skinDevelopmental Dynamics 239:2627–2636.https://doi.org/10.1002/dvdy.22399
Article and author information
Author details
Funding
National Institute of General Medical Sciences (GM122768)
- Rytis Prekeris
Eunice Kennedy Shriver National Institute of Child Health and Human Development (F32HD103406)
- Ezra Lencer
National Cancer Institute (T32CA17468)
- Ezra Lencer
The funders had no role in study design, data collection and interpretation, or the decision to submit the work for publication.
Acknowledgements
We thank members of the Prekeris and Artinger laboratories for their thoughtful comments on this project and help throughout. Special thanks to Dr. Lomeli Shull for help with cell dissociation and Dr. Kenneth Jones for help discussing bioinformatics analysis. This work was funded by R01 GM122768 to RP. EL was supported by National Institutes of Health Ruth L. Kirschstein National Research Service Awards (T32CA17468 and F32HD103406). EL, RP, and KA conceived of the study and wrote the manuscript. EL performed research and analyses.
Ethics
This study was performed in strict accordance with the recommendations in the Guide for the Care and Use of Laboratory Animals of the National Institutes of Health. All procedures were performed according to approved institutional animal care and use committee (IACUC) protocols (#00147) of the University of Colorado Anschutz Medical Campus, and every effort was made to minimize suffering.
Version history
- Preprint posted: December 20, 2020 (view preprint)
- Received: December 29, 2020
- Accepted: August 3, 2021
- Version of Record published: August 16, 2021 (version 1)
Copyright
© 2021, Lencer et al.
This article is distributed under the terms of the Creative Commons Attribution License, which permits unrestricted use and redistribution provided that the original author and source are credited.
Metrics
-
- 4,052
- views
-
- 411
- downloads
-
- 21
- citations
Views, downloads and citations are aggregated across all versions of this paper published by eLife.
Download links
A two-part list of links to download the article, or parts of the article, in various formats.
Downloads (link to download the article as PDF)
Open citations (links to open the citations from this article in various online reference manager services)
Cite this article (links to download the citations from this article in formats compatible with various reference manager tools)
Single-cell RNA analysis identifies pre-migratory neural crest cells expressing markers of differentiated derivatives
eLife 10:e66078.
https://doi.org/10.7554/eLife.66078
Further reading
-
- Computational and Systems Biology
- Developmental Biology
The gain-of-function mutation in the TALK-1 K+ channel (p.L114P) is associated with maturity-onset diabetes of the young (MODY). TALK-1 is a key regulator of β-cell electrical activity and glucose-stimulated insulin secretion. The KCNK16 gene encoding TALK-1 is the most abundant and β-cell-restricted K+ channel transcript. To investigate the impact of KCNK16 L114P on glucose homeostasis and confirm its association with MODY, a mouse model containing the Kcnk16 L114P mutation was generated. Heterozygous and homozygous Kcnk16 L114P mice exhibit increased neonatal lethality in the C57BL/6J and the CD-1 (ICR) genetic background, respectively. Lethality is likely a result of severe hyperglycemia observed in the homozygous Kcnk16 L114P neonates due to lack of glucose-stimulated insulin secretion and can be reduced with insulin treatment. Kcnk16 L114P increased whole-cell β-cell K+ currents resulting in blunted glucose-stimulated Ca2+ entry and loss of glucose-induced Ca2+ oscillations. Thus, adult Kcnk16 L114P mice have reduced glucose-stimulated insulin secretion and plasma insulin levels, which significantly impairs glucose homeostasis. Taken together, this study shows that the MODY-associated Kcnk16 L114P mutation disrupts glucose homeostasis in adult mice resembling a MODY phenotype and causes neonatal lethality by inhibiting islet insulin secretion during development. These data suggest that TALK-1 is an islet-restricted target for the treatment for diabetes.
-
- Developmental Biology
- Structural Biology and Molecular Biophysics
A crucial event in sexual reproduction is when haploid sperm and egg fuse to form a new diploid organism at fertilization. In mammals, direct interaction between egg JUNO and sperm IZUMO1 mediates gamete membrane adhesion, yet their role in fusion remains enigmatic. We used AlphaFold to predict the structure of other extracellular proteins essential for fertilization to determine if they could form a complex that may mediate fusion. We first identified TMEM81, whose gene is expressed by mouse and human spermatids, as a protein having structural homologies with both IZUMO1 and another sperm molecule essential for gamete fusion, SPACA6. Using a set of proteins known to be important for fertilization and TMEM81, we then systematically searched for predicted binary interactions using an unguided approach and identified a pentameric complex involving sperm IZUMO1, SPACA6, TMEM81 and egg JUNO, CD9. This complex is structurally consistent with both the expected topology on opposing gamete membranes and the location of predicted N-glycans not modeled by AlphaFold-Multimer, suggesting that its components could organize into a synapse-like assembly at the point of fusion. Finally, the structural modeling approach described here could be more generally useful to gain insights into transient protein complexes difficult to detect experimentally.


