Dorsal raphe nucleus to anterior cingulate cortex 5-HTergic neural circuit modulates consolation and sociability
- Institute of Brain and Behavioral Sciences, College of Life Sciences, Shaanxi Normal University, China
- College of Life Sciences, Nanyang Normal University, China
- Provincial Key Laboratory of Acupuncture and Medications, Shaanxi University of Chinese Medicine, China
Figures
Figure 1 with 5 supplements
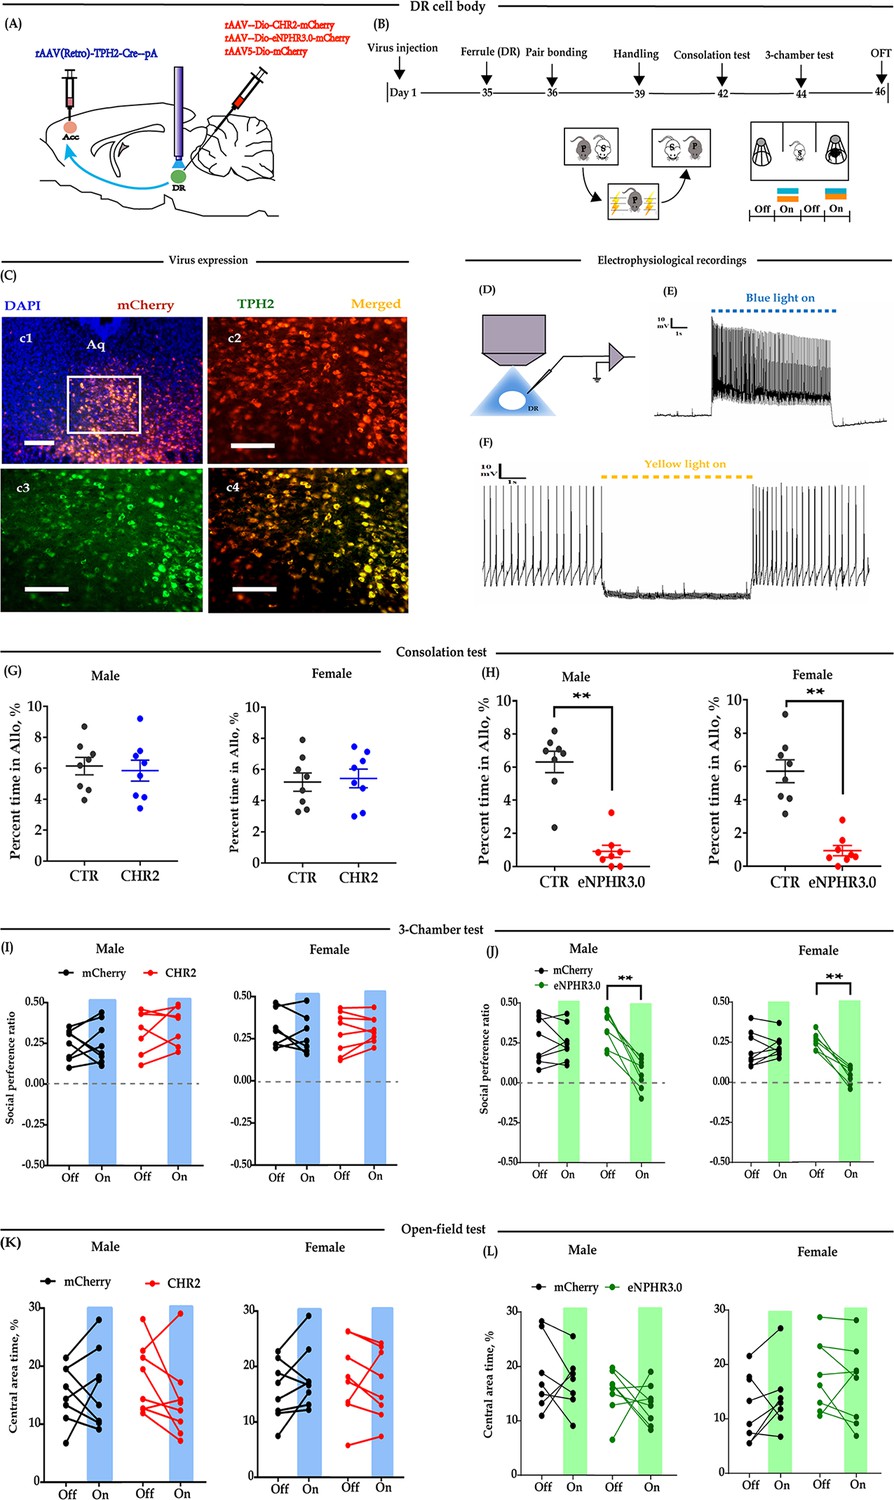
Optogenetic bidirectional modulation of 5-HT neuron in the DR in the DR-ACC neural circuit.
(A) Schematic of optogenetic manipulation. (B) Timeline of experiments. (C) Immunohistological image showing virus expression in the DR (c1) and amplified images in the left box showing the mCherry, TPH2, and the colocalization of the two (‘c2-c4’). (D) Electrophysiological recording model. (E and F) Representative traces from electrophysiological recordings showing photostimulation (E) and photoinhibition of a 5-HT neuron (F). (G) Quantification of allogrooming time in the consolation test of the CHR2 and control animals (n = 8 in each group; CHR2 vs CTR, independent samples t-test and Bayesian independent samples t-test; male: t(14) = 0.340, p=0.739, BF+0 = 0.445 with median posterior δ = 0.104, 95% CI = [−0.673 to 0.930]; female: t(14) = −0.279, p = 0.785, BF+0 = 0.439 with median posterior δ = −0.085, 95% CI = [−0.906 to 0.694]). (H) Quantification of allogrooming time in the consolation test of the eNPHR3.0 and control animals (n = 8 in each group; CHR2 vs eNPHR3.0, independent samples t-test and Bayesian independent samples t-test; male: t(14) = 7.293, p < 0.001, BF+0 = 6000.583; female: t(14) = 6.327, p < 0.001, BF+0 = 1562.921). (I) Quantification of social preference ratio in the three-chamber test of the CHR2 and control animals (n = 7 in CHR2 groups, one male and one female were excluded from analysis due to immobility; n = 8 in CTR groups; two-way repeated measures ANOVA along with two-way Bayesian repeated measures ANOVA; male: group: F(1, 13) = 3.042, p = 0.105, BF(incl) = 1.184; light: F(1, 13) = 0.531, p = 0.479, BF(incl) = 0.425; group × light: F(1, 13) = 0.246, p = 0.628, BF(incl) = 0.479; female: group: F(1, 13) = 2.088, p = 0.172, BF(incl) = 0.790; light: F(1, 13) = 0.180, p = 0.678, BF(incl) = 0.426; group × light: F(1, 13) = 0.233, p = 0.638, BF(incl) = 0.358). (J) Quantification of social preference ratio in the three-chamber test of the eNPHR3.0 and control animals (n = 8 in each group; two-way repeated measures ANOVA along with two-way Bayesian repeated measures ANOVA; male: group: F(1, 14) = 4.084, p = 0.063, BF(incl) = 1.236; light: F(1, 14) = 28.361, p < 0.001, BF(incl) = 25.390; group × light: F(1, 14) = 22.959, p < 0.001, BF(incl) = 87.850; post-hoc comparisons (Tukey): mCherry_Off vs mCherry_On, p = 0.981; eNPHR_Off vs eNPHR_On, p<0.001; female: group: F(1, 14) = 11.892, p = 0.004, BF(incl) = 4.965; light: F(1, 14) = 22.678, p < 0.001, BF(incl) = 7.067; group × light: F(1, 14) = 33.771, p < 0.001, BF(incl) = 623.339; post-hoc comparisons (Tukey): mCherry_Off vs mCherry_On, p = 0.879; eNPHR_Off vs eNPHR_On, p < 0.001). (K) Quantification of time spent in the central area in the open-field test of the CHR2 and control animals (n = 8 in each group; two-way repeated measures ANOVA along with two-way Bayesian repeated measures ANOVA; male: group: F(1, 14) = 0.009, p = 0.465, BF(incl) = 1.184; light: F(1, 14) = 0.808, p = 0.384, BF(incl) = 0.442; group × light: F(1, 14) = 2.266, p = 0.155, BF(incl) = 0.964; female: group: F(1, 14) = 0.240, p = 0.632, BF(incl) = 0.602; light: F(1, 14) = 0.341, p = 0.568, BF(incl) = 0.371; group × light: F(1, 14) = 2.192, p = 0.161, BF(incl) = 0.910). (L) Quantification of time spent in the central area in the open-field test of the eNPHR3.0 and control animals (male_mCherry, n = 7 (one was excluded from analysis due to immobility); male_eNPHR3.0, n = 8; female_mCherry, n = 8; male_eNPHR3.0, n = 8; two-way repeated measures ANOVA along with two-way Bayesian repeated measures ANOVA; male: group: F(1, 13) = 6.326, p = 0.026, BF(incl)=1.935; light: F(1, 13) = 1.176, p = 0.298, BF(incl)=0.605; group × light: F(1, 13) = 0.039, p = 0.846, BF(incl) = 0.578; post-hoc comparisons (Tukey): mCherry_Off vs mCherry_On, p = 0.928; eNPHR_Off vs eNPHR_On, p = 0.785; female: group: F(1, 14) = 0.794, p = 0.388, BF(incl) = 0.660; light: F(1, 14) = 0.632, p = 0.440, BF(incl) = 0.402; group × light: F(1, 14) = 3.390, p = 0.087, BF(incl) = 1.352; post-hoc comparisons (Tukey): mCherry_Off vs mCherry_On, p = 0.928; eNPHR_Off vs eNPHR_On, p = 0.785). Scale bars, 100 μm. Error bars are ± SEM. **p < 0.01. For raw data in this figure, please refer to Figure 1—source data 1. ACC: anterior cingulate cortex; Aq: aqueduct; ANOVA: analysis of variance; CTR: control; DR: dorsal raphe nucleus; TPH2: tryptophan hydroxylase 2; 5-HT: serotonin.
-
Figure 1—source data 1
Source data indicating behavioral performances of bidirectional optogenetic modulation of 5-HT neurons in the DR in the DR-ACC neural circuit.
- https://cdn.elifesciences.org/articles/67638/elife-67638-fig1-data1-v2.xls
Figure 1—figure supplement 1
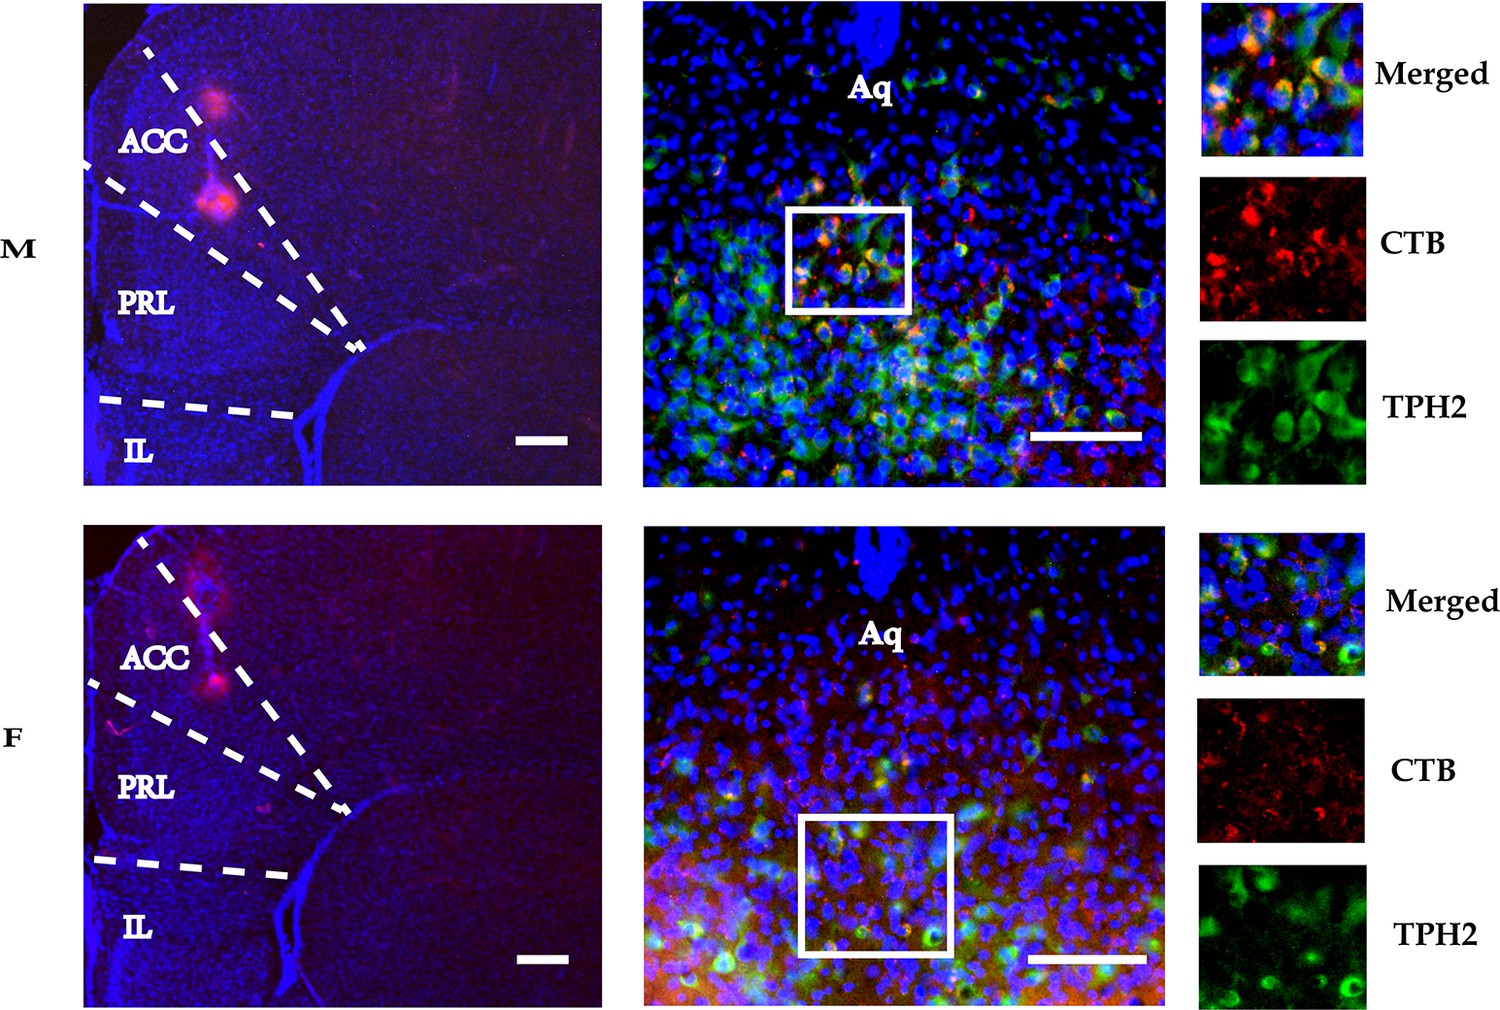
The histology of CTB injecting into the right ACC of male (upper row) and female voles (lower row).
The right panels show colocalization of TPH2+ neurons (green) and CTB (red) in the DR. Scale bars, 100 μm. M: male; F: female; ACC: anterior cingulate cortex; DR: dorsal raphe nucleus; TPH2: tryptophan hydroxylase 2; Aq: aqueduct.
Figure 1—figure supplement 2
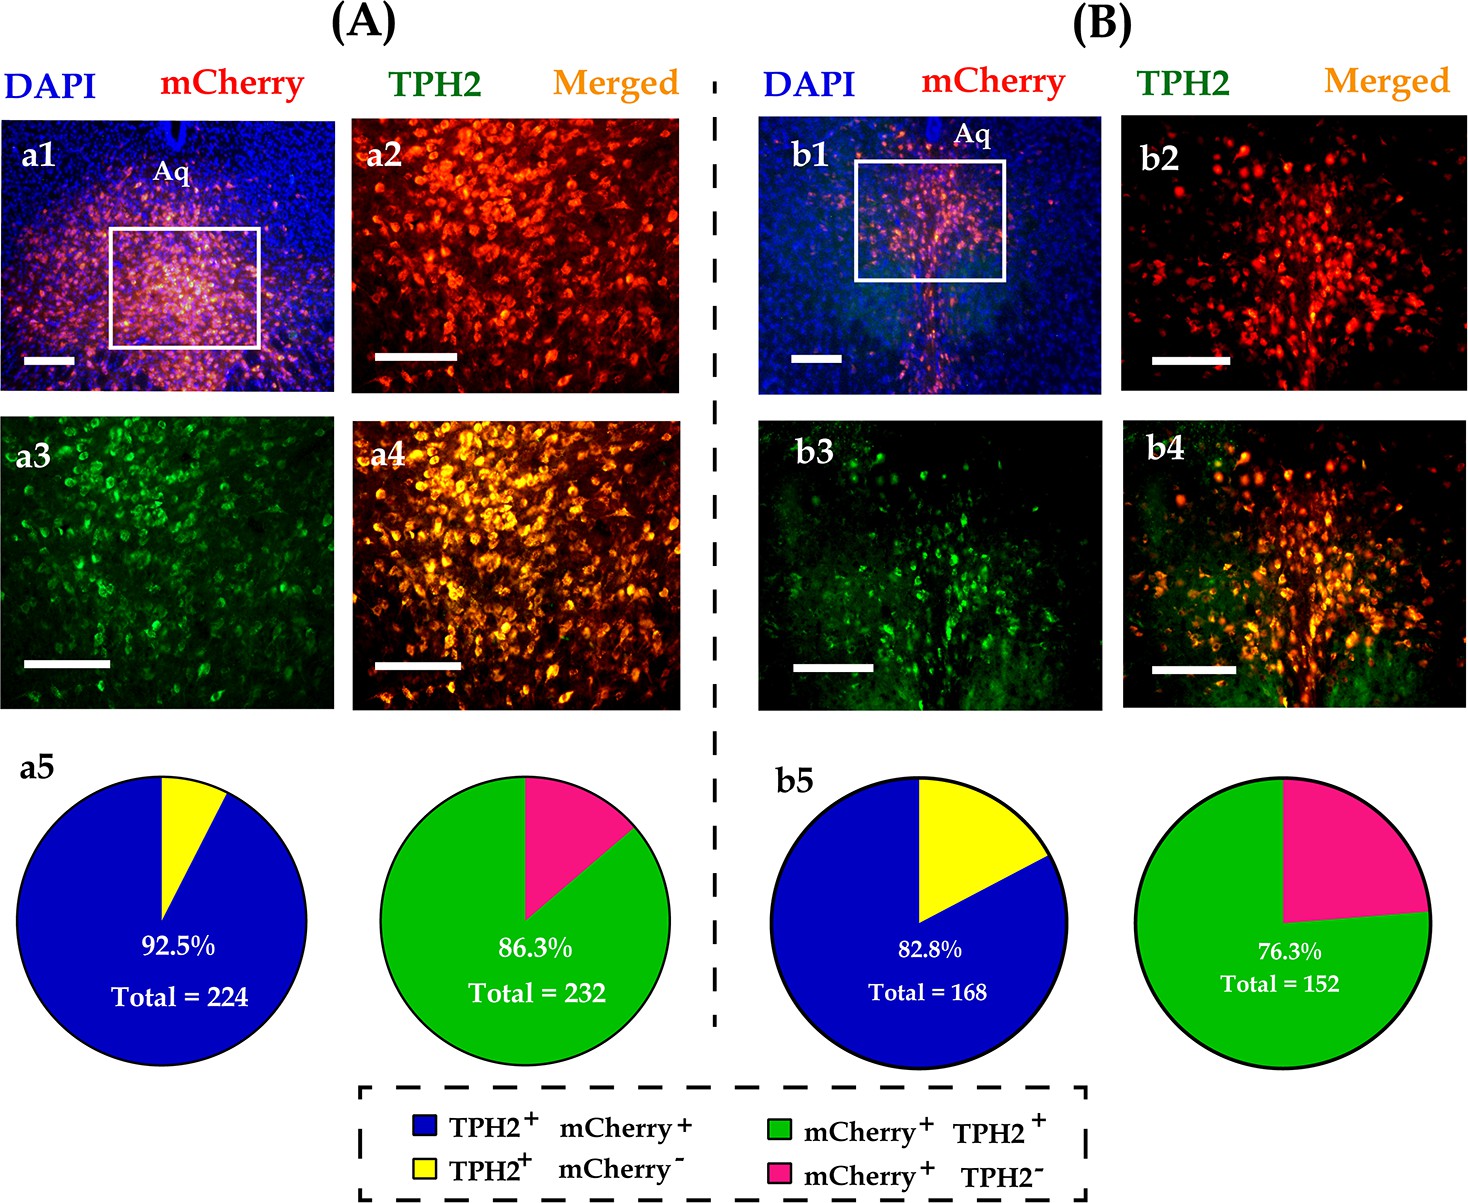
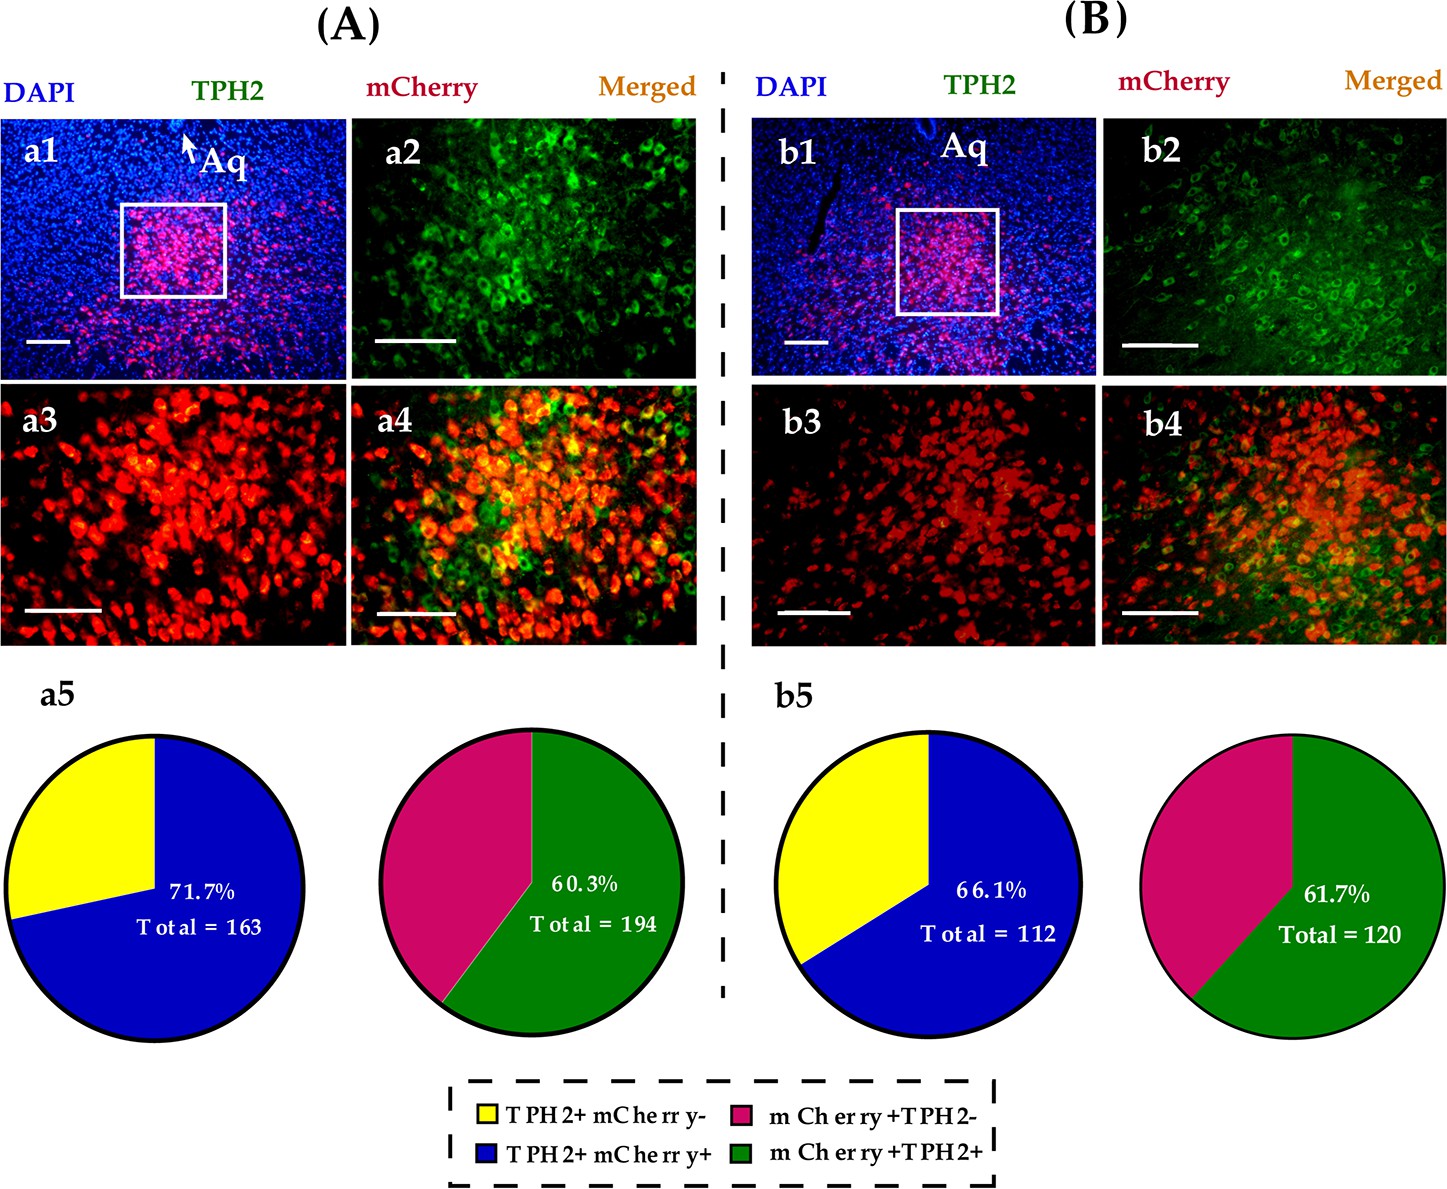
Immunohistological images showing colocalization of opsins (mCherry, red), TPH2+ neurons (green), and DAPI (blue) in the DR of male (A) and (B) female voles.
(a1 and b1): Merged image of DAPI and mCherry; (a2–a4, b2–b4): amplified images in the left box showing the mCherry, TPH2, and the colocalization of mCherry and TPH2; (a5, b5): quantification rates of mCherry neurons colabeled with TPH2 (left pies) and TPH2 neurons colabeled with mCherry (right pies); n = 3 in each sex. Scale bars, 100 μm. Aq: aqueduct; DR: dorsal raphe nucleus; TPH2: tryptophan hydroxylase 2; DAPI: 4′,6-diamidino-2-phenylindole.
Figure 1—figure supplement 3
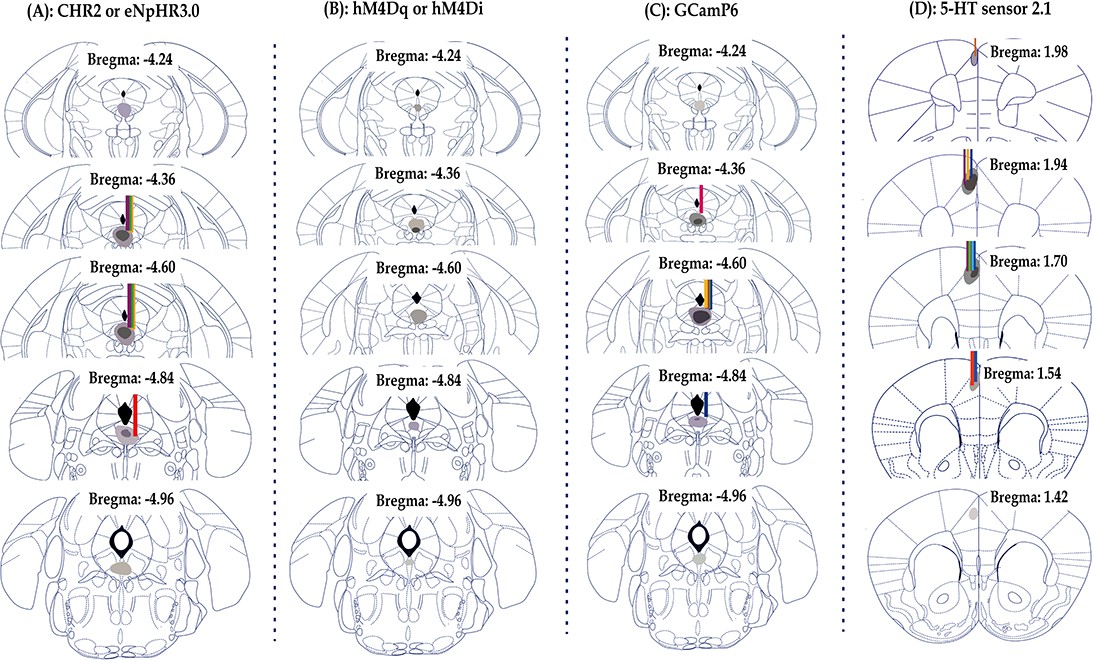
Schematics depicting virus spread (shades) and optic fiber placements (lines) for recording and functional manipulation experiments, related to Figures 1, 3, 4 and 5 (A, B, C, and D, respectively).
Figure 1—figure supplement 4
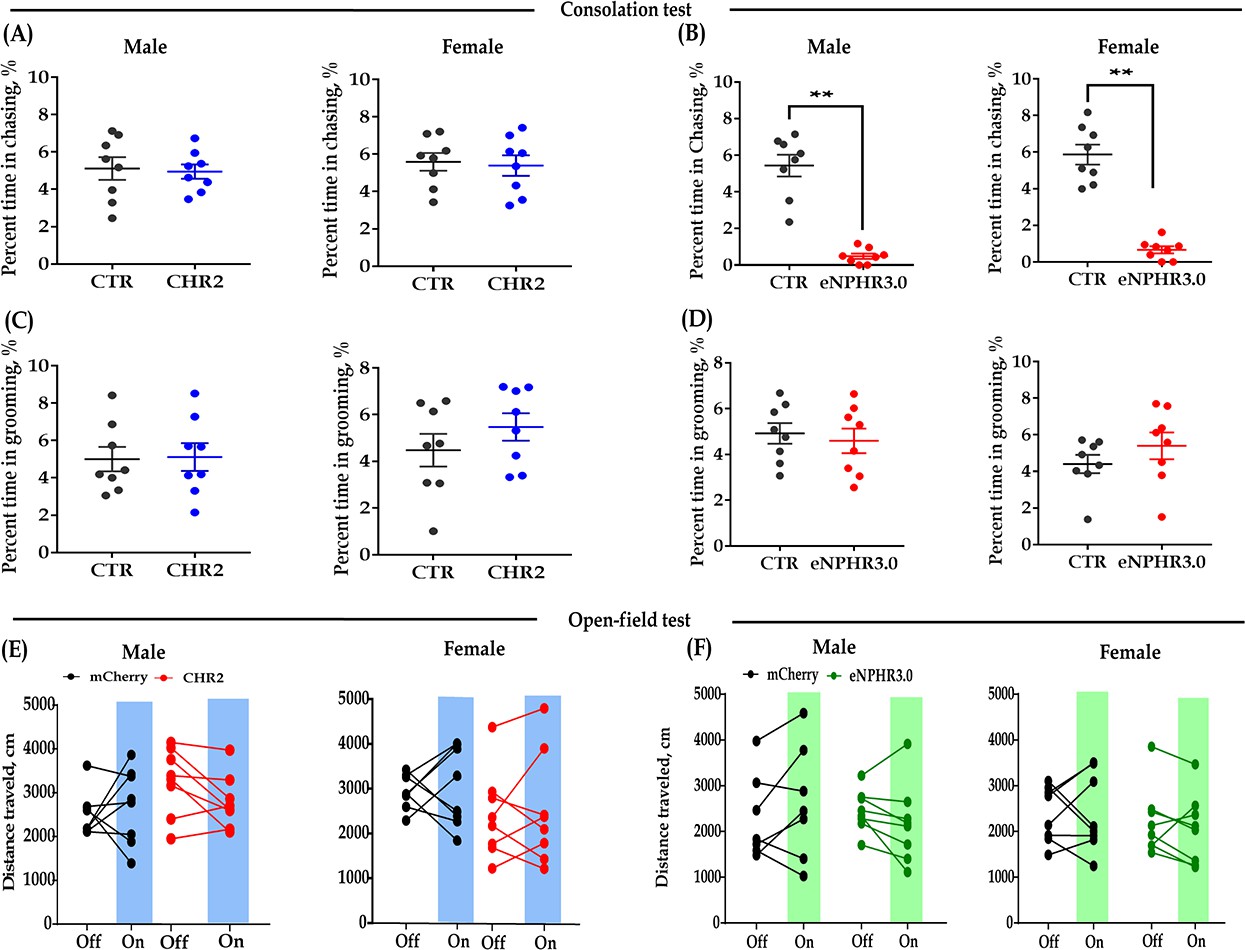
Effect of bidirectional optogenetic modulation of DR 5-HT neuron activities in the DR-ACC neural circuit on some control behaviors.
(A) Quantification of chasing time in the consolation test of the CHR2 and control animals (n = 8 in each group; independent samples t-test and Bayesian independent samples t-test, two tailed; male: t(14) = 0.224, p = 0.826, BF+0 = 0.435 with median posterior δ = 0.068, 95% CI = [−0.714 to 0.884]; female: t(14) = 0.277, p = 0.786, BF+0 = 0.439 with median posterior δ = 0.084, 95% CI = [−0.695 to 0.905]). (B) Quantification of chasing time in the consolation test of the eNPHR3.0 and control animals (N = 8 in each group; independent samples t-test and Bayesian independent samples t-test, one tailed; male: t(14) = 8.086, p<0.001, BF+0 = 16993.904; female: t(14) = −1.092, p = 0.293, BF+0 = 53961.336). (C) Quantification of selfgrooming time in the consolation test of the CHR2 and control animals (n = 8 in each group; independent samples t-test and Bayesian independent samples t-test, two-tailed; male: t(14) = −0.114, p = 0.911, BF+0 = 0.430 with median posterior δ = −0.035, 95% CI = [−0.840 to 0.754]; female: t(14) = −1.092, p = 0.293, BF+0 = 0.635 with median posterior δ = −0.345, 95% CI = [−1.268 to 0.431]). (D) Quantification of selfgrooming time in the consolation test of the eNPHR3.0 and control animals (n = 8 in each group; independent samples t-test and Bayesian independent samples t-test, two-tailed; male: t(14) = 0.470, p = 0.645, BF+0 = 0.596 with median posterior δ = 0.325, 95% CI = [0.016 to 1.701]; female: t(14) = −1.118, p = 0.282, BF+0 = 0.245 with median posterior δ = 0.168, 95% CI = [0.007 to 0.689]). (E) Quantification of total distance traveled in the 5-min open-field test of the CHR2 and control animals (n = 8 in each group; two-way repeated measures ANOVA along with two-way Bayesian repeated measures ANOVA; male: group: F(1, 14) = 0.024, p = 0.878, BF(incl) = 0.435; light: F(1, 14) = 0.359, p = 0.558, BF(incl) = 0.384; group × light: F(1, 14) = 2.266, p = 0.154, BF(incl) = 1.062; female: group: F(1, 14) = 1.828, p = 0.198, BF(incl) = 0.831; light: F(1, 14) = 0.156, p = 0.36099, BF(incl) = 0.360; group × light: F(1, 14) = 1.769e−4, p = 0.990, BF(incl) = 0.447). (F) Quantification of total distance traveled in the 5-min open-field test of the eNPHR3.0 and control animals (male_mCherry, n = 7 (one was excluded from analysis due to immobility); male_eNPHR3.0, n = 8; female_mCherry, n = 8; male_eNPHR3.0, n = 8; two-way repeated measures ANOVA along with two-way Bayesian repeated measures ANOVA; male: group: F(1, 13) = 0.049, p = 0.827, BF(incl) = 0.582; light: F(1, 13) = 0.011, p = 0.918, BF(incl) = 0.338; group × light: F(1, 13) = 3.518, p = 0.083, BF(incl) = 1.330; female: group: F(1, 14) = 0.261, p = 0.618, BF(incl) = 0.569; light: F(1, 14) = 0.251, p = 0.624, BF(incl) = 0.363; group × light: F(1, 14) = 0.339, p = 0.569, BF(incl) = 0.469). Data are presented as mean ± SE, **p<0.01. For raw data, please refer to Figure 1—figure supplement 4—source data 1. ACC: anterior cingulate cortex; ANOVA: analysis of variance; CTR: control; DR: dorsal raphe nucleus; 5-HT: serotonin.
-
Figure 1—figure supplement 4—source data 1
Source data indicating bidirectional optogenetic modulation of DR 5-HT neuron activities in the DR-ACC neural circuit on some control behaviors.
- https://cdn.elifesciences.org/articles/67638/elife-67638-fig1-figsupp4-data1-v2.xls
Figure 1—figure supplement 5
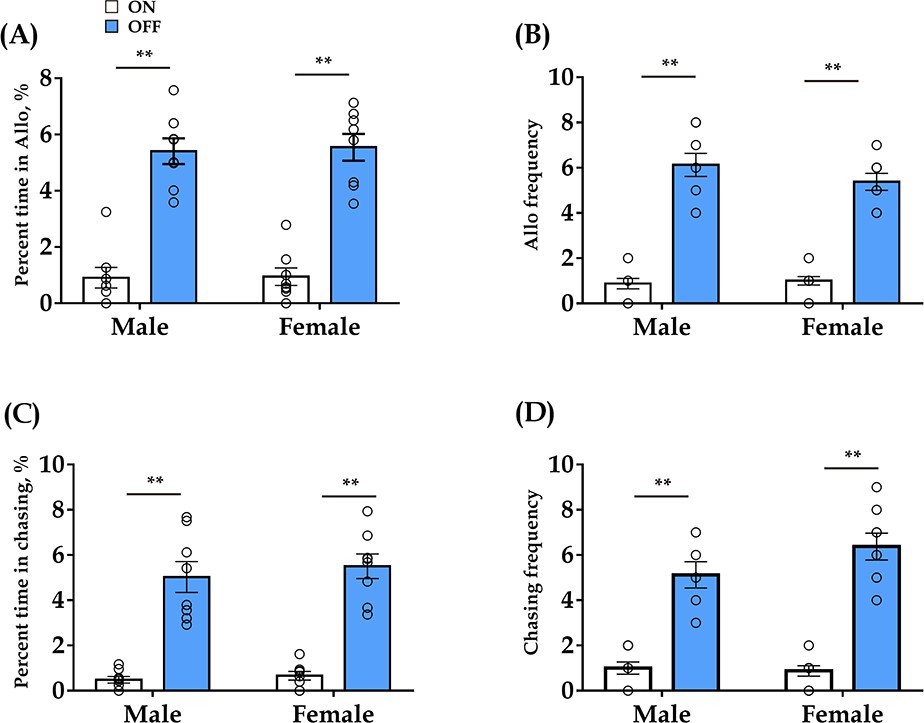
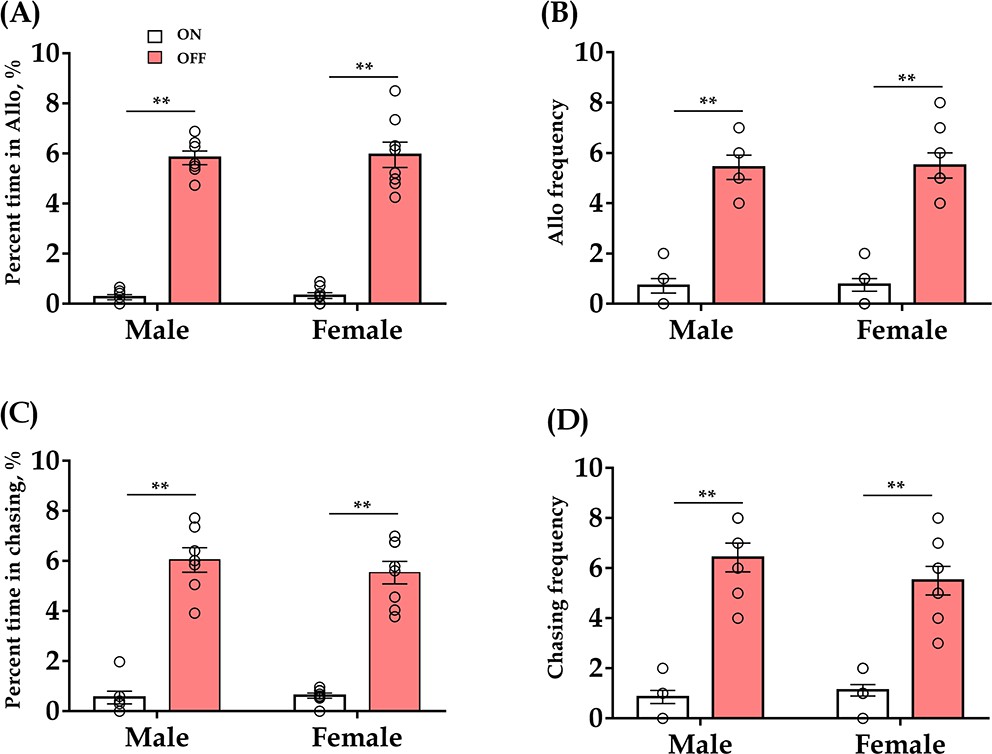
Effect of optogenetic inhibition of DR 5-HT neurons in the DR-ACC neural circuit does not elicit long-lasting effects (< 24 hr) on allogrooming and chasing behavior in the consolation test.
(A) Time spent in allogrooming (male: t(7) = −11.707, p < 0.001, BF+0 = 142.924; female: t(7) = −7.427, p<0.001, BF+0 = 400.207). (B) Allogrooming frequency (male: t(7) = −8.104, p<0.001, BF+0 = 634.047; female: t(7) = −9.501, p<0.001, BF+0 = 318.031). (C) Time spent in chasing (male: t(7) = −6.063, p<0.001, BF+0 = 435.381; female: t(14) = −7.548, p<0.001, BF+0 = 4796.167). (D) Chasing frequency (male: t(7) = −7.105, p<0.001, BF+0 = 4796.167; female: t(14) = −8.072, p<0.001, BF+0 = 620.600). The data for ‘light on’ are derived from ‘Figure 1H’. N = 8 in each group. Paired sample t-test and Bayesian paired samples t-test, one-tailed. Data are presented as mean ± SE, **p<0.01. For raw data, please refer to Figure 1—figure supplement 5—source data 1. ACC: anterior cingulate cortex; DR: dorsal raphe nucleus; CTR: control; 5-HT: serotonin.
-
Figure 1—figure supplement 5—source data 1
Source data indicating the optogenetic inhibition of DR 5-HT neurons in the DR-ACC neural circuit does not elicit long-lasting effects.
- https://cdn.elifesciences.org/articles/67638/elife-67638-fig1-figsupp5-data1-v2.xls
Figure 2 with 2 supplements
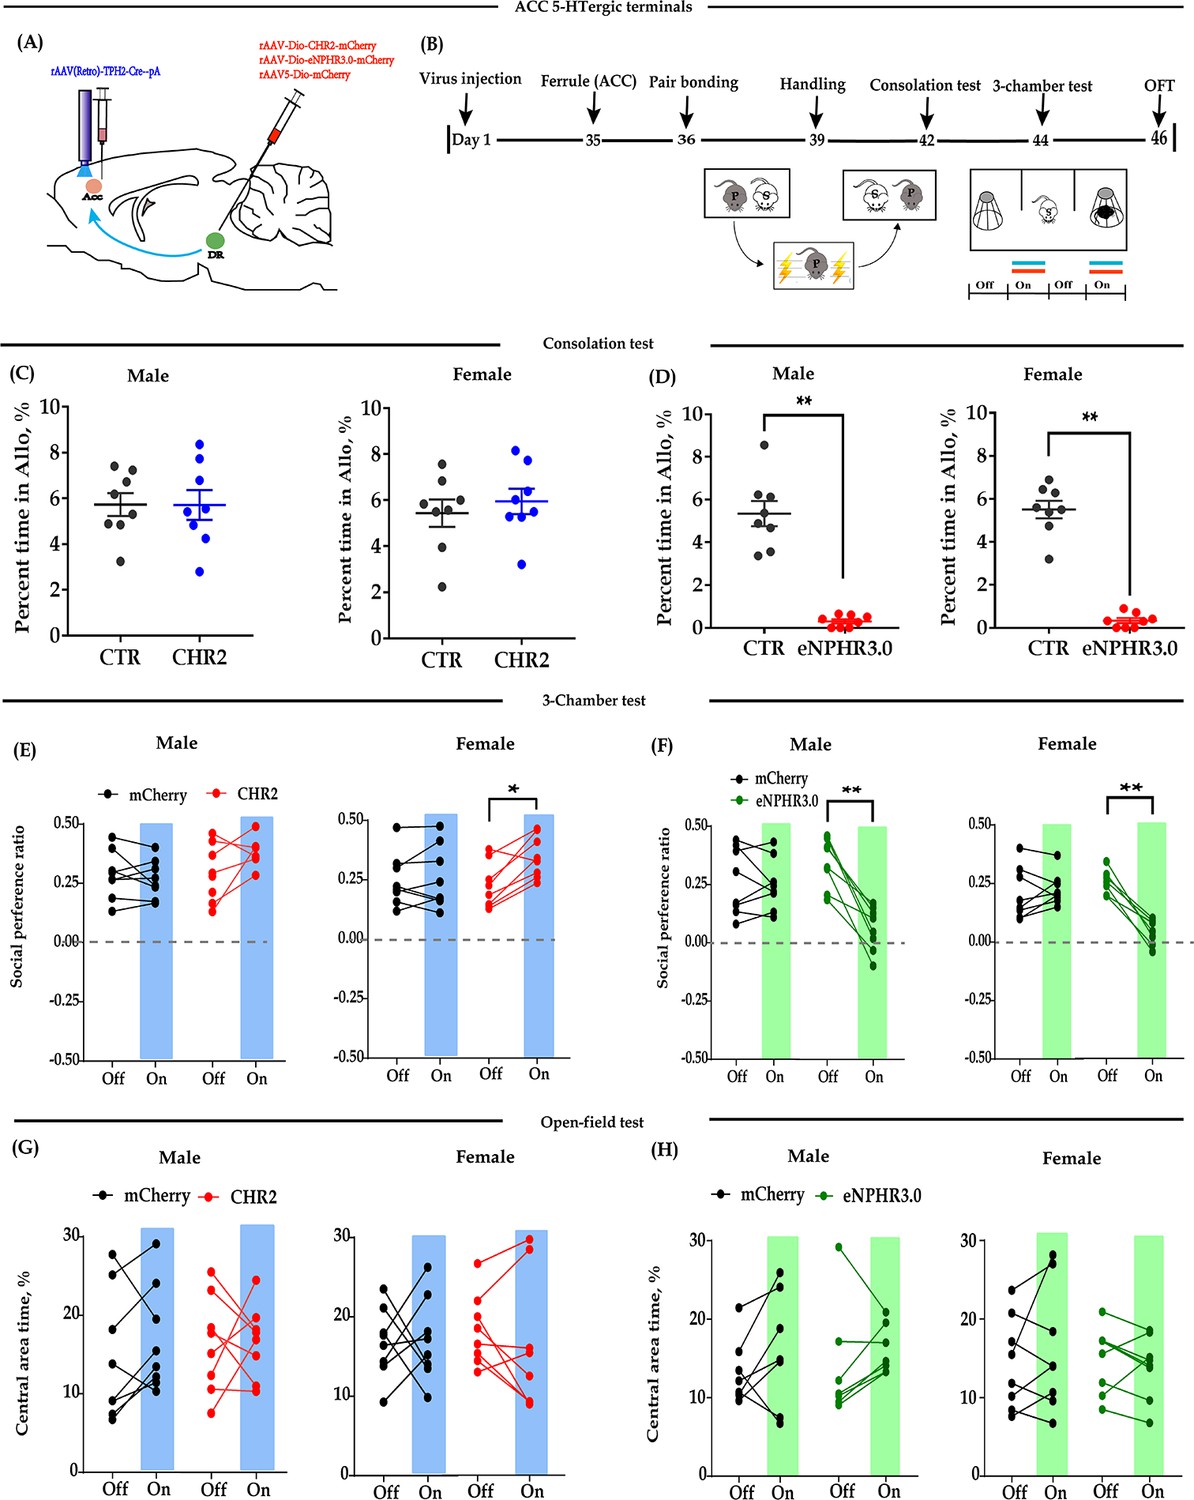
Optogenetic bidirectional modulation of 5-HT terminals within the ACC in the DR-ACC neural circuit.
(A) Schematic of optogenetic manipulation. (B) Timeline of experiments. (C) Quantification of time spent in allogrooming in the consolation test of the CHR2 and control animals (n = 8 in each group; CHR2 vs CTR, independent samples t-test and Bayesian independent samples t-test; male: t(14) = 0.011, p = 0.992, BF+0 = 0.428 with median posterior δ = 0.003, 95% CI = [−0.792 to 0.800]; female: t(14) = −0.630, p = 0.539, BF+0 = 0.489 with median posterior δ = −0.194, 95% CI = [−1.054 to 0.575]). (D) Quantification of time spent in allogrooming in the consolation test of the eNPHR3.0 and control animals (n = 8 in each group; CHR2 vs CTR, independent samples t-test and Bayesian independent samples t-test; male: t(14) = 8.44, p<0.001, BF+0 = 26556.455; female: t(14) = 12.174, p<0.001, BF+0 = 1.577 × e+6). (E) Quantification of social preference ratio in the three-chamber test of the CHR2 and control animals (n = 8 in each group; two-way repeated measures ANOVA along with two-way Bayesian repeated measures ANOVA; male: group: F(1, 14) = 0.443, p = 0.516, BF(incl) = 0.624; light: F(1, 14) = 5.764, p = 0.031, BF(incl) = 1.763; group × light: F(1, 14) = 3.556, p = 0.080, BF(incl) = 1.239; female: group: F(1, 14) = 3.985, p = 0.066, BF(incl) = 1.151; light: F(1, 14) = 3.704, p = 0.075, BF(incl) = 1.097; group × light: F(1, 14) = 6.297, p = 0.025, BF(incl) = 4.186; post-hoc comparisons (Tukey): mCherry_Off vs mCherry_On, p = 0.975; CHR2_Off vs CHR2_On, p = 0.033). (F) Quantification of social preference ratio in the three-chamber test of the eNPHR3.0 and control animals (n = 8 in each group; two-way repeated measures ANOVA along with two-way Bayesian repeated measures ANOVA; male: group: F(1, 14) = 9.763, p = 0.007, BF(incl) = 3.374; light: F(1, 14) = 13.168, p = 0.003, BF(incl)=9.588; group × light: F(1, 14) = 10.843, p = 0.005, BF(incl) = 13.892; post-hoc comparisons (Tukey): mCherry_Off vs mCherry_On, p = 0.995; eNPHR_Off vs eNPHR_On, p = 0.001; female: group: F(1, 14) = 6.912, p = 0.020, BF(incl) = 1.545; light: F(1, 14) = 93.330, p < 0.001, BF(incl) = 423.687; group × light: F(1, 14) = 65.062, p < 0.001, BF(incl) = 20440.982; post-hoc comparisons (Tukey): mCherry_Off vs mCherry_On, p = 0.679; eNPHR_Off vs eNPHR_On, p < 0.001). (G) Quantification of time spent in the central area in the open-field test of the CHR2 and control animals (n = 8 in each group; two-way repeated measures ANOVA along with two-way Bayesian repeated measures ANOVA; male: group: F(1, 14) = 4.189 × e−4, p = 0.984, BF(incl) = 0.483; light: F(1, 14) = 0.842, p = 0.374, BF(incl) = 0.489; group × light: F(1, 14) = 0.501, p = 0.491, BF(incl) = 0.486; female: group: F(1, 14) = 0.014, p = 0.906, BF(incl) = 0.457; light: F(1, 14) = 0.050, p = 0.826, BF(incl) = 0.335; group × light: F(1, 14) = 0.177, p = 0.681, BF(incl) = 0.440). (H) Quantification of time spent in the central area in the open-field test of the eNPHR3.0 and control animals (male: n = 7, two animals (one from each group) were excluded from analysis due to immobility; female n = 8; two-way repeated measures ANOVA along with two-way Bayesian repeated measures ANOVA; male: group: F(1, 12) = 0.091, p = 0.769, BF(incl) = 0.566; light: F(1, 12) = 8.130, p = 0.015, BF(incl) = 4.162; group × light: F(1, 12) = 0.802, p = 0.388, BF(incl) = 0.550; post-hoc comparisons (Tukey): mCherry_Off vs mCherry_On, p = 0.532; eNPHR_Off vs eNPHR_On, p = 0.086; female: group: F(1, 14) = 0.276, p = 0.607, BF(incl) = 0.578; light: F(1, 14) = 0.580, p = 0.459, BF(incl) = 0.404; group × light: F(1, 14) = 2.234, p = 0.157, BF(incl) = 0.871). Error bars are ± SEM. *p < 0.05, **p < 0.01. For raw data in this figure, please refer to Figure 2—source data 1. ACC: anterior cingulate cortex; ANOVA: analysis of variance; DR: dorsal raphe nucleus; CTR: control; 5-HT: serotonin.
-
Figure 2—source data 1
Source data indicating behavioral performances of optogenetic bidirectional modulation of 5-HT terminals within the ACC in the DR-ACC neural circuit.
- https://cdn.elifesciences.org/articles/67638/elife-67638-fig2-data1-v2.xls
Figure 2—figure supplement 1
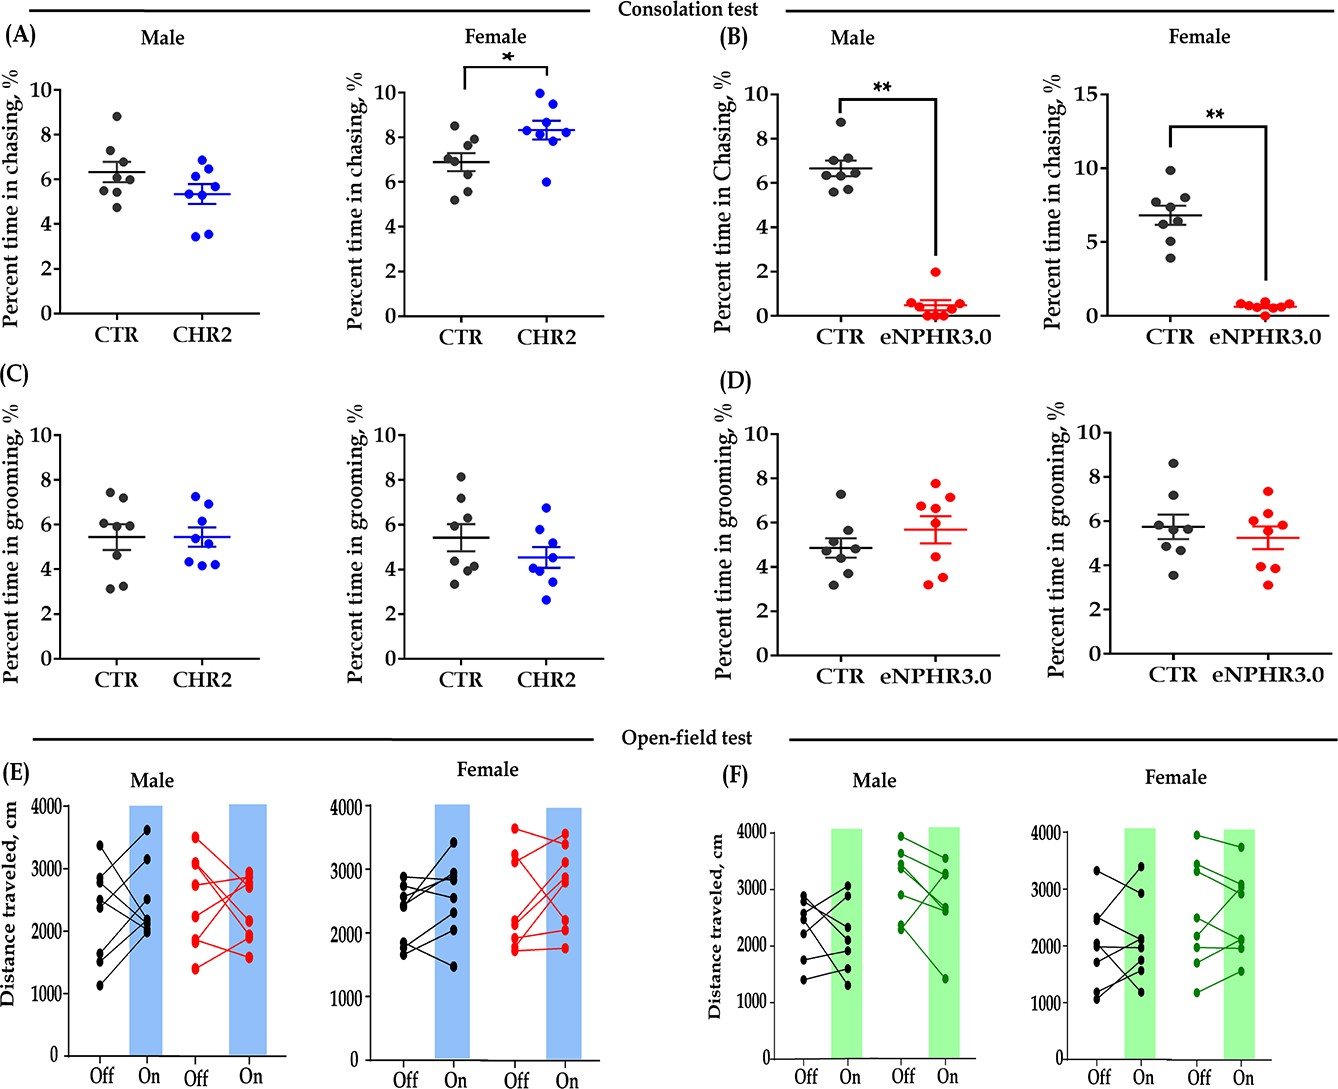
Effect of bidirectional optogenetic modulation of ACC 5-HT terminals in the DR-ACC neural circuit on some control behaviors.
(A) Quantification of chasing time in the consolation test of the CHR2 and control animals (n = 8 in each group; independent samples t-test and Bayesian independent samples t-test, two-tailed; male: t(14) = 1.542, p = 0.145, BF+0 = 0.920 with median posterior δ = 0.506, 95% CI = [−0.301 to 1.496]; female: t(14) = −2.458, p = 0.028, BF+0 = 2.585 with median posterior δ = −0.884, 95% CI = [−2.006 to 0.050]). (B) Quantification of chasing time in the consolation test of the eNPHR3.0 and control animals (n = 8 in each group; independent samples t-test and Bayesian independent samples t-test, two-tailed; male: t(14) = 14.635, p<0.001, BF+0 = 1.407e+7; female: t(14) = 9.384, p<0.001, BF+0 = 82683.230). (C) Quantification of selfgrooming time in the consolation test of the CHR2 and control animals (n = 8 in each group; independent samples t-test and Bayesian independent samples t-test, two-tailed; male: t(14) = 8.651e−4, p = 0.999, BF+0 = 0.428 with median posterior δ = 0.000, 95% CI = [−0.796 to 0.797]; female: t(14) = 1.145, p = 0.271, BF+0 = 0.660 with median posterior δ = 0.364, 95% CI = [−0.415 to 1.294]). (D) Quantification of selfgrooming time in the consolation test of the eNPHR3.0 and control animals (n = 8 in each group; independent samples t-test and Bayesian independent samples t-test, two-tailed; male: t(14) = −0.438, p = 0.668, BF+0 = 0.332 with median posterior δ = 0.214, 95% CI = [0.009 to 0.814]; female: t(14) = 0.654, p = 0.524, BF+0 = 0.691 with median posterior δ = 0.357, 95% CI = [0.019 to 1.137]). (E) Quantification of total distance traveled in the 5-min open-field test of the CHR2 and control animals (n = 8 in each group; two-way repeated measures ANOVA along with two-way Bayesian repeated measures ANOVA; male: group: F(1, 14) = 1.077, p = 0.317, BF(incl) = 0.656; light: F(1, 14) = 0.076, p = 0.787, BF(incl) = 0.330; group × light: F(1, 14) = 0.581, p = 0.458, BF(incl) = 0.502; female: group: F(1, 14) = 0.304, p = 0.590, BF(incl) = 0.542; light: F(1, 14) = 3.241, p = 0.093, BF(incl) = 1.138; group × light: F(1, 14) = 0.006, p = 0.939, BF(incl) = 0.416). (F) Quantification of total distance traveled in the 5-min open-field test of the eNPHR3.0 and control animals (male: n = 7 in each group, two animals (one from each group) were excluded from analysis due to immobility; female: n = 8 in each group; two-way repeated measures ANOVA along with two-way Bayesian repeated measures ANOVA; male: group: F(1, 12) = 5.832, p = 0.033, BF(incl) = 2.450; light: F(1, 12) = 1.990, p = 0.184, BF(incl) = 0.679; group × light: F(1, 12) = 0.483, p = 0.500, BF(incl) = 0.540; female: group: F(1, 14) = 1.642, p = 0.221, BF(incl) = 0.857; light: F(1, 14) = 0.178, p = 0.680, BF(incl) = 0.356; group × light: F(1, 14) = 0.067, p = 0.799, BF(incl) = 0.417). Data are presented as mean ± SE, **p<0.01. For raw data, please refer to Figure 2—figure supplement 1—source data 1. ACC: anterior cingulate cortex; ANOVA: analysis of variance; DR: dorsal raphe nucleus; CTR: control; 5-HT: serotonin.
-
Figure 2—figure supplement 1—source data 1
Source data indicating optogenetic bidirectional modulation of ACC 5-HT terminals in the DR-ACC neural circuit on some control behaviors.
- https://cdn.elifesciences.org/articles/67638/elife-67638-fig2-figsupp1-data1-v2.xls
Figure 2—figure supplement 2
Effect of optogenetic inhibition of ACC 5-HT terminals in the DR-ACC neural circuit does not elicit long-lasting effects (<24 hr) on allogrooming and chasing behaviors in the consolation test.
(A) Time spent in allogrooming (male: t(6) = −19.792, p < 0.001, BF+0 = 21609.467; female: t(7) = −10.404, p < 0.001, BF+0 = 2475.291). (B) Allogrooming frequency (male: t(6) = −11.210, p < 0.001, BF+0 = 1392.685; female: t(7) = −7.333, p < 0.001, BF+0 = 374.389). (C) Time spent in chasing (male: t(6) = −12.448, p < 0.001, BF+0 = 1144.562; female: t(7) = −9.858, p < 0.001, BF+0 = 917.640). (D) Chasing frequency (male: t(7) = −9.750, p < 0.001, BF+0 = 362.702; female: t(7) = −7.344, p<0.001, BF+0 = 188.706). N = 8 in each group. The data for ‘light on’ are derived from ‘Figure 2D’. Paired sample t-test and Bayesian paired samples t-test, one-tailed. Data are presented as mean ± SE, **p < 0.01. For raw data, please refer to Figure 2—figure supplement 2—source data 1. ACC: anterior cingulate cortex; DR: dorsal raphe nucleus; CTR: control; 5-HT: serotonin.
-
Figure 2—figure supplement 2—source data 1
Source data indicating the optogenetic inhibition of ACC 5-HT terminals in the DR-ACC neural circuit does not elicit long-lasting effects.
- https://cdn.elifesciences.org/articles/67638/elife-67638-fig2-figsupp2-data1-v2.xlsx
Figure 3 with 2 supplements

Chemogenetic modulation of DR 5-HT neuron activities in the DR-ACC neural circuit.
(A) Schematic of chemogenetical manipulations. (B) Timeline of experiments. (C) Immunohistological image showing virus expression in the DR (c1) and amplified images in the left white box showing the mCherry, TPH2, and the colocalization of the two (c2–c4). (D) Representative trace from a Gq-DREADD neuron. (E) Representative trace from a Gi-DREADD-transfected neuron. (F) Quantification of spike rheobase and spike numbers under current step injections in Gi-DREADD-transfected neurons (n = 5 neurons; spike rheobase: paired t-test, t(4) = 4.491, p = 0.0109; two-way repeated measures ANOVA; spike numbers: treatment: F(1, 4) = 8.734, p = 0.0417, current: F(10, 40) = 8.989, p<0.0001; treatment ×current: F(10, 40) = 4.013, p = 0.0008). (G) Quantification of allogrooming time in the consolation test (two-way repeated measures ANOVA along with two-way Bayesian repeated measures ANOVA; male: treatment: F(1, 19) = 6.300, p = 0.021, BF(incl) = 2.007; group: F(2, 19) = 5.434, p = 0.014, BF(incl) = 0.777; treatment ×group: F(1, 19) = 8.433, p = 0.002, BF(incl) = 215.751; post-hoc comparisons (Tukey): Gi_Saline vs Gi_CNO, p = 0.002; Gq_Saline vs Gq_CNO, p = 1; Dio_Saline vs Dio_CNO, p = 0.991). Female: treatment: F(1, 20) = 4.570, p = 0.045, BF(incl) = 1.120; group: F(2, 20) = 2.884, p = 0.079, BF(incl) = 0.816; treatment × group: F(1, 20) = 10.778, p< 0.001, BF(incl) = 154.421. Post-hoc comparisons (Tukey): Gi_Saline vs Gi_CNO, p < 0.001; Gq_Saline vs Gq_CNO, p = 0.996; Dio_Saline vs Dio_CNO, p = 0.977. (H) Quantification of social preference ratio in the three-chamber test (two-way repeated measures ANOVA along with two-way Bayesian repeated measures ANOVA; male: treatment: F(1, 19) = 4.707, p = 0.043, BF(incl) = 2.261; group: F(2, 19) = 1.387, p = 0.274, BF(incl) = 0.365; treatment × group: F(1, 19) = 2.990, p = 0.074, BF(incl) = 2.562; post-hoc comparisons (Tukey): Gi_Saline vs Gi_CNO, p = 0.046; Gq_Saline vs Gq_CNO, p = 1; Dio_Saline vs Dio_CNO, p = 1; female: treatment: F(1,20) = 11.687, p = 0.003, BF(incl) = 9.390; group: F(2, 20) = 0.205, p = 0.817, BF(incl) = 0.272; treatment × group: F(1, 20) = 8.923, p = 0.002, BF(incl) = 42.856; post-hoc comparisons (Tukey): Gi_Saline vs Gi_CNO, p < 0.001; Gq_Saline vs Gq_CNO, p = 0.307; Dio_Saline vs Dio_CNO, p = 0.892). (I) Quantification of time spent in the central area in the open-field test (two-way repeated measures ANOVA along with two-way Bayesian repeated measures ANOVA; male: treatment: F(1, 19) = 4.305, p = 0.052, BF(incl) = 4.438; group: F(2, 19) = 2.064, p = 0.155, BF(incl) = 0.384; treatment × group: F(1, 19) = 0.164, p = 0.850, BF(incl) = 0.300; post-hoc comparisons (Tukey): Gi_Saline vs Gi_CNO, p = 0.963; Gq_Saline vs Gq_CNO, p = 0.605; Dio_Saline vs Dio_CNO, p = 0.838; female: treatment: F(1, 20) = 0.288, p = 0.597, BF(incl) = 0.313; group: F(2, 20) = 4.419, p = 0.026, BF(incl) = 2.335; treatment × group: F(1, 20) = 2.242, p = 0.132, BF(incl) = 1.146; post-hoc comparisons (Tukey): Gi_Saline vs Gi_CNO, p = 0.959; Gq_Saline vs Gq_CNO, p = 0.726; Dio_Saline vs Dio_CNO, p = 0.711). Male_Dio, n = 8; female_Dio, n = 7; male_Gq, n = 7; female_Gq, n = 8; male_Gi, n = 7; female_Gi, n = 8. Error bars are ± SEM. Scale bars, 100 μm. *p < 0.05, **p < 0.01. For raw data in this figure, please refer to Figure 3—source data 1. ACC: anterior cingulate cortex; Aq: aqueduct; ANOVA: analysis of variance; DR: dorsal raphe nucleus; TPH2: tryptophan hydroxylase 2; M: male; F: female; 5-HT: serotonin.
-
Figure 3—source data 1
Source data indicating chemogenetic modulation of DR 5-HT neuron activities in the DR-ACC neural circuit.
- https://cdn.elifesciences.org/articles/67638/elife-67638-fig3-data1-v2.xls
Figure 3—figure supplement 1
Immunohistological image showing colocalization of DREADD (mCherry, red), TPH2+ neurons (green), and DAPI (blue) in the DR of male (A) and (B) female voles.
(a1 and b1) Merged image of DAPI and mCherry; (a2–a4, b2–b4) amplified images in the left box showing the mCherry, TPH2, and the colocalization of mCherry and TPH2; (a5, b5) quantification rates of mCherry neurons colabeled with TPH2 (left pies) and TPH2 neurons colabeled with mCherry (right pies), n = 3 in each sex. Scale bars, 100 μm. Aq: aqueduct; DR: dorsal raphe nucleus; TPH2: tryptophan hydroxylase 2; DAPI: 4′,6-diamidino-2-phenylindole.
Figure 3—figure supplement 2
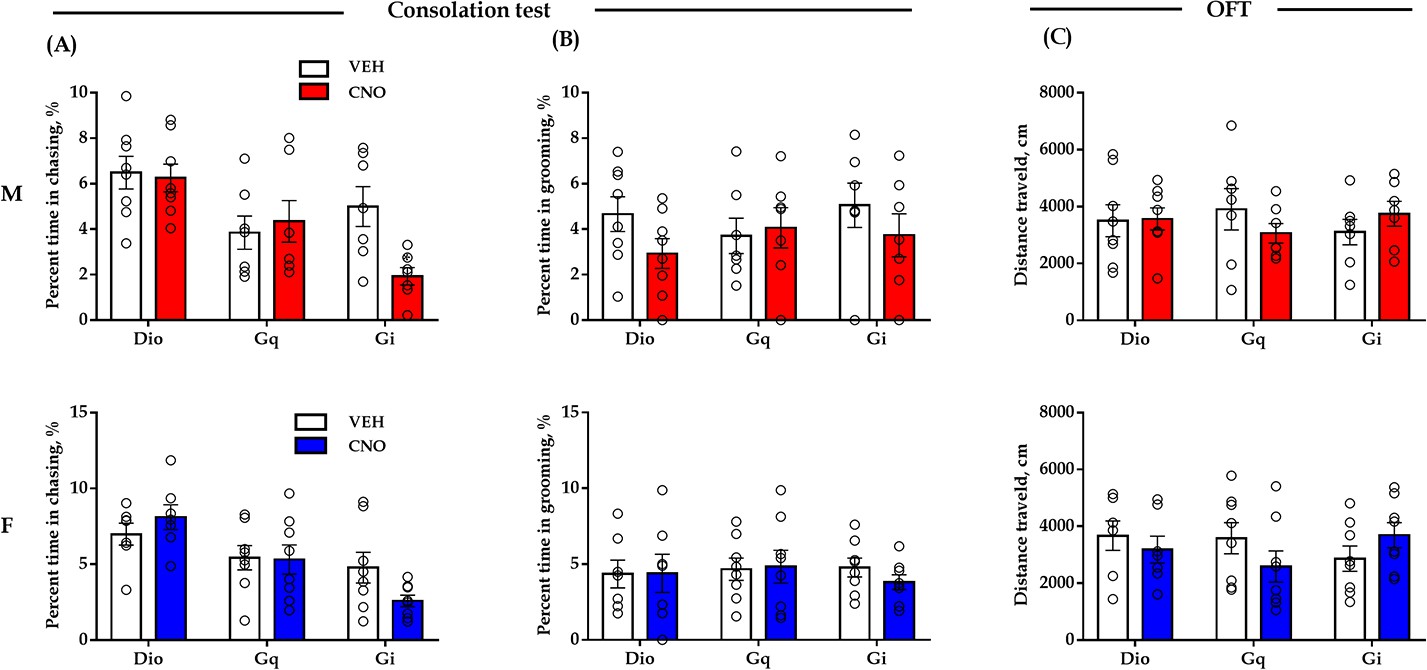
Effect of chemogenetic modulation of DR 5-HT neuron activities in the DR-ACC neural circuit on some control behaviors.
(A) Quantification of chasing time in the consolation test (male: treatment: F(1, 19) = 2.118, p = 0.162, BF(incl) = 0.757; group: F(2, 19) = 11.238, p<0.001, BF(incl) = 7.968; treatment × group: F(1, 19) = 2.765, p = 0.088, BF(incl) = 2.286; post-hoc comparisons (Tukey): Gi_Saline vs Gi_CNO, p = 0.122; Gq_Saline vs Gq_CNO, p = 0.998; Dio_Saline vs Dio_CNO, p = 1; female: treatment: F(1, 20) = 0.436, p = 0.517, BF(incl) = 0.363; group: F(2, 20) = 9.228, p = 0.001, BF(incl) = 15.063; treatment × group: F(1, 20) = 2.564, p = 0.102, BF(incl) = 1.396; post-hoc comparisons (Tukey): Gi_Saline vs Gi_CNO, p = 0.300; Gq_Saline vs Gq_CNO, p = 1; Dio_Saline vs Dio_CNO, p = 0.902). (B) Quantification of selfgrooming time in the consolation test (male: treatment: F(1, 19) = 1.957, p = 0.178, BF(incl) = 0.824; group: F(2, 19) = 0.270, p = 0.766, BF(incl) = 0.278; treatment × group: F(1, 19) = 0.980, p = 0.393, BF(incl) = 0.525; female: treatment: F(1, 20) = 0.115, p = 0.739, BF(incl) = 0.307; group: F(2, 20) = 0.189, p = 0.829, BF(incl) = 0.237; treatment × group: F(1, 20) = 0.229, p = 0.797, BF(incl) = 0.309). (C) Quantification of total distance traveled in the 5-min open-field test (male: treatment: F(1, 19) = 0.005, p = 0.945, BF(incl) = 0.289; group: F(2, 19) = 0.028, p = 0.236, BF(incl) = 0.384; treatment × group: F(1, 19) = 0.979, p = 0.394, BF(incl) = 0.556; female: treatment: F(1, 20) = 0.299, p = 0.591, BF(incl) = 0.337; group: F(2, 20) = 0.231, p = 0.796, BF(incl) = 0.249; treatment × group: F(1, 20) = 1.926, p = 0.172, BF(incl) = 1.191). Male_Dio, n = 8; female_Dio, n = 7; male_Gq, n = 7; female_Gq, n = 8; male_Gi, n = 7; female_Gi, n = 8. Two-way repeated measures ANOVA along with two-way Bayesian repeated measures ANOVA. Error bars are ± SEM. For raw data in this figure, please refer to Figure 3—figure supplement 2—source data 1. ACC: anterior cingulate cortex; Aq: aqueduct; ANOVA: analysis of variance; DR: dorsal raphe nucleus; TPH2: tryptophan hydroxylase 2; M: male; F: female; 5-HT: serotonin.
-
Figure 3—figure supplement 2—source data 1
Source data indicating the effects of chemogenetic modulation of DR 5-HT neuron activities in the DR-ACC neural circuit on some control behaviors.
- https://cdn.elifesciences.org/articles/67638/elife-67638-fig3-figsupp2-data1-v2.xls
Figure 4 with 2 supplements
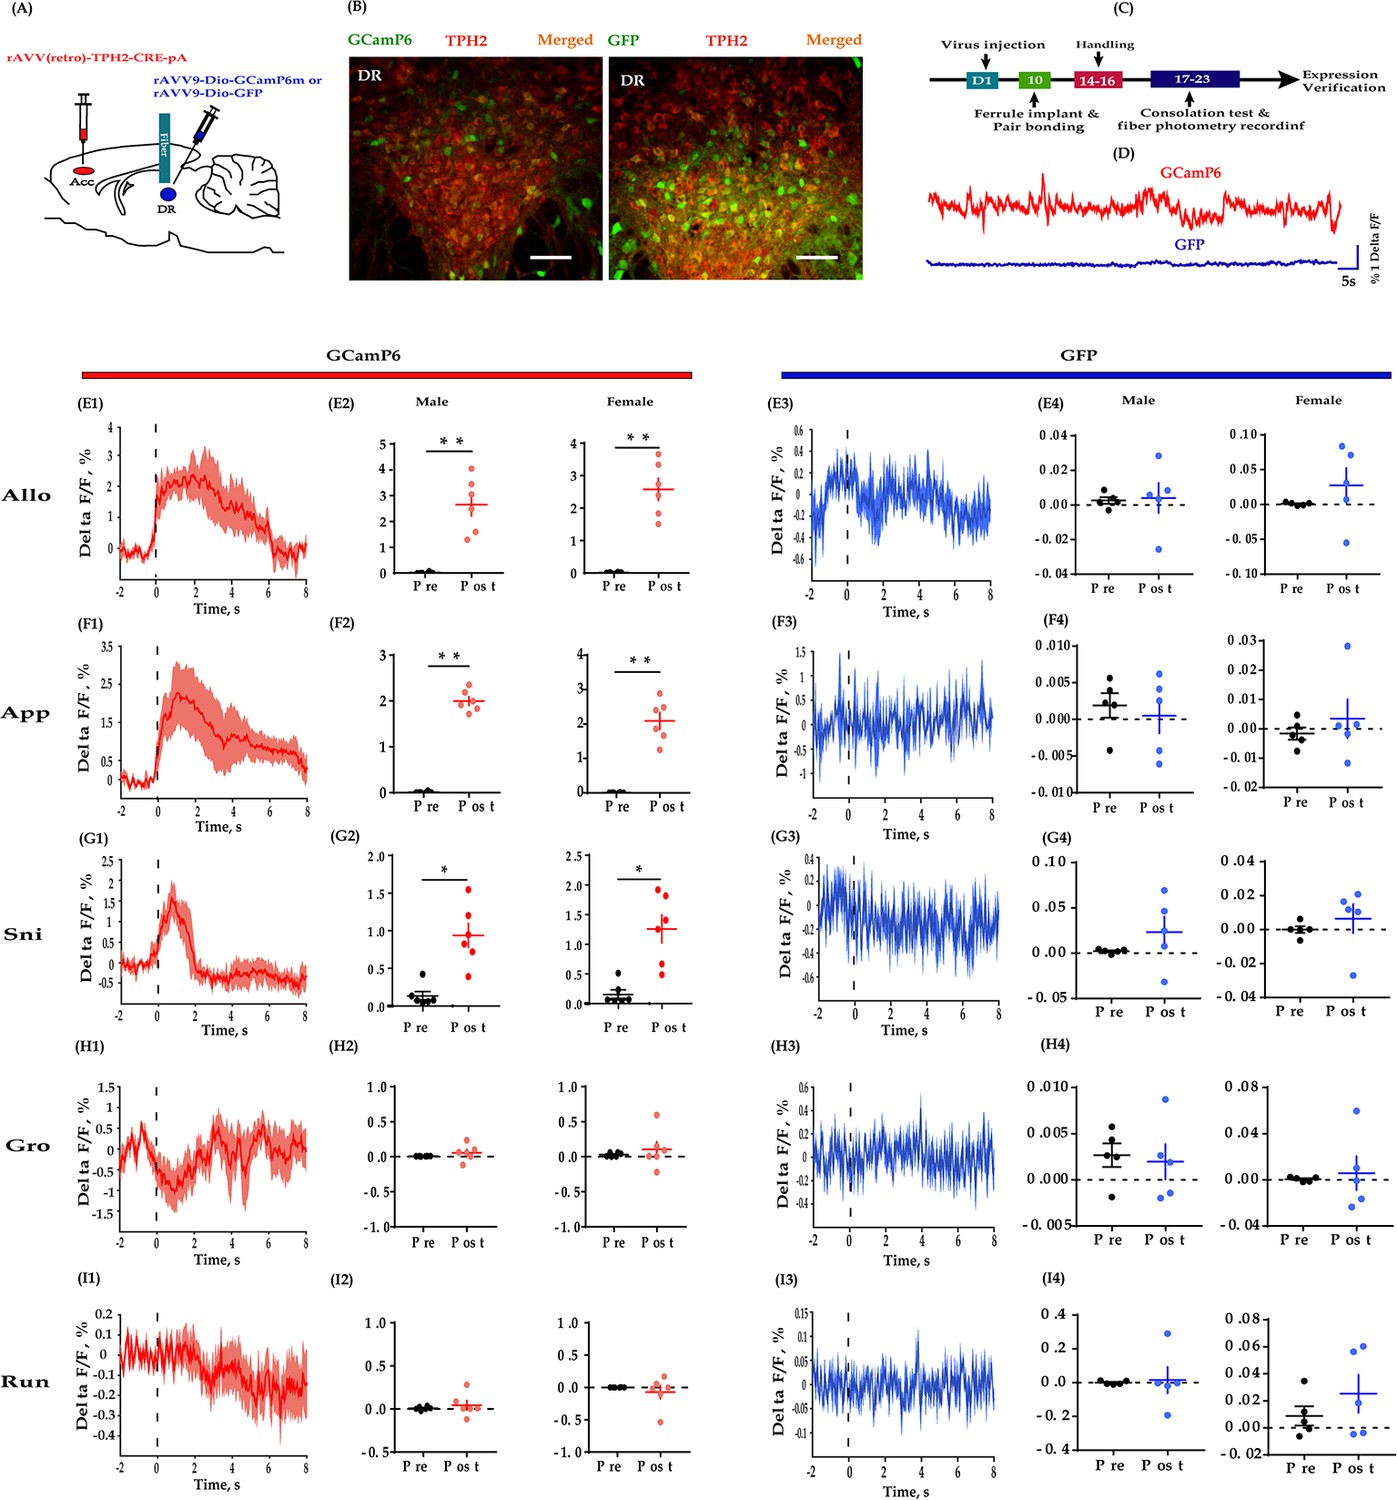
Fiber photometry recording DR 5-HT neural dynamics during the consolation test.
(A) Schematic diagrams depicting the virus injection and recording sites. (B) Histology showing the expression of GCaMP6 (left) and GFP control (right) in the DR. (C) Experimental timeline for photometry experiments. (D) Representative fluorescence changes of GCaMP6 (red line) and GFP (blue line) during photometry recordings. (E1–I1) Representative peri-event plot of GCaMP6 fluorescence signals aligned to onsets of various behaviors (for all peri-event plots, the red line denotes the mean signals of four to six bouts of behaviors, whereas the red shaded region denotes the SEM). (E2) Quantification of change in GCaMP6 fluorescence signals before and after allogrooming (n = 6 in each group; male: t(5) = −5.967, p = 0.002, BF+0 = 24.488 with median posterior δ = −1.904, 95% CI = [−3.749,–0.424]; female: t(5) = −7.420, p<0.01, BF+0 = 52.689 with median posterior δ = −2.397, 95% CI = [−4.610,–0.625]). (F2) Quantification of change in GCaMP6 fluorescence signals before and after approaching (n = 6 in each group; male: t(5) = −19.871, p<0.001, BF+0 = 2233.691; female: t(5) = −8.448, p < 0.001, BF+0 = 84.470 with median posterior δ = −2.747, 95% CI = [−5.225,–0.767]). (G2) Quantification of change in GCaMP6 fluorescence signals before and after sniffing (n = 6 in each group; male: t(5) = −3.689, p = 0.011, BF+0 = 6.449 with median posterior δ = −1.221, 95% CI = [−2.576,–0.138]; female: t(5) = −3.689, p = 0.014, BF+0 = 5.312 with median posterior δ = −1.137, 95% CI = [−2.434,–0.101]). (H2) Quantification of change in GCaMP6 fluorescence signals before and after selfgrooming (n = 6 in each group; male: t(5) = −1.032, p = 0.350, BF+0 = 0.559 with median posterior δ = −0.300, 95% CI = [−1.076, 0.383]; female: t(5) = −0.707, p = 0.511, BF+0 = 0.456 with median posterior δ = −0.205, 95% CI = [−0.904, 0.466]). (I2) Quantification of change in GCaMP6 fluorescence signals before and after running (n = 6 in each group; male: t(5) = −1.032, p = 0.350, BF+0 = 0.559 with median posterior δ = −0.300, 95% CI = [−1.076, 0.383]; female: t(5) = −0.707, p = 0.511, BF+0 = 0.456 with median posterior δ = −0.205, 95% CI = [−0.904, 0.466]). (E3–I3) Representative peri-event plot of GFP signals aligned to onsets of various behavioral events (for all peri-event plots, the blue line denotes the mean signals of four to six bouts of behaviors, whereas the blue shaded region denotes the SE). (E4) Quantification of change in GFP fluorescence signals before and after allogrooming (n = 5 in each group; male: t(4) = −0.145, p = 0.885, BF+0 = 0.401 with median posterior δ = −0.047, 95% CI = [−0.3787, 0.675]; female: t(4) = −1.085, p = 0.339, BF+0 = 0.610 with median posterior δ = −0.32, 95% CI = [−1.198,–0.406]). (F4) Quantification of change in GFP fluorescence signals before and after approaching (n = 5 in each group; male: t(4) = −1.211, p = 0.293, BF+0 = 0.667 with median posterior δ = −0.371, 95% CI = [−1.260, 0.377]; female: t(4) = −0.723, p = 0.510, BF+0 = 0.488 with median posterior δ = −0.220, 95% CI = [−1.026, 0.499]). (G4) Quantification of change in GFP fluorescence signals before and after sniffing (n = 5 in each group; male: t(4) = 1.001, p = 0.373, BF+0 = 0.577 with median posterior δ = 0.306, 95% CI = [−0.427, 1.156]; female: t(4) = −0.687, p = 0.530, BF+0 = 0.479 with median posterior δ = −0.209, 95% CI = [−1.009, 0.510]). (H4) Quantification of change in GFP fluorescence signals before and after selfgrooming (n = 5 in each group; male: t(4) = 0.237, p = 0.825, BF+0 = 0.407 with median posterior δ = 0.072, 95% CI = [−0.647, 0.819]; female: t(4) = −0.350, p = 0.744, BF+0 = 0.418 with median posterior δ = −0.106, 95% CI = [−0.865, 0.610]). (I4) Quantification of change in GFP fluorescence signals before and after running (n = 5 in each group; paired t-test and Bayesian paired samples t-test, two-tailed; male: t(4) = −0.202, p = 0.850, BF+0 = 0.404 with median posterior δ = −0.061, 95% CI = [−0.806, 0.659]; female: t(4) = −1.813, p = 0.144, BF+0 = 52.689 with median posterior δ = 0.560, 95% CI = [−1.580,–0.251]). Error bars are ± SEM. Scale bars, 100 μm. *p<0.05, **p<0.01. Paired samples t-test along with Bayesian paired samples t-test. For raw data in this figure, please refer to Figure 4—source data 1. ACC: anterior cingulate cortex; GFP: green fluorescent protein; TPH2: tryptophan hydroxylase 2; Aq: aqueduct; Allo: allogrooming; Sni: sniffing; App: approaching; Gro: selfgrooming; Run: running; 5-HT: serotonin.
-
Figure 4—source data 1
Source data indicating GCaMP6 and GFP fluorescent signals align to some behaviors.
- https://cdn.elifesciences.org/articles/67638/elife-67638-fig4-data1-v2.xls
Figure 4—figure supplement 1
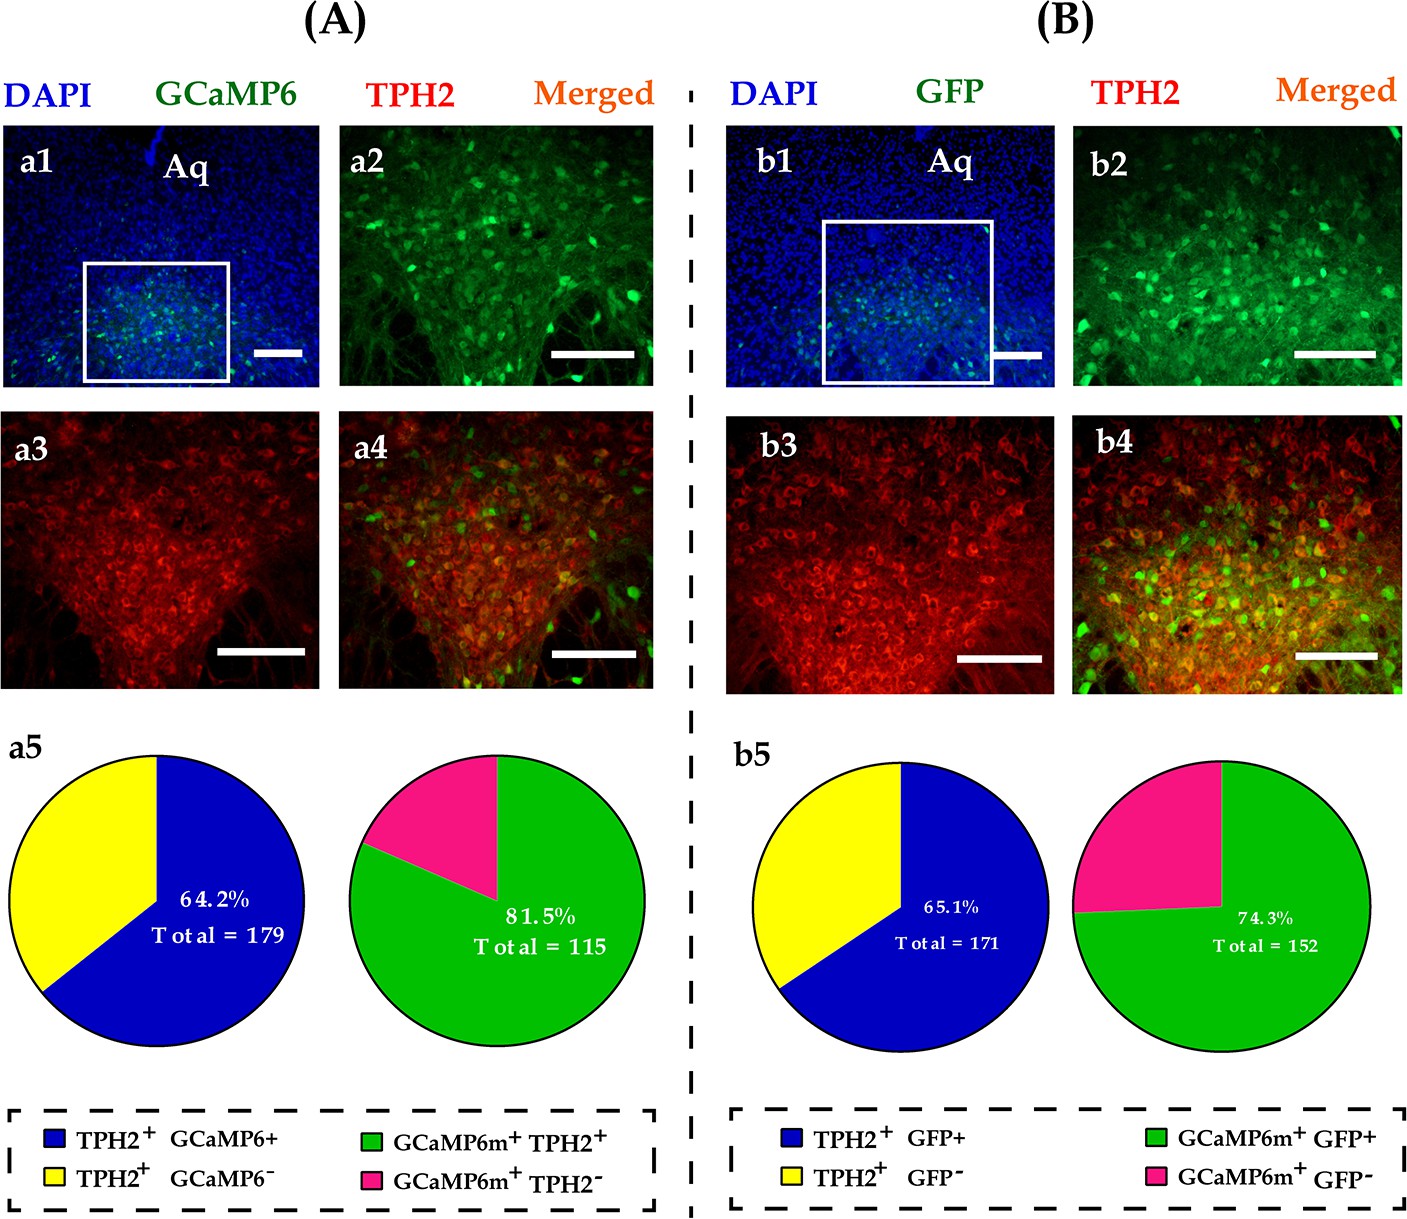
Representative viral infection images of GCaMp6 (A) and virus control of GFP (B).
(a1) Immunohistological image showing GCaMP6 expression in the DR; (a2–a4) amplified images in the left box showing the GCaMP6 (green), TPH2 (red), and the colocalization (yellow) of the two; (a5) quantification rates of GCaMP6 neurons colabeled with TPH2 (left pie) and TPH2 neurons colabeled with GCaMP6 (right pie), N = 3; (b1) immunohistological image showing GFP expression in the DR; (b2–b4) amplified images in the left box showing the GFP (green), TPH2 (red), and the colocalization (yellow) of the two; (b5) quantification rates of GFP neurons colabeled with TPH2 (left pie) and TPH2 neurons colabeled with GFP (right pie), n = 3 in each sex. Scale bars, 100 μm. Aq: aqueduct; DR: dorsal raphe nucleus; TPH2: tryptophan hydroxylase 2; GFP: green fluorescent protein.
Figure 4—figure supplement 2
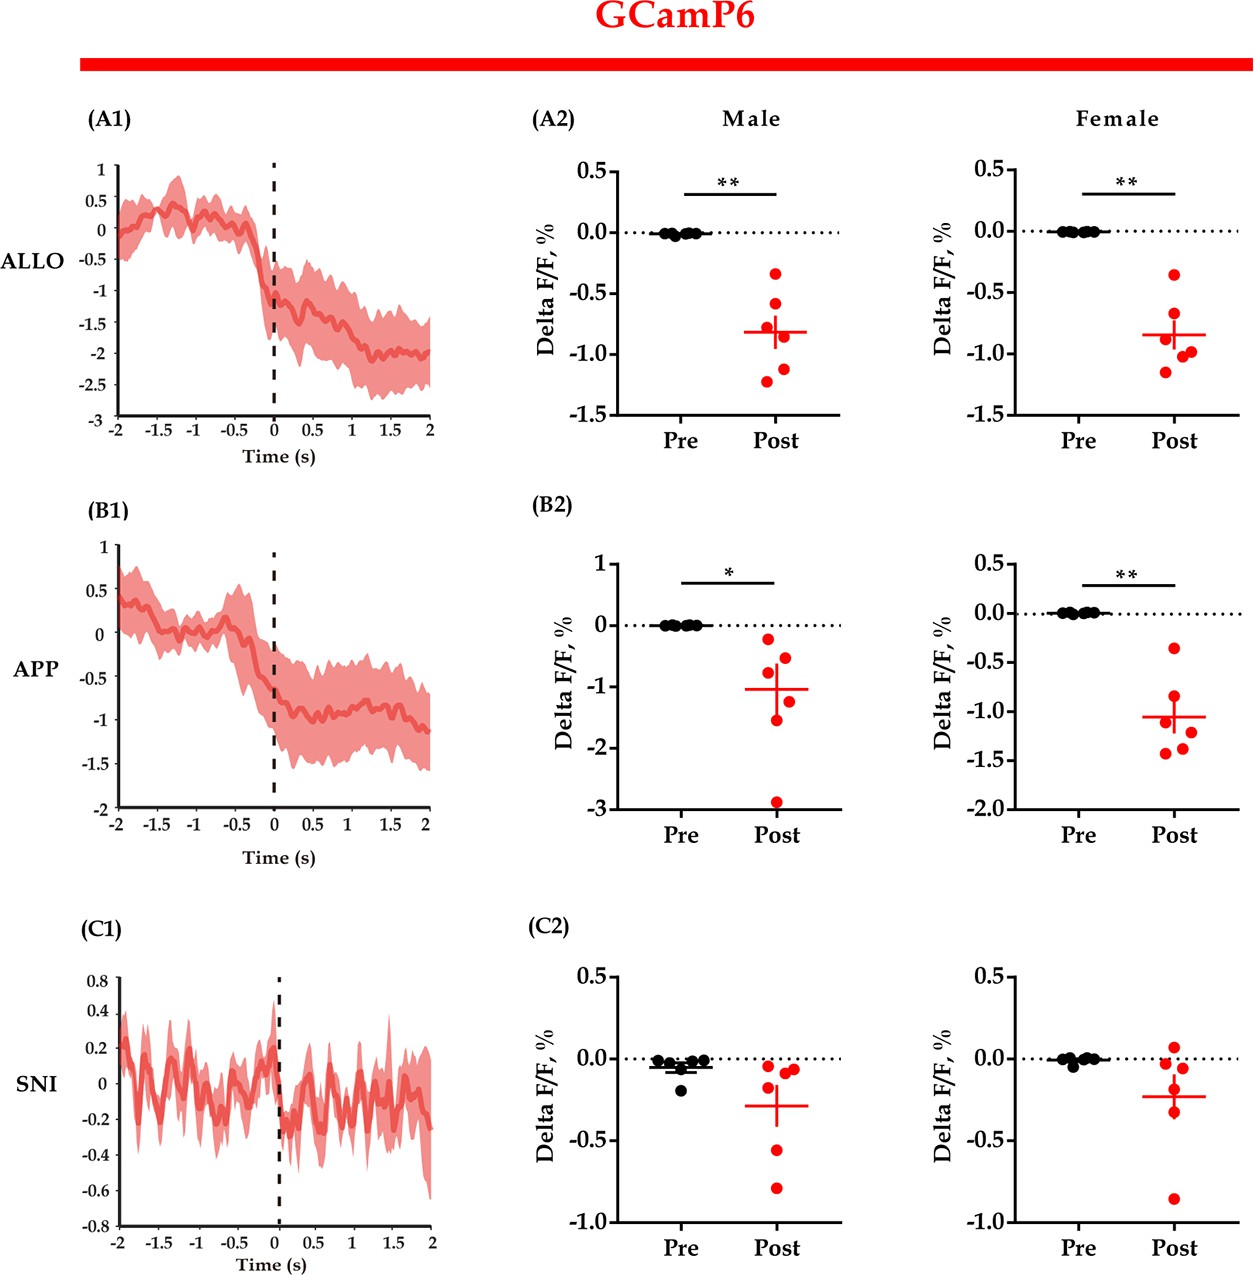
GCaMP6 fluorescent signals align to the end of some behaviors.
(A1, B1, C1) Representative peri-event plot of GCaMP6 fluorescence signals aligned to the end of allogrooming, social approaching, and sniffing (for all peri-event plots, the red line denotes the mean signals of four to six bouts of behaviors, whereas the red shaded region denotes the SE). (A2, B2, C2) Quantification of change in GCaMP6 fluorescence signals (n = 6 in each group; paired t-test and Bayesian paired samples t-test, two-tailed; A2: male: t(5) = 5.984, p<0.001, BF+0 = 49.388 with median posterior δ = 1.912, 95% CI = [0.453, 3.760]; female: t(5) = 7.105, p<0.001, BF+0 = 90.205 with median posterior δ = 2.292, 95% CI = [0.598, 4.424]; B2: male: t(5) = 3.170, p = 0.012, BF+0 = 6.839 with median posterior δ = 0.982, 95% CI = [0.139, 2.153]; female: t(5) = 6.459, p<0.001, BF+0 = 64.386 with median posterior δ = 2.073, 95% CI = [0.514, 4.040]; C2: male: t(5) = 1.611, p = 0.084, BF+0 = 1.589 with median posterior δ = 0.528, 95% CI = [0.041, 1.363]; female: t(5) = 1.724, p = 0.073, BF+0 = 1.778 with median posterior δ = 0.557, 95% CI = [0.046, 1.415]). Data are presented as mean ± SE, *p<0.05, **p<0.01. For raw data, please refer to Figure 4—figure supplement 2—source data 1. ALLO: allogrooming; APP: approaching; SNI: sniffing.
-
Figure 4—figure supplement 2—source data 1
Source data indicating GCaMP6 fluorescent signals align to the end of some behaviors.
- https://cdn.elifesciences.org/articles/67638/elife-67638-fig4-figsupp2-data1-v2.xls
Figure 5 with 2 supplements

Fiber photometry recording dynamics of 5-HT within the ACC during the consolation test.
(A) Schematic diagrams depicting the virus injection and recording sites. (B) Histology showing the expression of 5-HT sensor (left) and GFP control (right) within the ACC. (C) Experimental timeline for photometry experiments. (D) Representative fluorescence changes of 5-HT sensor (red line) and GFP (blue line) during photometry recordings. (E1–I1) Representative peri-event plot of 5-HT fluorescence signals aligned to onsets of various behaviors (for all peri-event plots, the red line denotes the mean signals of four to six bouts of behaviors, whereas the red shaded region denotes the SEM). (E2) Quantification of change in 5-HT fluorescence signals before and after allogrooming (n = 6 in each group; male: t(5) = −6.687, p = 0.001, BF+0 = 36.393 with median posterior δ = −2.148, 95% CI = [−4.174,–0.523]; female: t(5) = −6.038, p = 0.002, BF+0 = 25.495 with median posterior δ = −1.928, 95% CI = [−3.790,–0.433]). (F2) Quantification of change in 5-HT fluorescence signals before and after approaching (n = 6 in each group; male: t(5) = −10.551, p < 0.001, BF+0 = 193.396 with median posterior δ = −3.460, 95% CI = [−6.490,–1.060]; female: t(5) = −6.496, p = 0.001, BF+0 = 32.865 with median posterior δ = −2.083, 95% CI = [−4.061,–0.497]). (G2) Quantification of change in 5-HT fluorescence signals before and after sniffing (n = 6 in each group; male: t(5) = −5.863, p = 0.002, BF+0 = 23.053 with median posterior δ = −1.868, 95% CI = [−3.687,–0.409]; female: t(5) = −3.030, p = 0.029, BF+0 = 3.108 with median posterior δ = −0.921, 95% CI = [−2.070, 0.000]). (H2) Quantification of change in 5-HT fluorescence signals before and after selfgrooming (n = 6 in each group; male: t(5) = −0.215, p = 0.838, BF+0 = 0.381 with median posterior δ = −0.062, 95% CI = [−0.753, 0.609]; female: t(5) = −0.738, p = 0.494, BF+0 = 0.464 with median posterior δ = −0.214, 95% CI = [−0.953, 0.458]). (I2) Quantification of change in 5-HT fluorescence signals before and after running (n = 6 in each group; male: t(5) = −0.627, p = 0.558, BF+0 = 0.438 with median posterior δ = −0.182, 95% CI = [−0.908,–0.488]; female: t(5) = 0.129, p = 0.903, BF+0 = 0.376 with median posterior δ = 0.037, 95% CI = [−0.636, 0.722]). (E3–I3) Representative peri-event plot of GFP signals aligned to onsets of various behavioral events (for all peri-event plots, the blue line denotes the mean signals of four to six bouts of behaviors, whereas the blue shaded region denotes the SE). (E4) Quantification of change in GFP fluorescence signals before and after allogrooming (n = 5 in each group; male: t(4) = 0.082, p = 0.939, BF+0 = 0.399 with median posterior δ = 0.025, 95% CI = [−0.700, 0.760]; female: t(4) = −0.340, p = 0.751, BF+0 = 0.610 with median posterior δ = −0.103, 95% CI = [−0.861,–614]). (F4) Quantification of change in GFP fluorescence signals before and after approaching (n = 5 in each group; male: t(4) = −0.836, p = 0.450, BF+0 = 0.520 with median posterior δ = −0.255, 95% CI = [−1.078, 0.469]; female: t(4) = 0.861, p = 0.438, BF+0 = 0.528 with median posterior δ = 0.263, 95% CI = [−0.462, 1.090]). (G4) Quantification of change in GFP fluorescence signals before and after sniffing (n = 5 in each group; male: t(4) = 2.686, p = 0.055, BF+0 = 2.077 with median posterior δ = 0.843, 95% CI = [−0.104, 2.086]; female: t(4) = 0.208, p = 0.845, BF+0 = 0.405 with median posterior δ = 0.063, 95% CI = [−0.657, 0.808]). (H4) Quantification of change in GFP fluorescence signals before and after selfgrooming (n = 5 in each group; male: t(4) = 0.822, p = 0.457, BF+0 = 0.516 with median posterior δ = 0.251, 95% CI = [−0.473, 1.071]; female: t(4) = 0.653, p = 0.549, BF+0 = 0.471 with median posterior δ = 0.199, 95% CI = [−0.519, 0.994]). (I4) Quantification of change in GFP fluorescence signals before and after running (n = 5 in each group; male: t(4) = 1.415, p = 0.230, BF+0 = 0.777 with median posterior δ = 0.435, 95% CI = [−0.331, 1.366]; female: t(4) = 0.510, p = 0.637, BF+0 = 0.442 with median posterior δ = 0.155, 95% CI = [−0.561, 0.932]). Error bars are ± SEM. Scale bars, 100 μm. *p < 0.05, **p < 0.01; paired samples t-test along with Bayesian paired samples t-test. For raw data in this figure, please refer to Figure 5—source data 1. ACC: anterior cingulate cortex; M: motor cortex; TPH2: tryptophan hydroxylase 2; Allo: allogrooming; Sni: sniffing; App: approaching; Gro: selfgrooming; Run: running; GFP: green fluorescent protein; 5-HT: serotonin.
-
Figure 5—source data 1
Source data indicating 5-HT sensor and GFP fluorescent signals align to some behaviors.
- https://cdn.elifesciences.org/articles/67638/elife-67638-fig5-data1-v2.xls
Figure 5—figure supplement 1
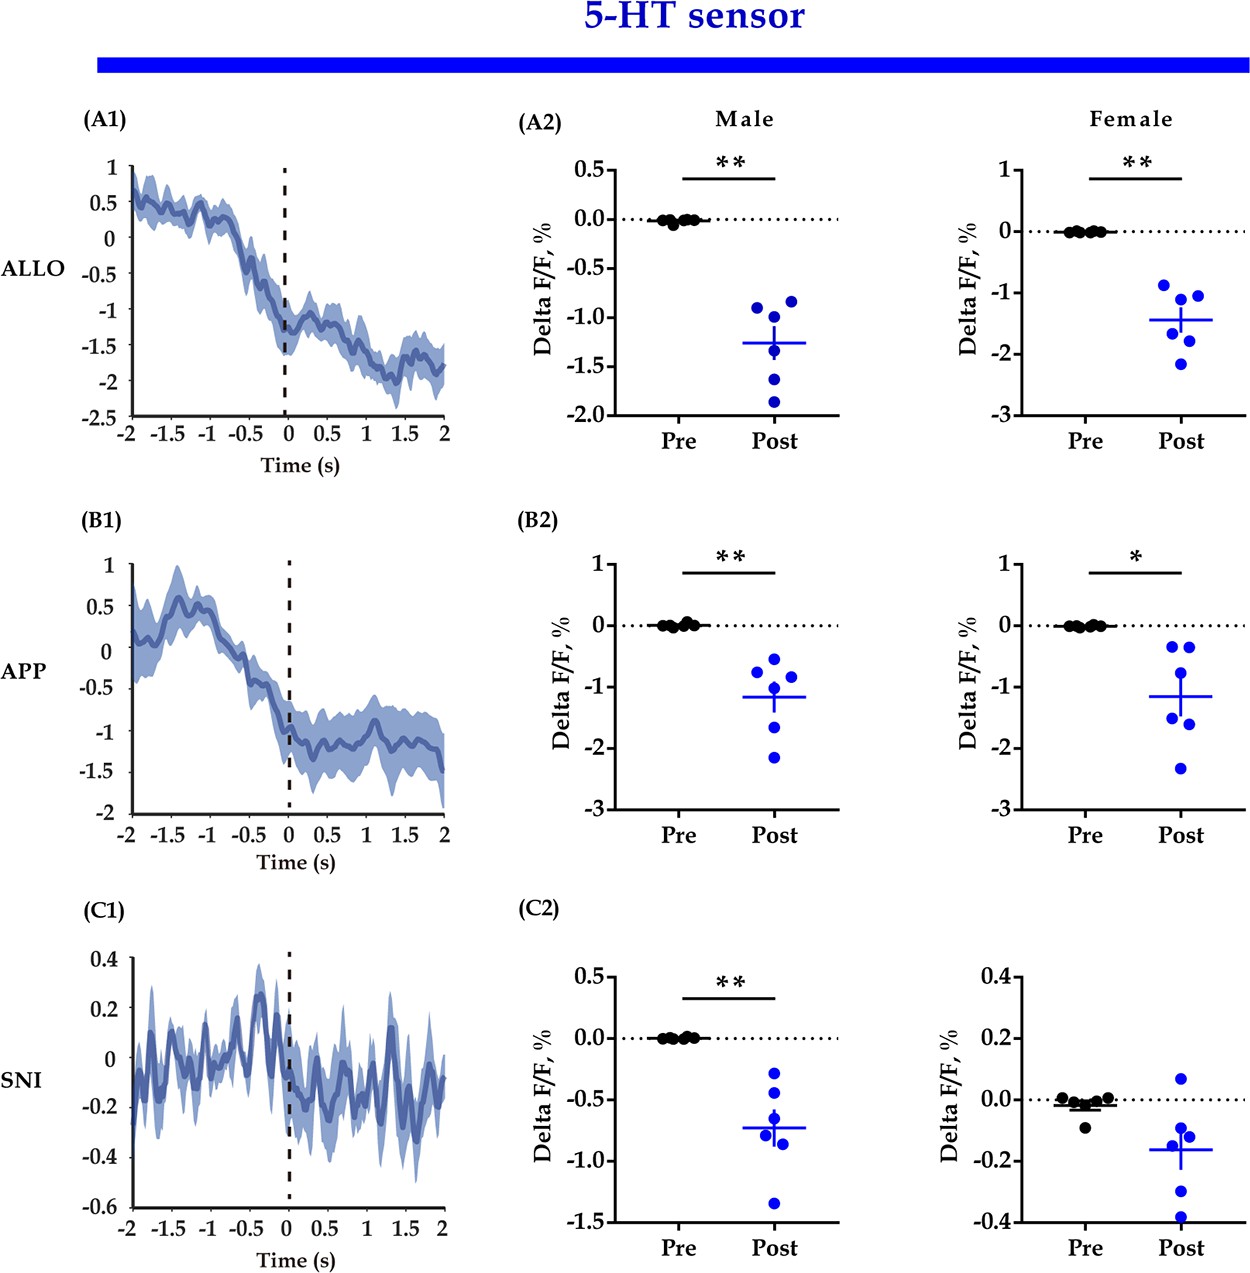
5-HT sensor fluorescent signals align to the end of some behaviors.
(A1, B1, C1) Representative peri-event plot of 5-HT sensor fluorescence signals aligned to the end of allogrooming, social approaching, and sniffing (for all peri-event plots, the blue line denotes the mean signals of four to six bouts of behaviors, whereas the blue shaded region denotes the SE). (A2, B2, C2) Quantification of change in 5-HT sensor fluorescence signals (n = 6 in each group; paired t-test and Bayesian paired samples t-test, two-tailed; A2: male: t(5) = 7.479, p<0.001, BF+0 = 108.402 with median posterior δ = 2.419, 95% CI = [0.648, 4.646]; female: t(5) = 6.994, p<0.001, BF+0 = 6.994 with median posterior δ = 2.255, 95% CI = [0.584, 4.357]; B2: male: t(5) = 4.489, p = 0.003, BF+0 = 19.042 with median posterior δ = 1.411, 95% CI = [0.273, 2.891]; female: t(5) = 3.558, p = 0.008, BF+0 = 9.436 with median posterior δ = 1.106, 95% CI = [0.174, 2.366]; C2: male: t(5) = 4.912, p = 0.002, BF+0 = 25.426 with median posterior δ = 1.552, 95% CI = [0.322, 30134]; female: t(5) = 2.151, p = 0.042, BF+0 = 2.701 with median posterior δ = 0.674, 95% CI = [0.066, 1.620]). Data are presented as mean ± SE, *p<0.05, **p<0.01. For raw data, please refer to Figure 5—figure supplement 1—source data 1. ALLO: allogrooming; APP: approaching; SNI: sniffing; 5-HT: serotonin.
-
Figure 5—figure supplement 1—source data 1
Source data indicating 5-HT sensor fluorescent signals align to the end of some behaviors.
- https://cdn.elifesciences.org/articles/67638/elife-67638-fig5-figsupp1-data1-v2.xls
Figure 5—figure supplement 2
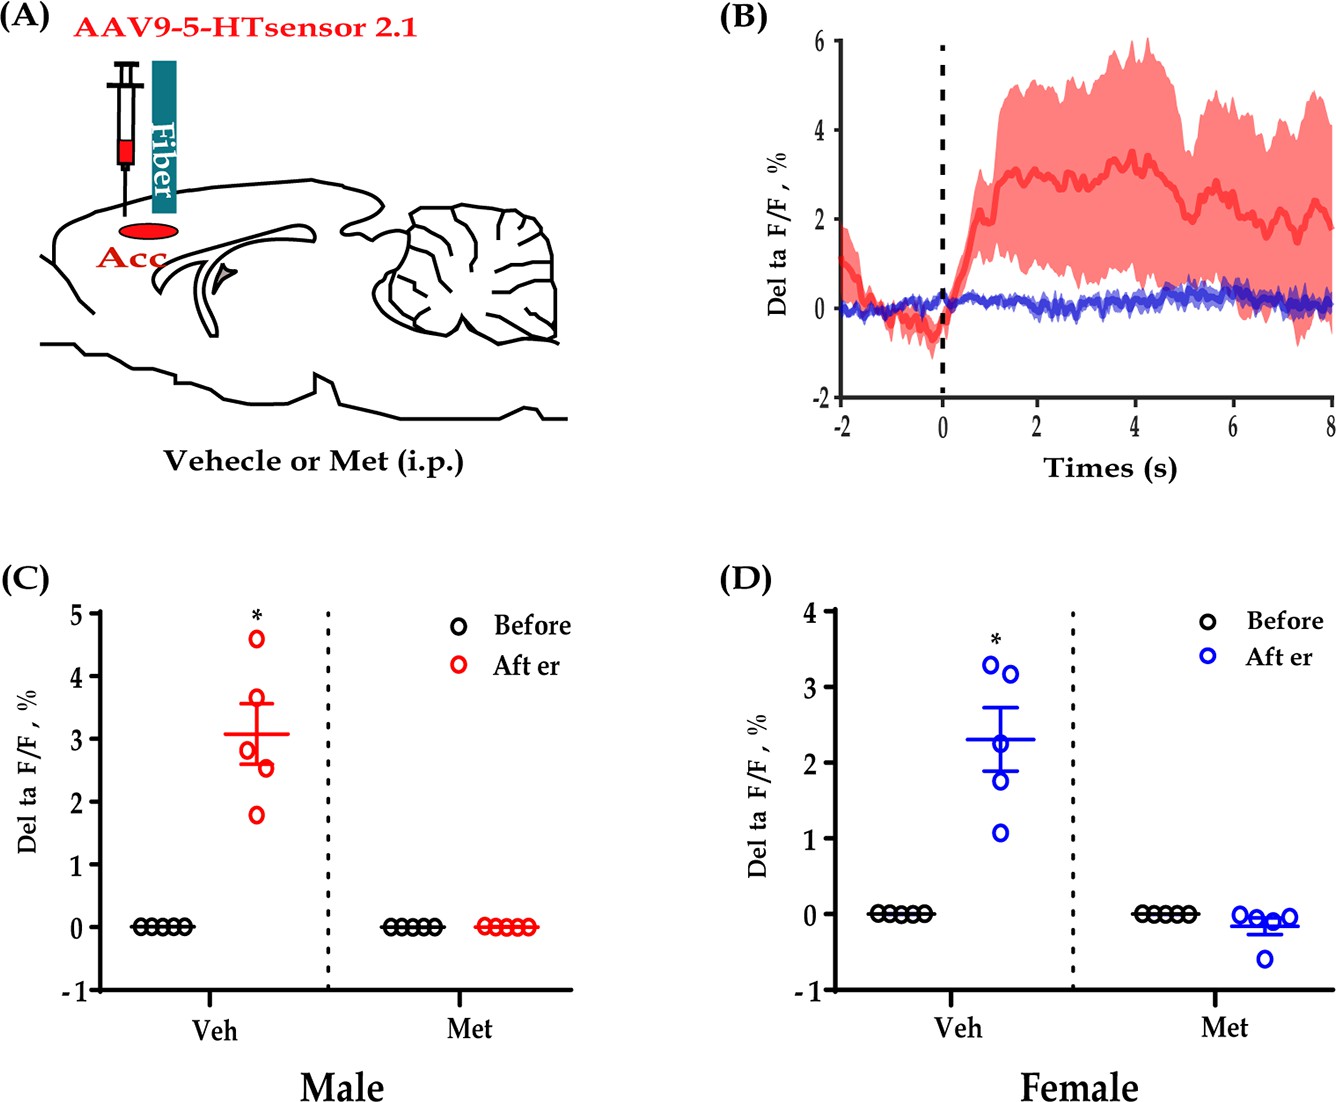
5-HT sensor fluorescence changes during allogrooming could be blocked by Met.
(A) Schematic diagrams. (B) Combined individual 5-HT sensor fluorescence traces during allogrooming in response to Met (blue) or Veh (red). (C) Quantification of 5-HT sensor fluorescence signals during allogrooming in response to Met or Veh in male subjects (time: F(1,8) = 40.556, p<0.001, BF(incl) = 12.206; group: F(1,8) = 40.808, p<0.001, BF(incl) = 3.090; time × group: F(1,8) = 40.427, p<0.001, BF(incl) = 1289.130; post-hoc comparisons: Veh-after vs Veh-before/Met-before/Met-after, all p<0.001; Veh-before vs Met-before vs Met-after, all p>0.05). (D) Quantification of 5-HT sensor fluorescence signals during allogrooming in response to Met or Veh in female subjects (time: F(1,8) = 24.096, p = 0.001, BF(incl) = 5.265; group: F(1,8) = 32.819, p<0.001 BF(incl) = 2.818; time × group: F(1,8) = 31.760, BF(incl) = 477.495; post-hoc comparisons (Tukey): Veh-after vs Veh-before/Met-before/Met-after, all p<0.001; Veh-before vs Met-before vs Met-after, all p>0.05). N = 6 in each group. Two-way repeated measures ANOVA and two-way Bayesian repeated measures ANOVA. Post-hoc comparisons: Tukey. Data are presented as mean ± SE, **p<0.01. For raw data, please refer to Figure 5—figure supplement 2—source data 1. ANOVA: analysis of variance; 5-HT: serotonin; Met: metergoline, a 5-HT receptor antagonist; Veh: vehicle.
-
Figure 5—figure supplement 2—source data 1
Source data indicating 5-HT sensor fluoresce changes during allogrooming could be blocked by Met.
- https://cdn.elifesciences.org/articles/67638/elife-67638-fig5-figsupp2-data1-v2.xls
Figure 6 with 2 supplements
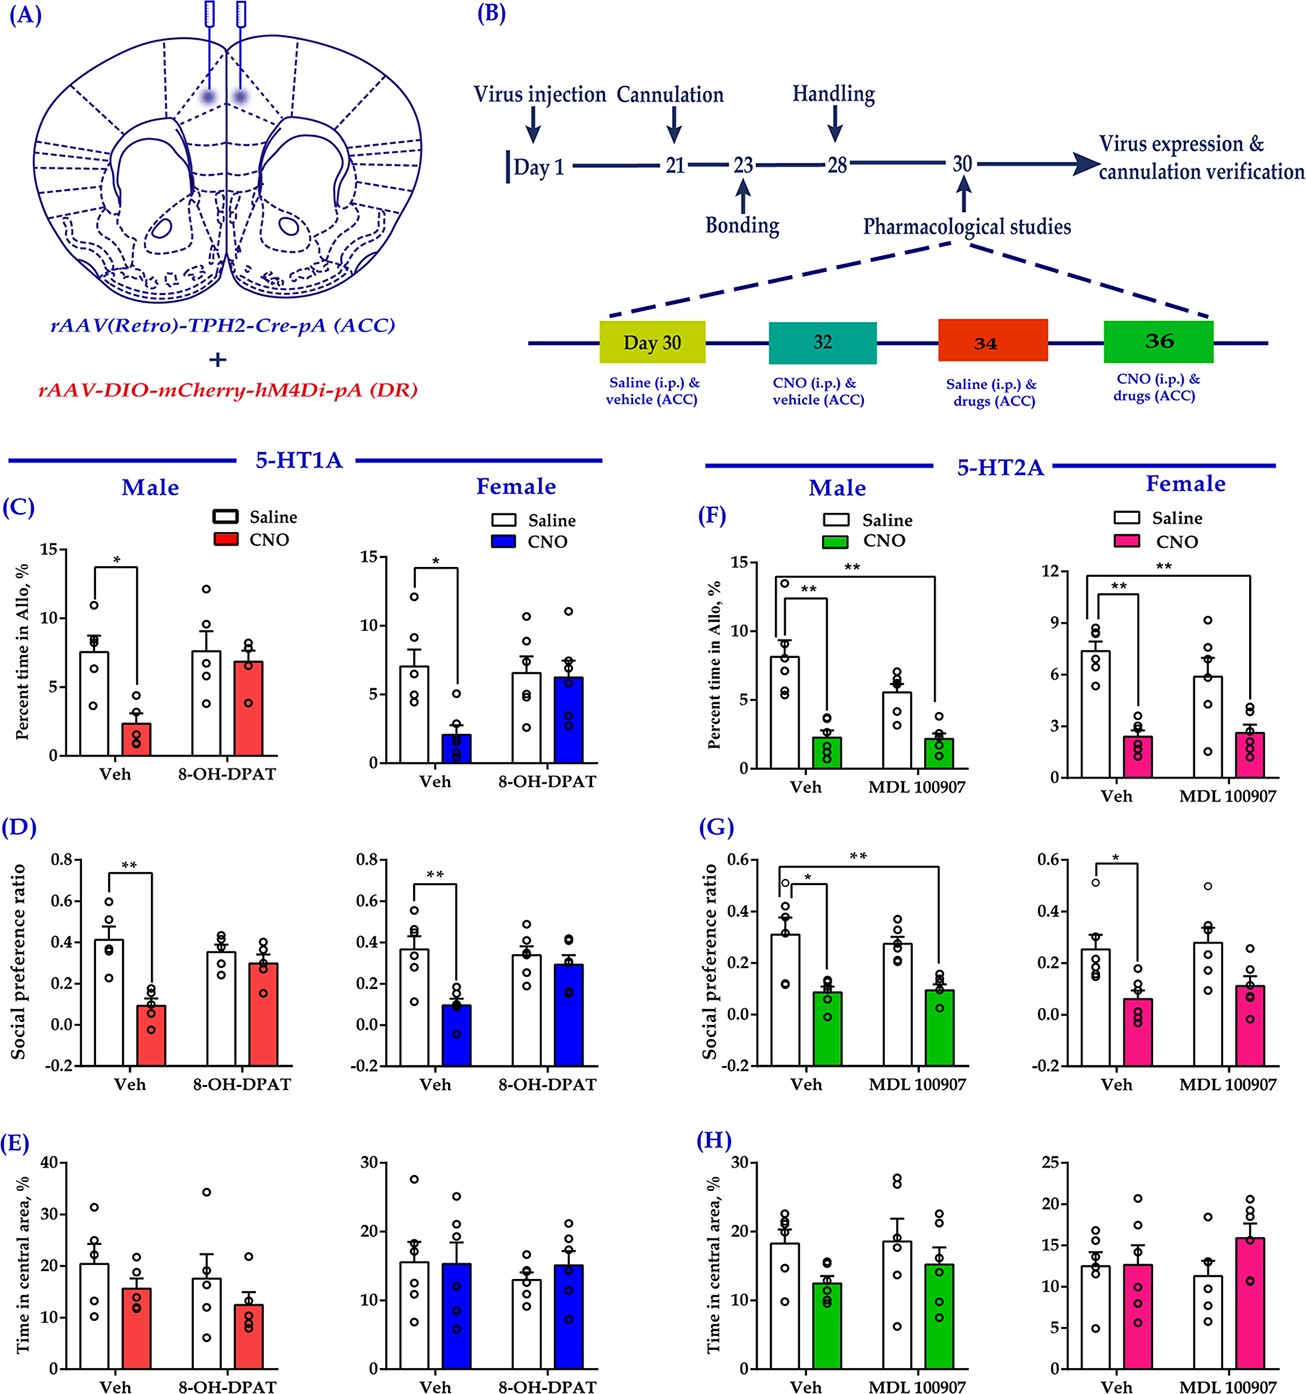
Intra-ACC injection of 8-OH-DPAT reduced sociability deficits induced by chemogenetic inhibition of DR 5-HT neurons in the DR→ACC neural circuit.
(A) Schematic representation of ACC infusion sites and virus strategy. (B) Timeline of experimental design. (C) Effect of a 5-HT1AR agonist 8-OH-DPAT on allogrooming time in the consolation test (n = 5 for male, n = 6 for female; male: treatment 1: F(1,16) = 8.230, p = 0.011, BF(incl) = 3.005; treatment 2: F(1, 16) = 4.926, p = 0.041, BF(incl) = 1.380; treatment 1 × treatment 2: F(1,16) = 4.680, p = 0.046, BF(incl) = 1.737; post-hoc comparisons: Veh + Saline vs Veh + CNO, p = 0.013; Veh + Saline vs 8-OH-DPAT+CNO, p = 0.967; female: treatment 1: F(1, 20) = 5.632, p = 0.028, BF(incl) = 1.911; treatment 2: F(1, 20) = 2.746, p = 0.113, BF(incl) = 0.831; treatment 1 × treatment 2: F(1, 20) = 4.320, p = 0.051, BF(incl) = 1.714; post-hoc comparisons: Veh + Saline vs Veh + CNO, p = 0.024; Veh + Saline vs 8-OH-DPAT+CNO, p = 0.957). (D) Effect of 8-OH-DPAT on social preference ratio in the three-chamber test (n = 5 for male, n = 6 for female; male: treatment 1: F(1,16) = 12.622, p = 0.003, BF(incl) = 3.750; treatment 2: F(1,16) = 4.993, p = 0.040, BF(incl) = 0.987; treatment 1 × treatment 2: F(1,16) = 12.622, p = 0.003, BF(incl) = 10.906; post-hoc comparisons: Veh + Saline vs Veh + CNO, p < 0.001; Veh + Saline vs 8-OH-DPAT+CNO, p = 0.788; female: treatment 1: F(1, 20) = 10.820, p = 0.004, BF(incl)=6.321; treatment 2: F(1, 20) = 3.075, p = 0.095, BF(incl) = 0.858; treatment 1 × treatment 2: F(1, 20) = 5.437, p = 0.030, BF(incl) = 2.347; post-hoc comparisons: Veh + Saline vs Veh + CNO, p = 0.004; Veh + Saline vs 8-OH-DPAT + CNO, p = 0.702). (E) Effect of 8-OH-DPAT on time spent in the central area in the open-field test (n = 5 for male, n = 6 for female; male: treatment 1: F(1,16) = 2.063, p = 0.170, BF(incl) = 0.854; treatment 2: F(1,16) = 0.759, p = 0.396, BF(incl) = 0.523; treatment 1 × treatment 2: F(1,16) = 0.003, p = 0.960, BF(incl) = 0.498; female: treatment 1: F(1, 20) = 0.144, p = 0.708, BF(incl) = 0.393; treatment 2: F(1, 20) = 0.324, p = 0.575, BF(incl) = 0.422; treatment 1 × treatment 2: F(1, 20) = 0.227, p = 0.639, BF(incl) = 0.494). (F) Effect of a 5-HT2AR antagonist (MDL 100907) on allogrooming time in the consolation test (n = 6 in each group; male: treatment 1: F(1, 20) = 37.118, p < 0.001, BF(incl) = 1591.039; treatment 2: F(1, 20) = 3.094, p = 0.094, BF(incl) = 0.940; treatment 1 × treatment 2: F(1, 20) = 2.697, p = 0.116, BF(incl) = 1.101; post-hoc comparisons: Veh + Saline vs Veh + CNO, p < 0.001; Veh + Saline vs MDL 100907 + CNO, p<0.001; female: treatment 1: F(1, 20) = 36.168, p<0.001, BF(incl) = 2649.973; treatment 2: F(1, 20) = 0.860, p = 0.365, BF(incl) = 0.484; treatment 1 × treatment 2: F(1, 20) = 1.554, p = 0.227, BF(incl) = 0.780; post-hoc comparisons: Veh + Saline vs Veh + CNO, p<0.001; Veh + Saline vs MDL 100907 + CNO, p < 0.001). (G) Effect of MDL 100907 on social preference ratio in the three-chamber test (n = 6 in each group; male: treatment 1: F(1, 20) = 26.890, p<0.001, BF(incl) = 771.577; treatment 2: F(1, 20) = 0.124, p = 0.729, BF(incl) = 0.386; treatment 1 × treatment 2: F(1, 20) = 0.316, p = 0.580, BF(incl) = 0.496; post-hoc comparisons: Veh + Saline vs Veh + CNO, p = 0.003; Veh + Saline vs MDL 100907 + CNO, p = 0.004; female: treatment 1: F(1, 20) = 13.991, p = 0.001, BF(incl) = 34.866; treatment 2: F(1, 20) = 0.620, p = 0.440, BF(incl) = 0.443; treatment 1 × treatment 2: F(1, 20) = 0.071, p = 0.793, BF(incl) = 0.500; post-hoc comparisons: Veh + Saline vs Veh + CNO, p = 0.047; Veh + Saline vs MDL 100907 + CNO, p = 0.191). (H) Effect of MDL 100907 on time spent in the central area in the open-field test (n = 6 in each group; male: treatment 1: F(1, 20) = 3.702, p = 0.069, BF(incl) = 1.469; treatment 2: F(1, 20) = 0.415, p = 0.527, BF(incl) = 0.429; treatment 1 × treatment 2: F(1, 20) = 0.270, p = 0.609, BF(incl) = 0.520; female: treatment 1: F(1, 20) = 1.506, p = 0.234, BF(incl) = 0.655; treatment 2: F(1, 20) = 0.274, p = 0.606, BF(incl) = 0.417; treatment 1 × treatment 2: F(1, 20) = 1.305, p = 0.267, BF(incl) = 0.698). Two-way ANOVA along with two-way Bayesian ANOVA. Error bars are ± SEM. *p < 0.05, **p < 0.01. For raw data in this figure, please refer to Figure 6—source data 1. Anta: antangonist; ACC: anterior cingulate cortex; ANOVA: analysis of variance; DR: dorsal raphe nucleus; 5-HT: serotonin.
-
Figure 6—source data 1
Source data indicating 8-OH-DPAT but not MDL 100907 reduced sociability deficits induced by chemogenetic inhibition of DR 5-HT neurons in the DR→ACC neural circuit.
- https://cdn.elifesciences.org/articles/67638/elife-67638-fig6-data1-v2.xls
Figure 6—figure supplement 1
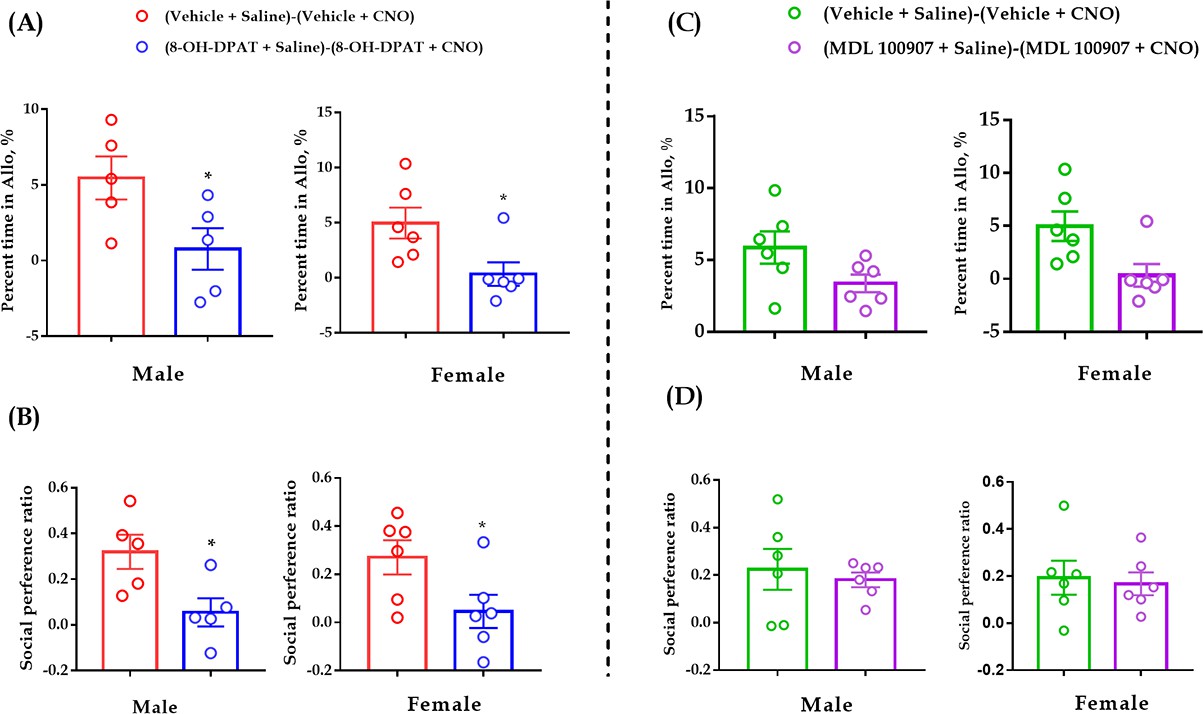
Comparisons of ‘Vehicle + Saline - Vehicle + CNO’ vs ‘8-OH-DPAT + Saline - 8-OH-DPAT + CNO’ (A and B) and ‘Vehicle + Saline - Vehicle + CNO’ vs ‘MDL 100907 + Saline MDL 100907 + CNO’ (C and D).
(A) Male: N = 5 in each group. (Vehicle + Saline)-(Vehicle + CNO) vs (8-OH-DPAT+Saline)-(8-OH-DPAT+CNO): t(8) = 2.375, p = 0.045, BF+0 = 3.750 with median posterior δ = 0.999, 95% CI = [0.091 to 2.493]. Female: N = 6 in each group. (Vehicle + Saline)-(Vehicle + CNO) vs (8-OH-DPAT+Saline)-(8-OH-DPAT+CNO): t(10) = 2.639, p = 0.025, BF+0 = 5.482 with median posterior δ = 1.075, 95% CI = [0.123 to 2.453]. (B) Male: N = 5 in each group. (Vehicle + Saline)-(Vehicle + CNO) vs (8-OH-DPAT+Saline)-(8-OH-DPAT+CNO): t(8) = 2.727, p = 0.026, BF+0 = 5.368 with median posterior δ = 1.174, 95% CI = [0.123 to 2.767]. Female: N = 6 in each group. (Vehicle + Saline)-(Vehicle + CNO) vs (8-OH-DPAT+Saline)-(8-OH-DPAT+CNO): t(10) = 2.273, p = 0.046, BF+0 = 3.609 with median posterior δ = 0.906, 95% CI = [0.087 to 2.203]. (C) Male: N = 6 in each group. (Vehicle + Saline)-(Vehicle + CNO) vs (MDL 100907 + Saline)-(MDL 100907 + CNO): t(10) = 1.935, p = 0.082, BF+0 = 2.487 with median posterior δ = 0.766, 95% CI = [0.063 to 1.981]. Female: N = 6 in each group. (Vehicle + Saline)-(Vehicle + CNO) vs (MDL 100907 + Saline)-(MDL 100907 + CNO): t(10) = 1.092, p = 0.300, BF+0 = 1.076 with median posterior δ = 0.491, 95% CI = [0.029 to 1.492]. (D) Male: N = 6 in each group. (Vehicle + Saline)-(Vehicle + CNO) vs (MDL 100907 + Saline)-(MDL 100907 + CNO): t(10) = 0.481, p = 0.641, BF+0 = 0.648 with median posterior δ = 0.357, 95% CI = [0.018 to 1.210]. Female: (Vehicle + Saline)-(Vehicle + CNO) vs (MDL 100907 + Saline)-(MDL 100907 + CNO): t(10) = 0.295, p = 0.774, BF+0 = 0.567 with median posterior δ = 0.325, 95% CI = [0.016 to 1.138]. Independent samples t-test. Data are presented as mean ± SE, *p < 0.05. For raw data, please refer to Figure 6—figure supplement 1—source data 1.
-
Figure 6—figure supplement 1—source data 1
Source data indicating pretreatment with 8-OH-DPAT but not MDL 100907 significantly reduced the impact of CNO.
- https://cdn.elifesciences.org/articles/67638/elife-67638-fig6-figsupp1-data1-v2.xls
Figure 6—figure supplement 2
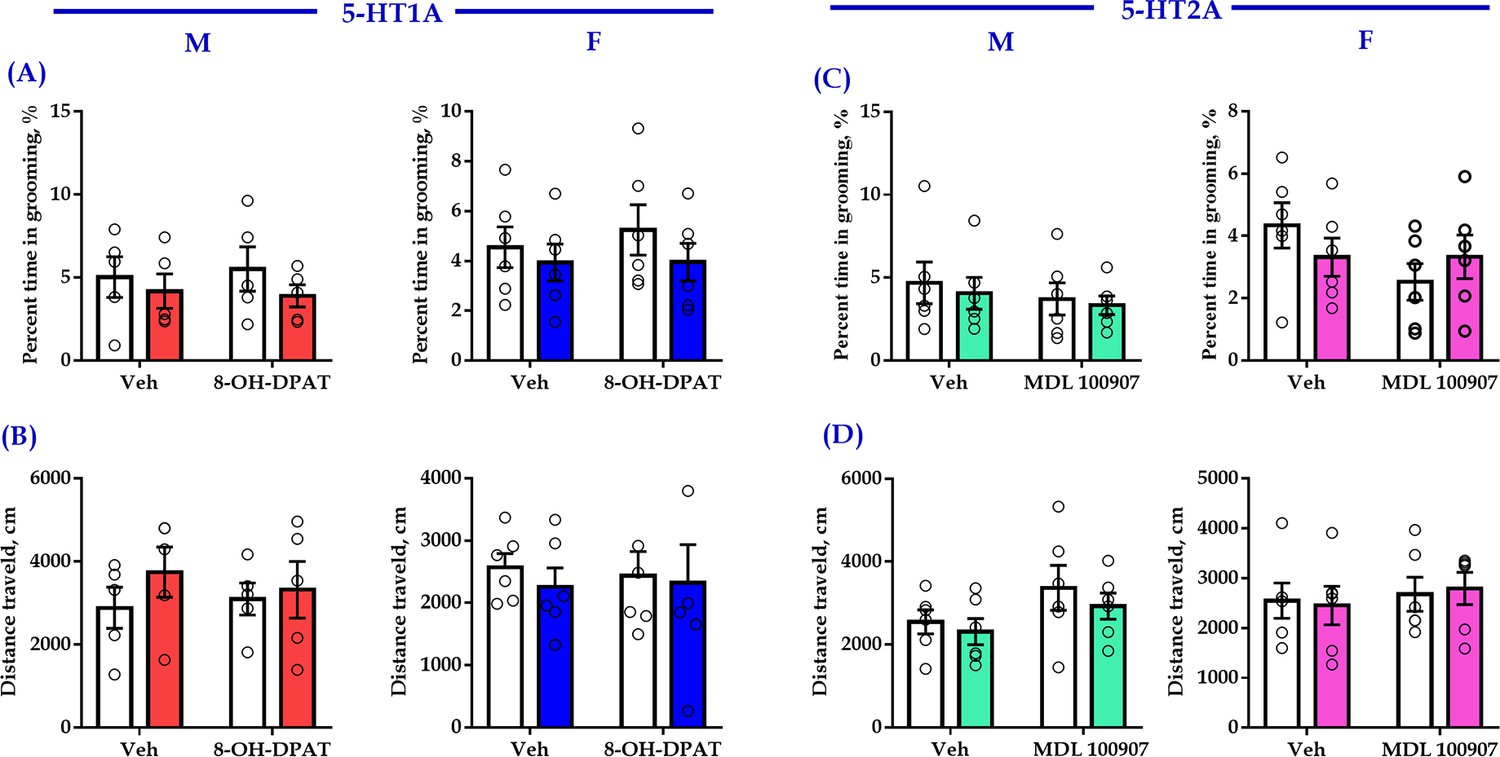
Chemogenetic inhibition of DR 5-HT neuron in the DR-ACC neural circuit along with intra-ACC.
Injection of 5-HT1AR agonist (8-OH-DPAT) or 5-HT2AR antagonist (MDL 100907) had no significant effect on control behaviors of selfgrooming (A, C) and distance traveled in the open-field test (B, D). (A) Male: N = 5 in each group. Treatment 1: F(1,16) = 1.266, p = 0.277, BF(incl) = 0.642; treatment 2: F(1,16) = 0.009, p = 0.926, BF(incl) = 0.393; treatment 1 × treatment 2: F(1,16) = 0.126, p = 0.728, BF(incl)=0.535. Female: N = 6 in each group. Treatment 1: F(1,20) = 1.292, p = 0.269, BF(incl) = 0.616; treatment 2: F(1,20) = 0.184, p = 0.673, BF(incl) = 0.399; treatment 1 × treatment 2: F(1,20) = 0.165, p = 0.689, BF(incl) = 0.502. (B) Male: N = 5 in each group. Treatment 1: F(1,16) = 0.964, p = 0.341, BF(incl) = 0.580; treatment 2: F(1,16) = 0.037, p = 0.849, BF(incl) = 0.407; treatment 1 × treatment 2: F(1,16) = 0.329, p = 0.574, BF(incl) = 0.543. Female: N = 6 in each group. Treatment 1: F(1,20) = 0.121, p = 0.732, BF(incl) = 0.391; treatment 2: F(1,20) = 0.017, p = 0.897, BF(incl) = 0.375; treatment 1 × treatment 2: F(1,20) = 0.238, p = 0.631, BF(incl) = 0.498. (C) Male: N = 6 in each group. Treatment 1: F(1,20) = 0.272, p = 0.608, BF(incl) = 0.416; treatment 2: F(1,20) = 0.758, p = 0.394, BF(incl) = 0.504; treatment 1 × treatment 2: F(1,20) = 0.017, p = 0.897, BF(incl) = 0.444. Female: N = 6 in each group. Treatment 1: F(1,20) = 0.026, p = 0.874, BF(incl) = 0.377; treatment 2: F(1,20) = 1.861, p = 0.188, BF(incl) = 0.728; treatment 1 × treatment 2: F(1,20) = 1.904, p = 0.183, BF(incl) = 0.855. (D) Male: N = 6 in each group. Treatment 1: F(1,20) = 0.794, p = 0.384, BF(incl)=0.502; treatment 2: F(1,20) = 3.562, p = 0.074, BF(incl) = 1.404; treatment 1 × treatment 2: F(1,20) = 0.075, p = 0.788, BF(incl)=0.477. Female: N = 6 in each group. Treatment 1: F(1,20) = 6.695e−4, p = 0.980, BF(incl) = 0.375; treatment 2: F(1,20) = 0.453, p = 0.508, BF(incl) = 0.449; treatment 1 × treatment 2: F(1,20) = 0.089, p = 0.768, BF(incl) = 0.462. Data are presented as mean ± SE. Two-way ANOVA and two-way Bayesian ANOVA. Post-hoc comparisons: Tukey. For raw data, please refer to Figure 6—figure supplement 2—source data 1. ACC: anterior cingulate cortex; DR: dorsal raphe nucleus; M: male; F: female; 5-HT, serotonin.
-
Figure 6—figure supplement 2—source data 1
Source data indicating the treatments had no significant effect on control behaviors of selfgrooming and the distance traveled in the open-field test.
- https://cdn.elifesciences.org/articles/67638/elife-67638-fig6-figsupp2-data1-v2.xls
Tables
Key resources table
| Reagent type (species) or resource | Designation | Source or reference | Identifiers | Additional information |
|---|---|---|---|---|
| Antibody | Anti-TPH2 (goat polyclonal antibody) | Abcam | ab121013; RRID:AB_10898794 | IF (1/500) |
| Antibody | Alexa Fluor 488-AffiniPure Donkey Anti-Goat IgG (H + L) | Jackson | 705-545-147 RRID:AB_2336933 | IF (1/300) |
| Antibody | Rhodamine (TRITC)-AffiniPure Donkey Anti-Goat IgG (H + L) | Jackson | 705-025-003 RRID:AB_2340388 | IF (1/300) |
| Chemical compound, drug | 8-OH-DPAT | Sigma | H8520 | Injection site: ACC; volume: 200 nl/side; concentration:1.5 mg/ml |
| Chemical compound, drug | MDL 100907 | Tocris Bioscience | Cat# 4173 | Injection site: ACC; volume:200 nl/side; concentration:1 mg/ml |
| Chemical compound, drug | Metergoline | MedChemExpress | Cat# HY-B1033/CS-4551 | 4 mg/kg, i.p. |
| Chemical compound, drug | CNO | BrainVTA | Cat# CNO-02 | 1 mg/kg, i.p. |
| Chemical compound, drug | Cholera Toxin Subunit B (CTB)594 | Thermo Fisher | Cat# C34777 | Injection site: ACC; volume:400 nl/side; expression: 10 days |
| Transfected construct (human) | rAAV(Retro)-TPH2-Cre-WPRE-pA | BrainVTA | R-396-K181127 | Serotype: AAV2; titer: 5.86 × 10¹² vg/ml; injection site: ACC; volume: 300 nl/side |
| Transfected construct (human) | rAAV-Ef1α-DIO-ChR2-mCherry-WPRE-pA | BrainVTA | 9–2 K190827 | Serotype: AAV2/9; titer: 2.01 × 10¹² vg/ml; injection site: DR; volume: 500 nl |
| Transfected construct (human) | rAAV-Ef1α-DIO-eNpHR3.0-mCherry-WPRE-pA | BrainVTA | rAAV9-7-5-1 | Serotype: AAV2/9; titer: 2.23 × 10¹² vg/ml; injection site: DR; volume: 500 nl |
| Transfected construct (human) | rAAV-Ef1α-DIO-mCherry-WPRE-pA | BrainVTA | 9–13 K190430 | Serotype: AAV2/9; titer: 2.02 × 10¹² vg/ml; injection site: DR; volume: 500 nl |
| Transfected construct (human) | rAAV-Ef1α-DIO-hM4Di(Gi)-mCherry-WPRE-pA | BrainVTA | 9–43 K190521 | Serotype: AAV2/9; titer: 2.09 × 10¹² vg/ml; injection site: DR; volume: 500 nl |
| Transfected construct (human) | rAAV-Ef1α-DIO-hM4Dq(Gq)-mCherry-WPRE-pA | BrainVTA | 9–42 K190530 | Serotype: AAV2/9; titer: 2.70 × 10¹² vg/ml; injection site: DR; volume: 500 nl |
| Transfected construct (human) | rAAV-hSyn-5HT2.1-WPRE-hGHpA (5-HT sensor) | BrainVTA | 9–1826 K190620 | Serotype: AAV2/9; titer: 2.53 × 10¹² vg/ml; injection site: ACC; volume: 400 nl |
| Transfected construct (human) | rAAV-hSyn-EGFP-WPRE-hGH-pA | BrainVTA | PT-1990 | Serotype: AAV2/9; titer: 2.00 × 10¹² vg/ml; injection site: ACC; volume: 400 nl |
| Transfected construct (human) | rAAV-EF1α-DIO-GCaMp6-WPRE-hGH pA | BrainVTA | PT-0071 | Serotype: AAV2/9; titer: 5.15 × 10¹² vg/ml; injection site: DR; volume: 500 nl |
| Transfected construct (human) | rAAV-hSyn-DIO-EGFP-WPRE-hGH-PA | BrainVTA | 9–1103 K200409 | Serotype: AAV2/9; titer: 2.00 × 10¹² vg/ml; injection site: DR; volume: 500 nl |
| Software, algorithm | JASP | JASP | RRID:SCR_015823 | |
| Other | DAPI stain | Boster | AR1177 | 1 µg/ml |
Additional files
Download links
A two-part list of links to download the article, or parts of the article, in various formats.
Downloads (link to download the article as PDF)
Open citations (links to open the citations from this article in various online reference manager services)
Cite this article (links to download the citations from this article in formats compatible with various reference manager tools)
Dorsal raphe nucleus to anterior cingulate cortex 5-HTergic neural circuit modulates consolation and sociability
eLife 10:e67638.
https://doi.org/10.7554/eLife.67638


