Lipoprotein DolP supports proper folding of BamA in the bacterial outer membrane promoting fitness upon envelope stress
- Laboratoire de Microbiologie et Génétique Moléculaires (LMGM), Centre de Biologie Intégrative (CBI), Université de Toulouse, CNRS, UPS, France
- Synthetic Biology Group, Microbiology Department, Institut Pasteur, France
- Institut de Pharmacologie et de Biologie Structurale (IPBS), Université de Toulouse, CNRS, UPS, France
Figures
Figure 1 with 2 supplements

Genome-wide screen of dolP genetic interactions.
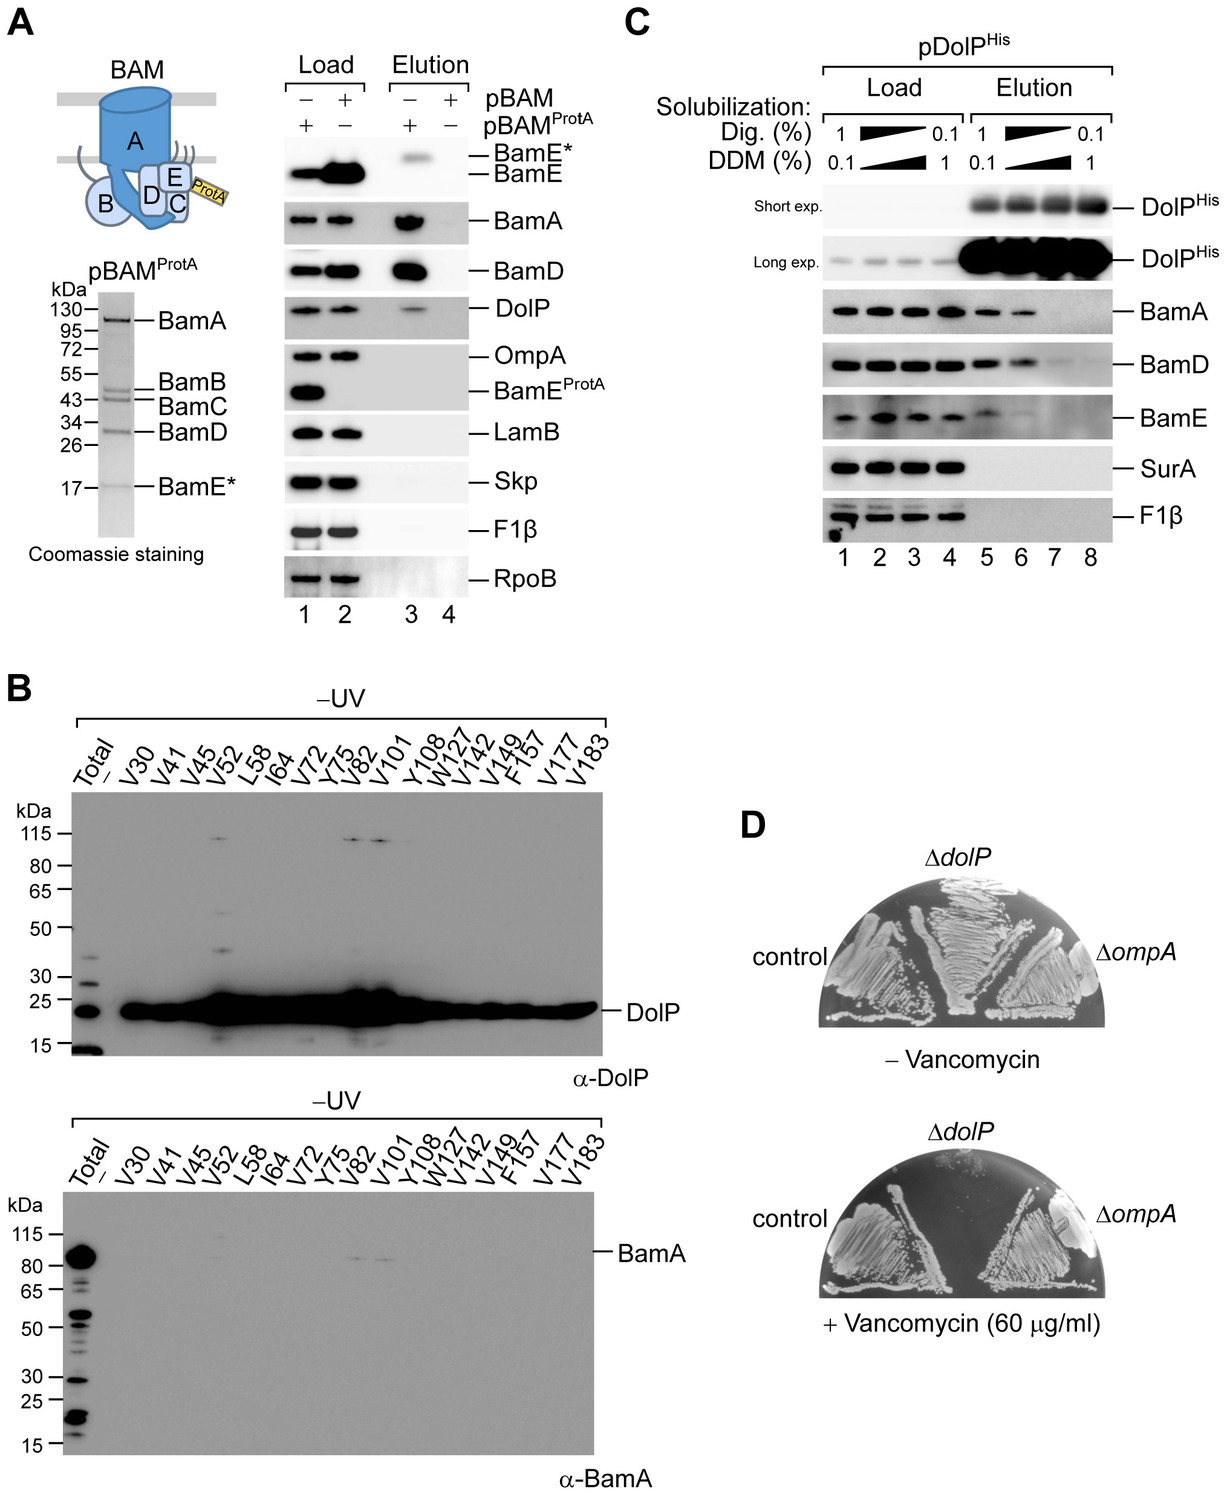
(A) The deletion of dolP impairs OM integrity. The indicated strains were serially diluted and spotted onto LB agar plates lacking or supplemented with 60 μg/ml vancomycin as indicated. (B) Schematic representation of the CRISPR-based gene silencing approach. LC-E75 (dolP+) or its ΔdolP derivative strain, both carrying dcas9 under the control of an anhydrotetracycline (aTc)-inducible promoter in their chromosome were transformed with a library of plasmids encoding gene-specific sgRNAs. The library covers any E. coli MG1655 genetic features with an average of five sgRNAs per gene. Pooled transformed cells were cultured to early exponential phase prior to plasmid extraction and quantitative Illumina sequencing to assess the initial distribution of sgRNA constructs in each culture (tstart). Upon addition of 1 μM aTc to induce sgRNA-mediated targeting of dcas9 for approximately 17 generations, samples of cells from each culture were newly subjected to plasmid extraction and Illumina sequencing to determine the final distribution of sgRNA constructs (tend). (C) Left: Comparison of gene scores obtained in dolP+ and ΔdolP screens. The log2 fold-change (log2FC) between tend and tstart calculated for each sgRNAs (Figure 1—figure supplement 2B) was grouped by gene target, and their median was used to derive fitness gene scores (see also Figure 1—source data 1 and 2). Right: Volcano plot of the dolP genetic interaction scores. The x-axis shows a genetic interaction score calculated for each gene based on the minimum hypergeometric (mHG) test conducted on the ranked difference of sgRNA-specific log2FC values between the ΔdolP and the dolP+ screens. The y-axis shows the log10 of the false discovery rate (FDR) of the test. The dashed line shows FDR = 0.05. In both panels, genes highlighted in orange have FDR < 0.05 and GI >1 whereas genes highlighted in red have FDR < 0.05 and GI > 2. (D and E) Validation of the genetic interactions determined in (C). (D) LC-E75 (dolP+) or its ΔdolP derivative strain expressing sgRNAs that target the indicated genes were serially diluted and spotted on LB agar lacking or supplemented with aTc to induce expression of dcas9, as indicated. (E) BW25113 derivative cells deleted of rseA or both rseA and dolP were transformed with an empty vector (pCtrl) or a plasmid encoding DolP (pDolPHis). Ectopic expression of DolPHis was driven by the leaky transcriptional activity of Ptrc in the absence of IPTG. (D and E) Ten-fold serial dilutions of the indicated transformants were spotted on LB agar.
-
Figure 1—source data 1
Log2FC values of sgRNAs in the screens conducted with wild-type or ΔdolP cells.
- https://cdn.elifesciences.org/articles/67817/elife-67817-fig1-data1-v2.xlsx
-
Figure 1—source data 2
Genetic interaction scores.
- https://cdn.elifesciences.org/articles/67817/elife-67817-fig1-data2-v2.xlsx
Figure 1—figure supplement 1
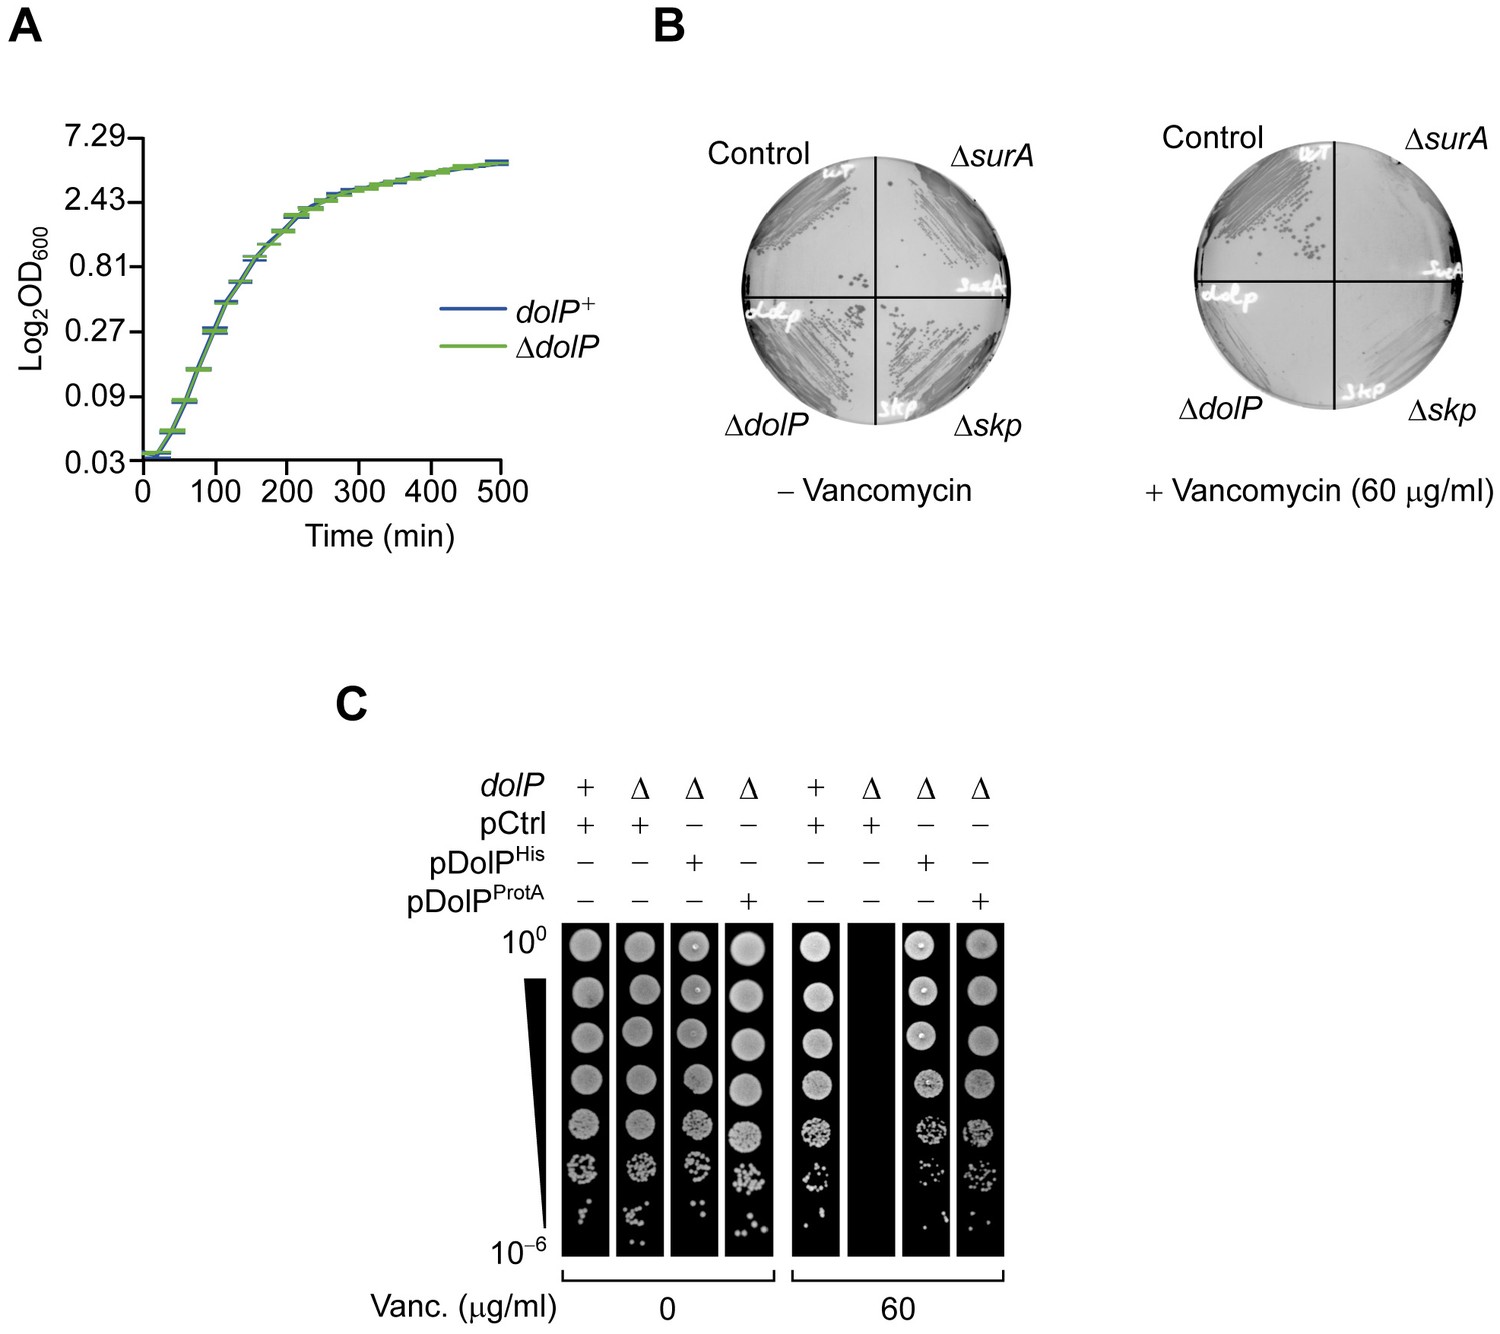
The deletion of dolP severely impairs growth in the presence of vancomycin.
(A) BW25113 and ΔdolP cells were cultured in LB. The cell densities of both cultures were monitored by measuring the OD600 at regular time intervals. The graph reports mean values of independent cultures ± standard deviation (SD, N = 3). (B) BW25113 (control) and the indicated deletion strains were cultured on LB agar lacking or containing 60 μg/ml vancomycin. (C) BW25113 and ΔdolP cells carrying the indicated plasmids were serially diluted and spotted on LB lacking or containing 60 μg/ml vancomycin. Ectopic expression was driven by the leaky transcriptional activity of Ptrc in the absence of IPTG.
Figure 1—figure supplement 2
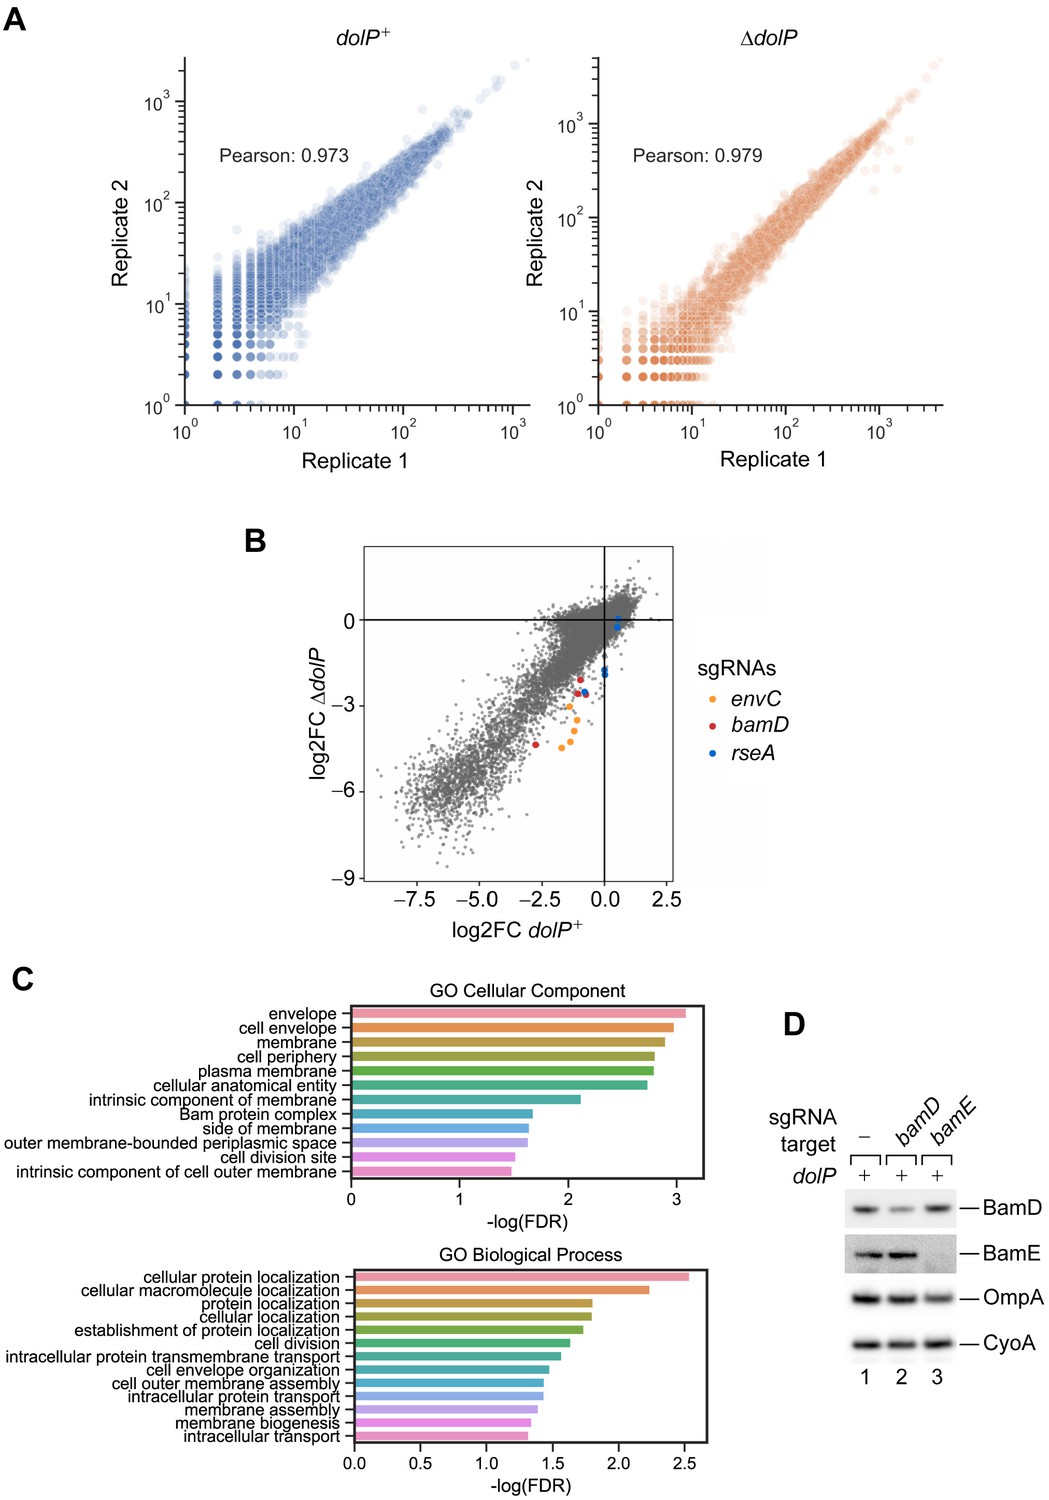
Reproducibility of the CRISPRi screens and ontology analysis of gene hits.
(A) The raw read counts of experimental replicates correlate well (Pearson’s r > 0.97) in both dolP+ (left) and ΔdolP (right) screens. See also Figure 1—source data 1 and 2. (B) Log2FC values of each sgRNA are compared between the WT and ΔdolP screens. Only guides targeting envC, bamD, and rseA are highlighted in orange, red, and cyan, respectively. See also Figure 1—source data 1 and 2 (C) Gene ontology (GO) analysis of the genes with a significant synthetic interaction with dolP. Using FDR < 0.05 as a threshold, 27 genes were selected for GO analysis for cellular component (upper panel) or biological process (bottom panel) (Ashburner et al., 2000). Both analyses show an overrepresentation of genes associated with cell envelope and membrane function. (D) LC-E75 cells expressing sgRNAs that target the indicated genes were cultured overnight, diluted, and supplemented with 1 μM aTc to induce expression of dcas9. After 17 generations, cells were collected and the total protein content was analysed by SDS-PAGE and immunoblotting using the indicated antisera.
Figure 2 with 1 supplement

DolP promotes fitness in cells that undergo envelope stress.
(A) One- and three-fold amounts of the total cell lysate fractions obtained from a BW25113 (dolP+) strain and a derivative ΔdolP strain were analysed by SDS-PAGE and immunoblotting using the indicated antisera. (B) One-, two-, and three-fold amounts of the total cell lysate fractions obtained from a BW25113 (bamB+) strain and a derivative ΔbamB strain were analysed by SDS-PAGE and immunoblotting using the indicated antisera. (C) BW25113 and derivative cells deleted of dolP, bamB, or both genes were cultured, serially diluted, and spotted on LB agar. Cells deleted of both dolP and bamB and transformed with pDolPHis were cultured, serially diluted, and spotted on LB agar supplemented with ampicillin. (D) The envelope fractions of the indicated strains were analysed by SDS-PAGE and immunoblotting. Prior to gel loading, samples were incubated at 25°C (Boiling −) or 99°C (Boiling +). The total amounts of BamA in ΔbamB dolP+ and ΔbamB ΔdolP strains were quantified, normalized to the amount of the inner membrane protein CyoA, and expressed as percentage of the value obtained for the ΔbamB dolP+ sample. Data are reported as means ± standard error of the mean (SEM, N = 3). u, unfolded; f, folded. (E) Overnight cultures of BW25113 (control), ΔdolP, ΔbamB, and ΔdolP ΔbamB, were freshly diluted in LB medium and re-incubated at 30°C until OD600 = 0.3. Cells were visualized on 1% (w/v) agarose pads by phase contrast microscopy. Bar = 5 μm.
Figure 2—figure supplement 1
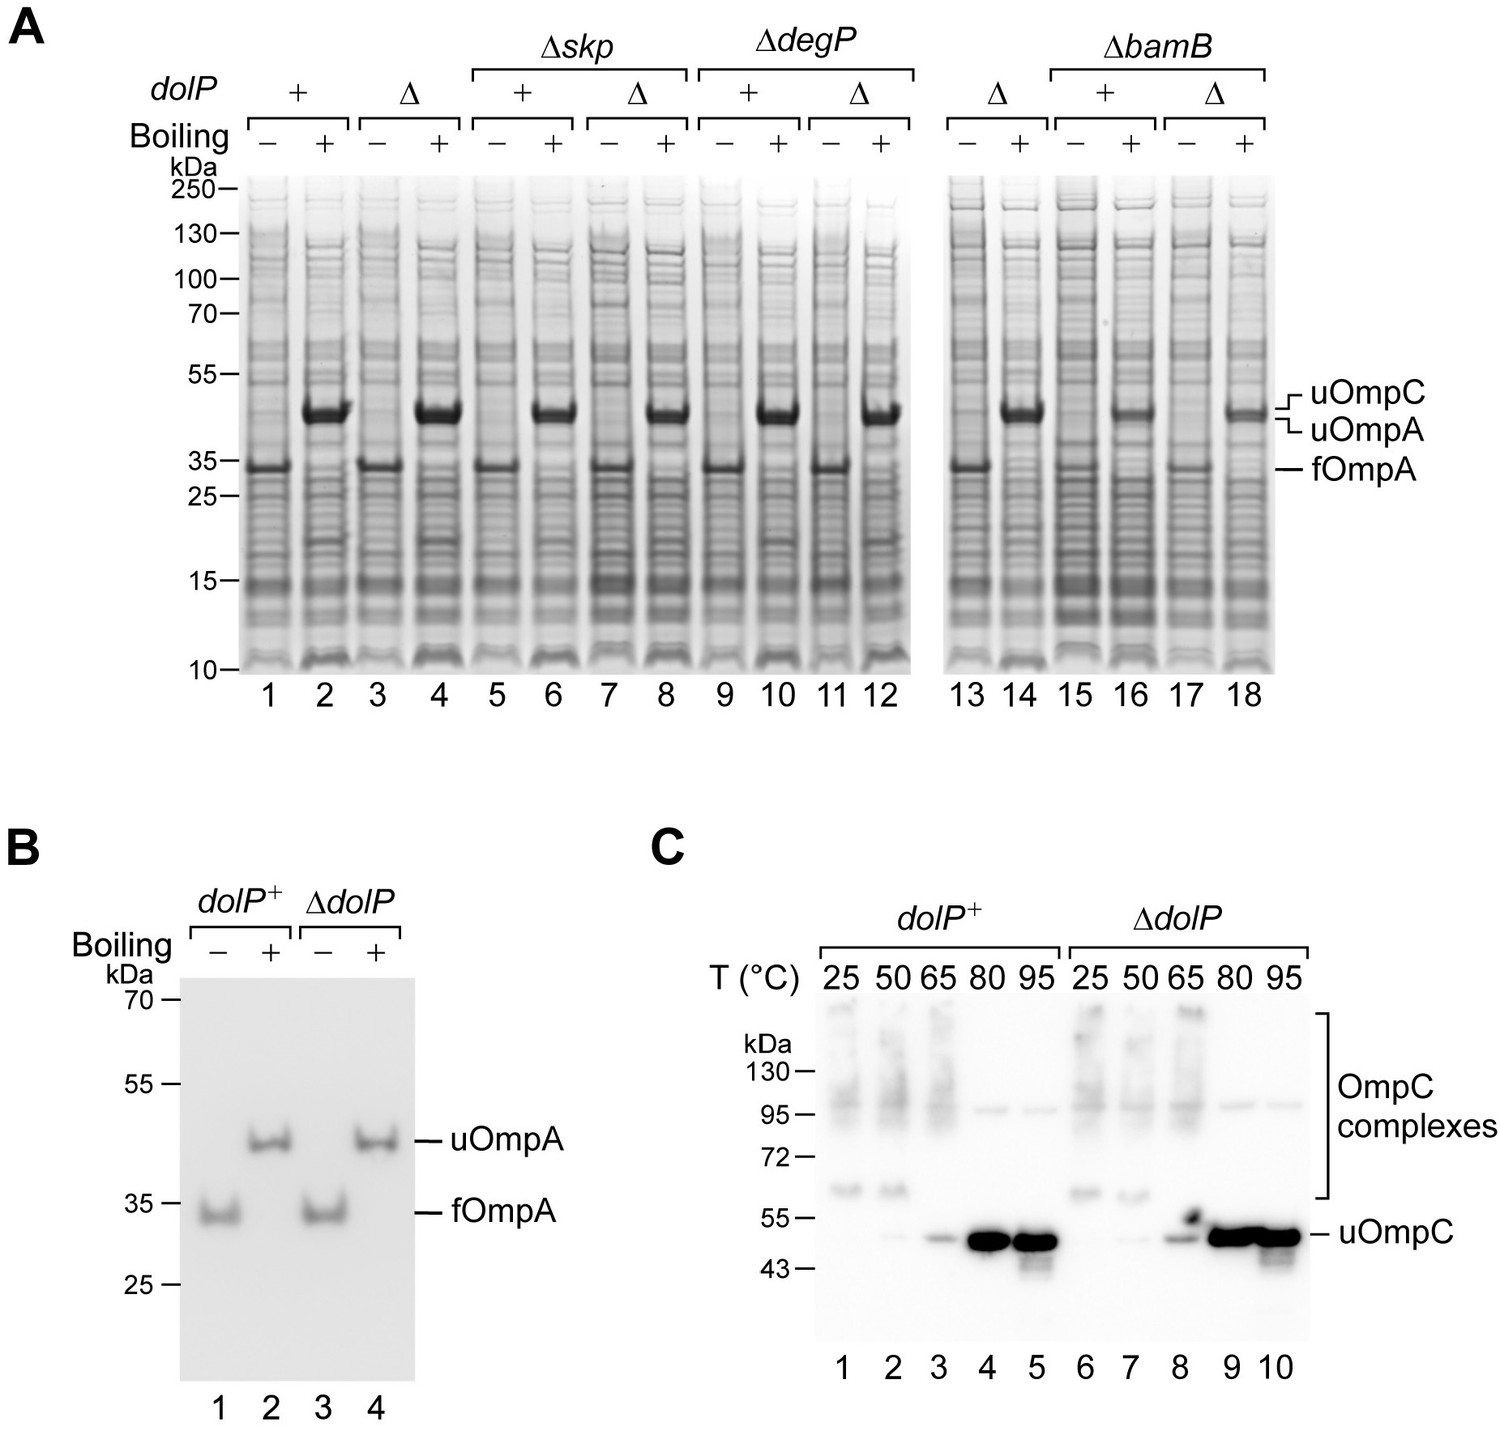
DolP does not play a direct role in OMP biogenesis.
(A) The protein contents of the indicated envelope fractions were analysed by SDS-PAGE and coomassie staining. Prior to loading, samples were heated at 50°C (Boiling −) or 99°C (Boiling +) for 10 min. u, unfolded; f, folded. (B) The protein contents of the envelope fraction of BW25113 (dolP+) or ΔdolP cells were mixed with SDS-PAGE loading buffer, heated at 50°C (Boiling −) or 99°C (Boiling +) for 10 min, and analysed by SDS-PAGE and immunoblotting. u, unfolded; f, folded. (C) The protein contents of the envelope fraction of BW25113 (dolP+) and ΔdolP cells were mixed with SDS-PAGE loading buffer, heated at the indicated temperatures, separated by SDS-PAGE and immunoblotted using anti-OmpC antisera. OmpC forms complexes (trimers), which are resistant to SDS and require heating to more than 65°C to be denatured. At high temperatures, complexes are denatured and OmpC migrates as unfolded (u) monomers.
Figure 3 with 1 supplement
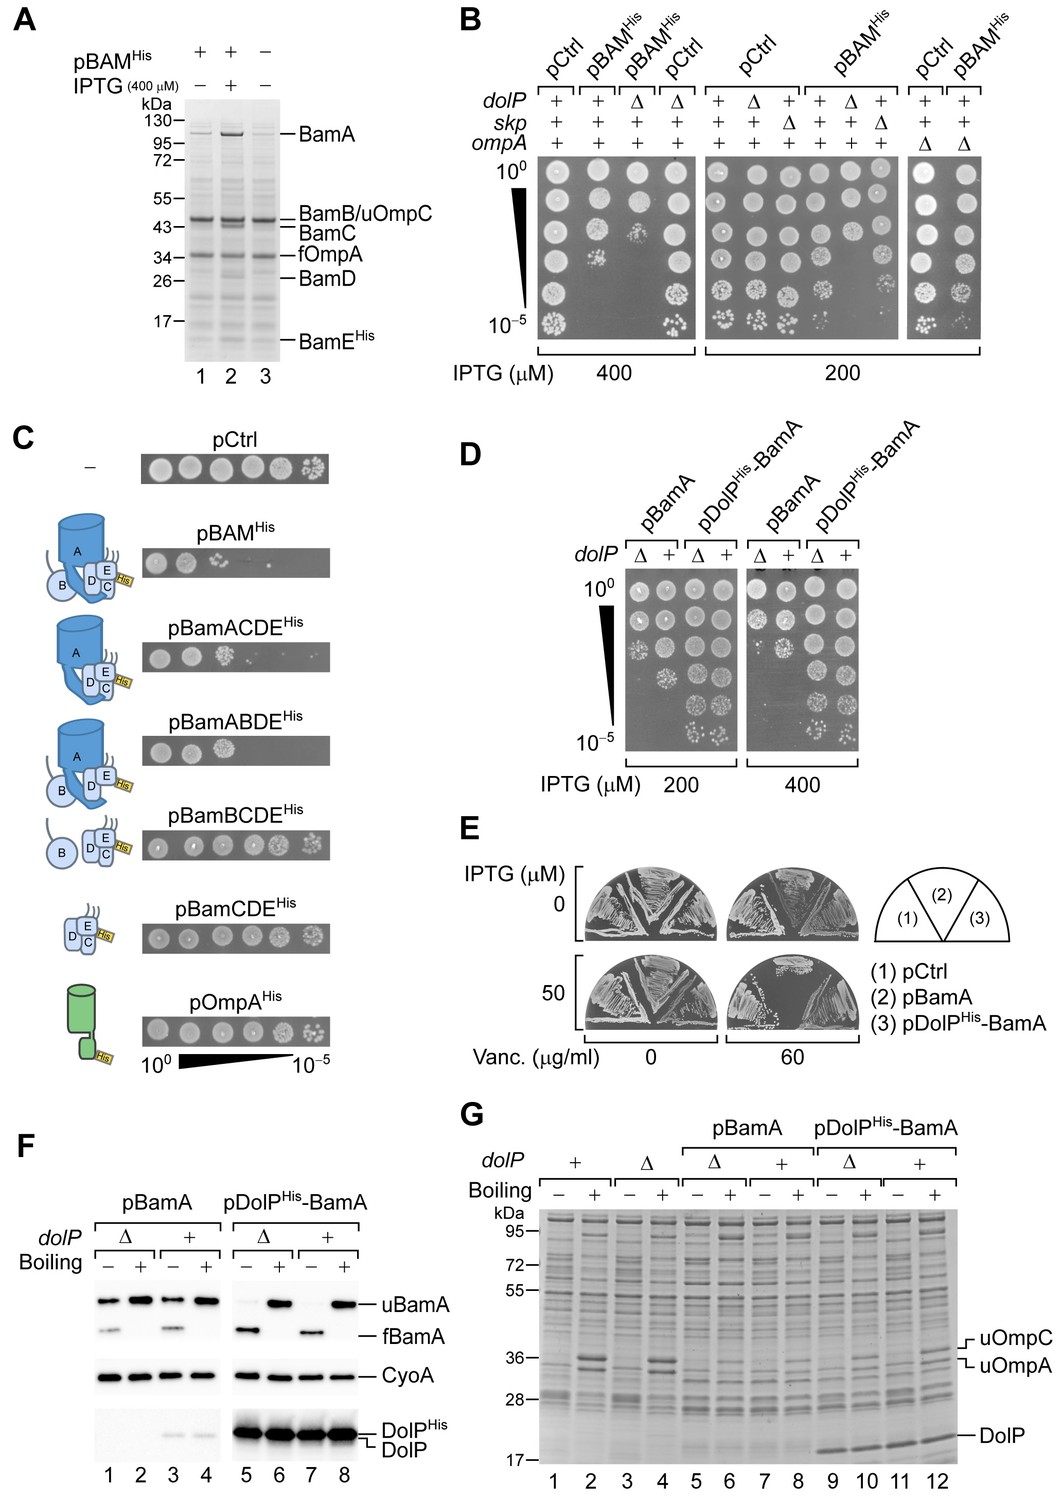
DolP opposes an envelope detrimental effect caused by BamA overaccumulation in the OM.
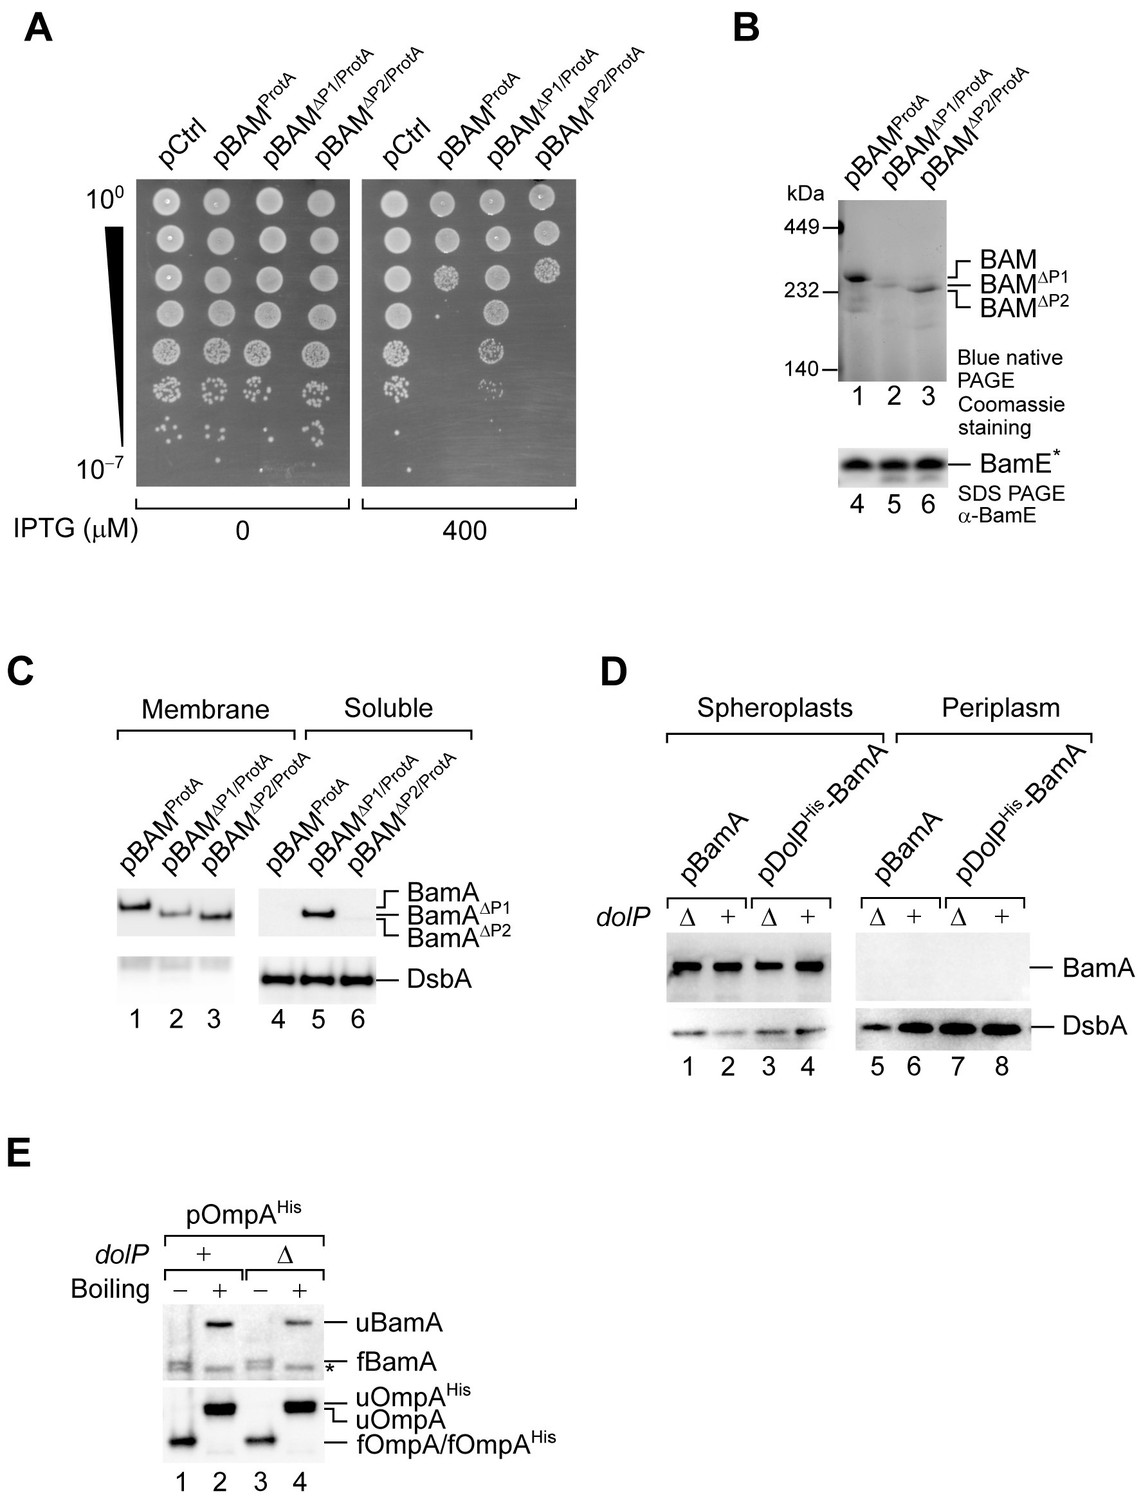
(A) BW25113 cells harbouring pBAMHis where indicated were cultured and supplemented with no IPTG or 400 μM IPTG for 1 hr prior to collecting cells. The protein contents of the envelope fractions were analysed by SDS-PAGE and coomassie staining. Prior to loading, samples were heated for 5 min at 90°C, a temperature which is not sufficient to fully denature OmpA (folded OmpA, fOmpA). The band of BamB overlaps with the band of the major porin unfolded OmpC (uOmpC). (B) The BW25113 and the derivative ΔdolP, Δskp, or ΔompA strains carrying an empty control vector (pCtrl) or pBAMHis were serially diluted and spotted onto LB agar supplemented with IPTG as indicated. (C) BW25113 cells carrying a control empty vector (pCtrl), or the indicated plasmids for ectopic overproduction of BAM, or subsets of BAM subunits, or OmpAHis were serially diluted and spotted onto LB agar containing 400 μM IPTG. The diagrams depict the overproduced proteins. (D) BW25113 and derivative ΔdolP cells carrying the indicated plasmids for ectopic overproduction of either BamA alone or both DolPHis and BamA were serially diluted and spotted onto LB agar supplemented with IPTG as indicated. (E) BW25113 cells carrying the indicated plasmids were cultured overnight and streaked onto LB agar containing IPTG and vancomycin as indicated. (F) Heat-modifiability of BamA in wild-type and ΔdolP cells carrying the indicated plasmids. When the cultures reached the mid-exponential phase, the expression of BamA was induced for 2 hr with 200 μM IPTG. Total cell proteins were incubated at 25°C (Boiling −) or at 99°C (Boiling +), separated by SDS-PAGE and analysed by immunoblotting using the indicated antisera. u, unfolded; f, folded. (G) Heat modifiability of the protein contents of the envelope fraction of BW25113 (dolP+) or ΔdolP cells carrying no vector or transformed with pBamA or pDolPHis-BamA. Plasmid-borne genes were induced with 200 μM IPTG for 2 hr prior to collecting cells. The envelope fractions were mixed with SDS-PAGE loading buffer, incubated at 25°C (Boiling −) or 99°C (Boiling +) for 10 min, and analysed by SDS-PAGE and coomassie staining. u, unfolded.
Figure 3—figure supplement 1
The detrimental effect of BAM overproduction is caused by the overaccumulation of BamA in the OM.
(A) Spot dilution test of BW25113 cells transformed with the indicated plasmids. In the presence of IPTG, overproduction of BAMΔP1/ProtA impaired growth to a lower extent compared to overproduction of BAMProtA or BAMΔP2/ProtA. (B) The crude envelope fractions of cells overproducing BAMProtA, BAMΔP1/ProtA, or BAMΔP2/ProtA were solubilized with 1% (w/v) digitonin and 0.1% (w/v) DDM, and subjected to native IgG-affinity chromatography. Elutions were analysed by blue native-PAGE and coomassie staining (lanes 1–3) or SDS-PAGE and immunoblotting (lanes 4–6). Blue native-PAGE of the elution fraction containing wild-type BamA resolved a coomassie stainable complex migrating with an apparent mass of 250 kDa, which corresponds to the BAM complex (lane 1). A roughly similar amount of the BAM complex was detected in the elution obtained with BamAΔP2/ProtA samples, although, in this case, the BAMΔP2 complex migrated slightly faster accounting for the BamAΔP2 mass difference (lane 3). In contrast, the amount of BAMΔP1/ProtA variant was considerably lower (lane 2). The asterisk indicates that BamE is obtained from TEV digestion of BamEProtA. (C) Cells overproducing the indicated variants of the BAM complex were fractionated. The membrane and soluble fractions obtained upon treatment of collected cells with lysozyme and EDTA were analysed by SDS-PAGE and immunoblotting. BamAΔP1 was depleted from the total membrane fraction (lanes 1–3) and accumulated in the soluble fraction containing the periplasmic protein DsbA (lanes 4–6). (D) The periplasm and spheroplast fractions of cells overproducing BamA or both DolPHis and BamA (as in Figure 3F) were analysed by SDS-PAGE and immunoblotting using the indicated antisera. (E) Heat-modifiability of BamA and overproduced OmpAHis in BW25113 and ΔdolP cells carrying pOmpAHis. Upon reaching the mid-exponential phase, cultures were supplemented with 200 μM IPTG for 2 hr. The whole-protein content of collected cells were incubated at 25°C (Boiling −) or at 99°C (Boiling +), separated by SDS-PAGE, and analysed by immunoblotting using the indicated antisera. u, unfolded; f, folded. * indicates a non-specific cross-reaction.
Figure 4 with 2 supplements
DolP associates with the BAM complex via an interaction with BamA.
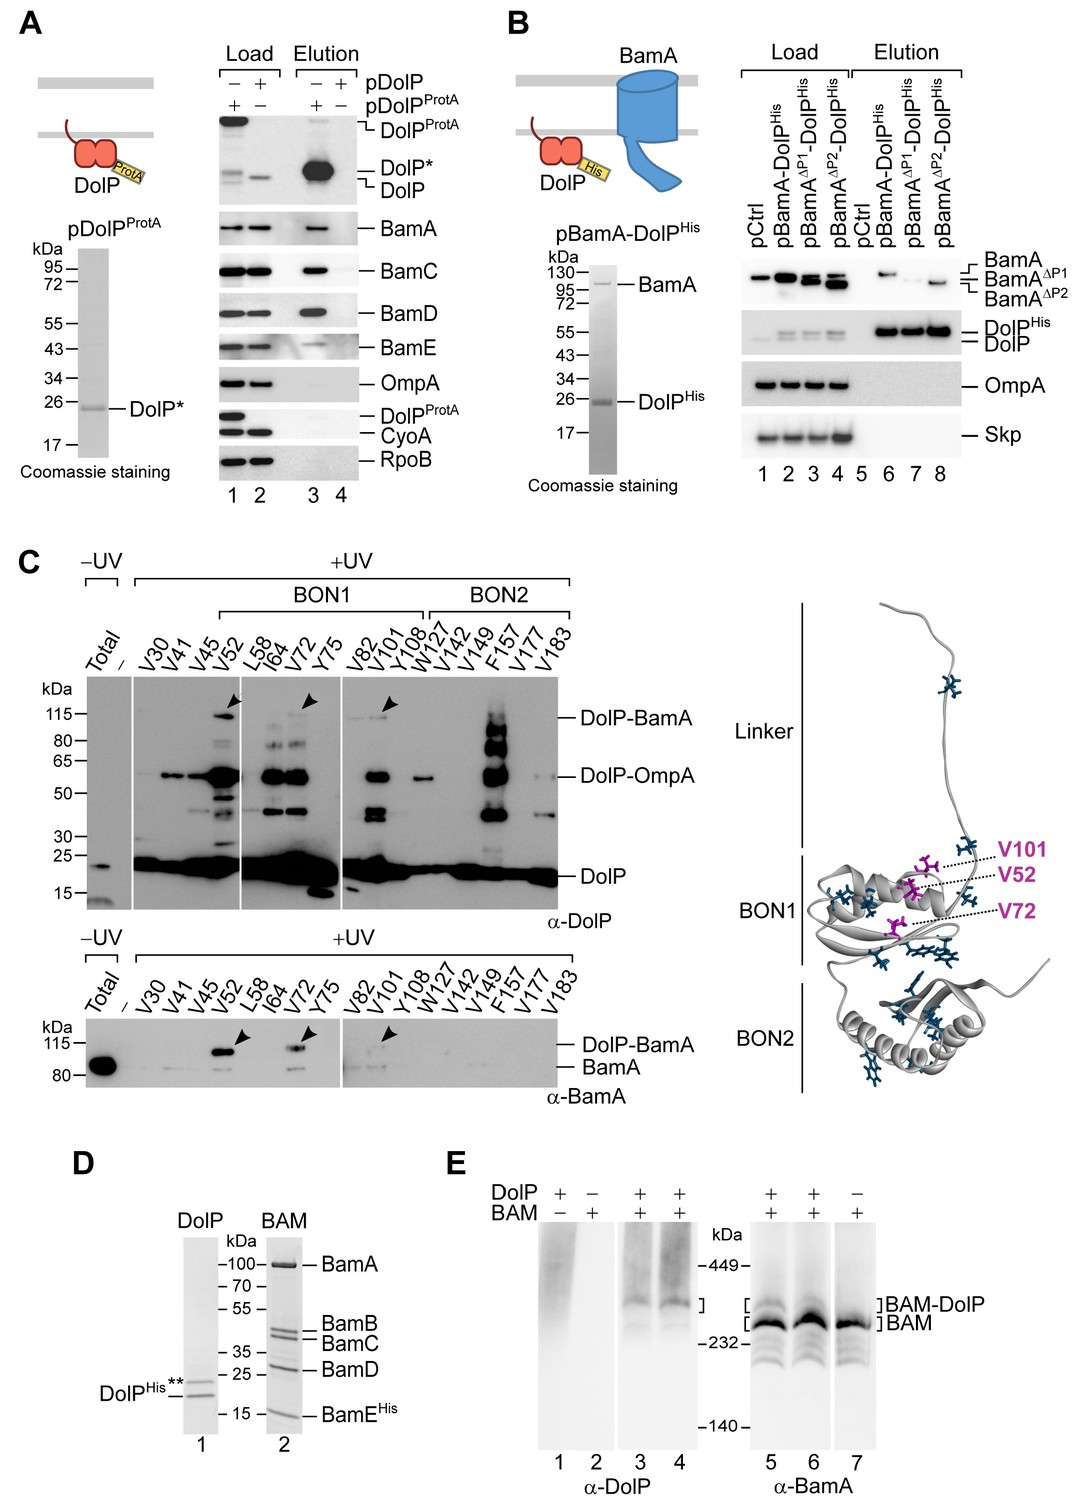
(A) The envelope fractions of BW25113 cells carrying the indicated plasmids were solubilized with 1% (w/v) digitonin and 0.1% (w/v) DDM and subjected to IgG affinity purification of protein A-tagged DolP. The load and elution fractions were analysed by SDS-PAGE. The coomassie staining of the elution of protein A-tagged DolP is shown below the diagrams representing the overproduced protein. Blotted proteins from load and elution fractions were detected by immunolabelling using the indicated antisera. Load 0.5%; Elution 100%. The asterisk indicates the TEV-digestion product of DolPProtA. (B) The envelope fractions of BW25113 cells carrying the plasmids overproducing His-tagged DolP and the indicated BamA protein variants (deleted of POTRA1 or of POTRA2) were solubilized with 1% (w/v) digitonin and 0.1% (w/v) DDM and subjected to Ni-affinity purification. The load and elution fractions were analysed by SDS-PAGE. The coomassie staining of the elution of His-tagged DolP overproduced together with wild-type BamA is shown below the diagram representing the overproduced proteins. Blotted protein from load and elution fractions were detected by immunolabelling using the indicated antisera. Load 2%; Elution 100%. The amount of BamA co-isolated with DolPHis was normalized to the amount of BamA detected in the load fraction. The value obtained for the pBamA-DolPHis sample was set to 100%. The average of the relative amounts of co-isolated BamAΔP1 and BamAΔP2 are as follows: BamAΔP1, 16.5% (N = 2; 1st exp. 23.6%; 2nd exp. 9.3%); BamAΔP2, 81.2% (N = 2; 1st exp. 101.8%; 2nd exp. 60.6%). (C) UV photo-crosslinking of ΔdolP cells transformed with pEVOL-pBpF and pBamA-DolPHis harbouring an amber codon at the indicated position of the dolP ORF. Upon Ni-affinity chromatography of DolPHis, eluates obtained from UV irradiated samples were separated by SDS-PAGE and analysed by immunoblotting using the indicated antisera. The total envelope fraction of cells expressing DolPHis with Bpa at position V52 (non-irradiated) is shown in the first lane and serves as a reference for the migration of non-crosslinked DolP and BamA. Arrowheads indicate crosslinked products detected with both DolP and BamA antisera. Analysis of eluates obtained from non-irradiated samples are shown in Figure 4—figure supplement 1B. The amino acid residues replaced with Bpa are indicated on the structure of DolP, PDB: 7A2D (Bryant et al., 2020). In purple are the positions crosslinked to BamA. (D) The envelope fraction of BW25113 cells overproducing DolPHis or the BAM complex containing C-terminally His-tagged BamE was subjected to protein extraction with 1% (w/v) DDM, Ni-affinity purification, and gel filtration chromatography. The elution fractions were analysed by SDS-PAGE and coomassie staining. The double asterisk indicates a contaminant protein in the elution of DolP. (E) Roughly equimolar quantities of purified His-tagged BAM complex and DolP were incubated alone for 1 hr at 4°C (lanes 1, 2, and 7), or together for 1 hr at 4°C (lanes 3 and 6) or for 30 min at 25°C (lanes 4 and 5), prior to blue native-PAGE and immunoblotting using the indicated antisera.
Figure 4—figure supplement 1
Analysis of the DolP–BamA interaction.
(A). The envelope fractions of BW25113 cells carrying pBAMProtA were solubilized with 1% (w/v) digitonin and 0.1% (w/v) DDM and subjected to IgG affinity purification of protein A-tagged BamE. The load and elution fractions were analysed by SDS-PAGE. The coomassie staining of the elution of protein A-tagged BamE is shown below the diagrams representing the overproduced proteins. Blotted protein from load and elution fractions were detected by immunolabelling using the indicated antisera. Load 1%; Elution 100%. The asterisk indicates the TEV-digestion product of BamEProtA. (B) UV photo-crosslinking of ΔdolP cells transformed with pEVOL-pBpF and pBamA-DolPHis harbouring an amber codon at the indicated position of the dolP ORF (see also Figure 4C). Eluates of the DolPHis Ni-affinity chromatography obtained from samples protected from UV irradiation were separated by SDS-PAGE and analysed by immunoblotting using the indicated antisera. The total envelope fraction of cells expressing DolPHis with Bpa at position V52 (non-irradiated) is also shown. (C) Equal aliquots of the envelope fraction of BW25113 cells expressing His-tagged DolP were solubilized with the indicated concentrations (w/v) of digitonin and DDM: 1%, 0.1% (lane 1), 0.8%, 0.3% (lane 2), 0.3%, 0.8% (lane 3), 0.1%, 1% (lane 4). His-tagged DolP was purified by Ni-affinity chromatography. In all cases, proteins were eluted in the presence of 0.3% (w/v) digitonin and 0.03% (w/v) DDM. Load 0.2%; Elution 100%. (D) The indicated strains were streaked onto LB agar plates containing vancomycin as indicated.
Figure 4—figure supplement 2
Mass spectrometry analyses of the DolP–OmpA crosslink product.
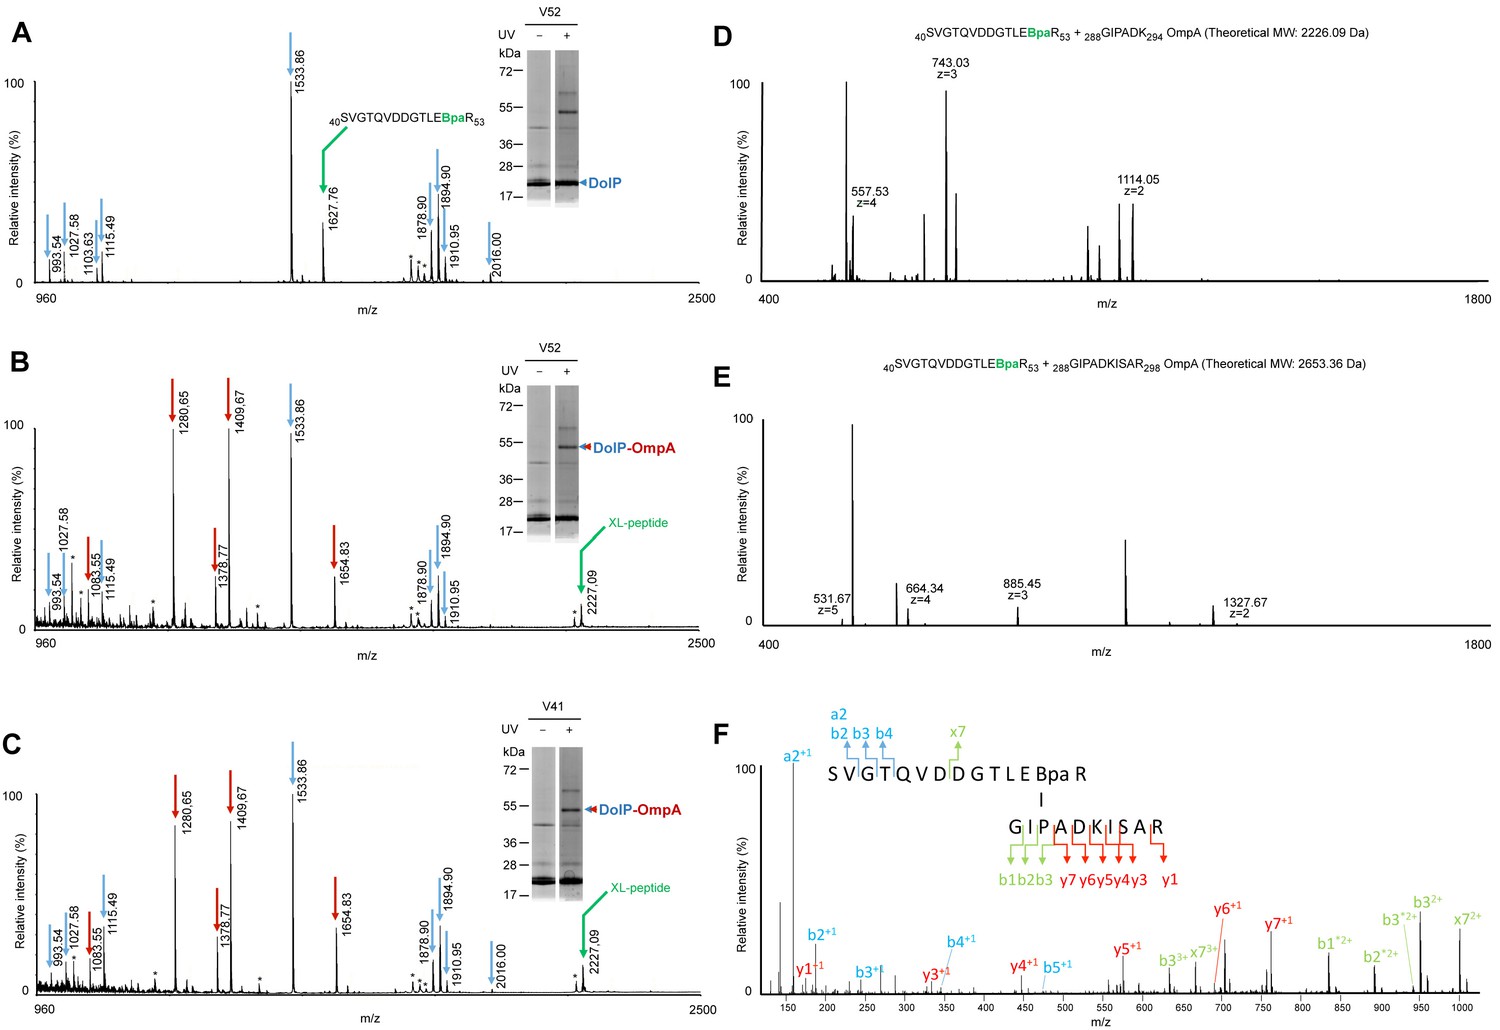
(A–C) BW25113 cells carrying pEVOL-pBpF and a pDolPHis with amber codons engineered at positions V52 (A and B) or V41 (C) of the dolP ORF were subjected to UV crosslinking. After Ni-affinity purifications, eluates were subjected to SDS-PAGE and coomassie-staining. Bands corresponding to DolPHis and its major UV-specific crosslink products (respectively, single and double arrowheads) were trypsin digested and subjected to MALDI-TOF MS analyses. DolP and DolP together with OmpA were identified by peptide mass fingerprinting using tryptic peptide predicted patterns for each protein (blue arrows for DolP and red arrows for OmpA) in the samples obtained from the single arrowhead (A) and double arrowhead bands (B and C), respectively. (A) The mass of a tryptic peptide containing Bpa in place of V52 (m/z = 1627.76) was identified in the band containing only DolPHis. (B and C) Compared to the spectrum in A, a new mass (m/z = 2227.09) predicted to correspond to a crosslinked peptide (XL-peptide) between DolP (40SVGTQVDDGTLE[Bpa]R53) (B) or DolP (40S[Bpa]GTQVDDGTLEVR53) (C) and OmpA (288GIPADK294) was detected, whereas the Bpa-containing peptide at m/z = 1627.76 was not observed. Keratin tryptic peptides or trypsin autodigestion peptides are labelled with asterisks. Indicated masses correspond to [M+H]+ ions. (D and E) BW25113 cells carrying pEVOL-pBpF and pBamA-DolPHis with amber codons engineered at positions V52 of the dolP ORF were subjected to UV crosslinking. After Ni-affinity purifications, eluates were trypsin digested and subjected to LC-ESI-MS/MS analyses. (D) MS spectrum at 69.0 min showed a peptide at 2226.08 Da predicted to correspond to the crosslinked peptide identified by MALDI-TOF MS (see B and C). (E) MS spectrum at 71.4 min showed a species at 2653.32 Da predicted to include the OmpA crosslinked peptide identified by MALDI-TOF with a C-terminal miscleavage (288GIPADKISAR298). (F) MS/MS (HCD 30 NCE) of the ion at m/z = 664.34 (z = 4) confirmed the crosslink between peptide 40SVGTQVDDGTLE[Bpa]R53 of DolP and peptide 288GIPADKISAR298 of OmpA.
Figure 5 with 5 supplements
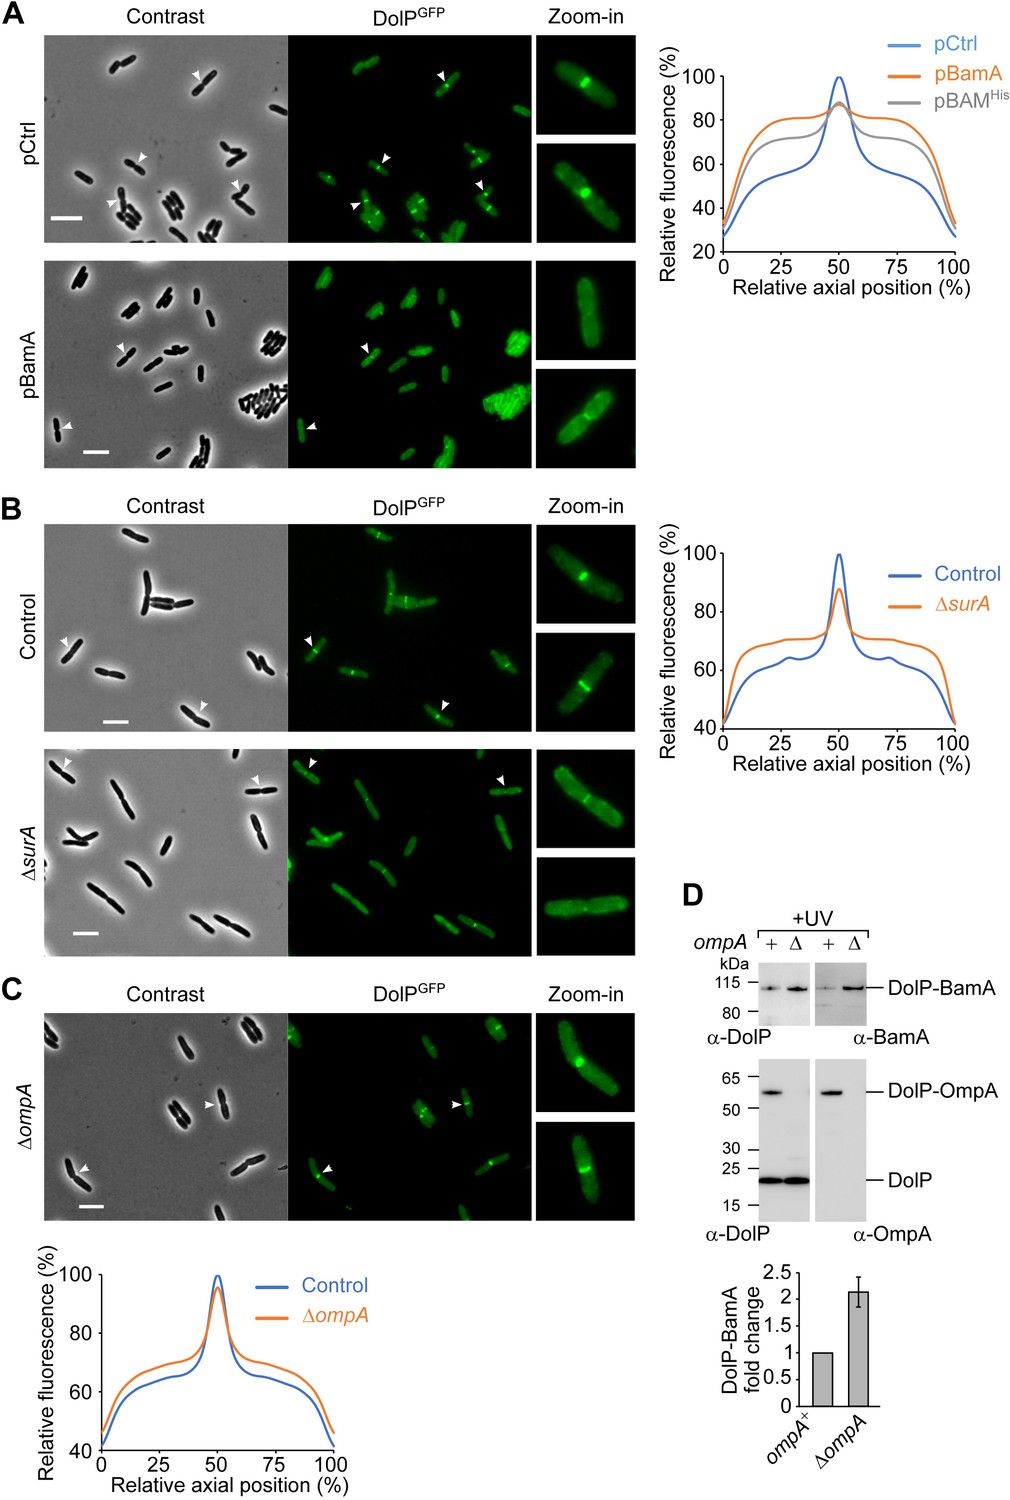
BamA overaccumulation in the OM and envelope stress interfere with the mid-cell localization of DolP.
(A) Overnight cultures of BW25113 cells harbouring the chromosomal fusion dolP-gfp and transformed with either pCtrl (empty vector) or pBamA were freshly diluted in minimal M9 medium, incubated at 30°C until OD600 = 0.1 and supplemented with 400 μM IPTG for 1 hr. Cell samples were visualized on 1% (w/v) agarose pads by phase contrast and fluorescence microscopy. Arrowheads indicate envelope constriction sites between forming daughter cells. Bar = 5 μm. The collective profiles of fluorescence distribution versus the relative position along the cell axis were plotted: pCtrl, blue; pBamA, orange; pBAMHis, grey (images of cells transformed with pBAMHis are shown in Figure 5—figure supplement 3A). Only cells with a constriction (N = 361, pCtrl; N = 187, pBamA; N = 187, pBAMHis) were taken into account for the collective profile plots. Fluorescence intensities were normalized to the mid-cell value obtained for the control sample. (B) Overnight cultures of BW25113 (control) or ΔsurA derivative cells carrying the dolP-gfp chromosomal fusion were freshly diluted in LB medium and incubated at 30°C until OD600 = 0.3. Cell samples were visualized as in (A). Bar = 5 μm. The collective profiles of fluorescence distribution versus the relative position along the cell axis is shown for ΔsurA cells (orange) and surA+ control cells (blue). Only cells with a constriction (N = 318, Control; N = 320, ΔsurA) were taken into account for the collective profile plots. Fluorescence intensities were normalized to the mid-cell value obtained for the control sample. (C) Overnight cultures of ΔompA cells carrying the dolP-gfp chromosomal fusion were cultured and visualized as in (B). Bar = 5 μm. The collective profiles of fluorescence distribution versus the relative position along the cell axis is shown for ΔompA cells (orange) and an ompA+ (control) strain that was cultured and visualized in a parallel experiment (blue). Only cells with a constriction (N = 287, Control; N = 193, ΔompA) were taken into account for the collective profile plots. Fluorescence intensities were normalized to the mid-cell value obtained for the control sample. (D) UV photo-crosslinking of ΔdolP and ΔdolP ΔompA cells transformed with pBamA-DolPHis harbouring an amber codon at position V52 of the dolP ORF. Signals obtained with the anti-BamA antiserum were quantified and showed in the histogram. The amount of DolP-BamA crosslink product obtained with samples lacking OmpA is expressed as fold change of the amount of the same product obtained in samples expressing OmpA. Data are reported as mean ± SEM (N = 3).
Figure 5—figure supplement 1
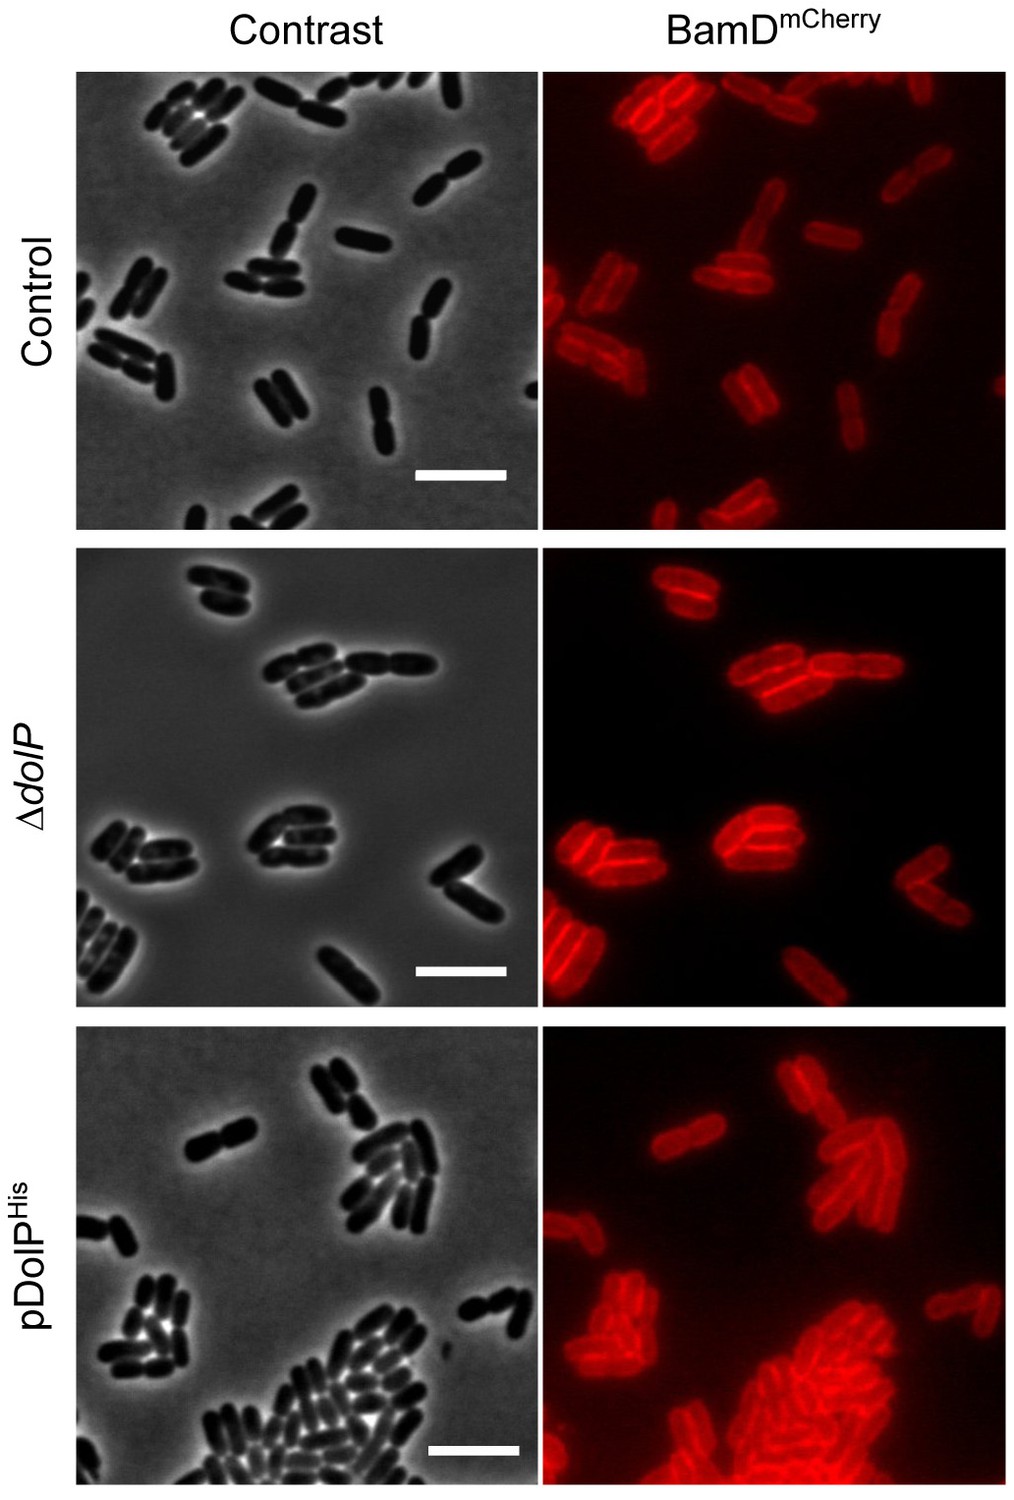
Effect of the lack or the overproduction of DolP on BAM localization.
BW25113 derivative cells harbouring a bamD-mCherry chromosomal fusion were visualized on 1% (w/v) agarose pads by fluorescence and phase-contrast microscopy. Top: dolP+ cells (control); Centre: ΔdolP cells: Bottom: dolP+ cells carrying pDolPHis. Cells were cultured at 30°C in minimal M9 medium to OD600 = 0.5. IPTG (400 μM) was supplemented for 1 hr to induce ectopic expression of DolPHis. Bar = 5 μm.
Figure 5—figure supplement 2
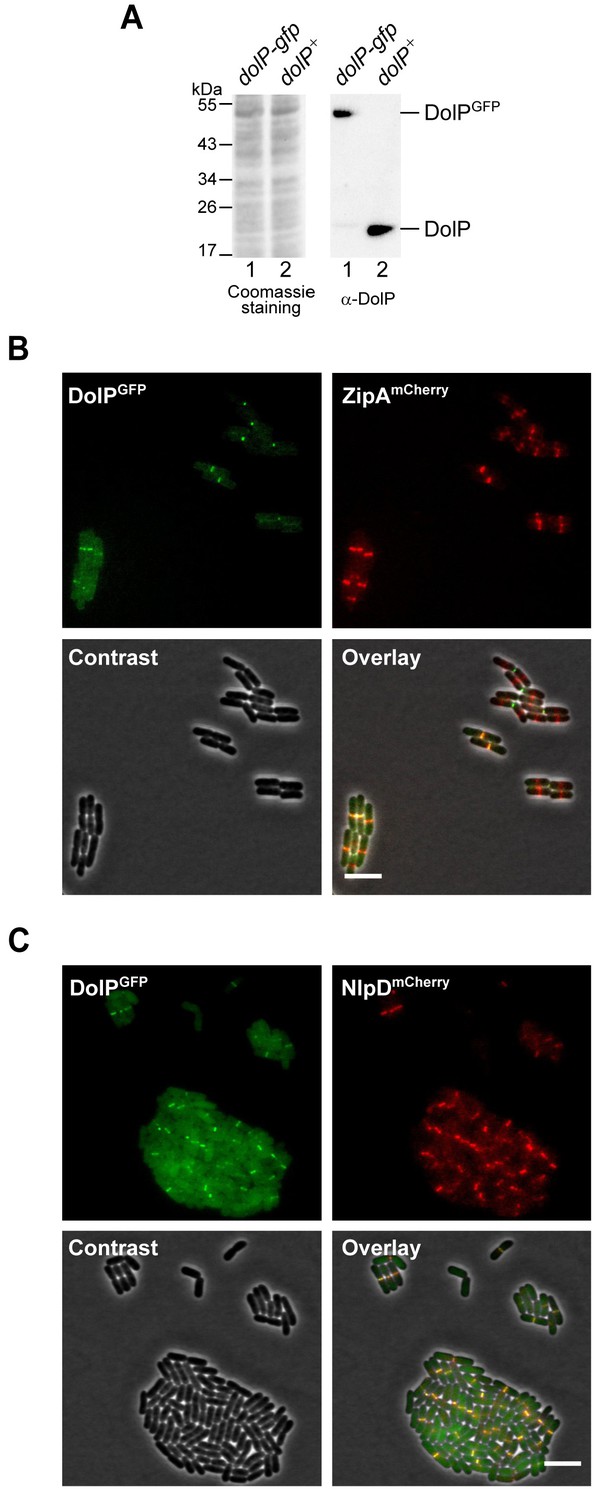
DolPGFP, NlpDmCherry, and ZipAmCherry mid-cell localization patterns.
(A) The total protein contents of cells harbouring the dolP-gfp chromosomal fusion (lane 1) or wild-type dolP (lane 2) were analysed by SDS-PAGE followed by coomassie staining or immunoblotting using a DolP-specific antiserum. (B and C) BW25113-derivative cells harbouring the chromosomal fusion dolP-gfp and either zipA-mCherry (B) or nlpD-mCherry (C) were cultured at 30°C in minimal M9 medium to OD600 = 0.2–0.3 and visualized on 1% (w/v) agarose pads by fluorescence and phase-contrast microscopy. Bar = 5 μm.
Figure 5—figure supplement 3

Overproduction of BAM influences septal recruitment of DolPGFP but not NlpDmCherry or ZipAmCherry.
(A) BW25113 cells harbouring the chromosomal fusion dolP-gfp transformed with either pBAMHis or pBamBCDEHis were freshly diluted in minimal M9 medium, incubated at 30°C until OD600 = 0.1 and supplemented with 400 μM IPTG for 1 hr. Cell samples were visualized on 1% (w/v) agarose pads by phase contrast and fluorescence microscopy. Arrowheads indicate envelope constriction sites between forming daughter cells. Bar = 5 μm. The collective profiles of fluorescence distribution in cells transformed with pBAMHisare shown in Figure 5A. (B) BW25113-derivative cells harbouring the chromosomal fusion dolP-gfp and zipA-mCherry or nlpD-mCherry were transformed with pBAMHis (ectopic overproduction of all BAM subunits). Cells were then cultured at 30°C in minimal M9 medium supplemented with 400 μM IPTG for 1 hr until OD600 = 0.2–0.3, and visualized as in (A). The arrowheads indicate the localization of DolPGFP, ZipAmCherry, or NlpDmCherry at division septa. (C) Top: A BW25113-derivative dolP-gfp strain transformed with pOmpAHis was cultured in LB medium and supplemented with 400 μM IPTG or no IPTG for 1 hr prior to collecting cells. The total protein contents were analysed by SDS-PAGE and immunoblotting using the indicated antisera. Bottom: BW25113-derivative dolP-gfp cells transformed with pOmpAHis were cultured in minimal M9 medium supplemented with 400 μM IPTG for 1 hr until OD600 = 0.2–0.3, and visualized as in (A). Bar = 5 μm. (D) BW25113-derivative cells harbouring the chromosomal fusion dolP-gfp and zipA-mCherry or nlpD-mCherry were transformed with pBamAHis (ectopic overproduction of a partially inactive His-tagged form of BamA). Cells were then cultured at 30°C in minimal M9 medium supplemented with 400 μM IPTG for 1 hr until OD600 = 0.2–0.3, and visualized as in (A).
Figure 5—figure supplement 4
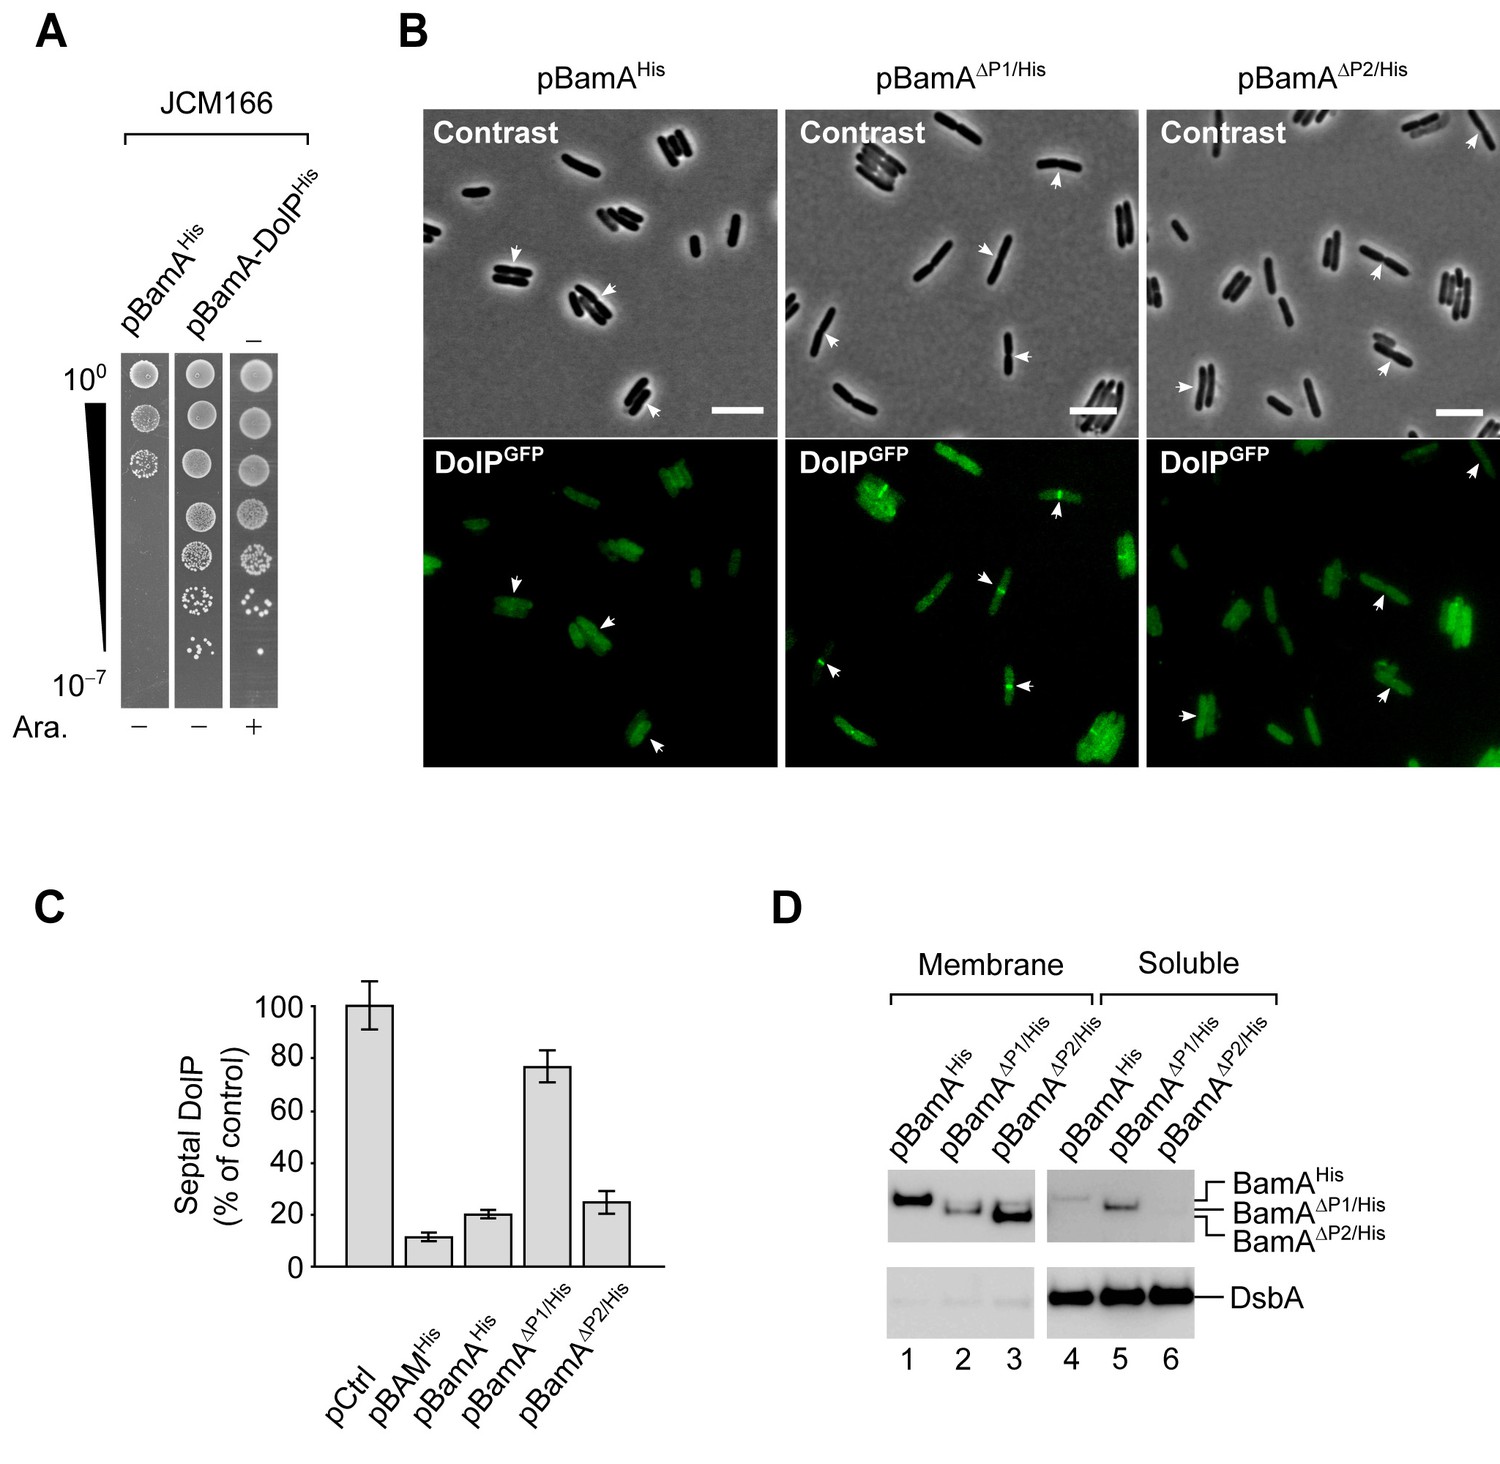
BamA overaccumulation in the OM impairs mid-cell localization of DolPGFP.
(A) The JCM166 BamA depletion strain or its transformants carrying plasmids encoding BamAHis or wild-type BamA and DolPHis were cultured in the presence of 0.02% (w/v) arabinose (which induces transcription of a chromosomal copy of wild-type bamA engineered downstream of an arabinose-inducible Pbad promoter). Serial dilutions were spotted on LB agar devoid of or supplemented with 0.02% (w/v) arabinose, as indicated. In the absence of arabinose, growth is supported by the ectopic expression of wild-type BamA and not of its variant encoding C-terminally His-tagged BamA. (B) Overnight cultures of BW25113 cells harbouring the chromosomal dolP-gfp fusion and carrying the indicated plasmids were diluted in minimal M9 medium supplemented with 400 μM IPTG. The cells were grown at 30°C to OD600 = 0.2–0.3 and visualized on 1% (w/v) agarose pads by fluorescence microscopy. The arrows indicate envelope constriction sites between forming daughter cells. Bar = 5 μm. (C) Counting of BW25113 cells presenting septal DolPGFP fluorescent signals. dolP-gfp cells carrying pBAMHis, pBamAHis, pBamAΔP1/His, or pBamAΔP2/His (analysed by fluorescence microscopy and shown in Figure 5—figure supplements 3A and B) were counted. The percentage of cells presenting fluorescent DolPGFP signals at the mid-cell in samples overproducing all five BAM subunits or only one of the indicated BamA variants was normalized to the same fraction obtained for cells carrying the control empty vector (pCtrl). Bar charts display a mean value ± SD (N = 3). More than 300 cells were counted in each experiment. (D) BW25113 cells carrying the indicated plasmids were cultured and supplemented with 400 μM IPTG to induce ectopic expression of BamAHis and its mutant forms. Collected cells were subjected to lysozyme/EDTA lysis to obtain the total membrane and soluble fractions. The protein contents of the indicated cell fractions were separated by SDS-PAGE and immunolabelled with the indicated antisera.
Figure 5—figure supplement 5

Envelope stress influences the localization of DolPGFP.
(A) Overnight cultures of BW25113 (control) or ΔsurA or ΔbamB derivative cells carrying the dolP-gfp chromosomal fusion were freshly diluted in M9 medium and incubated at 30°C till OD600 = 0.3 and visualized on 1% (w/v) agarose pads by contrast and fluorescence microscopy. Bar = 5 μm. The arrows indicate envelope constriction sites between forming daughter cells. The percentage of cells presenting fluorescent DolPGFP signals at division septa in ΔsurA and ΔbamB cells was normalized to the same fraction obtained for the control cells and reported below the micrograph. More than 1000 (ΔsurA) and 300 (ΔbamB) cells were counted. (B) Overnight cultures of BW25113 (control) or ΔsurA derivative cells carrying the dolP-gfp and nlpD-mCherry chromosomal fusions were freshly diluted in LB medium and incubated at 30°C until OD600 = 0.3 prior to visualization by contrast and fluorescence microscopy. Bar = 5 μm. The arrows indicate envelope constriction sites between forming daughter cells. (C) Overnight cultures of ΔompC cells harbouring the chromosomal dolP-gfp fusion were diluted in minimal M9 medium, cultured at 30°C to OD600 = 0.3 and visualized on 1% (w/v) agarose pads by contrast and fluorescence microscopy. The arrows indicate envelope constriction sites between forming daughter cells. Bar = 5 μm.
Additional files
-
Supplementary file 1
List of strains used in this study.
- https://cdn.elifesciences.org/articles/67817/elife-67817-supp1-v2.docx
-
Supplementary file 2
List of plasmids used in this study.
- https://cdn.elifesciences.org/articles/67817/elife-67817-supp2-v2.docx
-
Transparent reporting form
- https://cdn.elifesciences.org/articles/67817/elife-67817-transrepform-v2.docx
Download links
A two-part list of links to download the article, or parts of the article, in various formats.
Downloads (link to download the article as PDF)
Open citations (links to open the citations from this article in various online reference manager services)
Cite this article (links to download the citations from this article in formats compatible with various reference manager tools)
Lipoprotein DolP supports proper folding of BamA in the bacterial outer membrane promoting fitness upon envelope stress
eLife 10:e67817.
https://doi.org/10.7554/eLife.67817


