Deep learning detects cardiotoxicity in a high-content screen with induced pluripotent stem cell-derived cardiomyocytes
- Tenaya Therapeutics, United States
- Cardiovascular Institute and Department of Medicine, Stanford University, United States
- Dana Solutions, United States
Figures
Figure 1 with 1 supplement
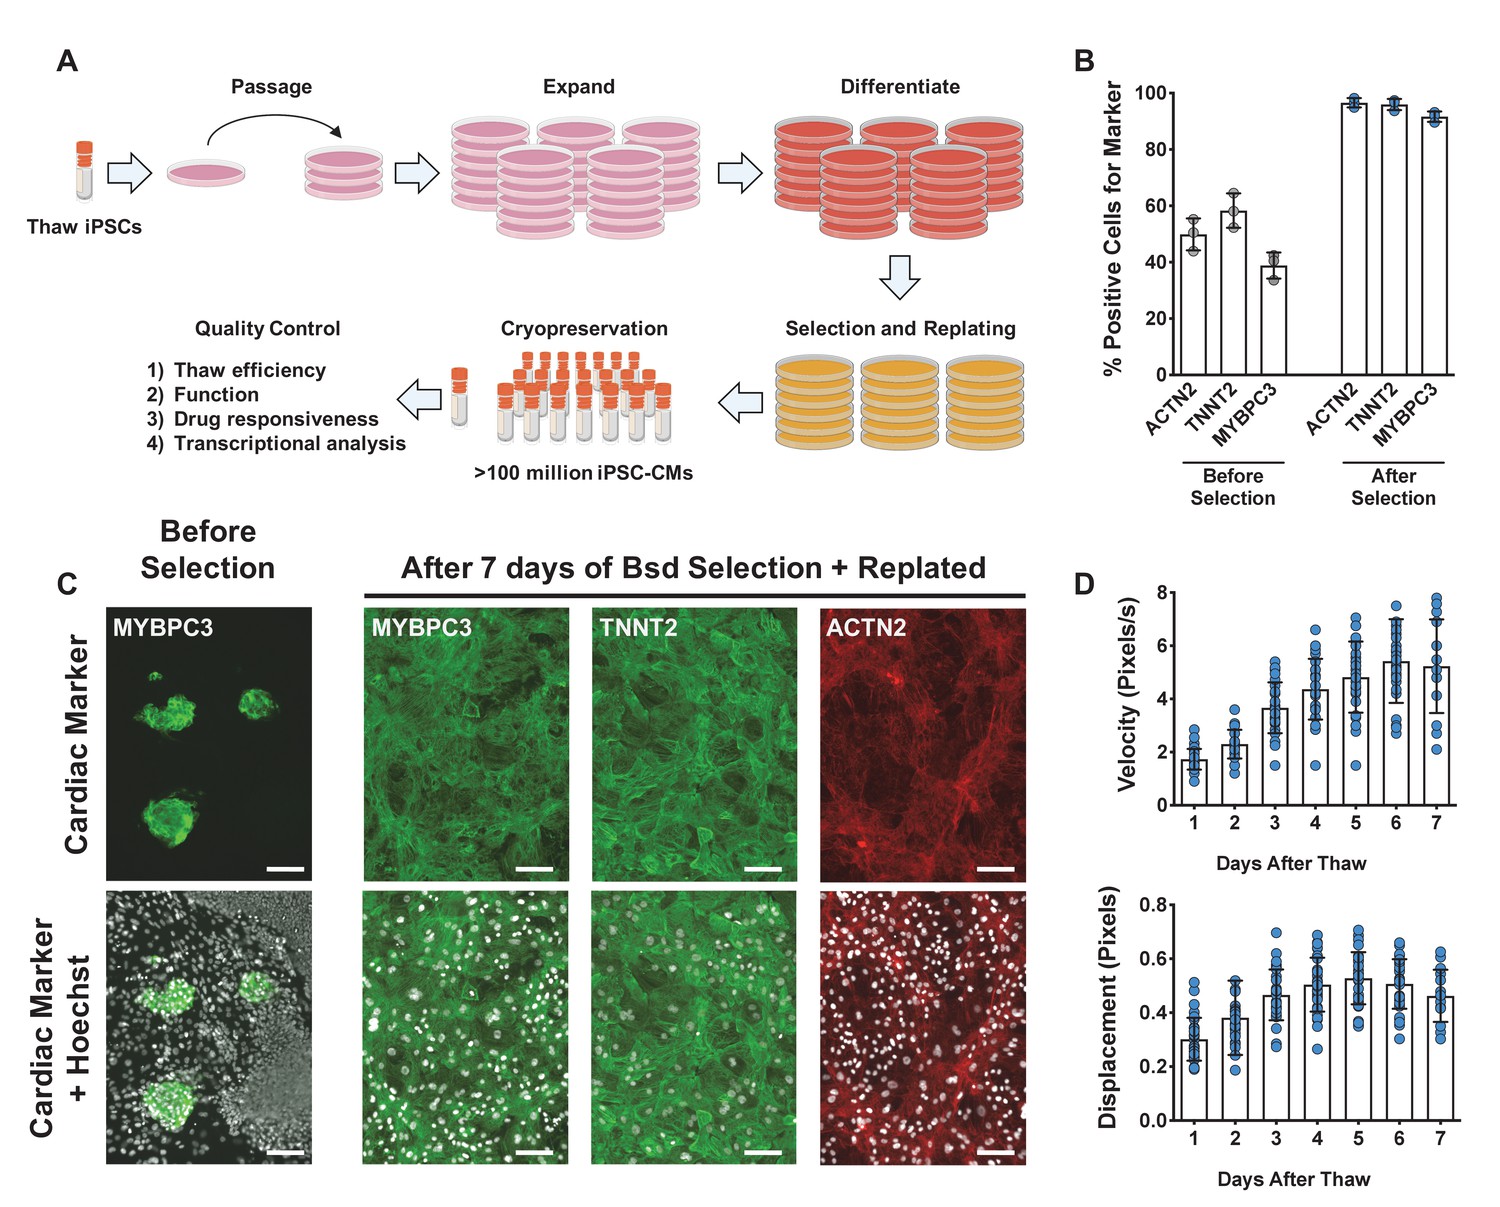
Overview of induced pluripotent stem cell-derived cardiomyocytes (iPSC-CM) differentiation, selection, cryopreservation, and recovery for high-content screening.
(A) Schematic representation of protocol for iPSC-CM differentiation, selection, and cryopreservation for high-content screening. (B) iPSC-CMs taken from a representative differentiation stained with ACTN2, TNNT2, and MYBPC3 before and after blasticidin (Bsd) selection. (C) Representative immunostaining of an unpurified population of iPSC-CMs before and after selection with blasticidin. iPSC-CMs were seeded as a monolayer for screening. Hoechst stain represented as pseudocolored-to-white for better visualization. Scale bars = 100 μm. (D) Blasticidin-purified iPSC-CMs from a representative batch were thawed and recovered for 7 days. Daily contractility metrics were performed to identify the optimal time for recovery of iPSC-CMs after thaw. n = 15–32 technical replicates per day. Error bars = SD.
-
Figure 1—source data 1
Overview of iPSC-CM differentiation, selection, cryopreservation, and recovery for high-content screening.
- https://cdn.elifesciences.org/articles/68714/elife-68714-fig1-data1-v2.xlsx
Figure 1—figure supplement 1
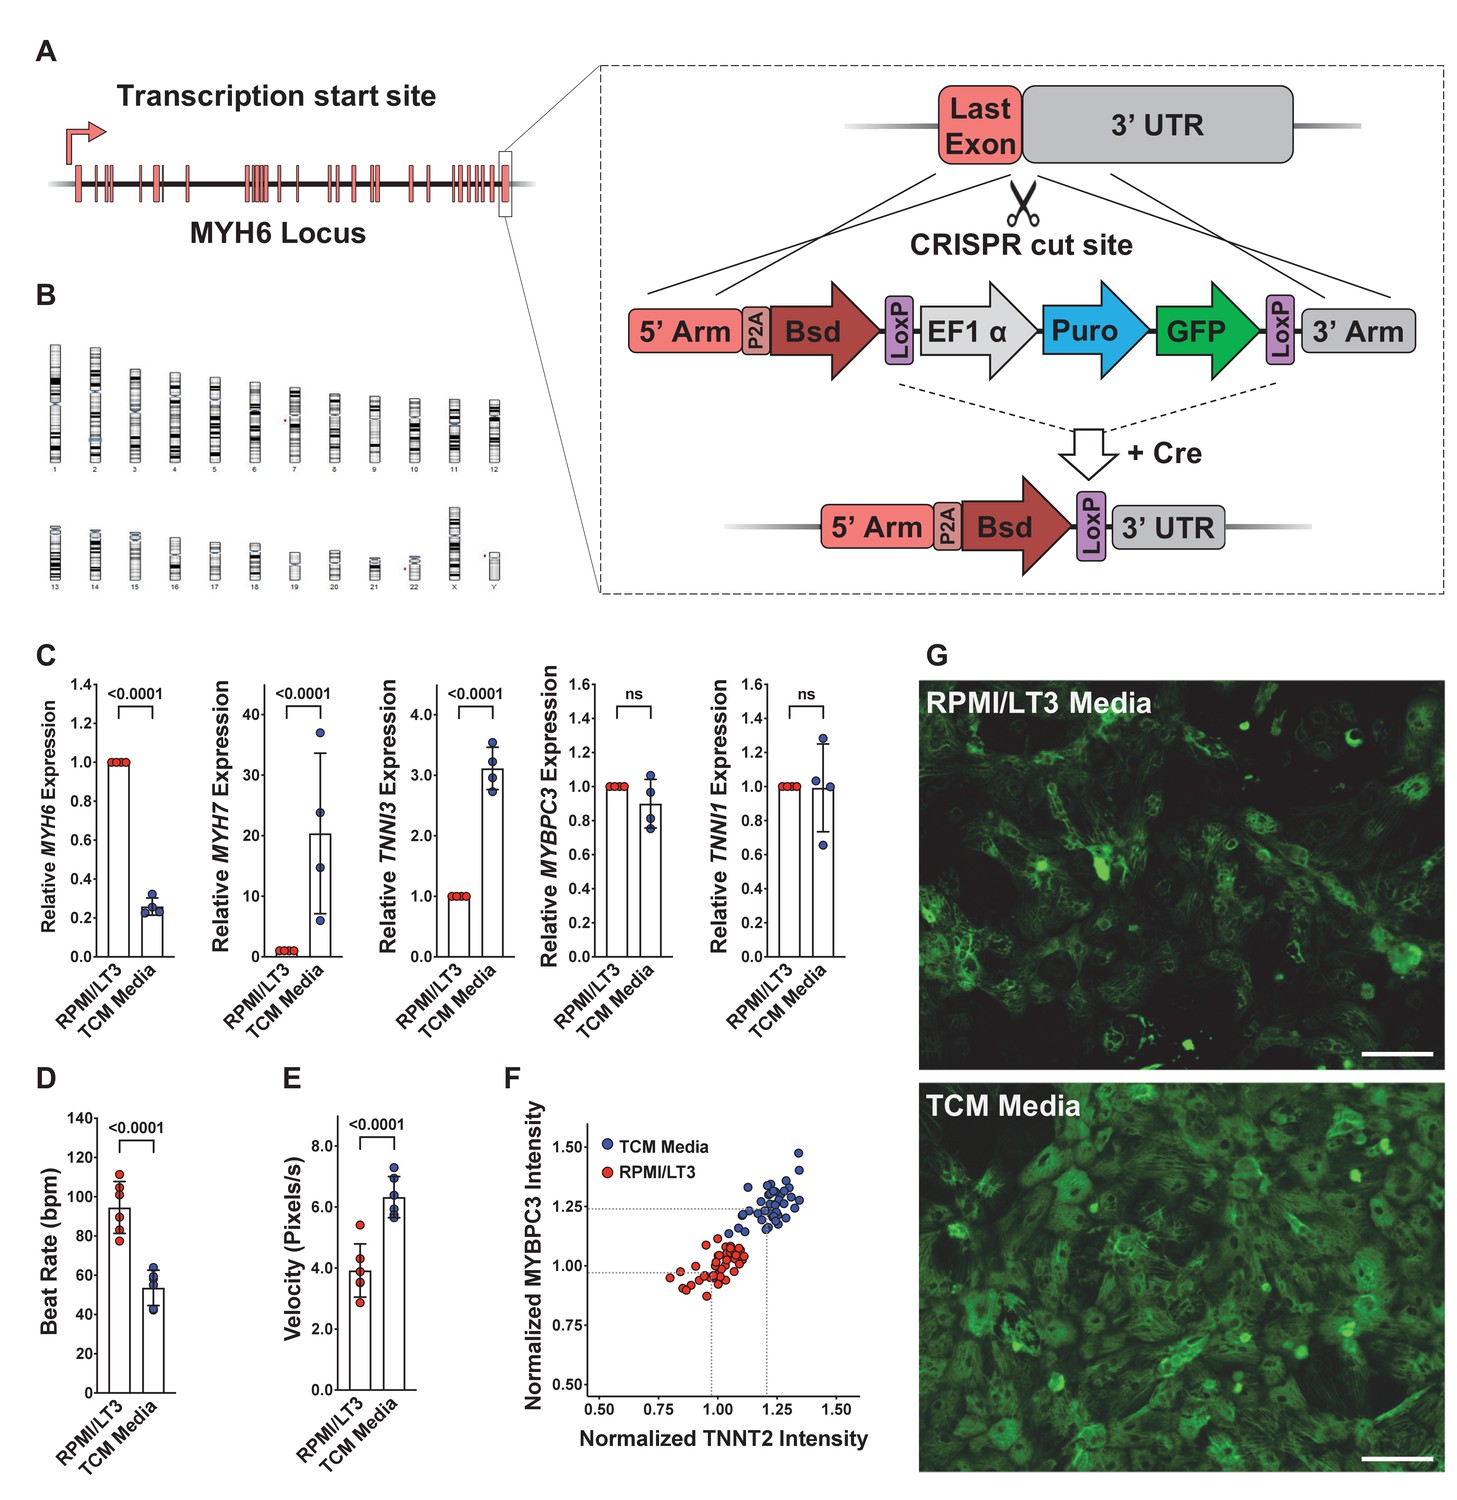
Characterization and culturing conditions of WTC-Bsd induced pluripotent stem cell (iPSC) line and differentiated cells.
(A) Schematic of knockin strategy of the blasticidin (Bsd) selection cassette into the endogenous MYH6 locus and subsequent Cre-excision of the Puro-selectable marker. (B) Single-nucleotide polymorphism karyotyping of the WTC-Bsd line showed no aberrant karyotypic abnormalities after genome engineering and clonal expansion. (C) Induced pluripotent stem cell-derived cardiomyocytes (iPSC-CMs) cultured in Tenaya’s cardiomyocyte (TCM) media showed significantly upregulated maturity markers (MYH7 and TNNI3) and downregulated neonatal myosin isoform (MYH6) compared with iPSC-CMs cultured in RPMI/LT3 media. Error bars = SD. ns: not significant. (D, E) iPSC-CMs recovered and cultured in TCM media showed a reduced spontaneous beat rate and increased velocity of contractions. Data collected from five independent differentiations (n = 40 technical replicates per differentiation). Error bars = SD. (F) A representative batch of iPSC-CMs recovered in TCM media, leading to greater intensity of cardiac sarcomere markers (MYBP3 and TNNT2) without affecting cell survival in culture. (G) Representative immunostaining of iPSC-CMs recovered in PRMI/LT3 media vs. TCM media. TCM media improved recovery of iPSC-CMs after thaw. Scale bars = 100 μm.
-
Figure 1—figure supplement 1—source data 1
Characterization and culturing conditions of WTC-Bsd iPSC line and differentiated cells.
- https://cdn.elifesciences.org/articles/68714/elife-68714-fig1-figsupp1-data1-v2.xlsx
Figure 2 with 1 supplement
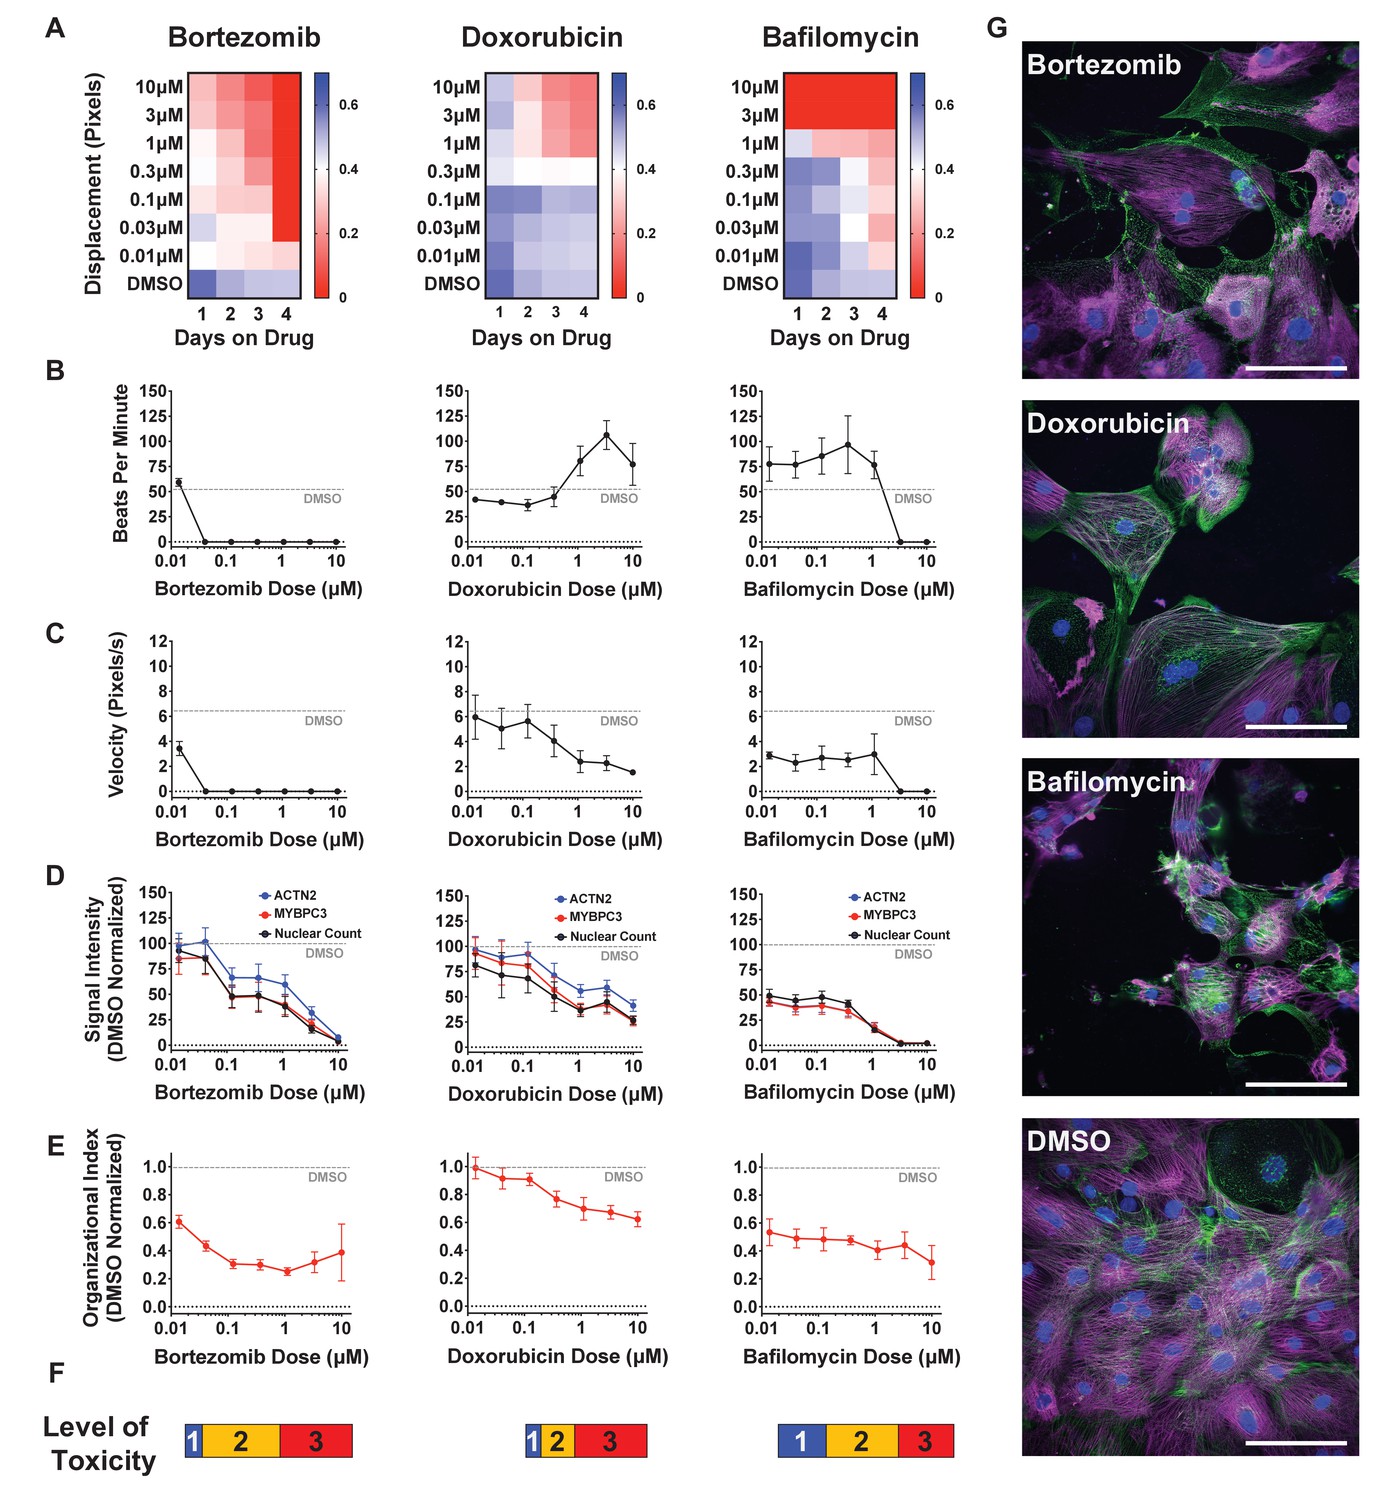
Effect of representative cardiotoxins on inducing structural toxicity in induced pluripotent stem cell-derived cardiomyocytes (iPSC-CMs).
(A) Displacement of iPSC-CMs was measured as a function of dose and duration of exposure to drug. Results from three representative cardiotoxins (bortezomib, doxorubicin, and bafilomycin) are displayed as a heatmap. (B, C) Contractility measures of beats per minute and velocity on the fourth day of drug exposure as a function of drug dose. Data indicate a time- and dose-dependent decline in contractility. Error bars = SD; n = 8 technical replicates per drug dose, n = 26 for dimethyl sulfoxide (DMSO) group. (D) Signal intensities of sarcomeres stained with antibodies against MYBPC3 and ACTN2 were measured using total fluorescent staining and normalized to DMSO control. Nuclear count was quantified and normalized to DMSO control. Dashed gray line, DMSO control condition. Error bars = SD; n = 8 technical replicates per drug dose, n = 26 for DMSO group. (E) Relative sarcomere organization quantified using scanning gradient Fourier transform and normalized to DMSO control. The organizational index refers to the average Fourier strength measured across the image. Error bars = SD; n = 8 technical replicates per drug dose, n = 26 for DMSO group. (F) Levels of structural toxicity for each drug were binned into the three categories of highly toxic (class 3), toxic (class 2), and mildly toxic (class 1). (G) Representative immunostaining of levels of structural toxicity in iPSC-CMs treated with bortezomib (30 nM), doxorubicin (100 nM), and bafilomycin (100 nM). Magenta, MYBPC3; green, ACTN2. Scale bars = 100 μm.
-
Figure 2—source data 1
Effect of representative cardiotoxins on inducing structural toxicity in iPSC-CMs.
- https://cdn.elifesciences.org/articles/68714/elife-68714-fig2-data1-v2.xlsx
Figure 2—figure supplement 1
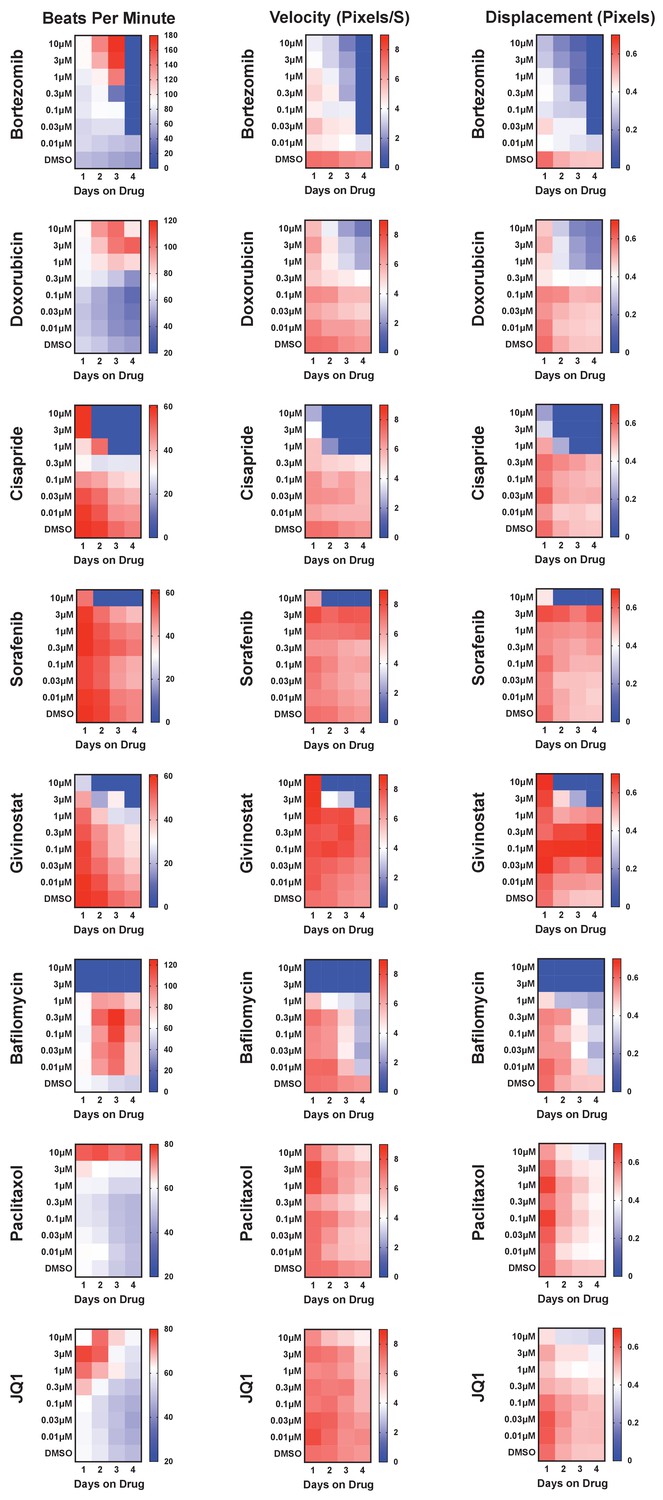
Known cardiotoxins were used to establish levels of functional toxicity in induced pluripotent stem cell-derived cardiomyocytes (iPSC-CMs).
Eight known cardiotoxins that target various biological processes were used to establish training for deep learning models. The cardiotoxins included bortezomib (proteasome inhibitor), doxorubicin (topoisomerase inhibitor), cisapride (serotonin 5-HT4 receptor agonist), sorafenib (tyrosine kinase inhibitor), givinostat (histone deacetylase inhibitor), bafilomycin (vacuolar-type H+-ATPase), paclitaxel (microtubule stabilizer), and JQ1 (BET bromodomain inhibitor). For each drug, beat rate, velocity of contraction, and displacement were measured as a function of dose and time of exposure to the drug. Measurements are displayed as a heatmap. In most cases, the contraction velocity and displacement time- and dose-dependently declined alongside reduced beat rate.
Figure 3 with 1 supplement
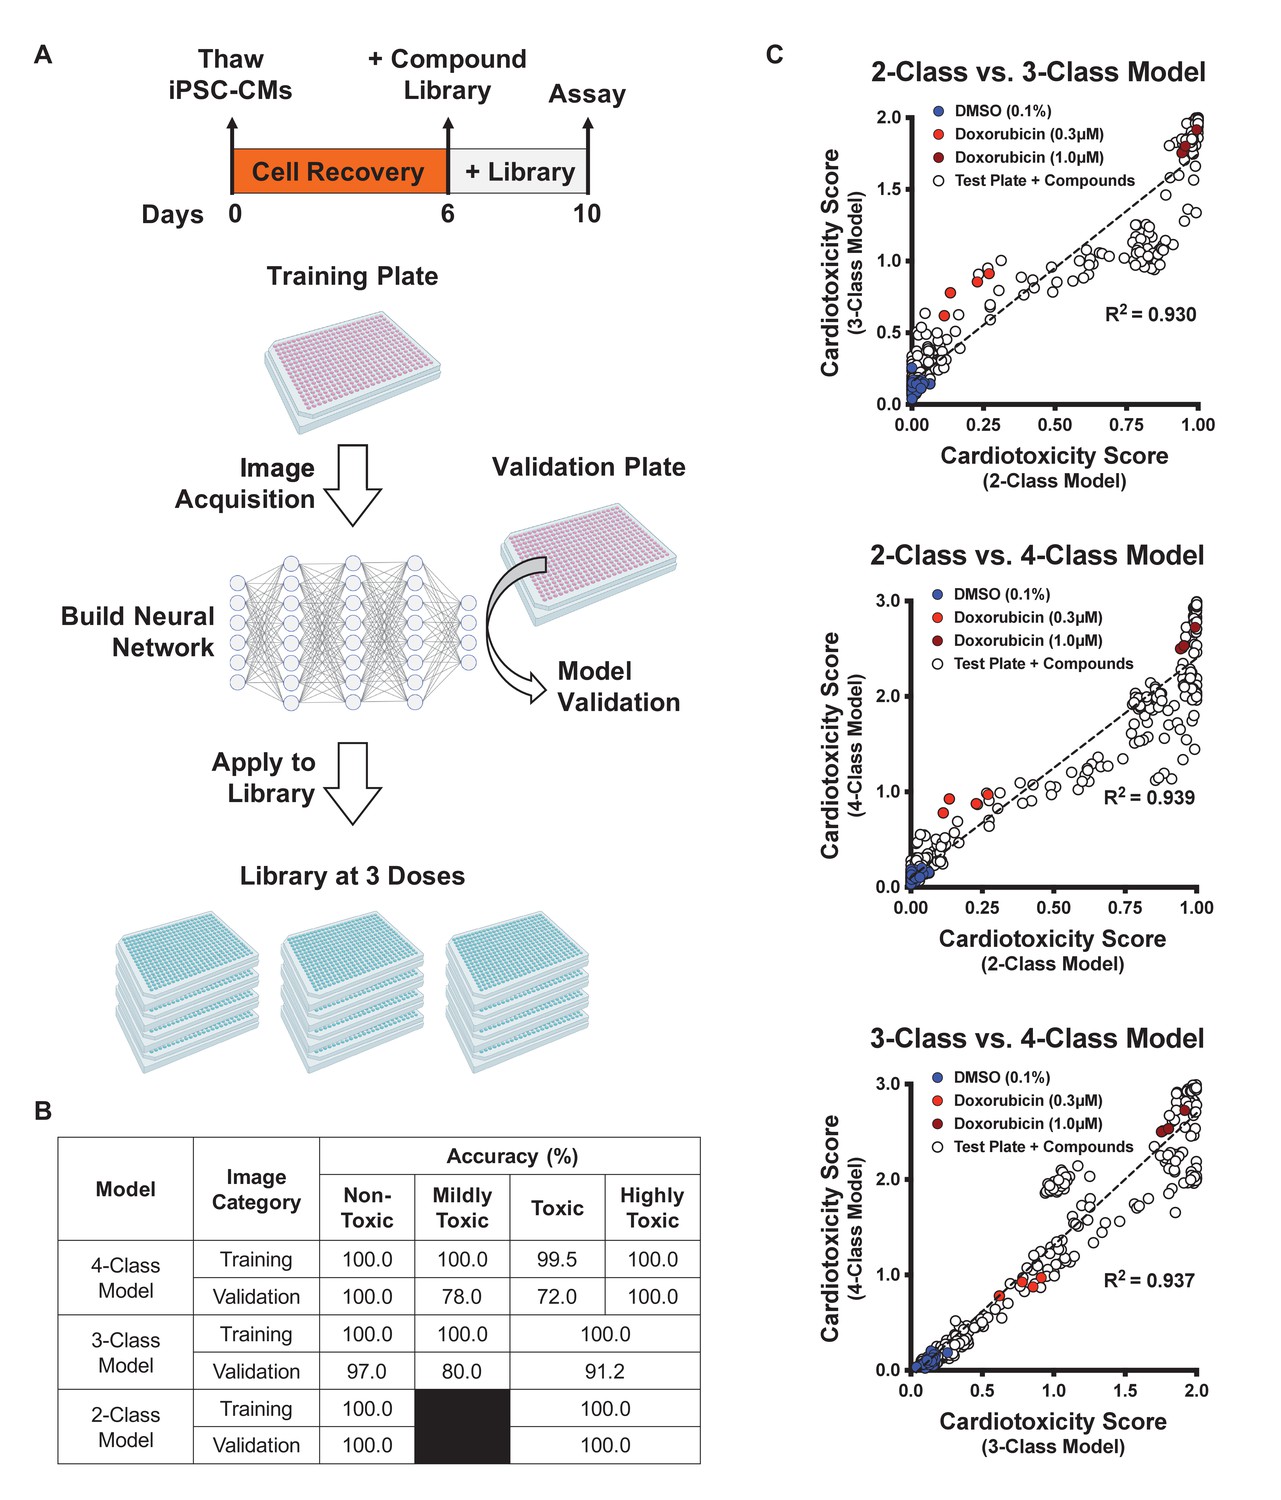
Schematic of drug screening and deep learning approach.
(A) Induced pluripotent stem cell-derived cardiomyocytes (iPSC-CMs) were thawed and allowed to recover for 6 days. Two plates were designated for training and validating the deep learning models. iPSC-CMs were then treated with known cardiotoxins (doses ranging from 10 nM to 10 μM) in the training and validation plates for 4 days. In parallel, a library of 1280 bioactive compounds was added to iPSC-CMs at three doses (0.3 μM, 1.0 μM, and 3.0 μM) for 4 days. (B) Deep learning accuracies compared across the three models. All models show more than 95% accuracy in identifying the non-toxic dimethyl sulfoxide (DMSO)-treated condition (class 0). Model accuracies were lower when attempting to distinguish mildly toxic, toxic, and highly toxic classes. (C) The three deep learning models compared in a two-dimensional plot on the validation plate. Regardless of how each model was trained (based on the defined images fed into the neural network), all models were strongly correlated when analyzing the validation dataset (R2 > 0.93). The DMSO-treated cells scored the lowest in toxicity, and doxorubicin-treated (1 μM) cells scored the highest. The mildly toxic class (doxorubicin at 0.3 μM) showed an intermediate toxicity separated from the non-toxic and highly toxic classes.
-
Figure 3—source data 1
Schematic of drug screening and deep learning approach.
- https://cdn.elifesciences.org/articles/68714/elife-68714-fig3-data1-v2.xlsx
Figure 3—figure supplement 1

Optimization of cell seeding density and model performance.
(A, B) Induced pluripotent stem cell-derived cardiomyocytes (iPSC-CMs) were seeded at various densities in a 384-well plate and treated with dimethyl sulfoxide (DMSO; 0.1%), bortezomib (0.1 μM), and doxorubicin (1.0 μM) for 4 days. The 2-class deep learning models were established (DMSO vs. cardiotoxin), and model accuracies were plotted as a function of cell seeding density. Validation accuracies and Z-factors increased with greater cell density. A minimum threshold of approximately 1500 cells per well is required to obtain high validation accuracies and a suitable screening Z-factor of approximately 0.5. (C) Training and validation accuracies are plotted as a function of epochs. Two representative cell seeding densities are plotted, showing a higher cell density leads to significantly better model performance. (D) Cells were scored against models built with various input numbers of cells showing that higher cell density leads to better separation of the DMSO vs. cardiotoxin controls. Lower cell density leads to significant overlap between the DMSO vs. cardiotoxin controls, while higher cell densities show maximal separation. Bort, bortezomib; Doxo, doxorubicin. Error bars = SD.
-
Figure 3—figure supplement 1—source data 1
Optimization of cell seeding density and model performance.
- https://cdn.elifesciences.org/articles/68714/elife-68714-fig3-figsupp1-data1-v2.xlsx
Figure 4 with 1 supplement
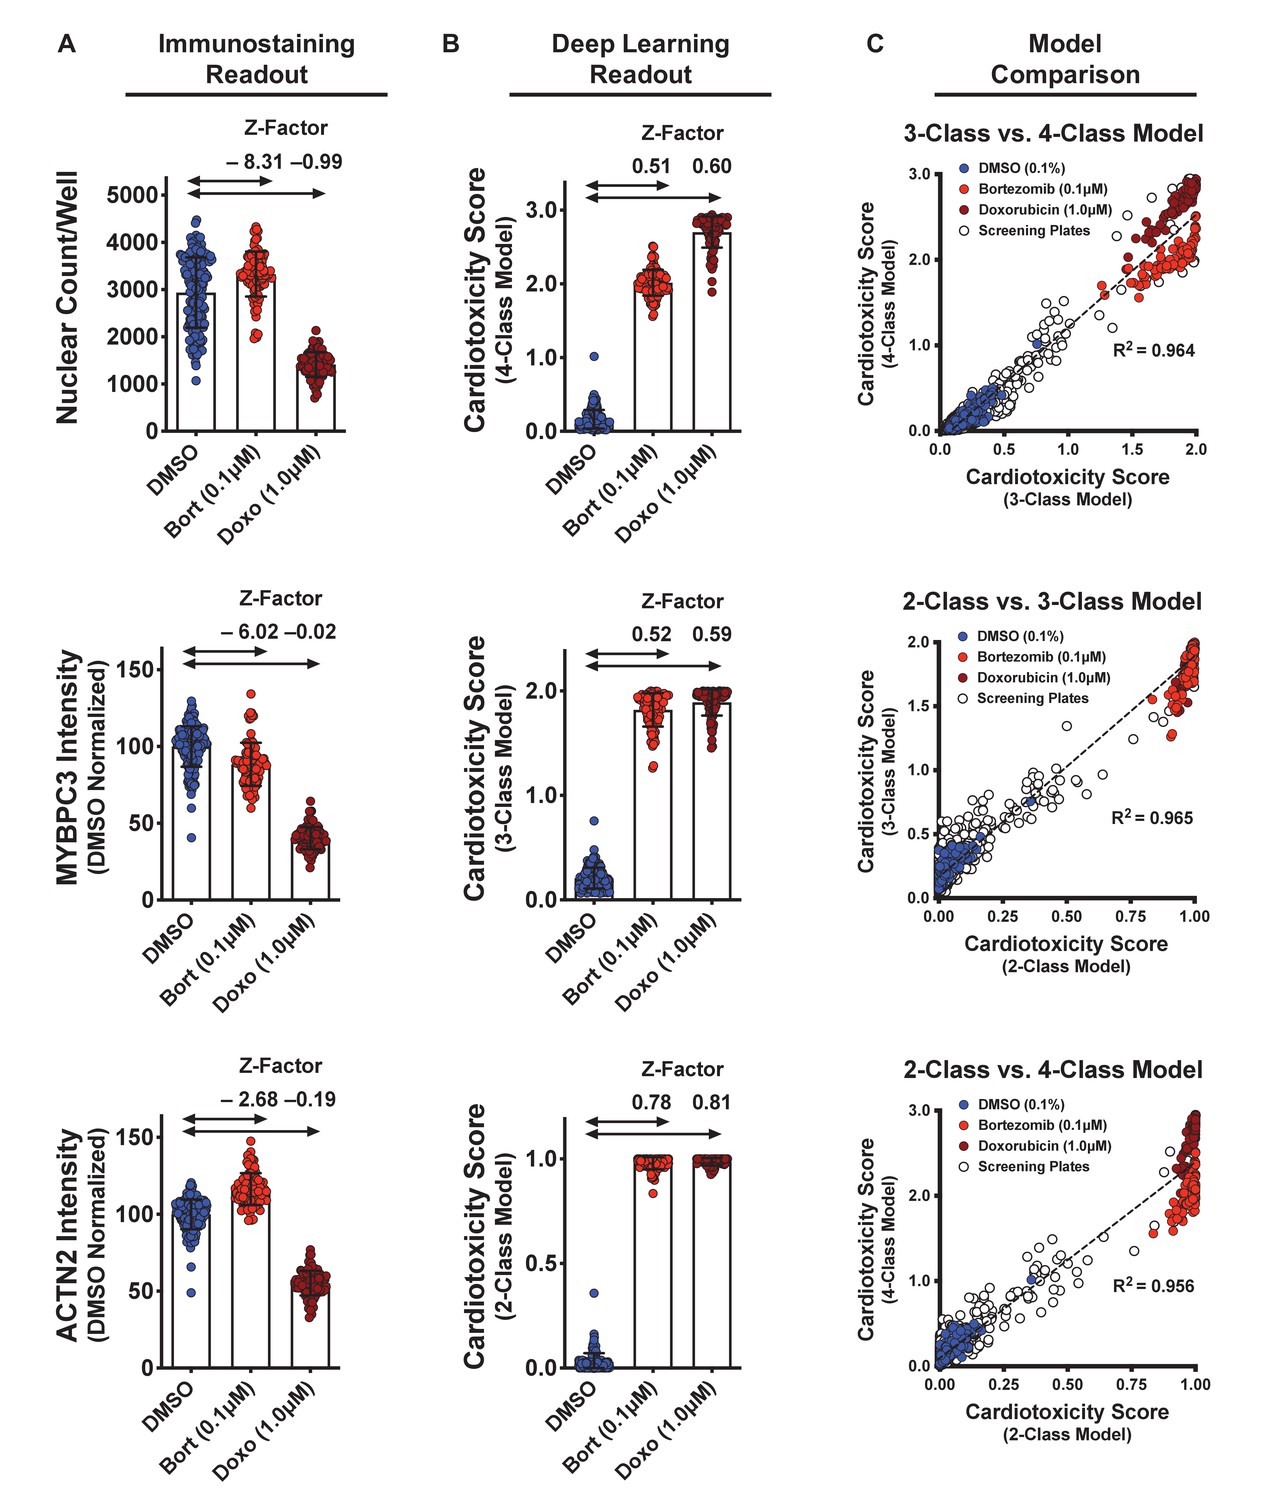
Dynamic range and Z-factors of positive and negative controls in screening plates.
(A) Comparison of Z-factor of nuclear count and MYBPC3 and ACTN2 staining intensities for dimethyl sulfoxide (DMSO) vs. bortezomib (Bort; 0.1 μM) and doxorubicin (Doxo; 1 μM). The Z-factors (< 0) and the limited dynamic range of the nuclear count and sarcomere intensities prevent reliable separation of positive and negative controls. Error bars = SD. (B) While using deep learning (regardless of how the models are trained), the dynamic range and Z-factors (> 0.5) enable identification of the toxic controls from the DMSO condition. Error bars = SD. (C) Cardiotoxicity scores from all screening wells at three doses of DMSO, bortezomib, and doxorubicin controls are compared in various deep learning models. Regardless of how each deep learning model was trained, cardiotoxicity scores from all three models had strong correlation when applied to the screening plates (R2 > 0.95).
-
Figure 4—source data 1
Dynamic range and Z-factors of positive and negative controls in screening plates.
- https://cdn.elifesciences.org/articles/68714/elife-68714-fig4-data1-v2.xlsx
Figure 4—figure supplement 1
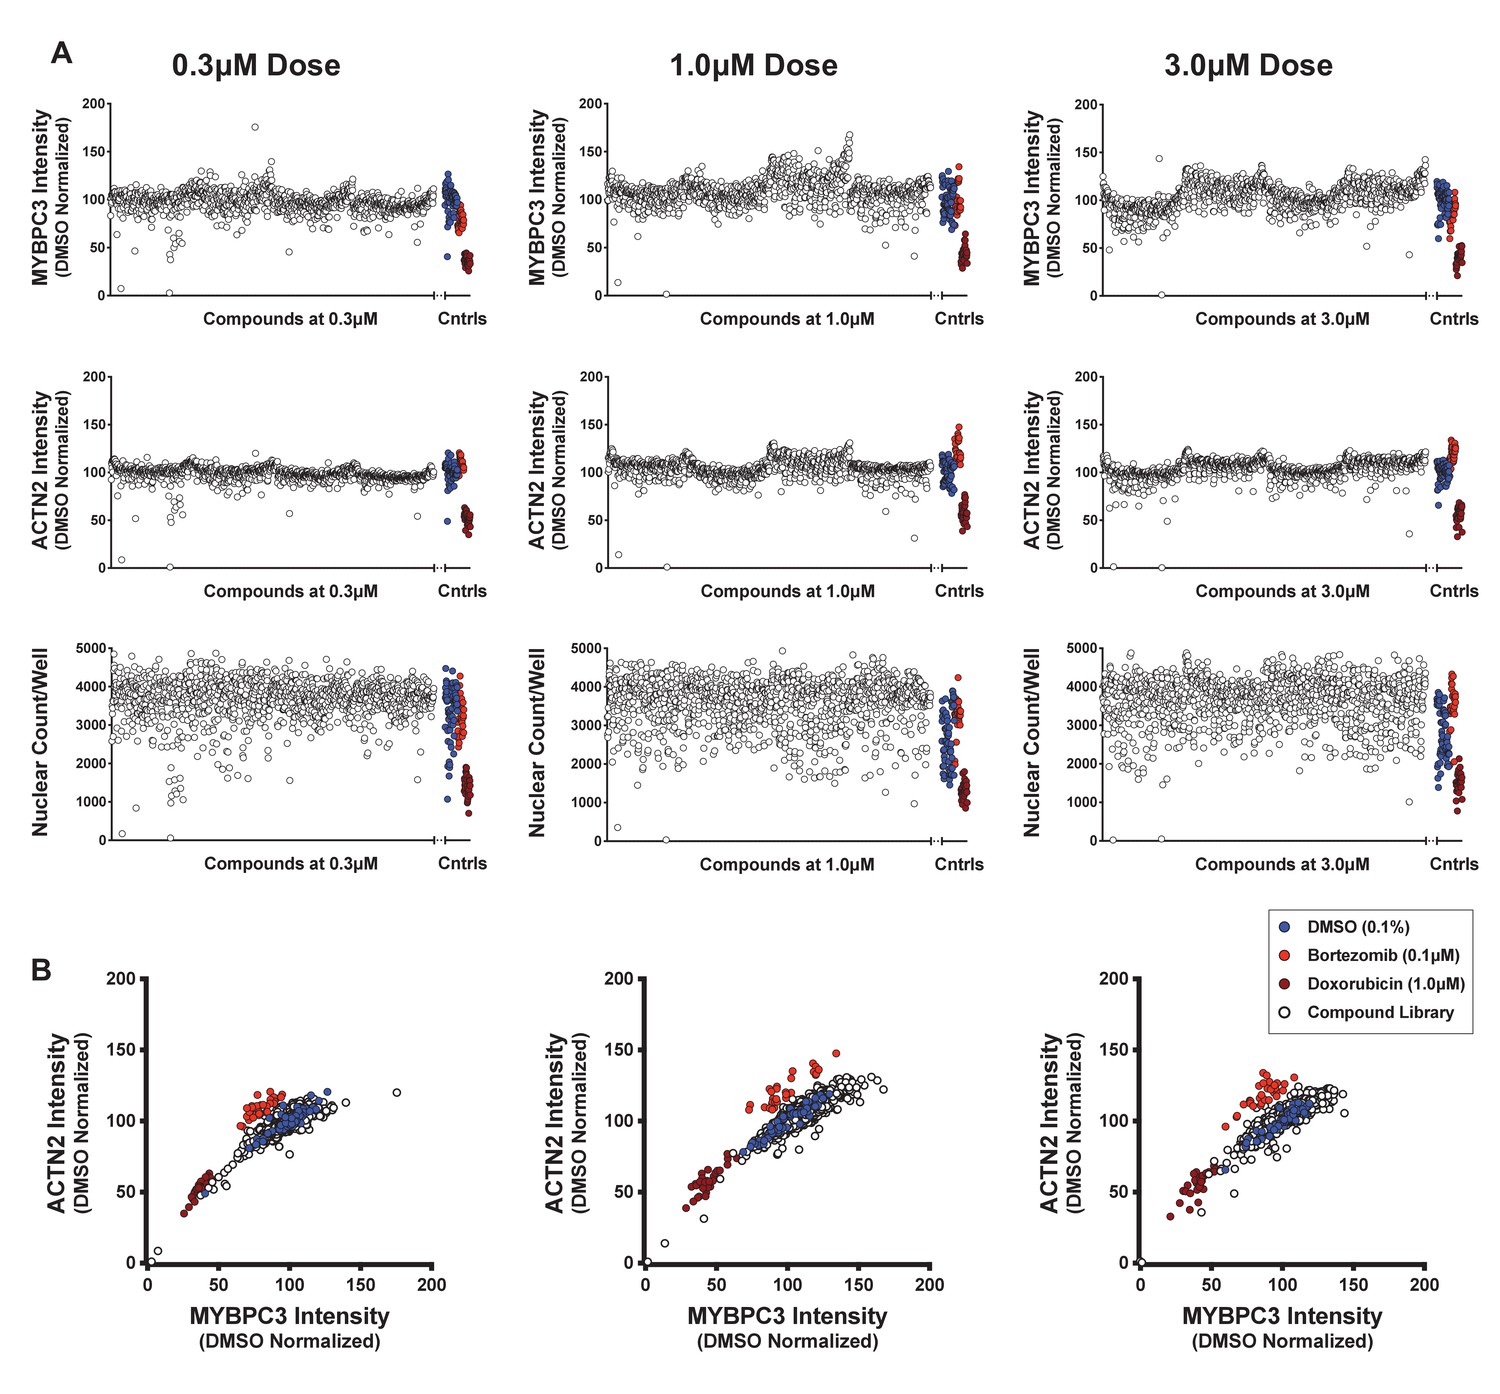
Sarcomere intensity and nuclear count on screening plates at three doses.
(A) Signal intensity and sarcomere content in screening plates using antibodies against MYBPC3 and ACTN2. Nuclear count was measured using Hoechst stain. (B) Two-dimensional plots of MYBPC3 and ACTN2 signal intensity show a good correlation between the two sarcomeric stains. Dimethyl sulfoxide (DMSO) (0.1%), bortezomib (0.1 μM), and doxorubicin (1.0 μM) are used as internal controls.
-
Figure 4—figure supplement 1—source data 1
Sarcomere intensity and nuclear count on screening plates at three doses.
- https://cdn.elifesciences.org/articles/68714/elife-68714-fig4-figsupp1-data1-v2.xlsx
Figure 5 with 2 supplements
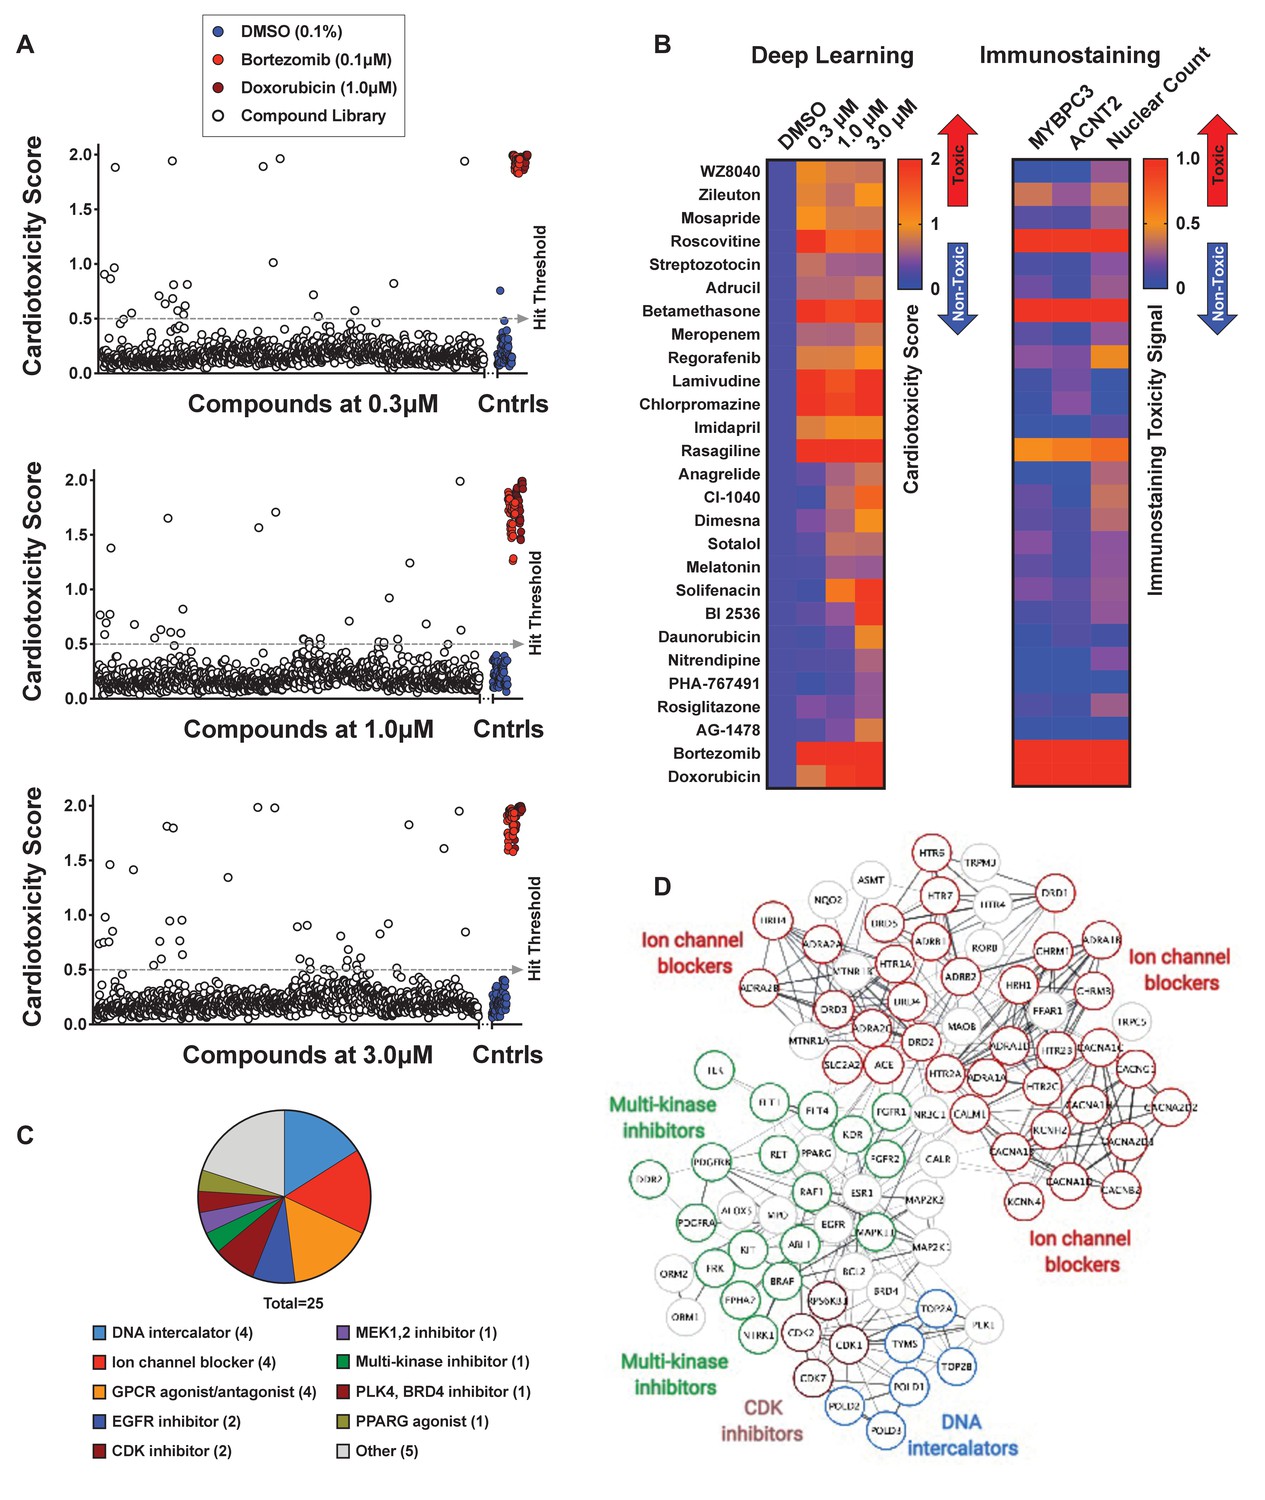
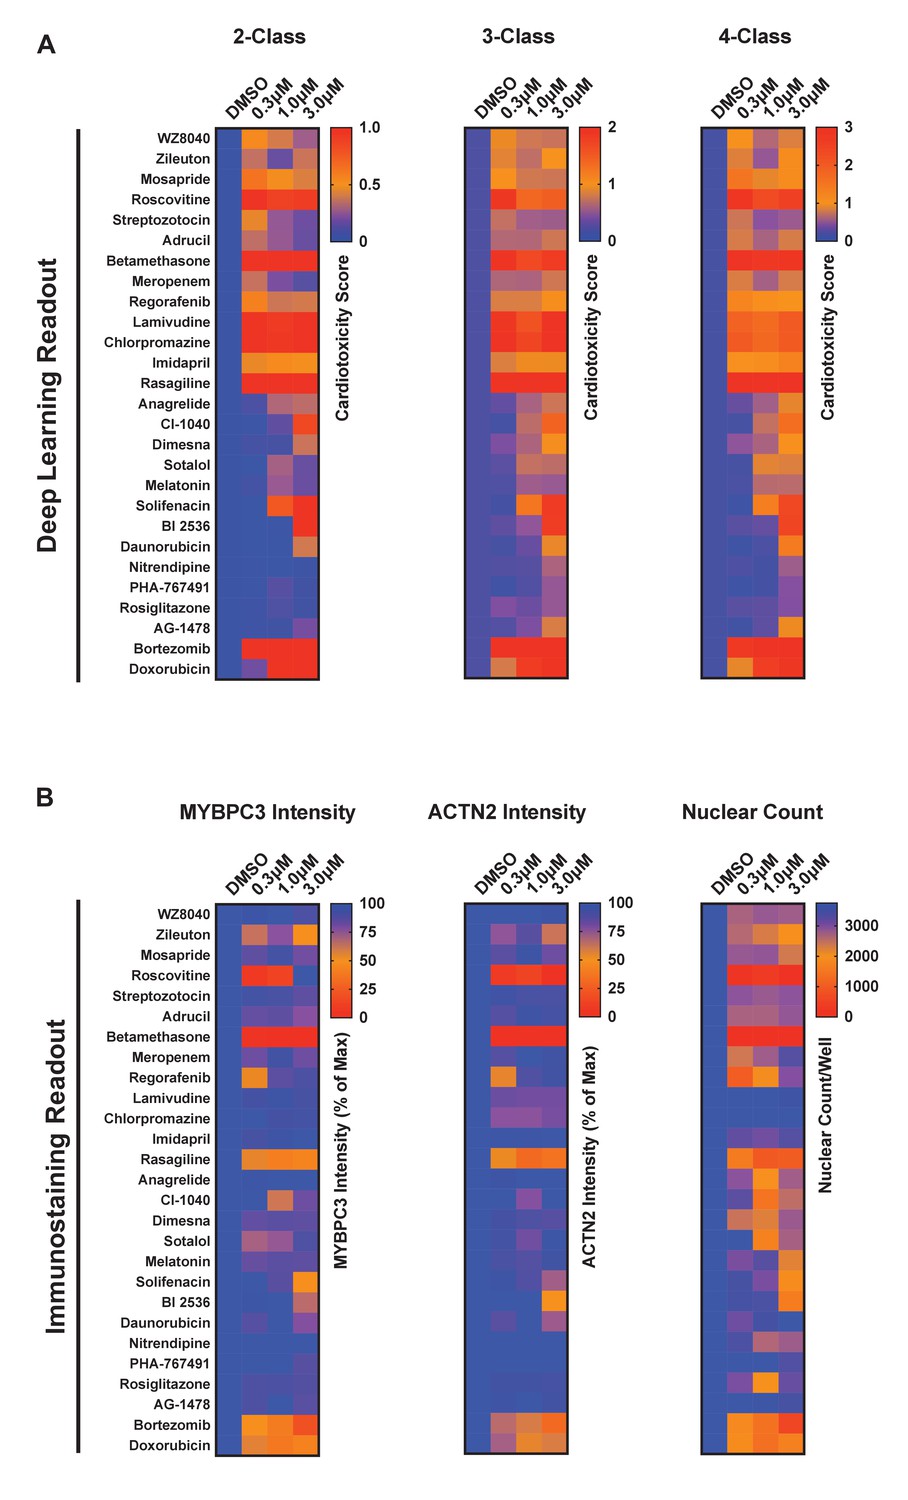
Screen of bioactive compound library and identified cardiotoxic hits.
(A) Cardiotoxicity score from screening 1280 bioactive compounds at three doses. Data from the 3-class deep learning model are plotted. Higher scores correspond to a higher probability of a cardiotoxicity signature. Bortezomib and doxorubicin were used as cardiotoxic controls (Cntrls). (B) Cardiotoxicity heatmap scores of top 25 cardiotoxic hits based on deep learning signal. The immunostaining signal is also displayed as a heatmap. Drugs and doses with cardiotoxicity signals in induced pluripotent stem cell-derived cardiomyocytes (iPSC-CMs) are indicated in red and yellow, while non-toxic drugs are indicated in blue. Signal intensity from immunostaining and nuclear count was normalized to the dimethyl sulfoxide (DMSO) control and converted to a toxicity scale. Based on the generated heatmaps, phenotypic screening with deep learning is more sensitive in detecting signals than pure immunostaining assays. (C) Target class composition of top cardiotoxic hits from the screen, including DNA intercalators and ion channel blockers, as well as epidermal growth factor receptor (EGFR), cyclin-dependent kinase (CDK), and multi-kinase inhibitors. (D) Search Tool for the Retrieval of Interacting Genes/Proteins (STRING) protein-protein interaction network was used to identify interactions between drug targets (nodes) identified through the PRISM repurposing dataset. Seven clusters in four protein families of DNA (green), multi-kinase (light blue), ion channels (dark blue), and CDK (red) were found based on the highest number of interactions. The minimum required interaction score was set to 0.4, and the edge thickness indicated the degree of data support.
-
Figure 5—source data 1
Screen of bioactive compound library and identified cardiotoxic hits.
- https://cdn.elifesciences.org/articles/68714/elife-68714-fig5-data1-v2.xlsx
Figure 5—figure supplement 1
Screening results and hit identification.
(A) Cardiotoxicity scores of putative hits from screening 1280 compounds at three doses using the 2-class, 3-class, and 4-class deep learning models. Based on the cardiotoxicity score across the three doses, putative hits were clustered into high-risk, medium-risk, and low-risk categories. (B) Toxicity scores based on immunostaining data using MYBPC3 and ACTN2 antibodies, and cytotoxicity based on nuclear count.
-
Figure 5—figure supplement 1—source data 1
Screening results and hit identification.
- https://cdn.elifesciences.org/articles/68714/elife-68714-fig5-figsupp1-data1-v2.xlsx
Figure 5—figure supplement 2
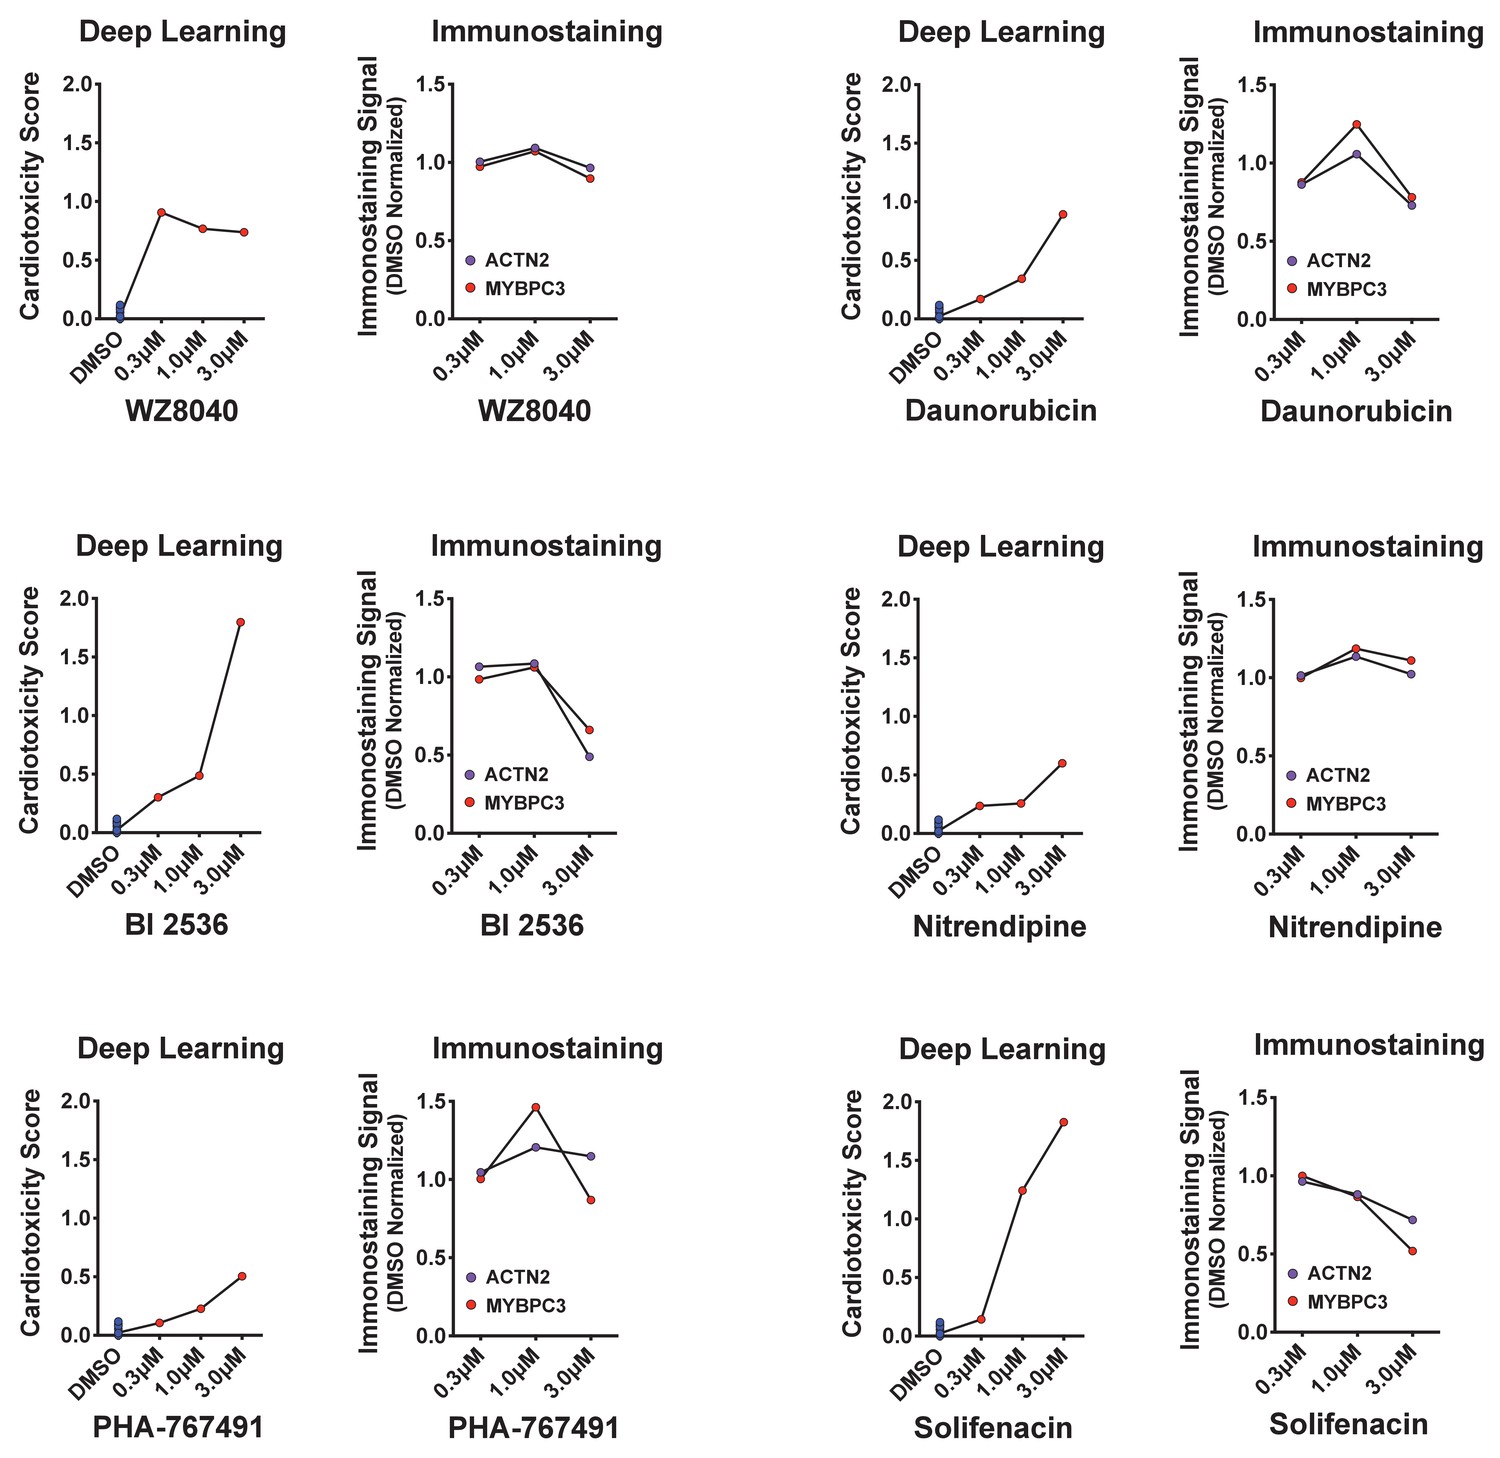
Deep learning vs. immunostaining analysis.
Cardiotoxicity scores of six putative hits from the primary screen show a dose-dependent increase in the cardiotoxicity score. Loss of MYBPC3 and ACTN2 immunostaining signal intensity failed to identify a strong toxicity signal (except the 3 μM dose for BI-2536, daunorubicin, and solifenacin).
Figure 6 with 1 supplement
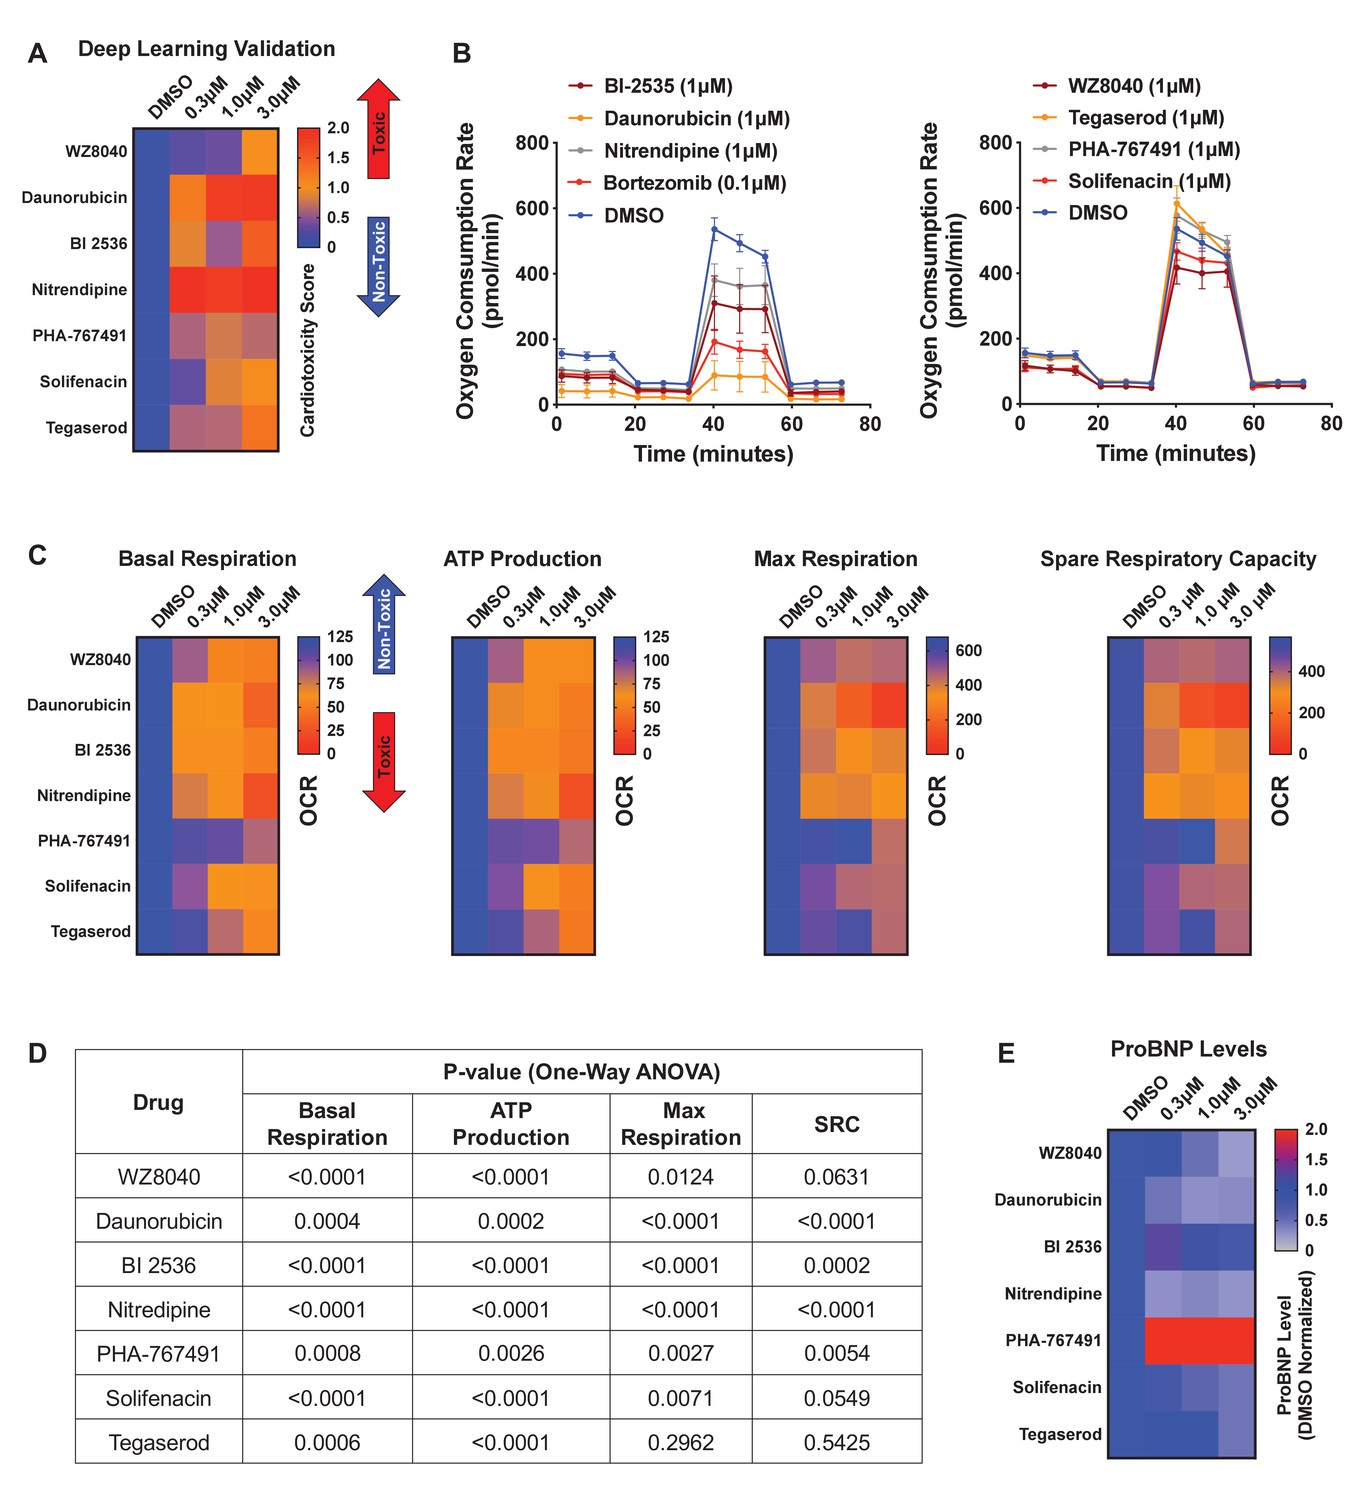
Hit validation using deep learning and orthogonal assay analysis.
(A) Cardiotoxicity heatmap scores for validation of seven compounds: six cardiotoxic hits from the primary screen and tegaserod (known to cause cardiotoxicity and withdrawn from the market). (B) Kinetic plots of oxygen consumption rates for the seven compounds and bortezomib as another control. Kinetic data from only the 1 μM dose is plotted. Error bars = SD. (C) Heatmaps for basal respiration, adenosine triphosphate (ATP) production, maximal respiration, and spare respiratory capacity. BI-2535, daunorubicin, nitrendipine, and bortezomib had the largest effect on basal respiration, ATP production, and maximal respiration. The oxygen consumption rate (OCR) was measured as pmol/min/nuclear count. (D) All seven compounds show significantly different basal respiration and ATP production (one-way ANOVA). All drugs, except tegaserod, show significantly different maximal respiration. SRC: spare respiratory capacity. (E) Heatmaps for ProBNP levels show that PHA-767491 elevates ProBNP levels at all three doses. All other drugs showed no change or a slight decrease in ProBNP levels, suggesting that ProBNP is the least-sensitive marker to assess cardiotoxicity and cellular stress.
-
Figure 6—source data 1
Hit validation using deep learning and orthogonal assay analysis.
- https://cdn.elifesciences.org/articles/68714/elife-68714-fig6-data1-v2.xlsx
Figure 6—figure supplement 1
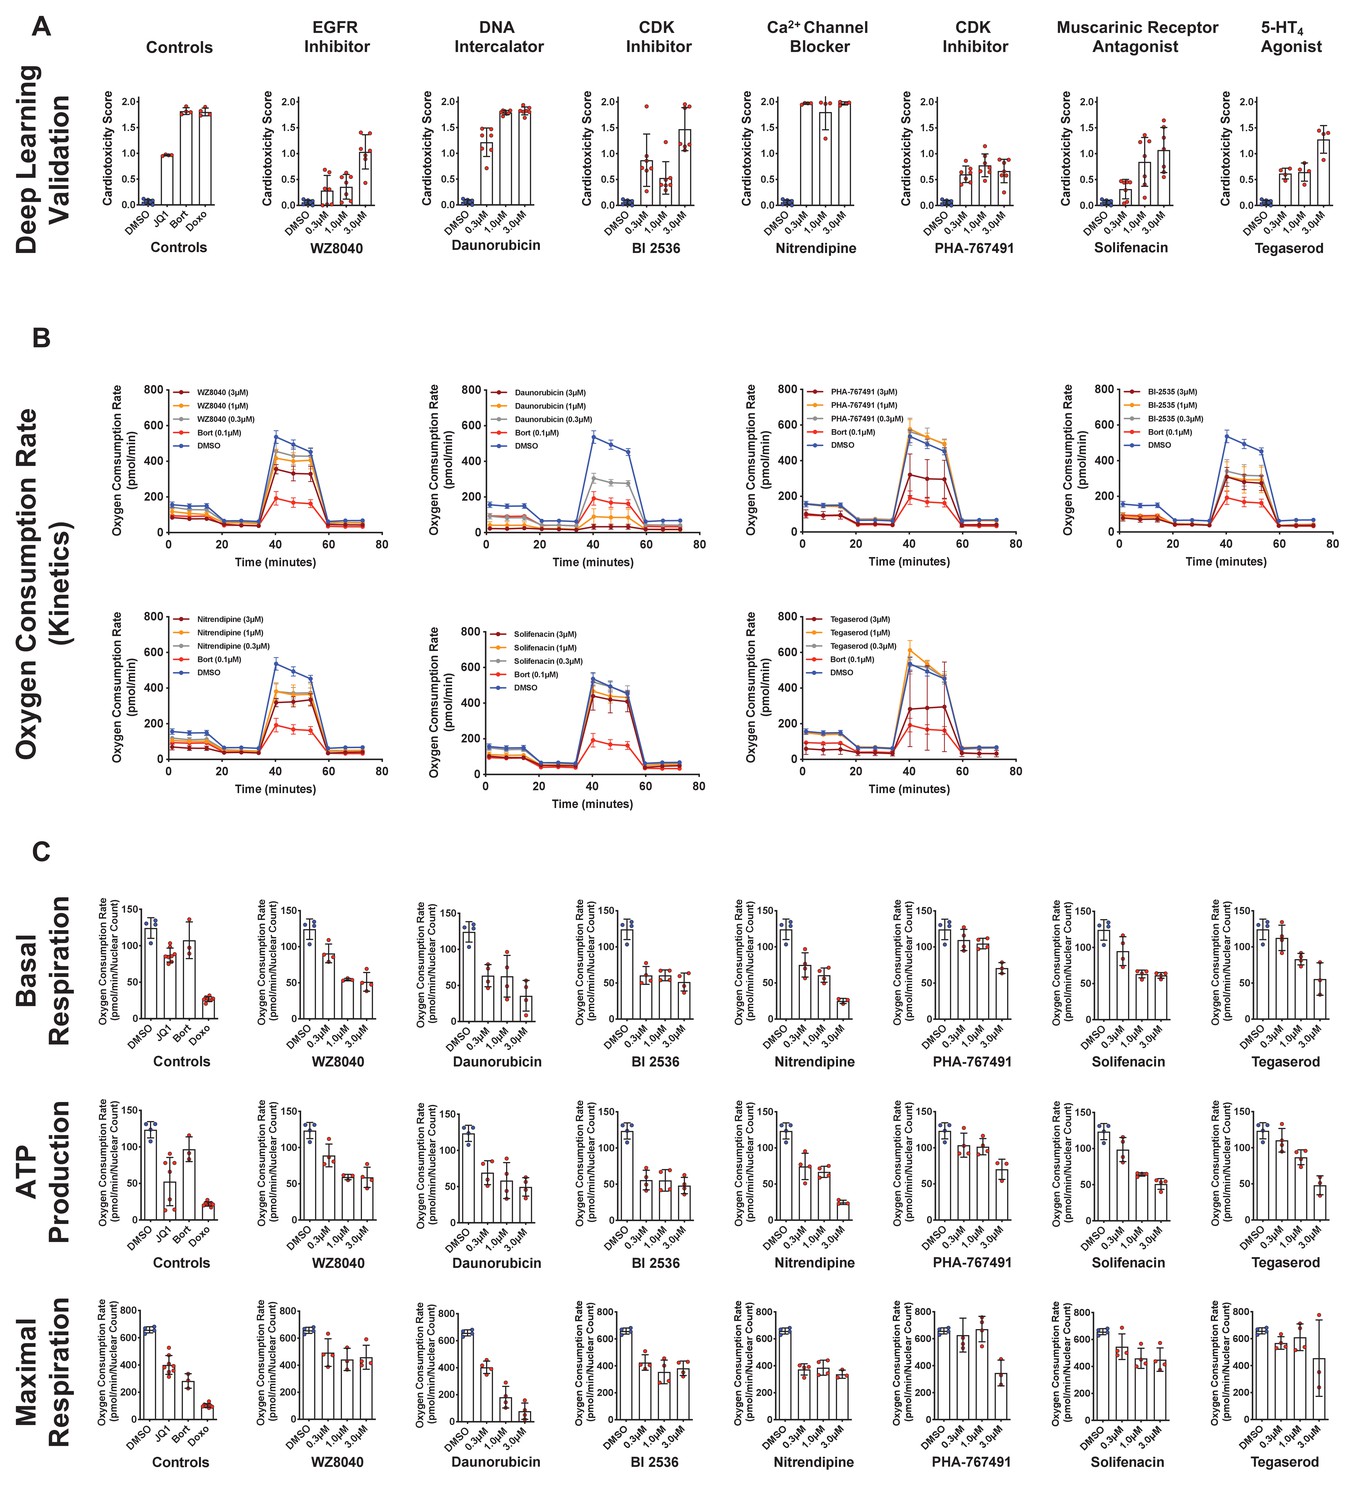
Validation using deep learning and mitochondrial respiration.
(A) Deep learning validation of cardiotoxicity scores of six putative hits from the primary screen, along with tegaserod and known toxic controls (bortezomib [Bort], doxorubicin [Doxo], and JQ1). The higher the cardiotoxicity score, the higher the toxicity of the compound. n = 3–8 technical replicates per compound per dose. Error bars = SD. (B) Kinetic plots for oxygen consumption rates for six cardiotoxic hits, along with tegaserod and bortezomib as controls. Kinetic data from all three tested doses (0.3–3 μM) is plotted. Error bars = SD. (C) Orthogonal validation was performed using mitochondrial respiration assay after exposure to the identified toxic drugs and known controls. Basal respiration, ATP production, and maximal respiration show a significant decline compared to the dimethyl sulfoxide (DMSO)-treated condition. Error bars = SD.
Figure 7
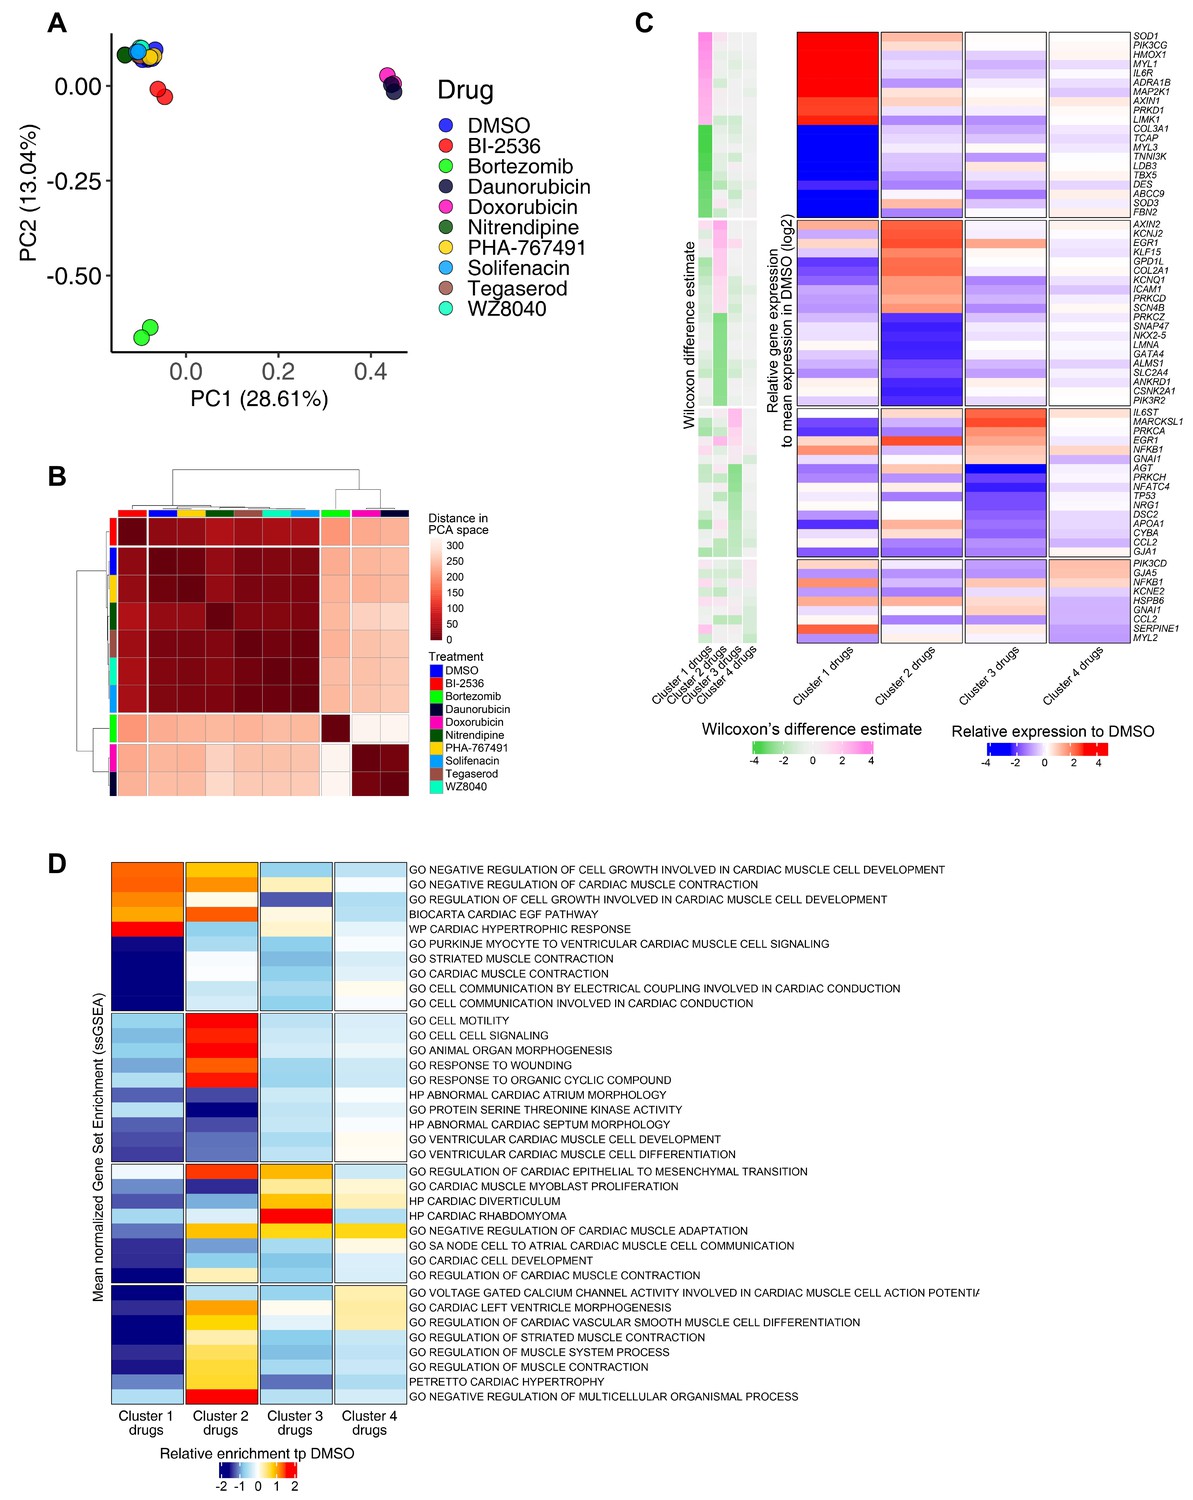
RNA-seq analysis of induced pluripotent stem cell-derived cardiomyocytes (iPSC-CMs) treated with candidate cardiotoxic drugs reveals distinct clusters associated with altered gene expression.
(A) Principal component analysis (PCA) scatter plot representing the extent of transcriptional perturbation compared with dimethyl sulfoxide (DMSO)-treated iPSC-CMs. Overlapping replicates for each drug indicate very high precision of the experiment. Daunorubicin and doxorubicin on principal component 1 (PC1) and bortezomib on PC2 show the most different transcriptional profile compared to the DMSO-treated group. Note that daunorubicin and doxorubicin (both DNA intercalators) cluster together. Clustering of other drugs with the control group indicates relatively modest changes when compared with bortezomib, daunorubicin, and doxorubicin. (B) PCA-based hierarchical clustering of similarity matrix shows four distinct clusters of gene expression pattern: bortezomib (cluster 1); daunorubicin and doxorubicin (cluster 2); BI-2536 (cluster 3); and nitrendipine, PHA-767491, solifenacin, tegaserod, and WZ8040 (cluster 4). Cluster 4 shows a gene expression profile closer to the DMSO control group. (C) Heatmap of the most differentially abundant cardiac tissue-enriched genes in each drug cluster versus the DMSO-treated group. Each drug cluster shows up to five most differentially expressed genes (false discovery rate [FDR] < 0.05), showing the presence of four distinct cluster-associated gene groups. (D) Heatmap of the most differentially enriched pathways in each drug cluster. Unbiased single-sample gene set enrichment analysis (ssGSEA) was performed on curated gene lists representing the gene sets most enriched or depleted in each drug cluster as compared with the DMSO-treated group and identified by Welch’s t-test.
Figure 8
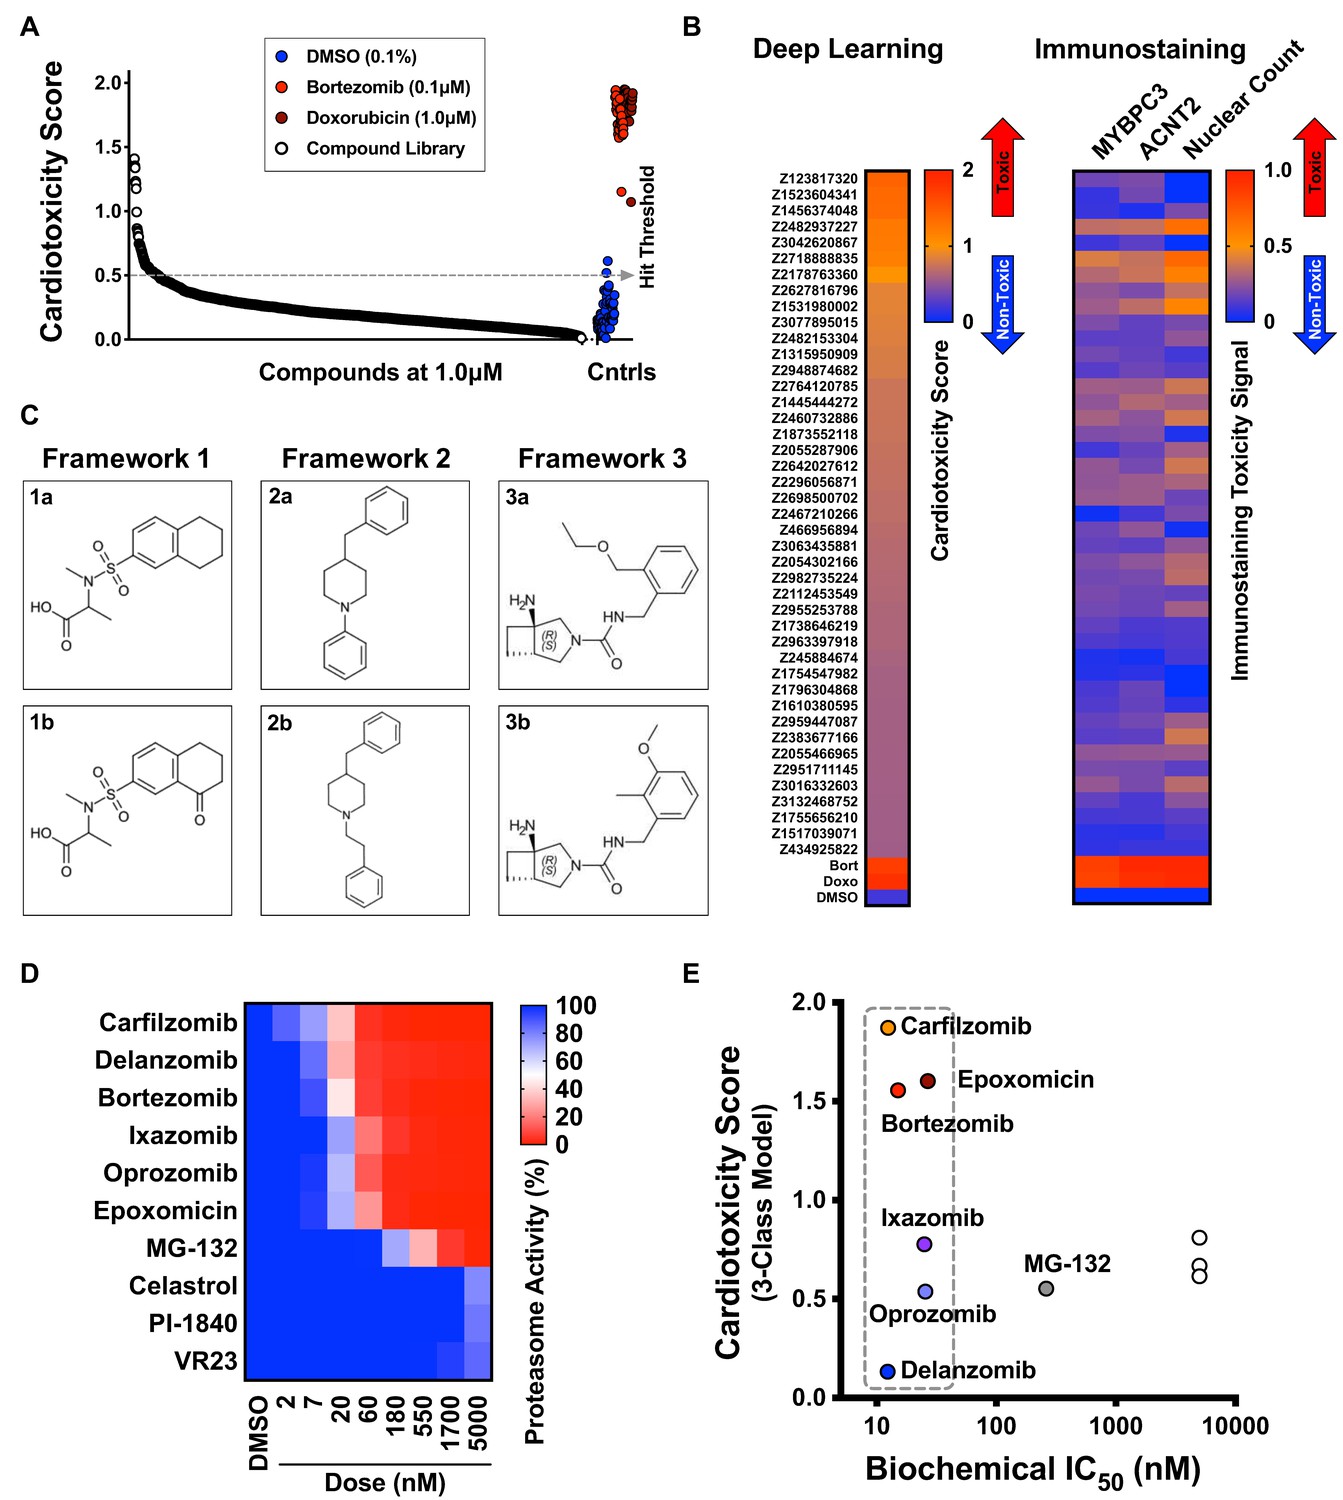
Screen of diverse compound library and identified cardiotoxic chemical frameworks.
(A) Cardiotoxicity scores of 1280 diverse compounds screened at 1 µM. Sorted data from the 3-class deep learning model are plotted. Higher scores correspond to a higher probability of a cardiotoxicity signature. Bortezomib and doxorubicin were used as cardiotoxic controls (Cntrls). (B) Cardiotoxicity heatmap scores of top 33 cardiotoxic hits based on deep learning signal. The immunostaining signal is also displayed as a heatmap. Drugs and doses with cardiotoxicity signals in induced pluripotent stem cell-derived cardiomyocytes (iPSC-CMs) are indicated in red and yellow, whereas non-toxic drugs are indicated in blue. Signal intensity from immunostaining and nuclear count was normalized to the dimethyl sulfoxide (DMSO) control and converted to a toxicity scale. (C) Three structural frameworks with matched pairs were identified to lead to cardiotoxicity in iPSC-CMs: Framework 1 (1a and 1b, tetrahydronaphthalene-2-sulfonamide core), Framework 2 (2a and 2b, 4-benzylpiperidine core), and Framework 3 (3a and 3b, 3-azabicycloheptane core). (D) Heatmap of chymotrypsin-like biochemical activity of 10 proteasome inhibitors profiled in iPSC-CMs. (E) Cardiotoxicity scores of 10 proteasome inhibitors plotted as a function of chymotrypsin-like biochemical IC50. Six of the proteasome inhibitors showed a similar range of biochemical potencies (dashed box). Delanzomib showed the lowest cardiotoxicity score; carfilzomib, bortezomib, and epoxomicin showed the highest cardiotoxicity scores.
-
Figure 8—source data 1
Screen of diverse compound library and identified cardiotoxic chemical frameworks.
- https://cdn.elifesciences.org/articles/68714/elife-68714-fig8-data1-v2.xlsx
Tables
Key resources table
| Reagent type (species) or resource | Designation | Source or reference | Identifiers | Additional information |
|---|---|---|---|---|
| Cell line (Homo sapiens) | WTC | Gladstone Institutes | Human iPSC line | |
| Antibody | Primary Anti-MYBPC3 Mouse (monoclonal) | Santa Cruz | Sc-137237 | 1:200 |
| Antibody | Primary Anti-ACTN2 Rabbit (monoclonal) | Thermo Fisher Scientific | 701914 | 1:200 |
| Antibody | Secondary Donkey anti-Rabbit IgG (H+L) Alexa Fluor 594 | Thermo Fisher Scientific | A-21202 | 1:500 |
| Antibody | Secondary Donkey anti-Mouse IgG (H+L) Alexa Fluor 488 | Thermo Fisher Scientific | A-21207 | 1:500 |
| Sequence-based reagent | MYH7 | Thermo Fisher Scientific | Hs01110632_m1 | TaqMan qPCR probe, cardiac marker |
| Sequence-based reagent | MYH6 | Thermo Fisher Scientific | Hs01101425_m1 | TaqMan qPCR probe, cardiac marker |
| Sequence-based reagent | TNNI3 | Thermo Fisher Scientific | Hs00165957_m1 | TaqMan qPCR probe, cardiac marker |
| Sequence-based reagent | TNNI1 | Thermo Fisher Scientific | Hs00913333_m1 | TaqMan qPCR probe, cardiac marker |
| Sequence-based reagent | MYBPC3 | Thermo Fisher Scientific | Hs00165232_m1 | TaqMan qPCR probe, cardiac marker |
| Sequence-based reagent | TNNT2 | Thermo Fisher Scientific | Hs00943911_m1 | TaqMan qPCR probe, cardiac marker |
| Sequence-based reagent | GAPDH | Thermo Fisher Scientific | Hs99999905_m1 | TaqMan qPCR probe, housekeeping marker |
| Chemical compound, drug | CHIR-99021 | Selleckchem | S1263 | Small molecule |
| Chemical compound, drug | Y-27632 | Selleckchem | S1049 | Small molecule |
| Chemical compound, drug | IWP2 | Sigma | I0536 | Small molecule |
| Chemical compound, drug | Blasticidine S hydrochloride | Thermo Fisher Scientific | 15205 | Small molecule |
| Chemical compound, drug | Bortezomib | Selleckchem | S1013 | Small molecule |
| Chemical compound, drug | Doxorubicin | Selleckchem | S1208 | Small molecule |
| Chemical compound, drug | Givinostat | Selleckchem | S2170 | Small molecule |
| Chemical compound, drug | Bafilomycin | Selleckchem | S1413 | Small molecule |
| Chemical compound, drug | Paclitaxol | Selleckchem | S1150 | Small molecule |
| Chemical compound, drug | Cisapride | Selleckchem | S4751 | Small molecule |
| Chemical compound, drug | Sorafenib | Selleckchem | S7397 | Small molecule |
| Chemical compound, drug | FDA-approved Drug Library | Selleckchem | L1300 | Compound library |
| Chemical compound, drug | Discovery Diversity Set | Enamine | DDS-10-Y-10 | Compound library |
| Chemical compound, drug | Dimethyl sulfoxide (DMSO) | Sigma | D8418 | Solvent |
Additional files
-
Supplementary file 1
Criteria for Defining Cardiotoxicity Scores and Binning Compounds Used to Establish Deep Learning Models.
- https://cdn.elifesciences.org/articles/68714/elife-68714-supp1-v2.docx
-
Supplementary file 2
Criteria Used to Construct Classes of Deep Learning Models.
- https://cdn.elifesciences.org/articles/68714/elife-68714-supp2-v2.docx
-
Supplementary file 3
List of Compounds with Potential Structural Cardiotoxicity and Associated Information.
- https://cdn.elifesciences.org/articles/68714/elife-68714-supp3-v2.docx
-
Supplementary file 4
Primary and Secondary Antibodies Used for Immunostaining.
- https://cdn.elifesciences.org/articles/68714/elife-68714-supp4-v2.docx
-
Supplementary file 5
TaqMan qPCR Probes.
- https://cdn.elifesciences.org/articles/68714/elife-68714-supp5-v2.docx
-
Transparent reporting form
- https://cdn.elifesciences.org/articles/68714/elife-68714-transrepform-v2.docx
Download links
A two-part list of links to download the article, or parts of the article, in various formats.
Downloads (link to download the article as PDF)
Open citations (links to open the citations from this article in various online reference manager services)
Cite this article (links to download the citations from this article in formats compatible with various reference manager tools)
Deep learning detects cardiotoxicity in a high-content screen with induced pluripotent stem cell-derived cardiomyocytes
eLife 10:e68714.
https://doi.org/10.7554/eLife.68714


