Electron cryo-tomography reveals the subcellular architecture of growing axons in human brain organoids
- MRC Laboratory of Molecular Biology, Francis Crick Avenue, United Kingdom
- Institute of Biochemistry and Molecular Medicine, University of Bern, Switzerland
Figures
Figure 1 with 4 supplements

Targeting fluorescently labeled axons within tracts from human cerebral organoids by correlative light and electron cryo-microscopy (cryo-CLEM).
(A) Immunofluorescence of an air-liquid interface cerebral organoid (ALI-CO) stained for the pan-neuronal marker TUBB3 and the pan-axonal marker SMI312. The box highlights a magnified view of escaping axon tracts. White arrows point to bundles of varying thickness. (B) Representative fluorescence microscopy (FM) images of extending fGFP+ expressing axons. The top panel is the first frame and the bottom panel is the last frame of the 13 hr-long live FM Figure 1—video 1. The images were used to track the axon labeled as number four in C., and the blue line marks the trajectory of its growth throughout the movie. (C) Box and whisker plot of axon extension speed measurements reporting the median, first and third quartiles, minimum and maximum. The individual data points represent the extension speed calculated between two consecutive frames. The measurements were done on 7 axons from three different ALI-COs. The red dashed line indicates the average speed of 691 nm/min, calculated from the shown 7 axons. (D) Schematic preparation of ALI-COs for cryo-CLEM including electron cryo-tomography (cryo-ET). (E) Overlay of fluorescence (GFP) and transmitted light overview images of grids placed around an ALI-CO. Lower magnification image shows day 1. Inset shows axons labeled with fGFP and additional tracts stained with SiR-tubulin immediately prior to cryo-fixation after 11 days of growth on the grid to the left of the ALI-CO, indicated by the orange square. (F) Cryo-FM (top) and cryo-EM (bottom) overview of the blue area indicated on the grid shown in the inset in E. Yellow and red boxes indicate the areas shown in G. and H., respectively. (G and H) Correlated cryo-FM and cryo-ET on two different grid squares. Subpanels I and II: Overlays of cryo-FM and cryo-EM at different zoom levels to identify individual fluorescent axons. Areas in subpanels II correspond to white squares in subpanels I. Subpanels III: Virtual slices through cryo-tomograms acquired at the positions of white squares indicated in subpanels II. Scale bars: 1 mm and 500 µm (inset) in A., 50 µm in B., 1 mm and 200 µm (inset) in E., 100 µm in F., 5 µm (I), 2 µm (II) and 100 nm (III) in G. and H. GFP is shown in green, SIRtubulin in magenta in E – H.
Figure 1—figure supplement 1
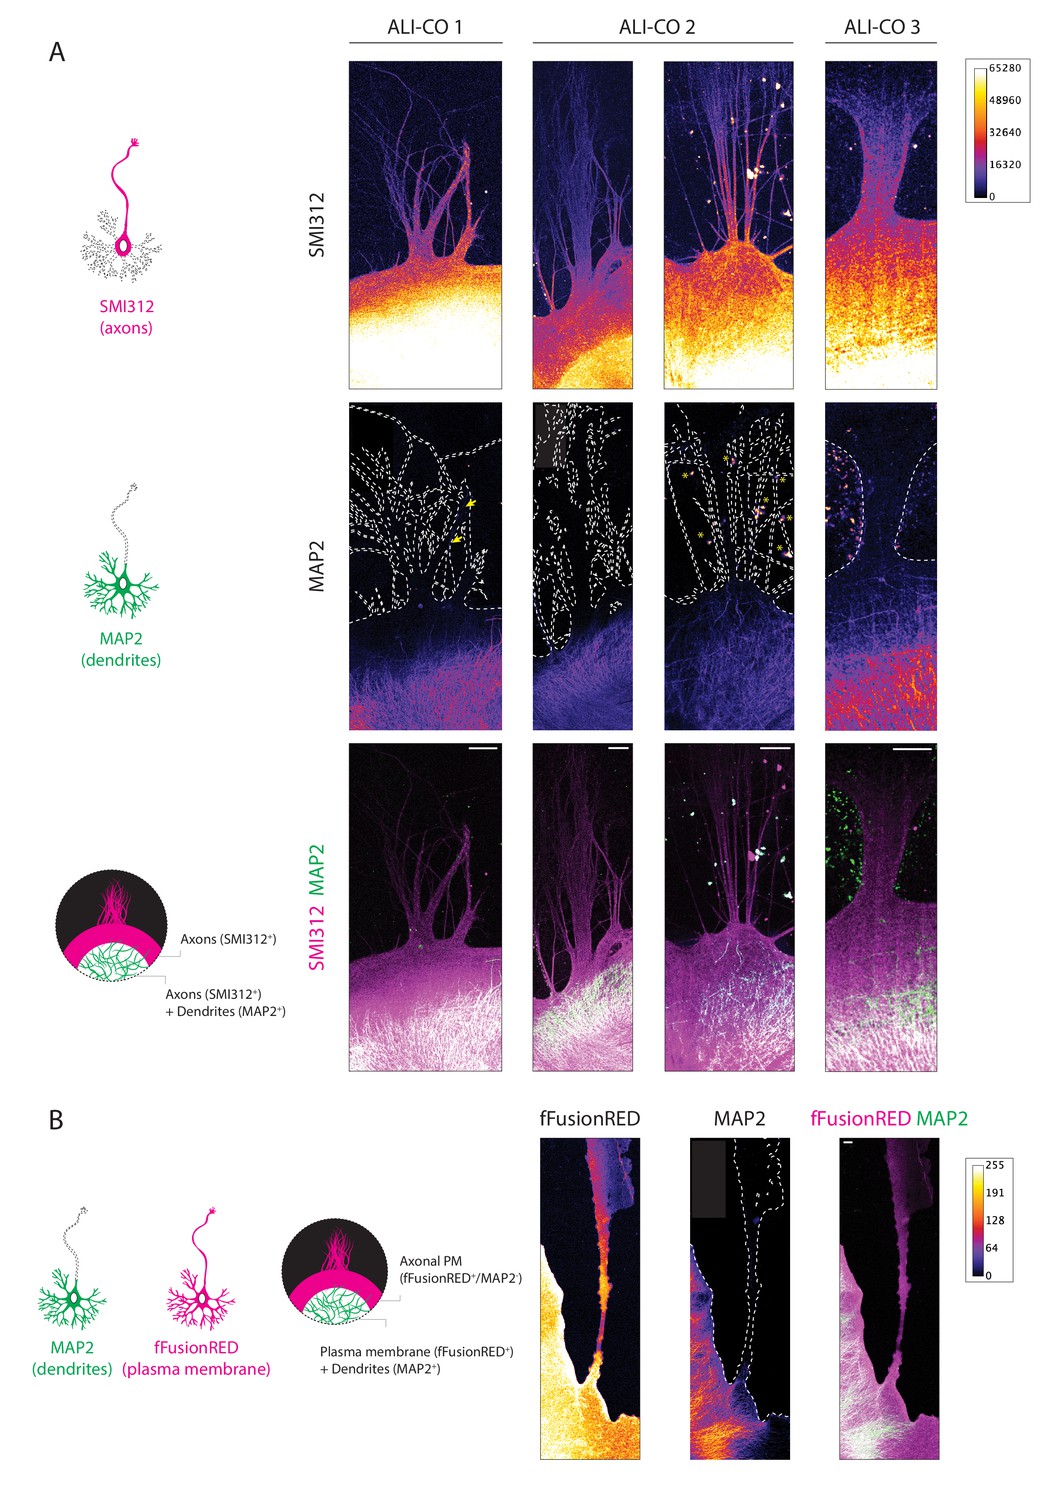
ALI-CO escaping tracts comprise principally axons.
(A) Schematic representation of the distribution of SMI312 and MAP2 immunofluorescence signal across a neuron and expected staining pattern in the case where dendrites are absent from exiting bundles (bottom). Representative images of four bundles from three different ALI-COs stained for the panaxonal marker SMI312 and the dendritic marker MAP2, single channel heatmaps are reported in the top two rows and the bottom row reports the composite image. The outline of the SMI312 signal is reported on the MAP2 channel marking the surface area of the bundle. The yellow arrows in the left MAP2 panel point to a single spurious neuronal cell body within the axon bundle. The asterisks in the MAP2 panel second from the right mark autofluorescent background speckles. The heatmap reports gray value signal intensity ranging between 0–65280. (B) Schematic representation of the distribution of fFusionRed and MAP2 IF signal across a neuron and expected staining pattern in the case where dendrites are absent from exiting bundles (right). Representative image of an escaping bundle from one ALI-CO stained for the plasma membrane marker fFusionRed and the dendritic marker MAP2. The outline of the fFusionRed signal is reported on the MAP2 channel marking the surface area of the tract. The heatmap reports the gray value signal intensity ranging between 0-255. In both A. and B., white dashed lines indicate the outlines of the bundles. Scale bars: 100 µm in A. and B.
Figure 1—figure supplement 2
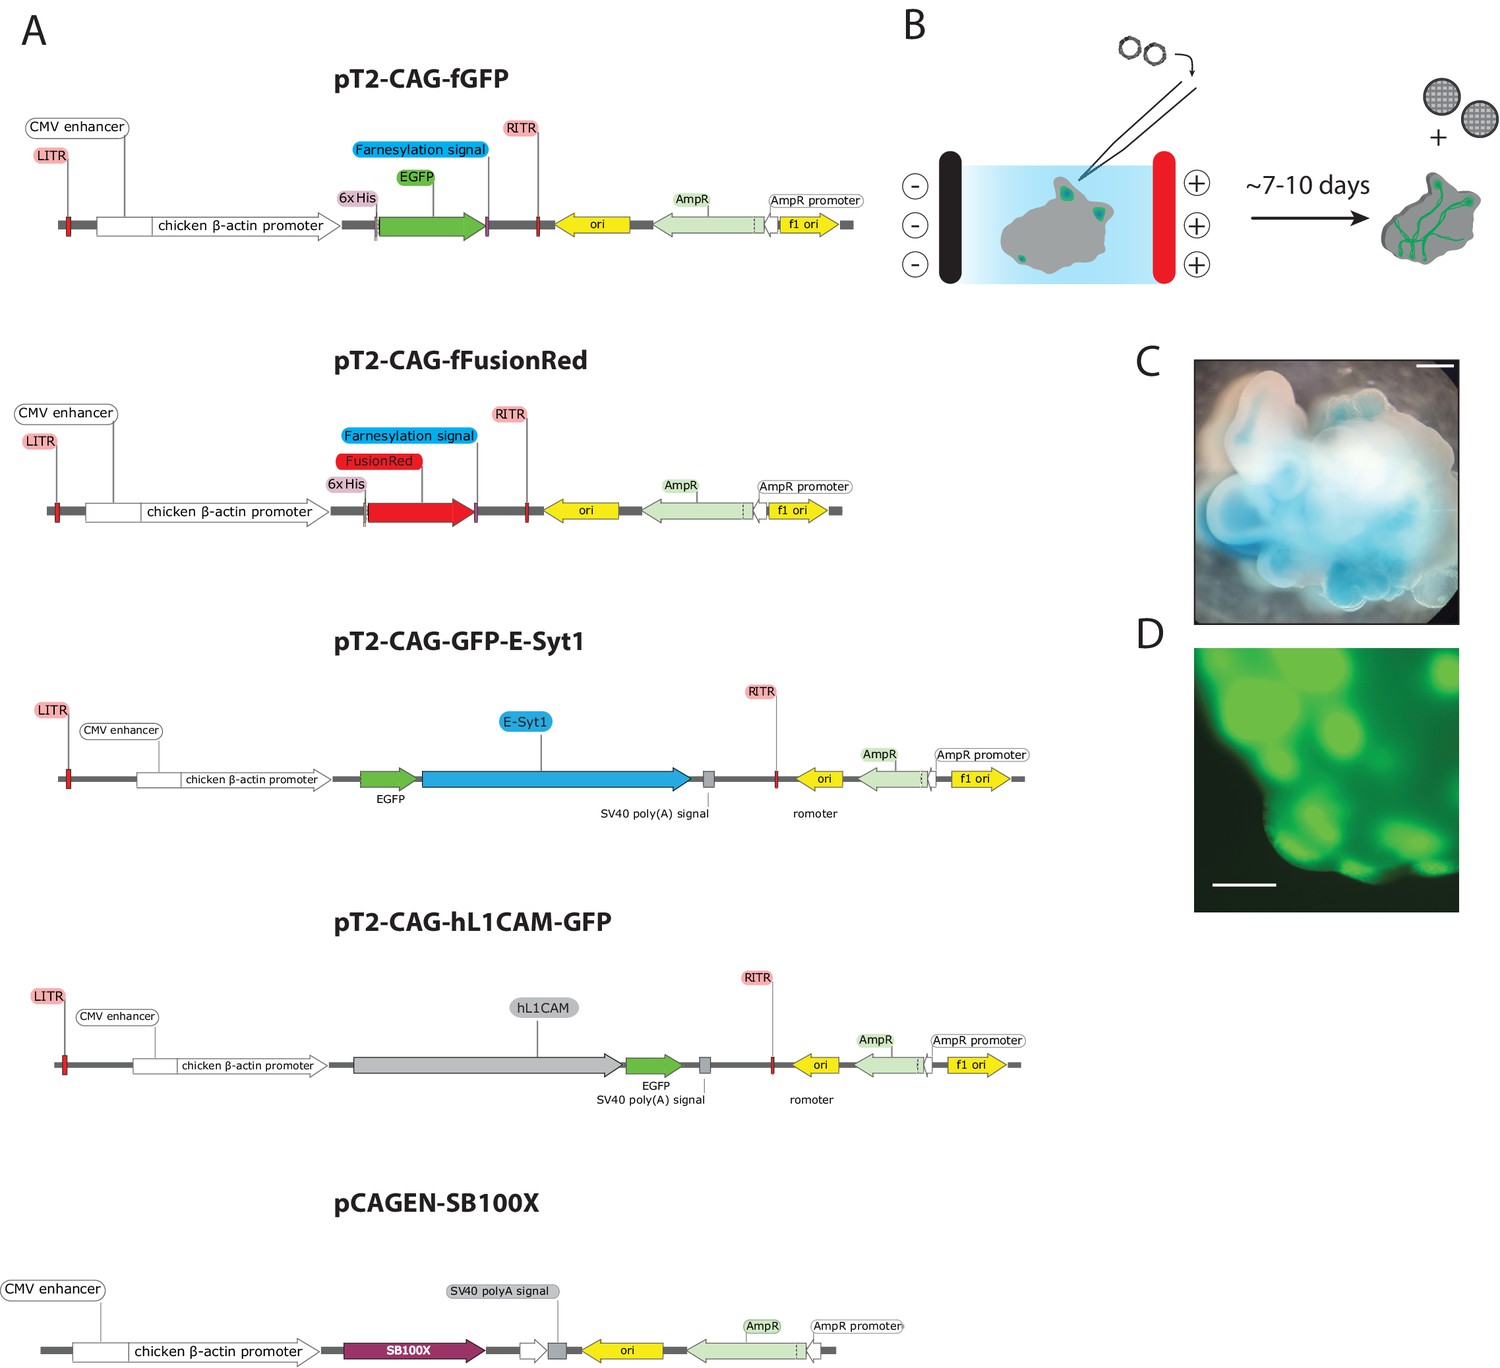
Plasmid constructs and electroporation strategy employed in the study.
(A) Linear schematics of the plasmid maps of the constructs employed in the study. The SleepingBeauty system was used for transgene expression of the following open reading frames (ORFs) driven by CAG: farnesyl-GFP (fGFP), farnesyl-FusionRed (fFusionRed), N-terminally GFP-tagged ESYT1 (GFP-ESYT1) and C-terminally GFP-tagged human L1 cell adhesion molecule (L1CAM-GFP). The plasmid map for the construct encoding the SB100X transposase under the control of the CAG promoter is shown as well. (B) Electroporation schematic depicting injection of the plasmid solution into ventricles of organoids and electroporation into the progenitor cells in the ventricular zone. After approximately 4–5 days organoids were prepared for ALI culture and following an additional 4–7 day period at the ALI, EM grids were placed in close proximity to the organoid slices. (C) Representative brightfield image of a cerebral organoid after injection of the Fast Green-containing plasmid solution into the ventricles. (D) GFP signal after micro-injection and electroporation of the membrane-targeted farnesylated GFP (fGFP) construct prior to sectioning. Scale bars: 1 mm C. and 0.5 mm D.
Figure 1—video 1
Time-lapse movie of the extending fGFP+ axon shown in Figure 1B.
Images were acquired at 12 min intervals for a total duration of 13 hr. The progressive blue line marks the trajectory of the axon over the course of the movie. The axon shown corresponds to axon number four in the quantifications reported in Figure 1C. Scale bar: 50 µm.
Figure 1—video 2
Time-lapse movie over 10 days of fGFP+ axon tracts growing on an EM grid.
Growth was monitored twice a day with approximately 12 hr intervals until tracts reached the center of the EM grid. The same grid is shown in Figure 1E. Scale bar: 500 µm.
Figure 2 with 8 supplements
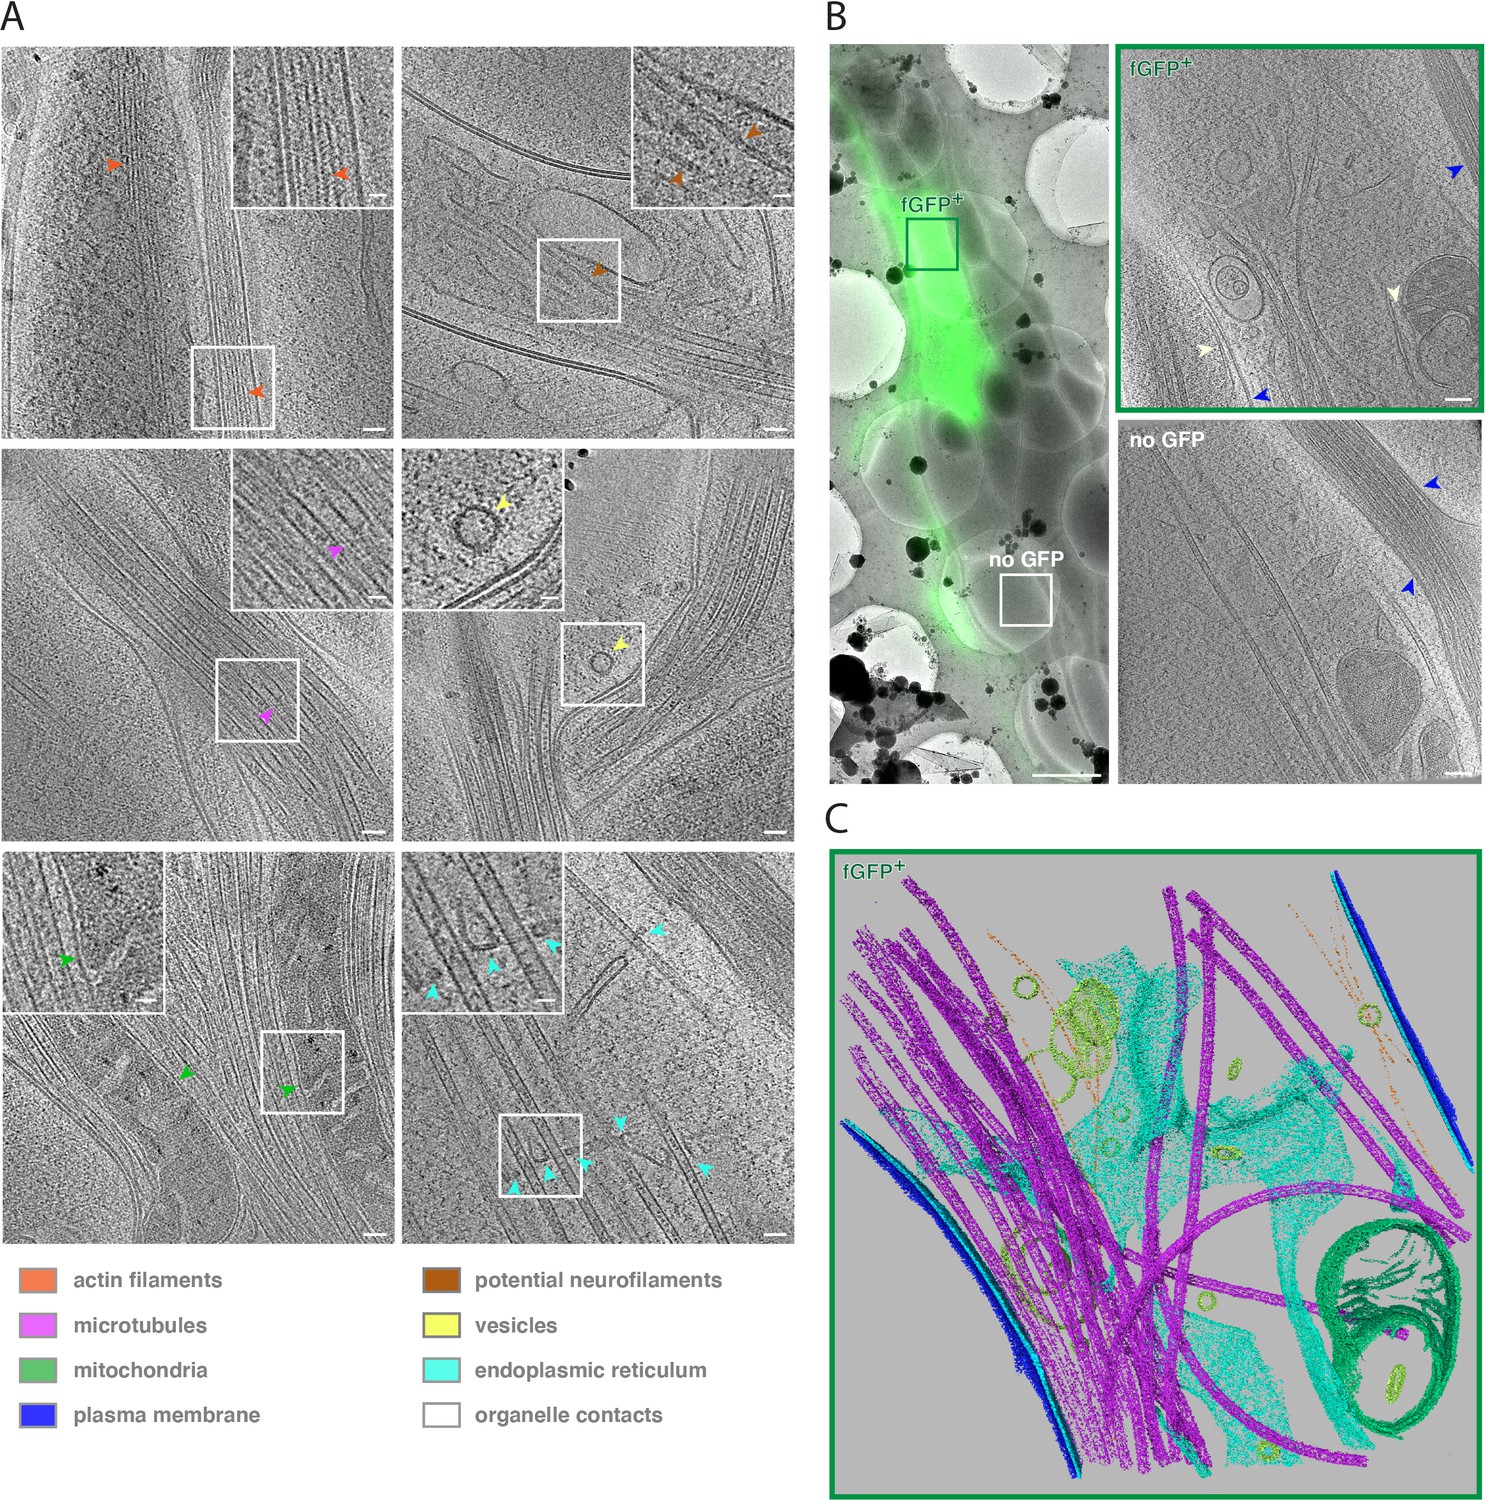
Cryo-ET reveals subcellular features of developing human axon tracts.
(A) Cryo-tomograms reveal bundles of unbranched, longitudinally aligned actin filaments, recognizable by actin subunit arrangement (orange arrows), microtubules filled with lumenal densities, microtubule protofilaments (purple arrows), mitochondria (green arrows) embedded in microtubule bundles, potential neurofilaments (brown arrows), vesicles carrying protein cargo (yellow arrow), endoplasmic reticulum (cyan arrows) closely associated with microtubules. Insets show magnified views of the boxed areas. (B) fGFP+ and untransfected axons are found within the same axon tract, allowing direct phenotype comparison. Left panel: Overlay of cryo-FM and cryo-EM overview images. Two right panels: Virtual slices through cryo-tomograms of fGFP+ and control axon. White arrows indicate contacts between ER and mitochondria as well as between ER and plasma membrane, blue arrows indicate cell-cell contacts between different axons. (C) Segmentation model of the fGFP+ axon shown in B., illustrating the complexity of the cellular ultrastructure. Microtubules are shown in magenta, actin filaments in orange, endoplasmic reticulum in cyan, vesicles and other membrane compartments in yellow, mitochondrial membranes in green and the plasma membranes of the fGFP+ axon and neighboring axons in blue and dark blue, respectively. Scale bars: 50 nm (20 nm for insets) in A., 2 µm in B. left panel and 100 nm in B. right two panels.
Figure 2—figure supplement 1
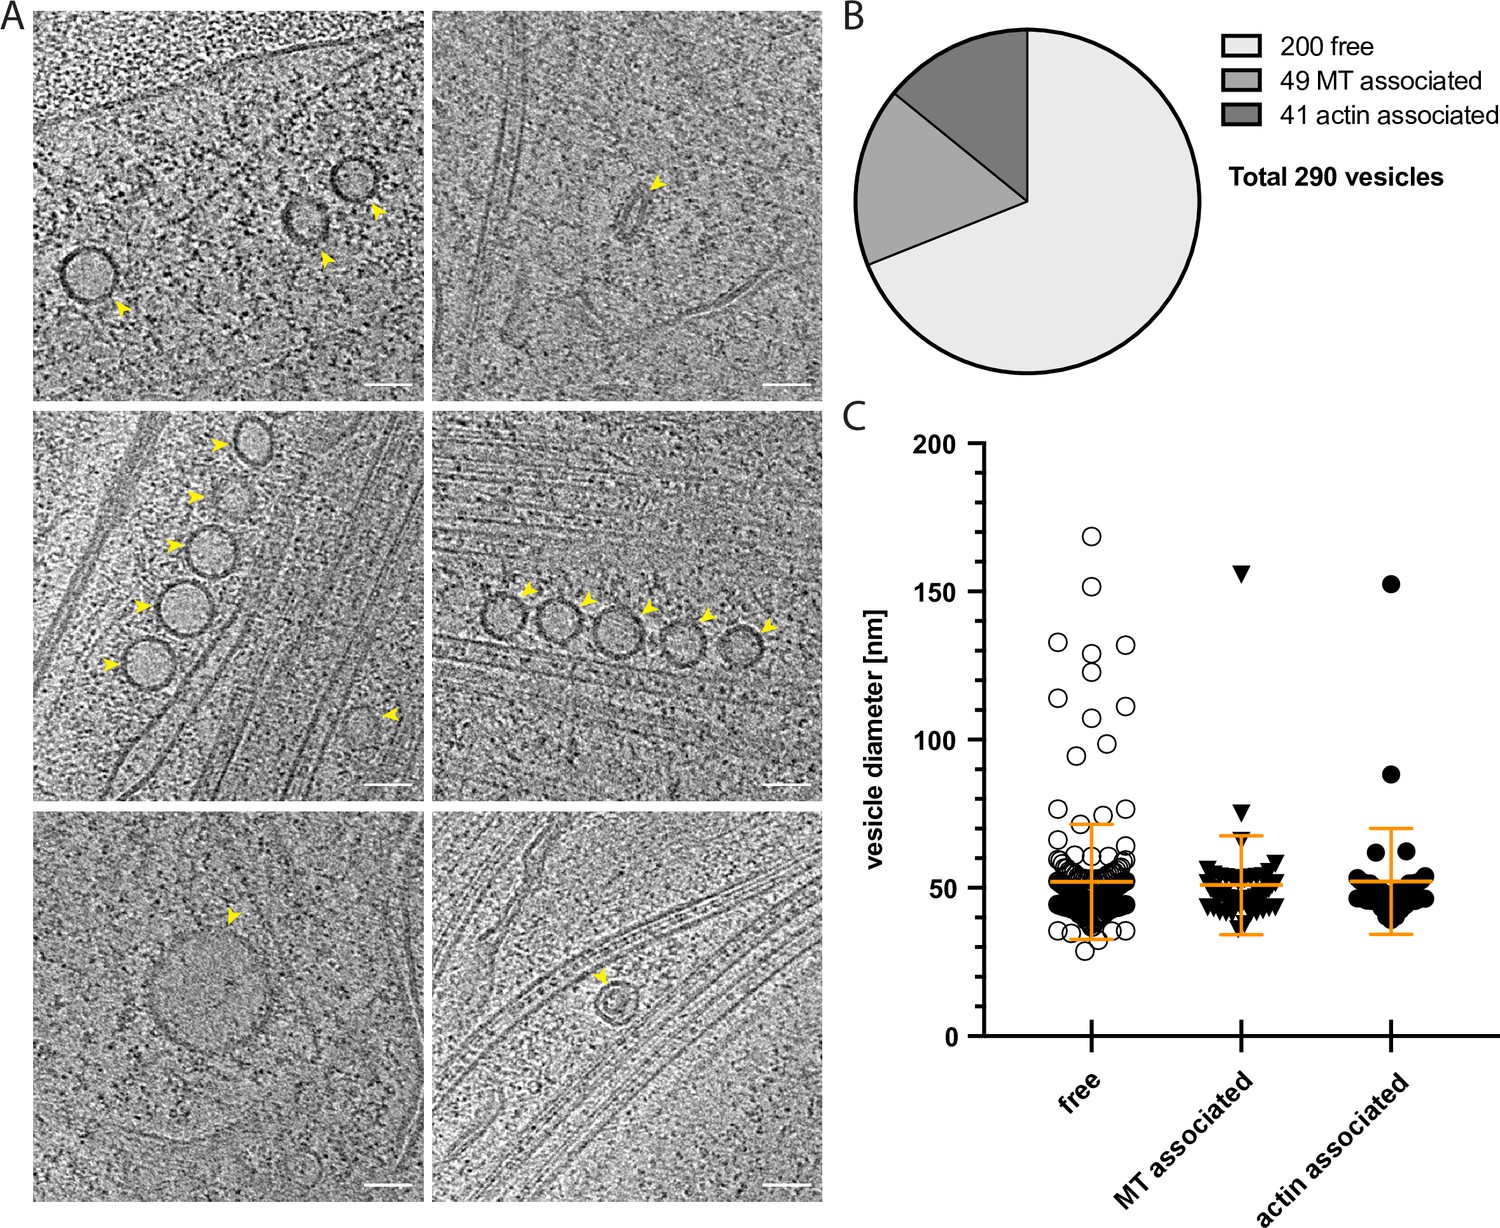
Vesicles: Associations with the cytoskeleton and size distributions.
(A) Gallery of representative vesicles found in cryo-tomograms of axon shafts. (B) Quantification of the association of vesicles with cytoskeletal elements. (C) Analysis of vesicle diameters, measured along their longest axis (free vesicles: mean = 52.00 nm, SD = 19.42 nm, N = 200; microtubule associated vesicles: mean = 50.92 nm, SD = 16.70 nm, N = 49, and actin associated vesicles: mean = 52.18 nm, SD = 17.84 nm, N = 41). One-way ANOVA was used for statistical analysis: p = 0.9292. Scale bars: 50 nm in A.
Figure 2—figure supplement 2
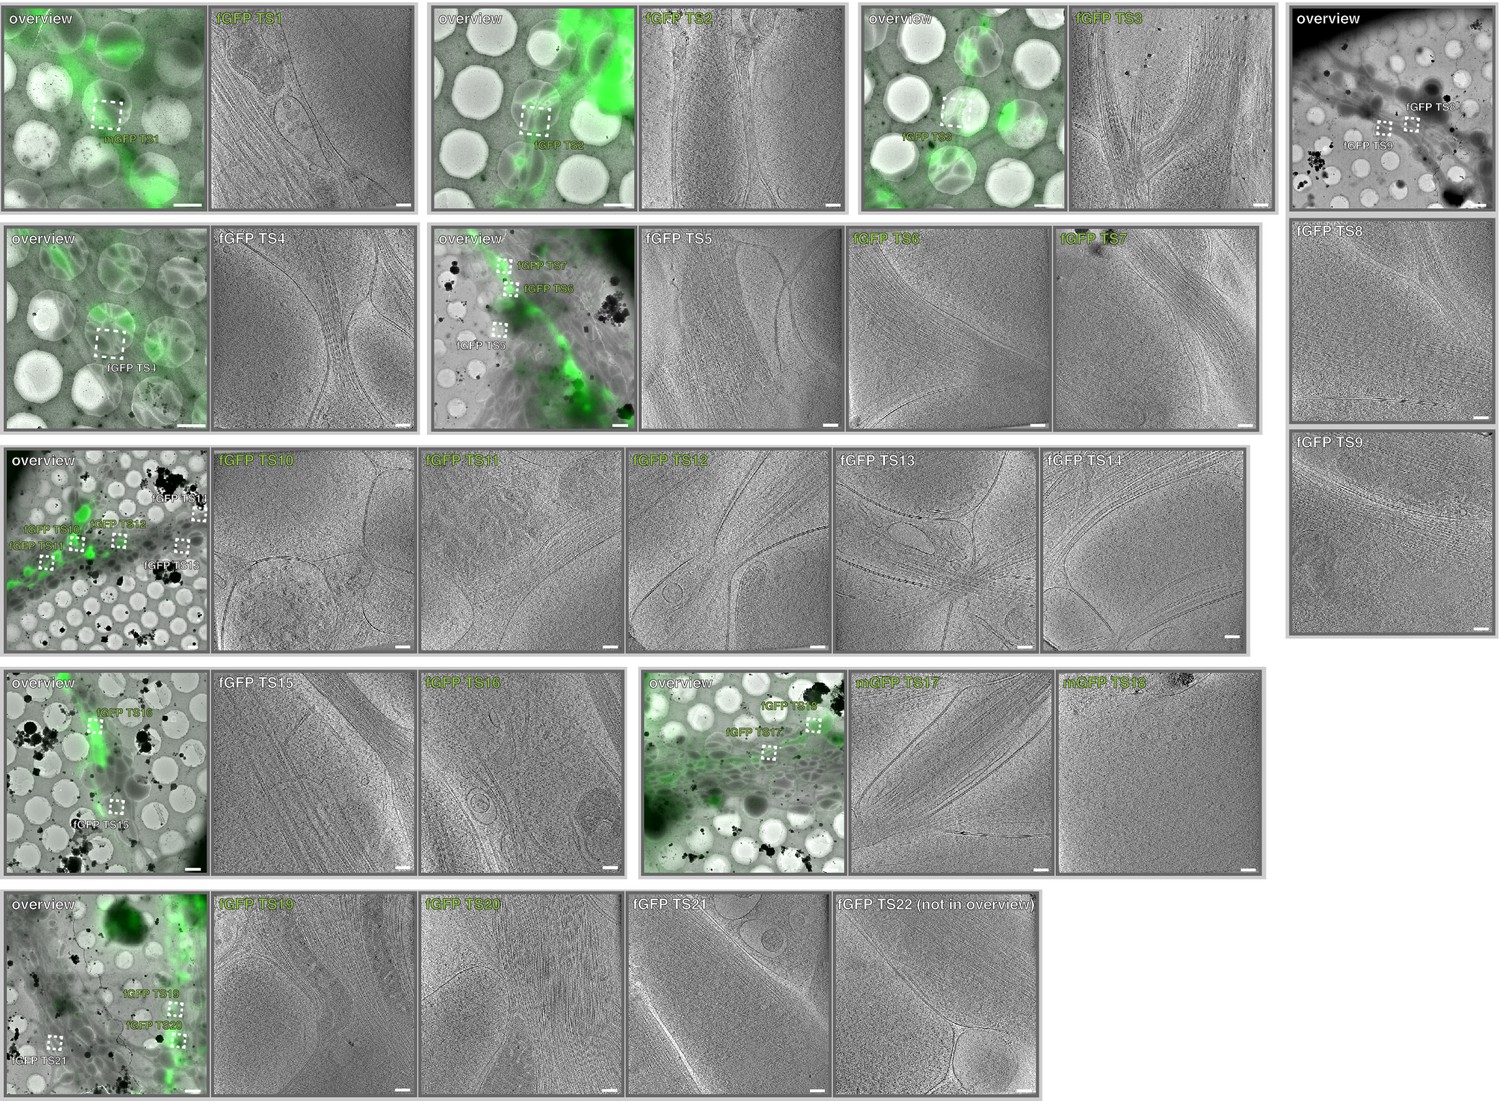
Gallery of correlative cryo-FM and cryo-ET dataset from membrane targeted GFP (fGFP) expressing ALI-COs.
Dataset of 22 axon cryo-tomograms from fGFP expressing organoids from three different grid preparations (EMD-13195 and EMPIAR-10806). Overlays between cryo-FM and cryo-EM overviews show all positions of tilt series acquisition within the axon tracts. For all positions, a corresponding virtual slice through the cryo-tomogram is shown. Scale bars: 2 µm in overviews, 100 nm in virtual tomographic slices.
Figure 2—figure supplement 3
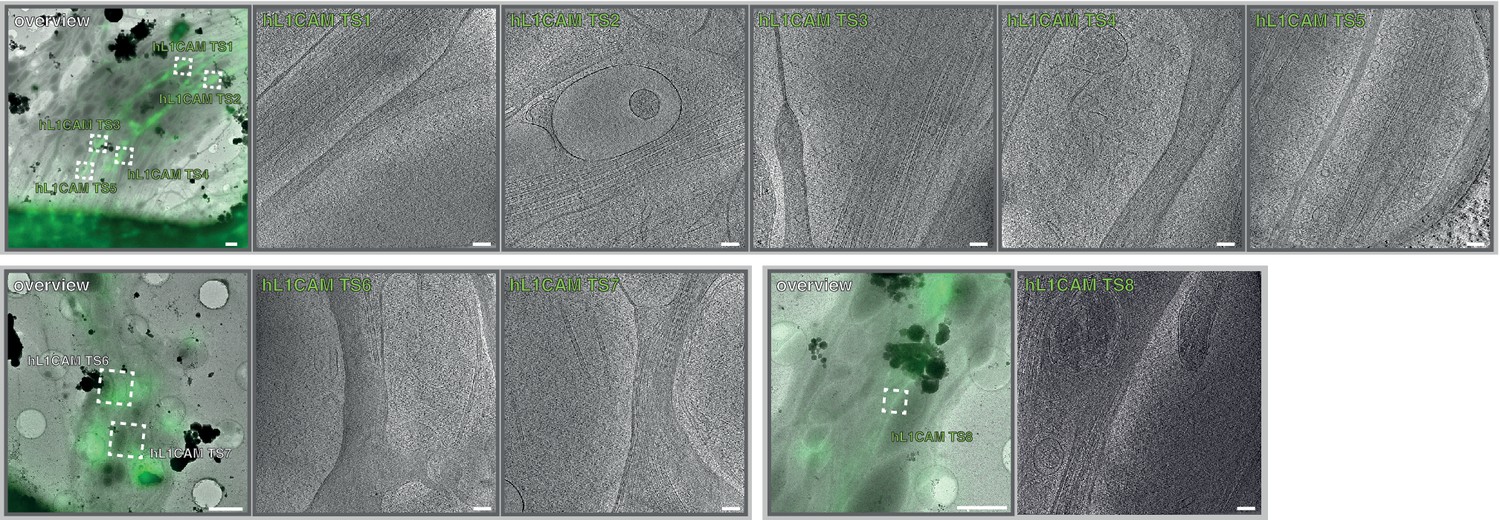
Gallery of correlative cryo-FM and cryo-ET dataset from L1CAM-GFP expressing ALI-COs.
Dataset of 8 axon cryo-tomograms from L1CAM-GFP expressing organoids from two different grid preparations (EMD-13196 and EMPIAR-10805). Overlays between cryo-FM and cryo-EM and corresponding virtual slices through cryo-tomograms are shown. Scale bars: 2 µm in overviews, 100 nm in virtual tomographic slices.
Figure 2—figure supplement 4

Gallery of correlative cryo-FM and cryo-ET dataset from GFP-ESYT1 expressing ALI-COs.
Dataset of 10 cryo-tomograms from GFP-ESYT1 expressing organoids from two different grid preparations (EMD-13197 and EMPIAR-10804). Overlays between cryo-FM and cryo-EM and corresponding virtual slices through cryo-tomograms are shown. The cryo-tomograms GFP-ESYT1 TS 7–10 contained ribosome-like particles. These areas were positioned at the outer edge of the grid, in closer proximity to cell bodies but also close to a growing end, and corresponded to individual processes rather than tracts (lower left overview). Therefore, these tomograms likely do not represent axon shafts, and were counted as a separate class of other cellular processes, likely dendrites or axon initial segments. Scale bars: 2 µm in overviews, 100 nm in virtual tomographic slices.
Figure 2—figure supplement 5
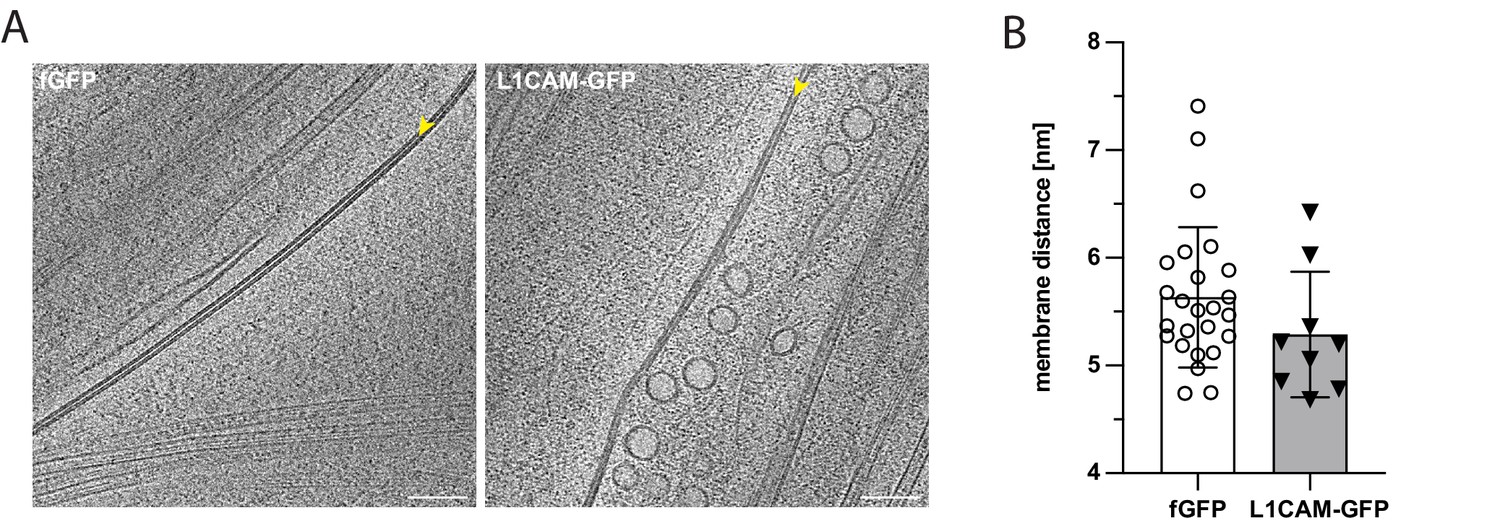
Cell-cell contacts in axons from fGFP and L1CAM-GFP expressing ALI-CO slices.
(A) Representative tomographic slices of cell-cell contacts within axonal tracts from fGFP and L1CAM-GFP overexpressing ALI-CO slices. (B) Analysis of the contact site intermembrane distance, measured between the extracellular leaflets of the plasma membranes (fGFP: mean = 5.63 nm, SD = 0.65 nm, N = 25 and L1CAM-GFP: mean = 5.29 nm, SD = 0.58 nm, N = 9). Unpaired t test was used for statistical analysis: p = 0.1718. Scale bars: 100 nm in A.
Figure 2—figure supplement 6

ER-plasma membrane contact sites in axons from fGFP and GFP-ESYT1 expressing ALI-CO slices.
Tomographic slices of representative ER-plasma membrane contacts observed in axons from fGFP and GFP-ESYT1 expressing ALI-CO slices. ER-plasma membrane contact sites are indicated by yellow arrowheads. Scale bars: 50 nm.
Figure 2—video 1
Correlative microscopy of axons from growing tracts across scales to the supramolecular architecture of individual axon shafts.
The movie first shows the live FM of fGFP+ growing axon tracts corresponding to Figure 1—video 2, then a merge of the fGFP+ axons (green) and all other axon tracts labeled by SiR-tubulin (magenta), taken shortly before cryo-fixation. After cryo-fixation the grid was imaged by cryo-FM, which was correlated and overlayed onto cryo-EM overviews of individual grid squares to identify individual fGFP+ axons. Finally, cryo-ET along axon shafts reveals their supramolecular architecture, including vesicles containing membrane protein cargo. The FM of the grid, cryo-FM and EM images of the individual grid square are shown in Figure 1E–G. The final frame corresponds to the vesicle shown in Figure 2A.
Figure 2—video 2
Tomogram and segmentation of the fGFP+ axon shaft shown in Figure 2C.
The segmentation reveals the complex array of microtubules (magenta) and their intimate association with the ER (cyan), which forms thin tubules that are wrapped around individual microtubules. Other highlighted cellular components include actin filaments (orange), mitochondria (green), small vesicles (yellow) and the plasma membrane of the axon shaft (light blue) and of neighboring axons (dark blue).
Figure 3 with 1 supplement
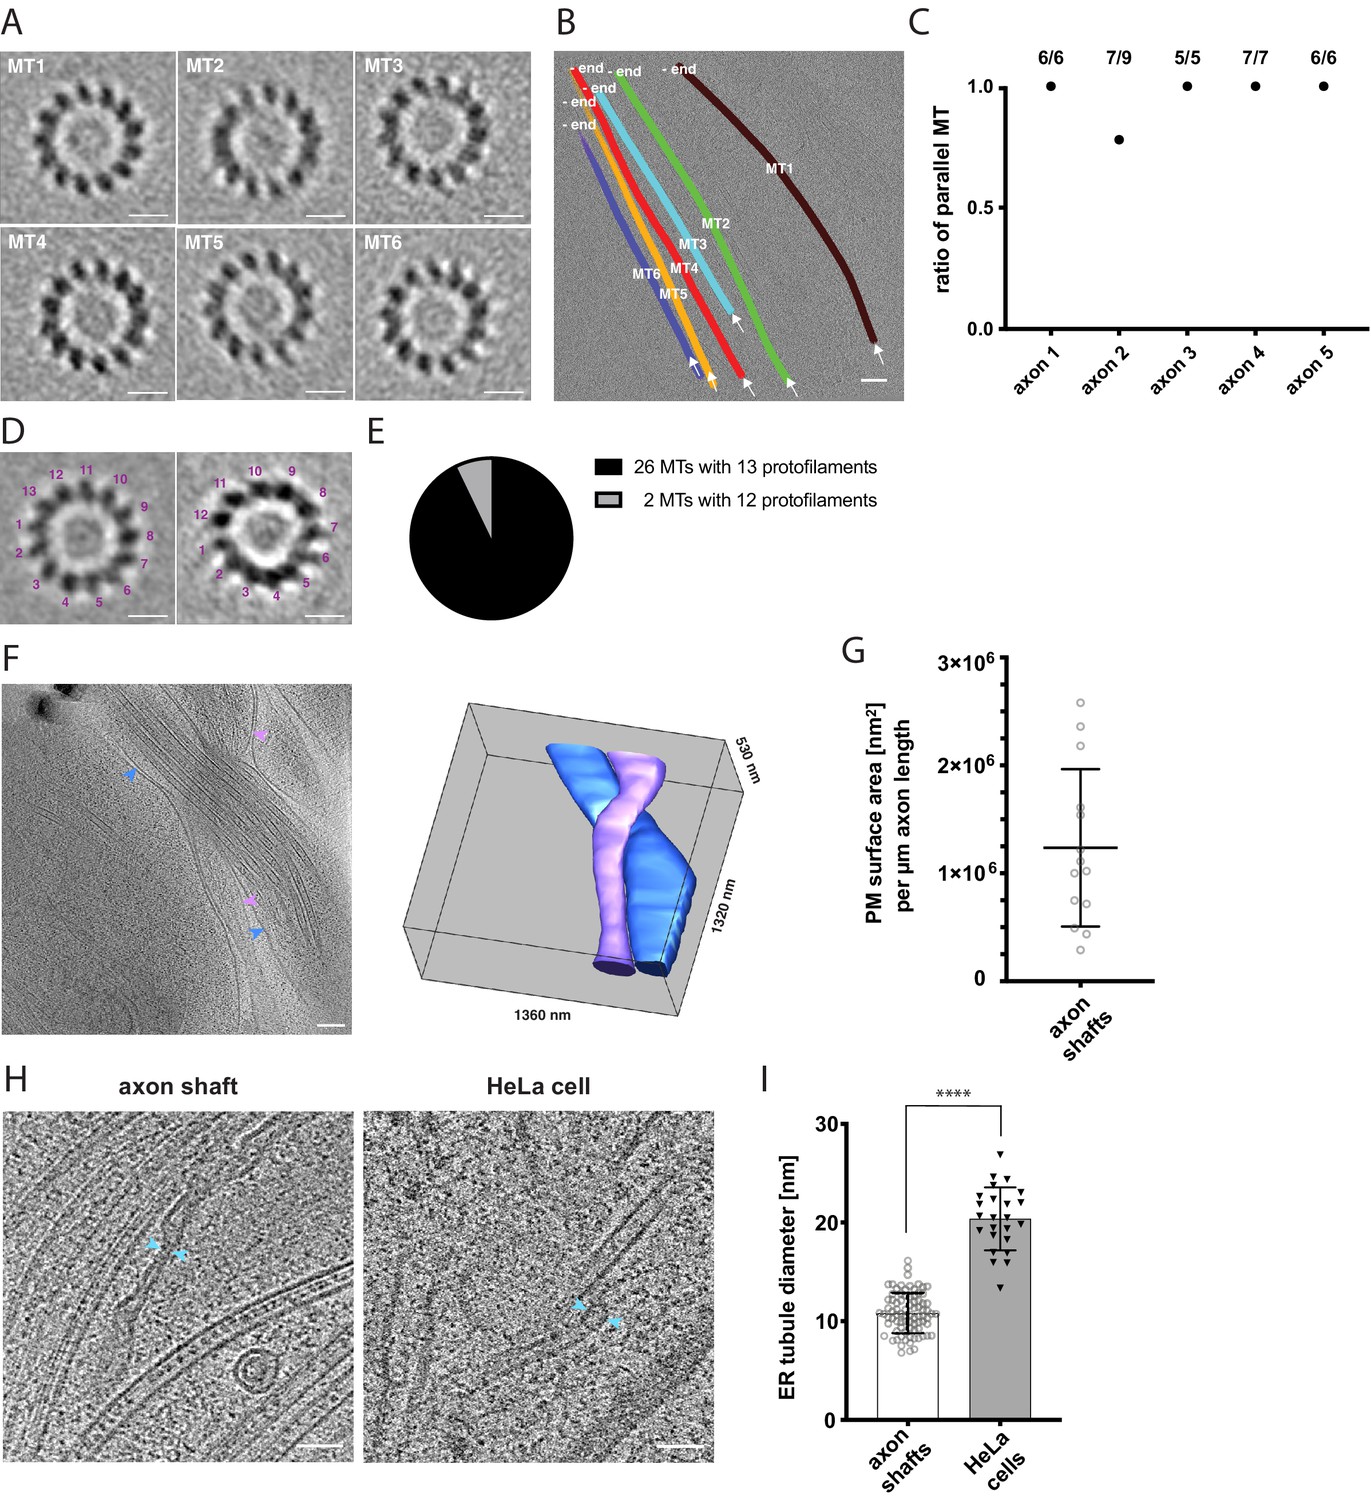
Cytoskeletal and membrane architecture of developing axon shafts.
(A) Axial views of subtomogram averages reveal the polarity of each microtubule (MT) shown in B. The directionality of the microtubule was determined from the radial tilt of the protofilaments seen in axial views (Sosa and Chrétien, 1998). (B) Tomographic slice with six microtubules depicted as differently colored tubes (MT1-MT6) (same tomogram as shown in Figure 2B, ‘no GFP’ panel). Arrows indicate the viewing direction of the axial views of subtomogram averages shown in A. The -end of each microtubule is indicated, determined by the analysis shown in A. (C) Ratio of parallel microtubules determined by subtomogram averaging in five different axons (6–9 individual microtubules per axon). Axon one is depicted in A. and B. (D) Axial view on subtomogram average examples of individual microtubules with 13 protofilaments (left) and with 12 protofilaments (right). (E) Occurrence of microtubules with 12 and 13 protofilaments, determined by individual subtomogram averaging of 28 microtubules as shown in D. (F) Virtual tomographic slice and the corresponding segmentation model of the plasma membrane of two individual axon shafts. Blue and magenta arrows indicate plasma membrane segments visible in the virtual tomographic slice. (G) Plasma membrane (PM) surface area measurements in nm2 normalized to the length in µm of 14 axon shafts captured in 12 tomograms. (H) The curvature of ER tubules is higher in axon shafts than in HeLa cells. Arrows indicate the shortest distance between the membrane bilayer cross sections. (I) Diameters of the thinnest ER tubules measured in axon shafts and in HeLa cells (82 and 24 measurements, respectively). Welch’s t test was employed for statistical analysis: p < 0.0001. Scale bars: 10 nm in A. and D., 100 nm in B. and F., 50 nm in H.
Figure 3—figure supplement 1
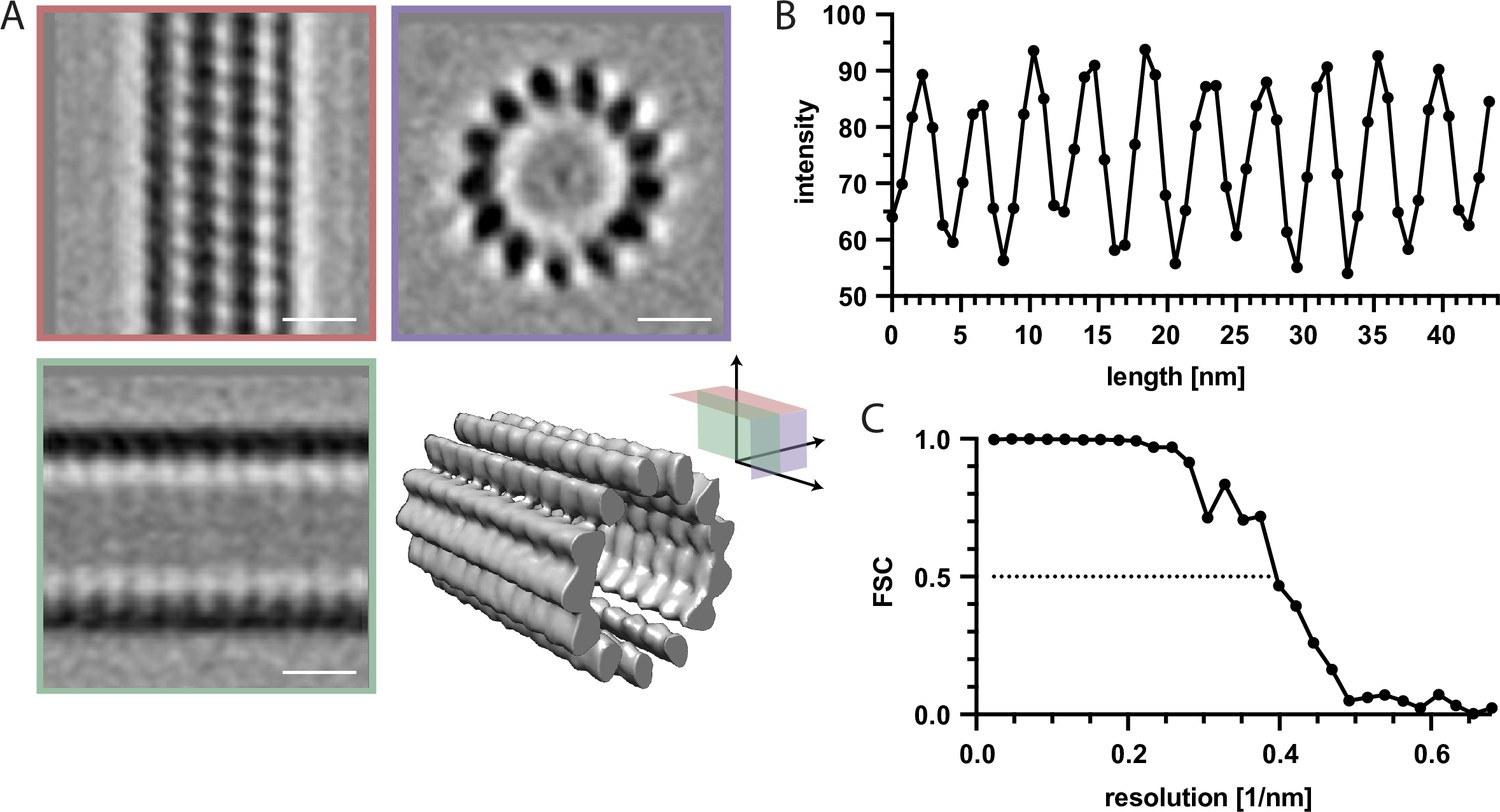
Subtomogram average of 13 protofilament microtubules.
(A) Three slices through the volume and a surface representation of the 13 protofilament microtubule average, calculated from 5,229 subtomograms from 16 microtubules found in human axon tracts. The orientation of the three shown slices is indicated by the planes in the diagram with corresponding colors. (B) Line profile along a single protofilament of the subtomogram average in A, showing the average pixel grey value over a line width of six pixels, in arbitrary units. The pattern reveals the 4 nm repeat along the protofilament. (C) Fourier Shell Correlation (FSC) curve for the microtubule average. The resolution cutoff at 0.5 is 2.5 nm. Scale bars: 10 nm in A.
Figure 4 with 2 supplements
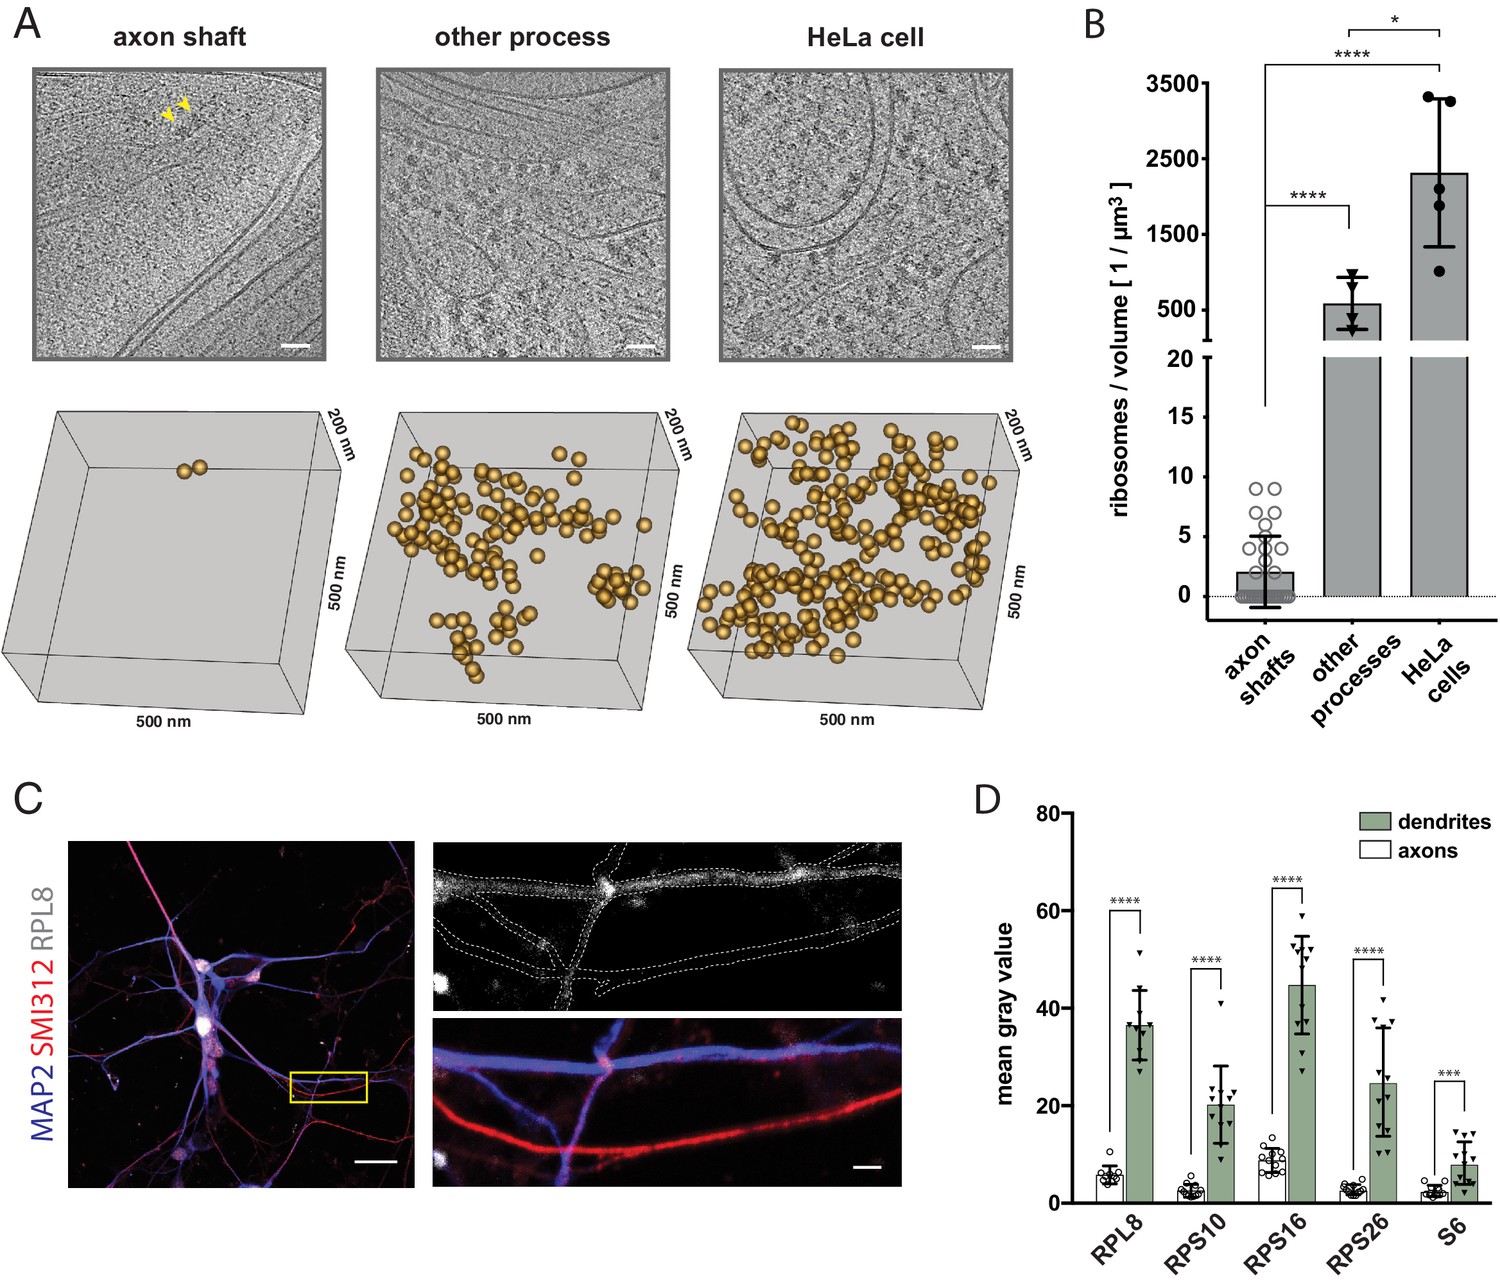
The shaft of the growing axon is scarcely populated by ribosomes.
(A) Examples of ribosomes observed in cryo-tomograms of axon shafts from ALI-COs, of other cellular processes from ALI-COs, and of HeLa cells. The bottom panel shows 0.05 µm3 cryo-ET volumes, corresponding to the area shown in the upper panel. Positions of all ribosome-like particles observed in that volume are shown as orange spheres. (B) Comparison of the numbers of ribosome-like particles, normalized to the tomographic volume, observed in axon shafts, other processes and HeLa cells. Individual data points represent individual cryo-tomograms (30, 4, and 5 tomograms, respectively). Mann-Whitney tests were employed for statistical analysis: p < 0.0001 (****); p < 0.05(*). (C) Immunofluorescence images of dissociated neurons from organoids reveal low signal for the ribosomal 60 S component RPL8 in axon processes (identified by SMI312+/MAP2- labeling) in comparison to dendrites (identified by SMI312-/MAP2+ labeling). The yellow box outlines the area magnified in the right panel. The top image of the right panel shows the immunofluorescence signal for the ribosomal subunit RPL8. The bottom image shows the SMI312/MAP2/RPL8 composite. The white dashed line depicts the outline of axons and dendrites and was traced based on the MAP2 and SMI312 signal. The image shown is representative of the data used for quantifications shown in D. (D) Quantification of immunofluorescence images of ALI-CO derived dissociated neurons labeled for five distinct ribosomal proteins. The bars report the mean pixel grey value along axons and dendrites (mean ± SD). Each data point represents a different axon or dendrite. With the exception of quantifications done on the ribosomal protein S6, axons were identified as SMI312+/MAP2- neuronal processes, while dendrites were identified as SMI312-/MAP2+ neuronal processes. Due to antibody incompatibility, in the case of S6, dendrites were identified as MAP2+ processes while axons were identified as GFP+/MAP2- processes. The data pertains to one biological replicate. Mann-Whitney tests were employed for statistical analysis: RPL8, N = 10, p < 0.0001 (****); RPS10, N = 12, p < 0.0001 (****); RPS16, N = 12, p < 0.0001 (****); RPS26, N = 12, p < 0.0001 (****); S6, N = 12, p = 0.0001 (***). Scale bars: 50 nm in A., 20 µm and 2 µm in C.
Figure 4—figure supplement 1
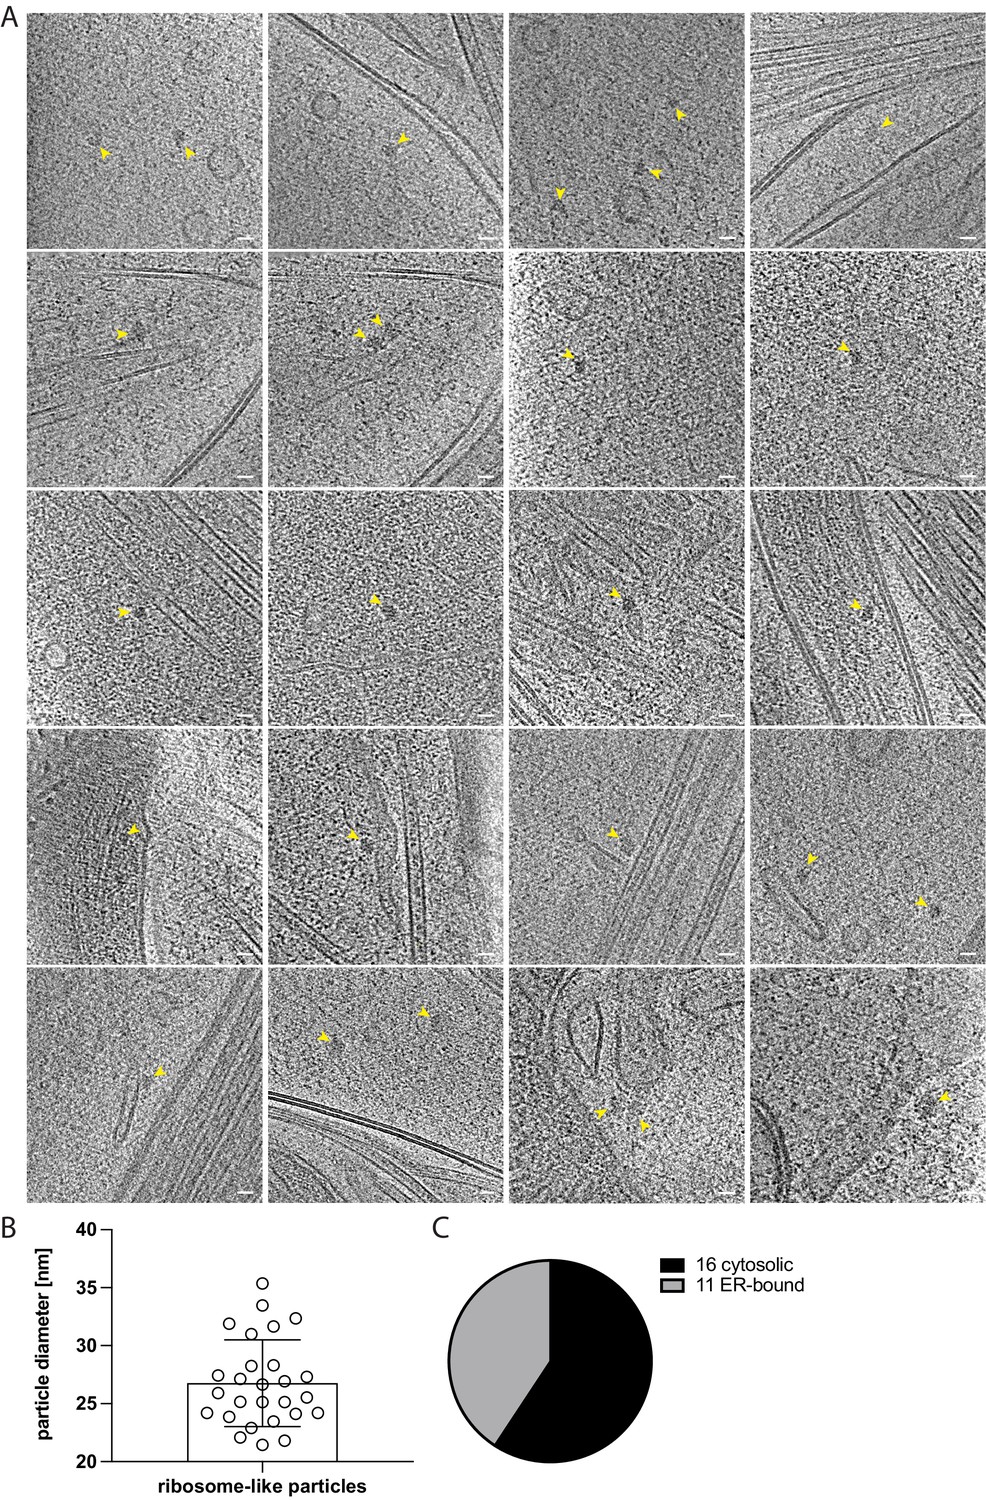
Ribosome-like particles in developing human axon shafts.
(A) Gallery of ribosome-like particles seen in tomogram slices of developing human axons. Yellow arrows highlight ribosome-like densities. (B) Diameter of ribosome-like particles measured from tomographic slices seen in A. (mean = 26.8 nm, SD = 3.7, N = 27). (C) Quantification of the association of ribosome-like particles with the ER. Scale bars: 25 nm in A.
Figure 4—figure supplement 2

Immunofluorescence analysis of axons and dendrites supports ribosomal depletion observed by cryo-ET in the axon shaft.
(A) Representative immunofluorescence images of dissociated organoid-derived neurons stained for the dendritic marker MAP2, the pan-axonal marker SMI312 and the ribosomal components RPS10, RPS16, and RPS26 used for the quantifications reported in Figure 4D. Boxed in yellow is the region shown at higher magnification in the right panel as the individual ribosomal stain and the composite image. Dashed yellow is the outline of the processes reported on the single channel image of the ribosomal stain. The data highlights how dendrites (MAP2+/SMI312-) are enriched in ribosomal components compared to axons (MAP2-/SMI312+) of comparable thickness. (B) Representative immunofluorescence images of dissociated organoid-derived neurons transduced with Sendai EmGFP and stained for the dendritic marker MAP2 and for the ribosomal components S6. Due to antibody incompatibility, in this case dendrites were identified as MAP2+ processes while axons were identified as GFP+/MAP2- processes. These images were used for the quantifications reported in Figure 4D. Boxed in yellow is the region shown at higher magnification in the bottom panel as the S6 stain (right) and the MAP2-GFP composite stain (left). Dashed in yellow is the outline of the processes reported on the single channel image of the S6 stain. The data highlights how dendrites (MAP2+) are enriched in ribosomal components compared to axons (GFP+/MAP2-) of similar thickness. The data shown in A and B pertains to one biological replicate. Scale bars: 20 µm in the overview images in A. and B., 2 µm in the high-magnification inserts.
Tables
Key resources table
| Reagent type (species) or resource | Designation | Source or reference | Identifiers | Additional information |
|---|---|---|---|---|
| Cell line (H. sapiens) | H9 hESC | DOI:10.1126/science.282.5391.1145 | hPSCReg ID: WAe009-A | |
| Cell line (H. sapiens) | HeLa control | other | Cell line stably expressing Fsp27-GFP from tet-inducible promoter. Obtained from Koini Lim (lab of David Savage). | |
| Recombinant DNA reagent | pCAGEN-SB100X | DOI:10.1038/nbt.3906 | ||
| Recombinant DNA reagent | pT2-CAG-fGFP | DOI:10.1038/nbt.3906 | ||
| Recombinant DNA reagent | pT2-CAG-fFusionRed | DOI: 10.1038/s41593-019-0350-2 | ||
| Recombinant DNA reagent | EGFP-E-Syt1 | Addgene | 66830 | |
| Recombinant DNA reagent | pcDNA3-hL1 | Addgene | 89411 | |
| Recombinant DNA reagent | pT2-CAG-GFP-E-Syt1 | Generated for this study | ||
| Recombinant DNA reagent | pT2-CAG-hL1CAM-GFP | Generated for this study | ||
| Other | Gemini X2 HT | BTX Harvard Apparatus | 45–2041 | |
| Other | Petri Dish Platinum Electrode for Tissue Chamber Kit 5 mm | BTX Harvard Apparatus | 45–0505 | |
| Other | Leica VT1000 S | Leica Biosystems | ||
| Commercial assay or kit | STEMdiff Cerebral Organoid Kit | STEMCELL Technologies | 08570 | |
| Other | Millicell Cell Culture Insert | Sigma Aldrich | 32011202 | |
| Other | ACCUMAX cell dissociation reagent | Sigma Aldrich | A7089 | |
| Antibody | anti-RPL8 (Rabbit monoclonal) | Abcam | ab169538 | 1:200 |
| Antibody | anti-RPS10 (Rabbit monoclonal) | Abcam | ab151550 | 1:200 |
| Antibody | anti-RPS16 (Rabbit polyclonal) | Abcam | ab26159 | 1:200 |
| Antibody | anti-RPS26 (Rabbit polyclonal) | Thermo Fisher Scientific | PA5-65975 | 1:200 |
| Antibody | anti-S6 ribosomal protein (Mouse monoclonal) | Cell Signaling Technology | 5548 | 1:100 |
| Antibody | anti-SMI312 (Mouse monoclonal) | BioLegend | 837904 | 1:500 |
| Antibody | anti-MAP2 (Chicken polyclonal) | Abcam | ab5392 | 1:500 |
| Commercial assay or kit | CytoTune EmGFP Sendai Virus Fluorescence Reporter | Thermo Fisher Scientific | A16519 | |
| Chemical compound, drug | SiR-tubulin | Spirochrome | SC002 | |
| Other | Millicell Cell Culture Insert, 30 mm diameter, hydrophilic PTFE, 0.4 µm | Merck Millipore | PICM0RG50 | |
| Other | Disposable biopsy punch, 3.5 mm | Integra | 33–33 | |
| Other | Aspirator tube assemblies for calibrated microcapillary pipettes | Sigma-Aldrich | A5177-5EA | |
| Other | Capillary Tubes Glass, 50 µl volume, 100 mm length | Drummond Scientific | 1-000-0500 | |
| Other | P-2000 micropipette puller | Sutter Instrument | ||
| Other | EM grids, gold, 200 mesh, R 2/2 holey carbon | Quantifoil | ||
| Other | EM grids, gold, 200 mesh, R 3.5/1 holey carbon | Quantifoil | ||
| Software, algorithm | PEET | PMID:16917055 | https://bio3d.colorado.edu/PEET/ | |
| Software, algorithm | IMOD | PMID:8742726 | http://bio3d.colorado.edu/imod/ | |
| Software, algorithm | SerialEM | PMID:16182563 | http://bio3d.colorado.edu/SerialEM/ | |
| Software, algorithm | ec-CLEM plugin for Icy | PMID:28139674 | ||
| Software, algorithm | ImageJ | PMID:22930834 | ||
| Chemical compound, drug | poly-L-ornithine | Sigma Aldrich | P4957 | |
| Chemical compound, drug | Laminin | Sigma Aldrich | L2020 | |
| Chemical compound, drug | Fibronectin | Sigma Aldrich | F0895 |
Additional files
-
Supplementary file 1
File names of the cryo-ET data deposited on EMPIAR (Iudin et al., 2016), and the corresponding numbers given to the respective tomogram snapshots in Figure 2—figure supplements 2–4.
- https://cdn.elifesciences.org/articles/70269/elife-70269-supp1-v1.xlsx
-
Transparent reporting form
- https://cdn.elifesciences.org/articles/70269/elife-70269-transrepform1-v1.docx
Download links
A two-part list of links to download the article, or parts of the article, in various formats.
Downloads (link to download the article as PDF)
Open citations (links to open the citations from this article in various online reference manager services)
Cite this article (links to download the citations from this article in formats compatible with various reference manager tools)
Electron cryo-tomography reveals the subcellular architecture of growing axons in human brain organoids
eLife 10:e70269.
https://doi.org/10.7554/eLife.70269


