The E3 ligase Thin controls homeostatic plasticity through neurotransmitter release repression
- Department of Molecular Life Sciences, University of Zurich, Switzerland
- Zurich Ph.D. Program in Molecular Life Sciences, Switzerland
- Neuroscience Center Zurich, University of Zurich/ETH Zurich, Switzerland
Abstract
Synaptic proteins and synaptic transmission are under homeostatic control, but the relationship between these two processes remains enigmatic. Here, we systematically investigated the role of E3 ubiquitin ligases, key regulators of protein degradation-mediated proteostasis, in presynaptic homeostatic plasticity (PHP). An electrophysiology-based genetic screen of 157 E3 ligase-encoding genes at the Drosophila neuromuscular junction identified thin, an ortholog of human tripartite motif-containing 32 (TRIM32), a gene implicated in several neurological disorders, including autism spectrum disorder and schizophrenia. We demonstrate that thin functions presynaptically during rapid and sustained PHP. Presynaptic thin negatively regulates neurotransmitter release under baseline conditions by limiting the number of release-ready vesicles, largely independent of gross morphological defects. We provide genetic evidence that thin controls release through dysbindin, a schizophrenia-susceptibility gene required for PHP. Thin and Dysbindin localize in proximity within presynaptic boutons, and Thin degrades Dysbindin in vitro. Thus, the E3 ligase Thin links protein degradation-dependent proteostasis of Dysbindin to homeostatic regulation of neurotransmitter release.
Editor's evaluation
The paper focuses on presynaptic homeostatic plasticity (PHP) at the glutamatergic larval Drosophila neuromuscular synapse. In this facet of synaptic plasticity, the presynapse increases neurotransmitter release to compensate for diminished postsynaptic sensitivity. To study functional pathways and identify new molecular components of PHP, the authors carried out an electrophysiology-based genetic screen of E3 ubiquitin ligases – key regulators of protein function and degradation pathway and this screen, which forms the backbone of the paper, generated an extensive dataset encompassing 180 genotypes. In follow-up studies, the authors find that the E3 ligase Thin suppresses glutamate release, likely by targeting and downregulating Dysbindin, a transmitter-release-promoting presynaptic protein and based on the experimental data, a model is put forward according to which PHP arises by relieving Dysbindin of Thin-dependent ubiquitination and degradation. This is a strong paper that adds a highly interesting feature to the understanding of the molecular mechanisms that control synaptic strength.
https://doi.org/10.7554/eLife.71437.sa0Introduction
Nervous system function is remarkably robust despite continuous turnover of the proteins determining neural function. Work in nervous systems of various species has established that evolutionarily conserved homeostatic signaling systems maintain neural activity within adaptive ranges (Marder and Goaillard, 2006; Turrigiano, 2008; Delvendahl and Müller, 2019b). Chemical synapses evolved mechanisms that compensate for neural activity perturbations through homeostatic regulation of neurotransmitter release (‘presynaptic homeostatic plasticity’, PHP) (Petersen et al., 1997; Frank et al., 2006; Delvendahl and Müller, 2019b), or neurotransmitter receptors (synaptic scaling) (Turrigiano et al., 1998). Several studies have established links between homeostatic control of synaptic transmission and neurological disorders, such as autism spectrum disorder (Mullins et al., 2016), schizophrenia (Wondolowski and Dickman, 2013), or amyotrophic lateral sclerosis (Perry et al., 2017; Orr et al., 2020).
Synaptic proteins are continuously synthesized and degraded, resulting in half-lives ranging from hours to months (Cohen et al., 2013; Fornasiero et al., 2018). The ubiquitin–proteasome system (UPS) is a major protein degradation pathway that controls protein homeostasis, or proteostasis. E3 ubiquitin ligases confer specificity to the UPS by catalyzing the ubiquitination of specific target proteins, thereby regulating their function or targeting them for proteasomal degradation (Zheng and Shabek, 2017). Synaptic proteostasis, and E3 ligases in particular, have been implicated in various neurological disorders (George et al., 2018). However, our understanding of the role of E3 ligases in the regulation of synaptic transmission is very limited. While several E3 ligases have been linked to postsynaptic forms of synaptic plasticity (Hegde, 2010), only three E3 ligases, Scrapper (Yao et al., 2007), Highwire (Russo et al., 2019), and Ariadne-1 (Ramírez et al., 2021) have been implicated in the regulation of presynaptic function. Moreover, a systematic investigation of E3 ligase function in the context of synaptic transmission is lacking.
PHP stabilizes synaptic efficacy in response to neurotransmitter receptor perturbation at neuromuscular junctions (NMJs) of Drosophila melanogaster (Petersen et al., 1997; Frank et al., 2006; Delvendahl and Müller, 2019b), mice (Wang et al., 2010), rats (Plomp et al., 1992), and humans (Cull-Candy et al., 1980). Furthermore, there is recent evidence for PHP in the mouse cerebellum (Delvendahl et al., 2019a). The molecular mechanisms underlying PHP are best understood at the Drosophila NMJ (Delvendahl and Müller, 2019b), because this system is amenable to electrophysiology-based genetic screens (Dickman and Davis, 2009; Müller et al., 2011; Delvendahl and Müller, 2019b). At this synapse, pharmacological or genetic impairment of glutamate receptor (GluR) activity triggers a retrograde signal that enhances presynaptic release, thereby precisely compensating for this perturbation (Petersen et al., 1997; Frank et al., 2006). PHP can be induced within minutes after pharmacological receptor impairment (Frank et al., 2006). Severing the motoneuron axons forming the Drosophila NMJ in close vicinity of the NMJ does not impair PHP upon pharmacological receptor impairment (Frank et al., 2006), indicating that the mechanisms underlying rapid PHP expression act locally at the synapse. Moreover, pharmacological inhibition of protein synthesis by cycloheximide does not affect PHP after pharmacological receptor impairment at the Drosophila NMJ (Frank et al., 2006), suggesting that de novo protein synthesis is not required for PHP expression on rapid time scales. By contrast, acute or sustained disruption of the presynaptic proteasome blocks PHP (Wentzel et al., 2018), demonstrating that presynaptic UPS-mediated proteostasis is required for PHP. Furthermore, genetic data link UPS-mediated degradation of two proteins, Dysbindin and RIM, to PHP (Wentzel et al., 2018). Yet, it is currently unclear how the UPS controls PHP. Based on the critical role of E3 ligases in UPS function, we hypothesized an involvement of E3 ligases in PHP.
Here, we realized an electrophysiology-based genetic screen to systematically analyze the role of E3 ligases in neurotransmitter release regulation and PHP at the Drosophila NMJ. This screen discovered that the E3 ligase-encoding gene thin, an ortholog of human TRIM32 (LaBeau-DiMenna et al., 2012; Domsch et al., 2013), controls neurotransmitter release and PHP. We provide evidence that thin regulates the number of release-ready synaptic vesicles through dysbindin, a gene linked to PHP in Drosophila and schizophrenia in humans.
Results
An electrophysiology-based genetic screen identifies thin
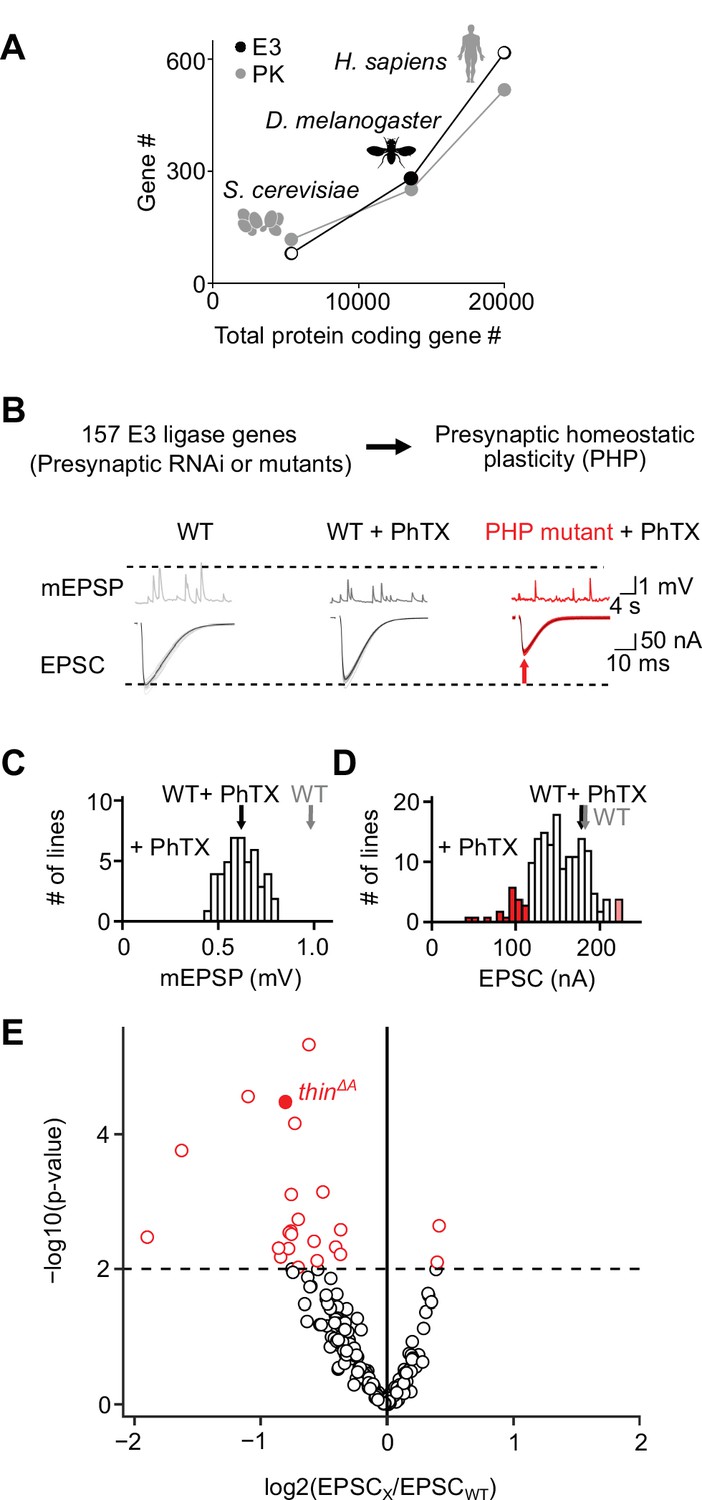
To systematically test the roles of E3 ligases in PHP, we first generated a list of genes predicted to encode E3 ligases in D. melanogaster. To this end, we browsed the D. melanogaster genome for known E3-ligase domains (Du et al., 2011; Ketosugbo et al., 2017). Moreover, we included homologs of predicted vertebrate E3 ligases (see Figure 1—figure supplement 1). This approach yielded 281 putative E3 ligase-encoding genes (Figure 1A), significantly higher than previously predicted for D. melanogaster (207 genes; Du et al., 2011). To explore the relationship between the number of E3 ligase-encoding genes and the number of protein-coding genes, we plotted the number of putative E3 ligase-encoding genes over the total protein-coding gene number of three species and compared it to the relationship between protein kinase-encoding genes and genome size (Figure 1A). The relatively constant ratio between the predicted number of E3 ligase-encoding genes and genome size across species (~0.02–0.03; Figure 1A; Ketosugbo et al., 2017), suggests an evolutionarily conserved stoichiometry between E3 ligases and target proteins, similar to protein kinases (Figure 1A). Hence, a core mechanism of the UPS – protein ubiquitination – is likely conserved in D. melanogaster.
Figure 1 with 2 supplements see all
An electrophysiology-based genetic screen identifies thin as a synaptic homeostasis gene.
(A) The number of putative E3 ubiquitin ligase-encoding genes (E3) and protein kinase-encoding genes (PK) as a function of total protein-coding gene number of C. cerevisiae, D. melanogaster, and H. sapiens. Note the similar relationship between E3 number or PK number and total protein-coding gene number across species. (B) Top: 157 E3 ligase-encoding genes and 11 associated genes (180 lines; presynaptic RNAi expression, elavc155-Gal4>UAS RNAi, or mutants, note that some genes were targeted by more than one line) were tested using two-electrode voltage clamp analysis at the Drosophila neuromuscular junction (NMJ) in the presence of the glutamate receptor (GluR) antagonist philanthotoxin-443 (‘PhTX’) to assess presynaptic homeostatic plasticity (PHP) (see Materials and methods). Bottom: Exemplary miniature excitatory postsynaptic potentials (mEPSPs) and action potential (AP)-evoked excitatory postsynaptic currents (EPSCs) recorded from wild-type (WT), WT in the presence of PhTX (‘WT + PhTX’), and a PHP mutant in the presence of PhTX (‘PHP mutant + PhTX’). Note the decrease in mEPSP amplitude after PhTX treatment, indicating GluR inhibition, and the similar EPSC amplitude between WT and WT + PhTX, suggesting PHP. Small EPSC amplitudes in the presence of PhTX (red arrow) imply a defect in PHP or baseline synaptic transmission. (C) Histogram of mean mEPSP amplitudes for each transgenic or mutant line (mean n = 4 NMJs per line, range 3–12; N = 180 lines) following PhTX treatment. WT averages under control conditions (‘WT’, n = 16) and in the presence of PhTX (‘WT + PhTX’, n = 16) are shown as gray and black arrows, respectively. (D) Histogram of mean EPSC amplitudes (as in C). The red bars indicate transgenic or mutant lines with EPSC amplitudes significantly different from WT in the presence of PhTX (black arrow). (E) Volcano plot of the ratio between the mean EPSC amplitude of a transgenic or mutant line and WT (‘EPSCx/EPSCWT’) in the presence of PhTX (p values from one-way analysis of variance [ANOVA] with Tukey’s multiple comparisons). Transgenic or mutant lines with mean EPSC amplitude changes with p ≤ 0.01 (dashed line) are shown in red. A deletion in the gene thin (CG15105; thinΔA; LaBeau-DiMenna et al., 2012) that was selected for further analysis is shown as a filled red circle. One-way ANOVA with Tukey’s multiple comparisons was performed for statistical testing (C–E).
After prioritizing for evolutionarily conserved genes that were shown or predicted to be expressed in the nervous system (Figure 1—figure supplement 1), we investigated PHP after genetic perturbation of 157 putative E3 ligase genes and 11 associated genes (180 lines, Supplementary file 1, Figure 1B). Specifically, we recorded spontaneous miniature excitatory postsynaptic potentials (mEPSPs) and action potential (AP)-evoked excitatory postsynaptic currents (EPSCs) after applying subsaturating concentrations of the GluR antagonist philanthotoxin-443 (PhTX) for 10 min (20 μM; extracellular Ca2+ concentration, 1.5 mM). At wild-type (WT) NMJs, PhTX treatment significantly reduced mEPSP amplitude compared to untreated controls (Figure 1C, black and gray arrows), indicating GluR perturbation. By contrast, AP-evoked EPSC amplitudes were similar between PhTX-treated and untreated WT NMJs (Figure 1D, black and gray arrows). Together with a reduction in mEPSP amplitude, a similar EPSC amplitude suggests a homeostatic increase in neurotransmitter release after PhTX treatment in WT, consistent with PHP (Frank et al., 2006). PhTX also reduced mean mEPSP amplitudes in the 180 transgenic or mutant lines (either presynaptic/neuronal RNAi expression, elavc155-Gal4>UAS RNAi; or mutations within the respective coding sequence, see Materials and methods) compared to untreated WT controls (Figure 1C). Moreover, the mean EPSC amplitude of the majority of the tested lines did not differ significantly from the mean WT EPSC amplitudes recorded at PhTX-treated NMJs (Figure 1D, compare white bars with black arrow). The combination of a decrease in mEPSP amplitude and largely unchanged EPSC amplitude indicates that the majority of the tested lines likely display PHP. We also identified 21 transgenic or mutant lines with significantly smaller EPSC amplitudes compared to PhTX-treated WT NMJs, and two lines with increased EPSC amplitudes (Figure 1D, E, red data). The lines with smaller EPSC amplitudes represent candidate transgenic or mutant lines with disrupted PHP. One of the mutant lines with significantly smaller EPSC amplitudes in the presence of PhTX was a previously described deletion of the gene thin/abba (tn, CG15105), henceforth called thin (thinΔA; LaBeau-DiMenna et al., 2012; Figure 1E, filled red data). thin encodes an E3 ligase with a N-terminal tripartite motif (TRIM), which contains one RING-finger domain, two zinc-finger domains (B1 box and B2 box), and its associated coiled-coil region, followed by a disordered region and C-terminal NHL repeats (Figure 1—figure supplement 2). Based on this domain composition, thin likely represents the Drosophila ortholog of human TRIM32 (Figure 1—figure supplement 2), consistent with earlier work (LaBeau-DiMenna et al., 2012). thin was selected for further analysis.
Presynaptic thin promotes PHP
In the genetic screen, we compared synaptic transmission between a given genotype and WT controls in the presence of PhTX (Figure 1C–E). Hence, the small EPSC amplitude of thinΔA mutants seen after PhTX application could be either due to impaired PHP, or a defect in baseline synaptic transmission. To distinguish between these possibilities, we next quantified synaptic transmission in the absence and presence of PhTX in thinΔA mutants (Figure 2). Similar to WT controls, PhTX application significantly reduced mEPSC amplitude by ~40% in thinΔA mutants (Figure 2A, B), suggesting similar receptor impairment. At WT synapses, EPSC amplitudes were similar in the absence and presence of PhTX (Figure 2A, C). In combination with the decrease in mEPSC amplitude (Figure 2B), PhTX incubation increased quantal content (EPSC amplitude/mEPSC amplitude) in WT (Figure 2D), indicating homeostatic release potentiation. By contrast, PhTX treatment significantly reduced EPSC amplitudes in thinΔA mutants (Figure 2A, C) and did not increase quantal content (Figure 2D). These data show that thin is required for acute PHP expression.
Figure 2 with 1 supplement see all

Homeostatic plasticity requires presynaptic thin.
(A) Representative excitatory postsynaptic currents (EPSCs) (individual sweeps and averages are shown in light colors and black, respectively), and mEPSCs (insets) of wild-type (WT) (gray), thinΔA mutants (red), presynaptic thin expression in thinΔA mutants (elavc155-Gal4>UAS-thin; thinΔA, ‘thinΔA pre. rescue’, blue), and postsynaptic thin expression in thinΔA mutants (24B-Gal4>UASthin; thinΔA, ‘thinΔA post. rescue’, green) in the absence and presence of philanthotoxin-443 (PhTX) (‘+PhTX’, darker colors). Stimulation artifacts were blanked for clarity. Note the decreased EPSC amplitudes at PhTX-treated thinΔA mutant neuromuscular junctions (NMJs) and thinΔA post. rescue NMJs, indicating impaired presynaptic homeostatic plasticity (PHP). Mean mEPSC amplitudes (B), EPSC amplitudes (C), quantal content after PhTX treatment normalized to the respective untreated control (D), in the absence (‘−’) and presence (‘+’) of PhTX, as well as baseline quantal content of the indicated genotypes in the absence (‘−’) of PhTX normalized to WT (E). Note that PhTX did not enhance quantal content in thinΔA mutants (D), indicating impaired PHP. Also note the increased quantal content under baseline conditions in thinΔA mutants (E), suggesting increased release. The PHP and baseline synaptic transmission defects are restored upon presynaptic thin expression in the mutant background. Mean ± standard error of the mean (SEM) (WT − PhTX: n = 14, WT + PhTX: n = 13; thinΔA − PhTX: n = 18; thinΔA + PhTX: n = 21; pre. res. − PhTX: n = 11; pre. res.+ PhTX: n = 10; post. res. − PhTX: n = 25; post. res.+ PhTX: n = 24); *p < 0.05; **p < 0.01; ***p < 0.001; n.s.: not significant; two-way analysis of variance (ANOVA) followed by Tukey’s post hoc test (B–D) and one-way ANOVA with Tukey’s multiple comparisons (E).
-
Figure 2—source data 1
Related to Figure 2.
- https://cdn.elifesciences.org/articles/71437/elife-71437-fig2-data1-v2.xlsx
To test if presynaptic or postsynaptic thin promotes PHP, and if the PHP defect is indeed caused by loss of thin, we assessed PHP after presynaptic or postsynaptic expression of a thin transgene in the thinΔA mutant background. PhTX treatment significantly reduced mEPSC amplitudes after neural/presynaptic (elavc155-Gal4) or postsynaptic (24B-Gal4) expression of thin (UAS-thin) in thinΔA mutants (Figure 2A, B). After presynaptic thin expression in thinΔA mutants (presynaptic rescue or ‘pre. rescue’), quantal content was significantly increased upon PhTX treatment (Figure 2D, blue data), and EPSC amplitudes were restored toward control levels in the absence of PhTX (Figure 2A, C, blue data). Note that the partial rescue may be due to thin overexpression or defects in muscle architecture (LaBeau-DiMenna et al., 2012). By contrast, quantal content was similar between PhTX-treated and untreated NMJs after postynaptic thin expression in the thinΔA mutant background (postsynaptic rescue or ‘post. rescue’; Figure 2D, green data), and PhTX application reduced EPSC amplitudes (Figure 2A, C, green data). Thus, presynaptic, but not postsynaptic thin expression enhanced quantal content after PhTX treatment in the thinΔA mutant background (Figure 2D), implying a presynaptic role for thin in PHP.
We also noted a decrease in mEPSC amplitude in thinΔA mutants compared to WT in the absence of PhTX (Figure 2A, B), which is most likely due to impaired muscle architecture in thinΔA mutants (LaBeau-DiMenna et al., 2012; Domsch et al., 2013). Postsynaptic, but not presynaptic thin expression, significantly increased mEPSC amplitudes toward WT levels in the thinΔA mutant background (Figure 2A, B), suggesting that postsynaptic thin is required for normal mEPSC amplitude levels. Furthermore, thinΔA mutants displayed a significant increase in quantal content compared to WT under baseline conditions in the absence of PhTX (Figure 2E), which was rescued by presynaptic, but not postsynaptic thin expression (Figure 2E). These data are consistent with the idea that presynaptic thin represses release under baseline conditions (see Figure 4, Figure 6). By extension, the increased release under baseline conditions in thinΔA mutants may partially occlude PHP in response to receptor perturbation (see Discussion).
At the Drosophila NMJ, genetic ablation of the GluRIIA subunit in GluRIIASP16 mutants reduces quantal size and induces sustained PHP (Petersen et al., 1997). To test if thin is required for sustained PHP expression, we generated recombinant flies carrying the GluRIIASP16 and the thinΔA mutation (‘GluRIIASP16, thinΔA’). While we observed a significant increase in quantal content in GluRIIASP16 mutants compared to wild type (Figure 2—figure supplement 1), indicating sustained PHP expression, there was no increase in quantal content in GluRIIASP16, thinΔA double mutants compared to thinΔA mutants (Figure 2—figure supplement 1). Hence, thin is also necessary for sustained PHP expression, providing independent evidence for its role in homeostatic release regulation.
Changes in NMJ development unlikely underlie the PHP defect in thin mutants
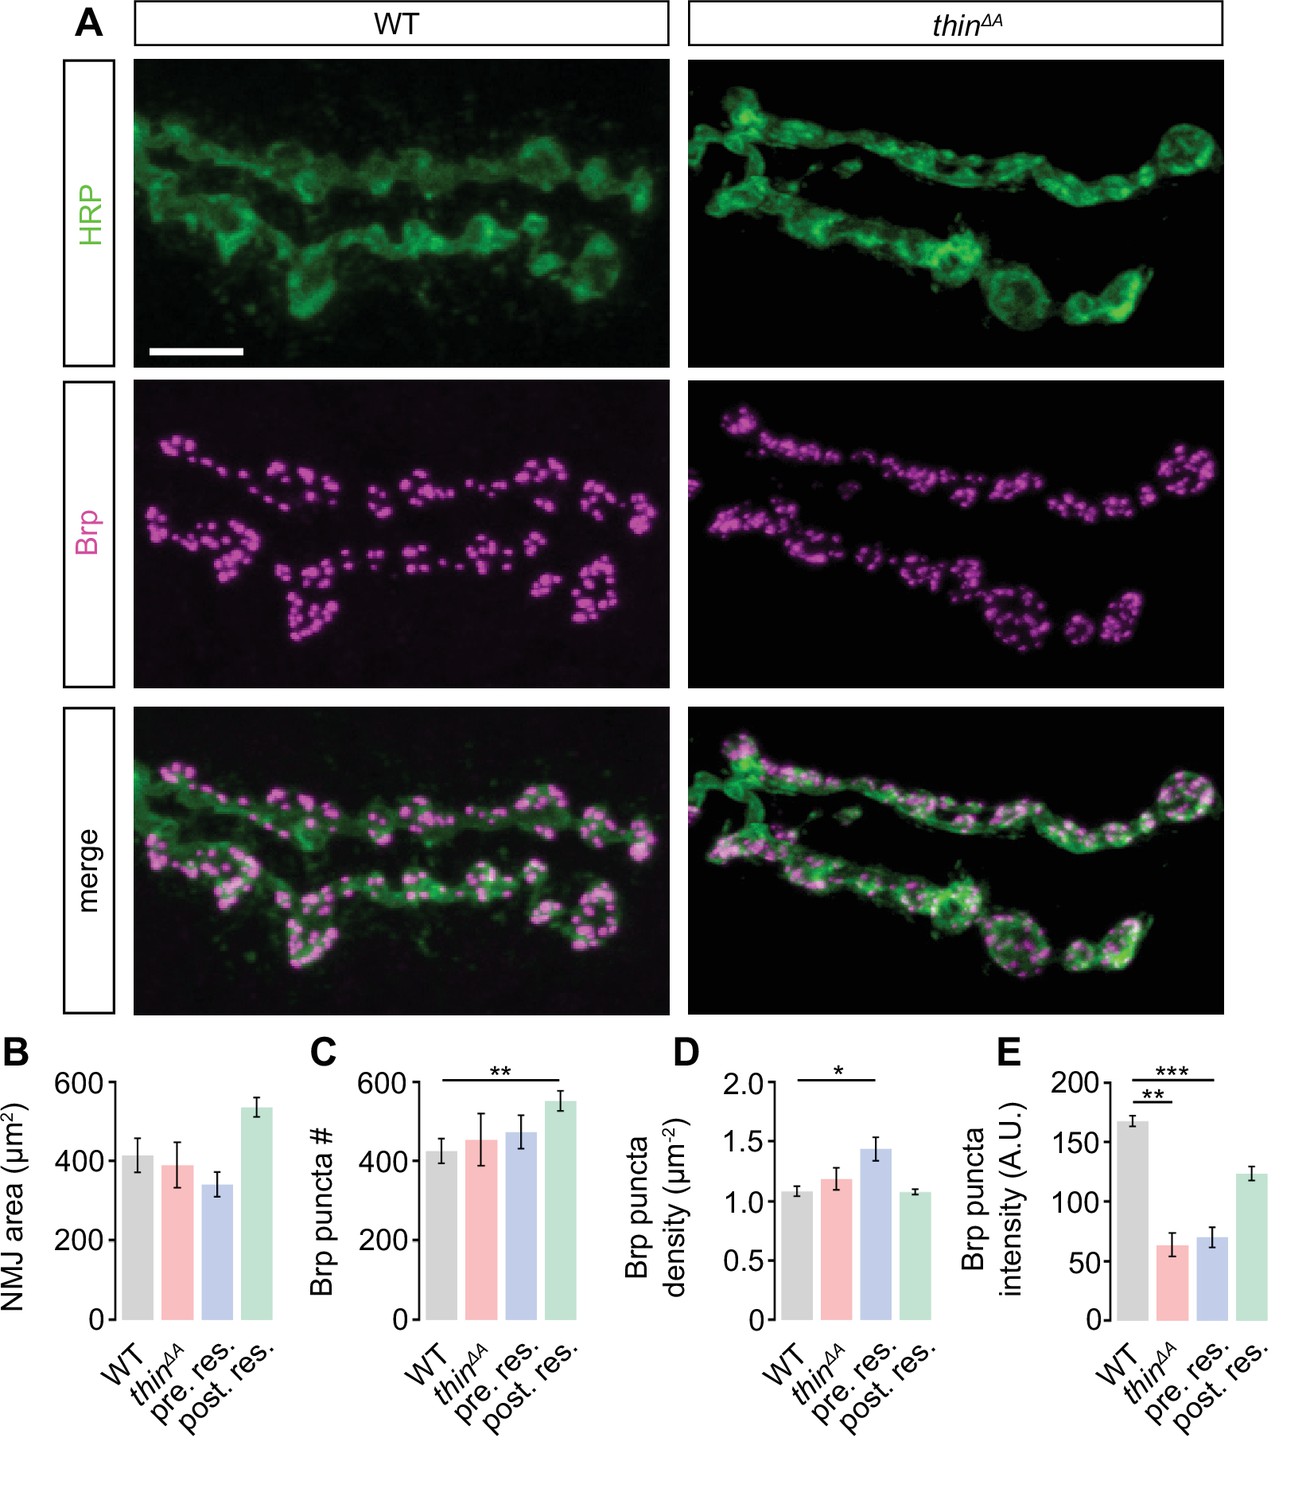
The PHP defect and the release enhancement under baseline conditions after presynaptic thin perturbation may arise from impaired synaptic development. To test this possibility, we investigated NMJ morphology in thin mutants (Figure 3). Immunostainings with an antibody detecting neuronal membrane (anti-horseradish peroxidase, ‘HRP’; Figure 3A; Jan and Jan, 1982) revealed no changes in HRP area in thinΔA mutants or after presynaptic rescue (thinΔA; elavc155-Gal4>UAS thin), and a trend toward increased HRP area after postsynaptic rescue (thinΔA; 24BGal4>UAS thin) compared to WT (Figure 3B). Analysis of the active-zone marker Bruchpilot (anti-Bruchpilot, ‘Brp’; Kittel et al., 2006) uncovered no changes in Brp puncta number per NMJ in thinΔA mutants or after presynaptic rescue, and a slight increase after postsynaptic rescue compared to WT (Figure 3A, C). Brp density (Brp puncta #/HRP area) was unchanged in thinΔA mutants or after postsynaptic rescue, and slightly increased after presynaptic rescue (Figure 3D). Finally, we observed a decrease in Brp puncta intensity in thinΔA mutants and upon presynaptic rescue (Figure 3E). In principle, these morphological alterations could be related to the PHP defect, or the release enhancement seen in thinΔA mutants. However, while HRP area and Brp puncta number were unchanged in thinΔA mutants (Figure 3B, C), PHP was blocked, and baseline synaptic transmission enhanced (Figure 2). In addition, postsynaptic thin expression in WT induced an increase in HRP area and Brp puncta number (Figure 3—figure supplement 1B, C), but neither impaired PHP nor enhanced release (Figure 3—figure supplement 1F–K). Furthermore, Brp intensity was decreased after presynaptic rescue (Figure 3E) and postsynaptic thin overexpression in WT (Figure 3—figure supplement 1E), whereas synaptic physiology was unchanged in these genotypes (Figure 2, Figure 3—figure supplement 1F–K). Conversely, Brp intensity was unchanged after presynaptic thinRNAi expression (elavc155-Gal4>UAS-thinRNAi), while PHP was blocked and baseline synaptic transmission enhanced (Figure 4, Figure 4—figure supplement 1). Collectively, these data suggest that the morphological changes seen after thin perturbation are separable from synaptic physiology. Thus, although we cannot rule out that changes in NMJ morphology contribute to the PHP defect or the increase in release in thin mutants, we consider this possibility unlikely (see Discussion).
Figure 3 with 1 supplement see all
Slight alterations in neuromuscular junction (NMJ) morphology upon genetic thin manipulations.
(A) Maximum intensity projection of a wild-type (WT) (left) and thinΔA mutant NMJ (right) (muscle 6) stained against the Drosophila neuronal membrane marker anti-HRP (‘HRP’) and the active-zone marker Bruchpilot (‘Brp’); scale bar, 10 µm. Mean HRP area per NMJ ‘HRP area’ (B), Brp puncta number per NMJ ‘Brp puncta #’ (C), Brp puncta number/HRP area per NMJ ‘Brp density’ (D), and Brp puncta fluorescence intensity (E) of the indicated genotypes (‘Postsynaptic rescue’: 24B-Gal4>UAS-thin; thinΔA; ‘presynaptic rescue’: elavc155-Gal4>UASthin; thinΔA). Although changes in the recorded parameters may contribute to changes in synaptic physiology, altered NMJ morphology was separable from synaptic physiology (see Results, Discussion, Figure 2, Figure 3—figure supplement 1, Figure 4, Figure 4—figure supplement 1). Mean ± standard error of the mean (SEM); WT: n = 10, thinΔA: n = 8, pre. res.: n = 12; post. res.: n = 13; *p < 0.05; **p < 0.01; ***p < 0.001; n.s.: not significant; Student’s t-test.
-
Figure 3—source data 1
Related to Figure 3.
- https://cdn.elifesciences.org/articles/71437/elife-71437-fig3-data1-v2.xlsx
Figure 4 with 1 supplement see all
Thin negatively regulates release-ready vesicle number.
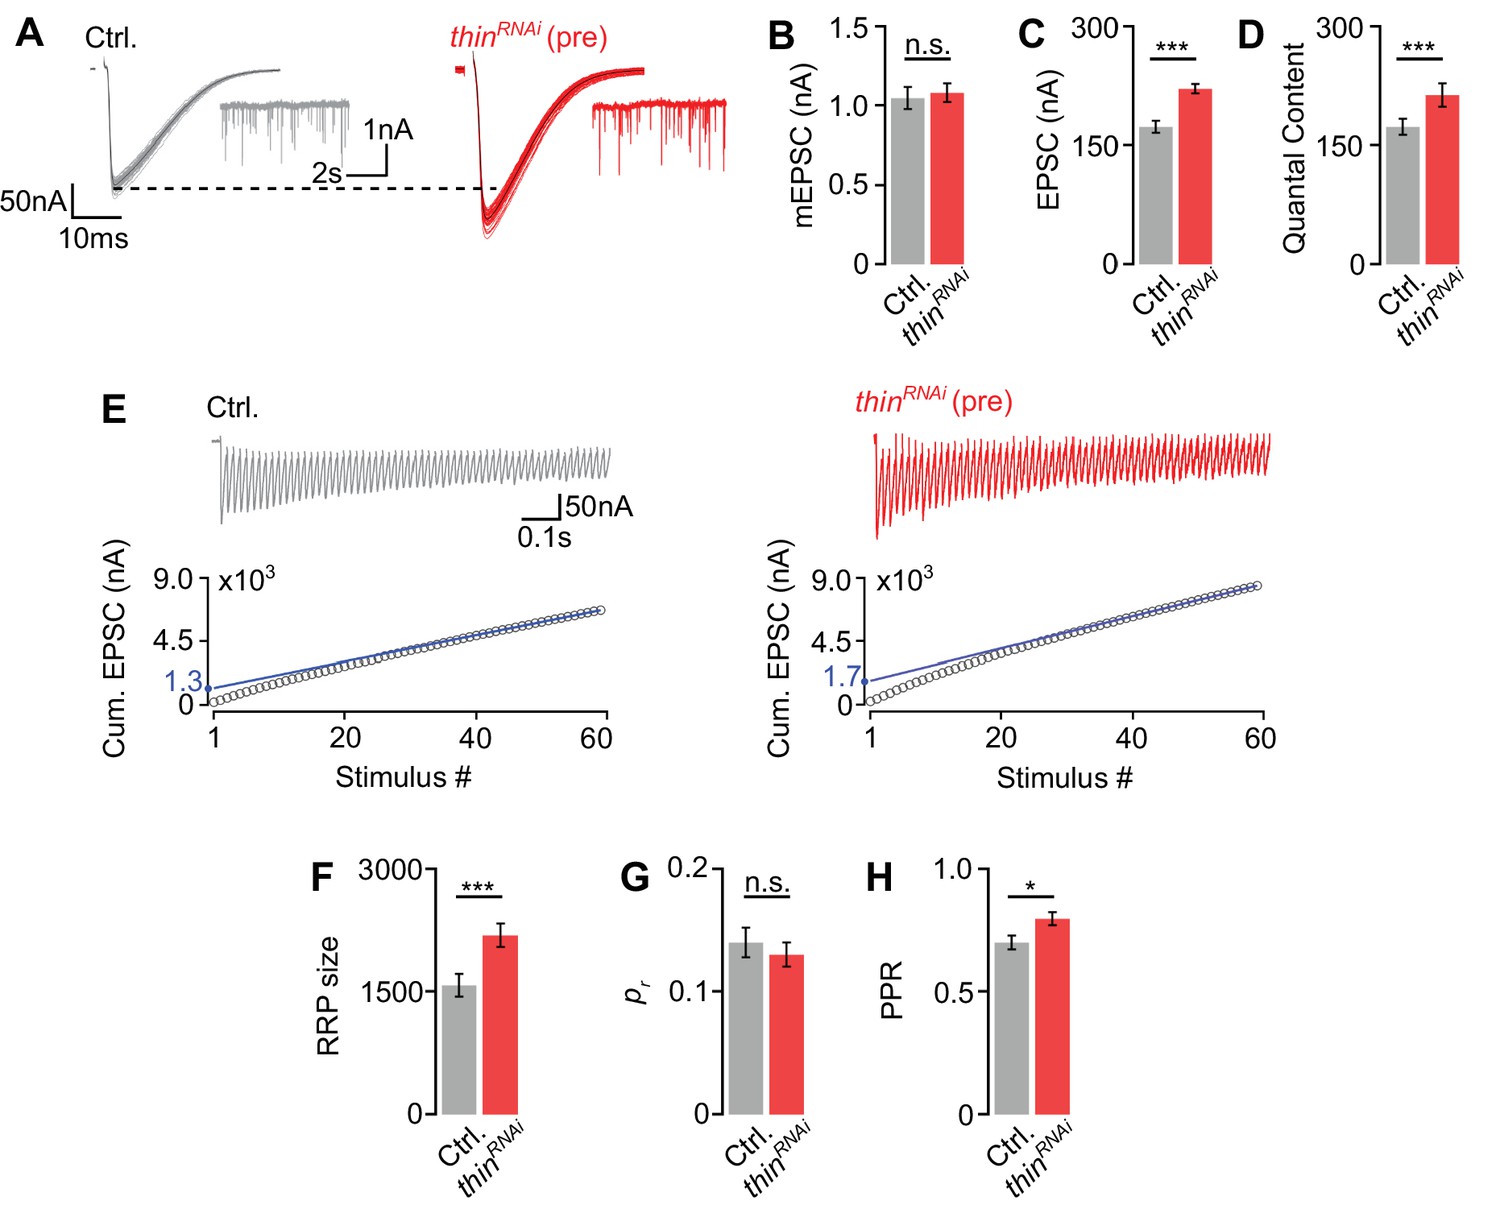
(A) Representative excitatory postsynaptic currents (EPSCs) (individual sweeps and averages are shown in light colors and black, respectively), and mEPSCs (insets) of controls (elavc155-Gal4>UAS-mCherryRNAi, ‘Ctrl.’, gray) and presynaptic thinRNAi (elavc155-Gal4>UAS-thinRNAi, ‘thinRNAi (pre)’, red). Mean mEPSC amplitudes (B), EPSC amplitudes (C), and quantal content (D) of the indicated genotypes. (E) Representative EPSC train (60 Hz, 60 stimuli, top) and cumulative EPSC amplitudes (‘cum. EPSC’, bottom) of control and presynaptic thinRNAi. The blue line is a line fit to the last 15 cum. EPSC amplitudes that was back-extrapolated to t = 0 (see Materials and methods). Mean readilyreleasable vesicle pool (RRP) size (cum. EPSC/mEPSC) (F), release probability (‘pr’, EPSC1/cum. EPSC) (G), and paired-pulse ratio (‘PPR’, EPSC2/EPSC1) (H) of the indicated genotypes. Note the increase in EPSC amplitude and RRP size in presynaptic thinRNAi. Mean ± standard error of the mean (SEM); Ctrl.: n = 16, thinRNAi: n = 17; *p < 0.05; ***p < 0.001; n.s.: not significant; Student’s t-test.
-
Figure 4—source data 1
Related to Figure 4.
- https://cdn.elifesciences.org/articles/71437/elife-71437-fig4-data1-v2.xlsx
thin negatively regulates release-ready vesicle number
Having established that thin is required for acute and sustained PHP expression, we next explored the role of thin in the regulation of neurotransmitter release under baseline conditions. thinΔA mutants display increased neurotransmitter release in the absence of PhTX, and this increase in release is rescued by presynaptic thin expression (Figure 2). We also noted a decrease in mEPSC amplitude in thinΔA mutants (Figure 2B), which may confound conclusions regarding presynaptic thin function. We therefore focused our further analyses on the effects of presynaptic thinRNAi expression.
First, we tested PHP after presynaptic thinRNAi expression (elavc155-Gal4>UAS-thinRNAi) and observed a complete PHP block (Figure 4—figure supplement 1F–I), providing independent evidence for a role of presynaptic thin in PHP. To elucidate the mechanisms through which thin negatively modulates release under baseline conditions, we probed the size of the readily releasable pool of synaptic vesicles (RRP) and neurotransmitter release probability (pr) after presynaptic thin perturbation (Figure 4). Presynaptic thinRNAi expression (elavc155-Gal4>UAS-thinRNAi) significantly increased EPSC amplitudes and quantal content (Figure 4A, C, D), with no significant effects on mEPSC amplitudes compared to controls (elavc155-Gal4>UAS-mCherryRNAi; Figure 4A, B), suggesting that presynaptic thin represses release, consistent with the data obtained from thinΔA mutants (Figure 2). Note that the smaller mEPSC and EPSC amplitudes under baseline conditions after postsynaptic thin rescue (Figure 2B, C) compared to thinRNAi (Figure 4B, C) are most likely due to non-endogenous postsynaptic Thin levels caused by thin overexpression in the thinΔA mutant background. Next, we estimated RRP size using cumulative EPSC amplitude analysis during high-frequency stimulation (60 Hz; Weyhersmüller et al., 2011; Müller et al., 2012; Figure 4E). This analysis revealed a significantly larger RRP size upon presynaptic thinRNAi expression compared to controls (Figure 4E, F), implying that presynaptic thin negatively regulates RRP size. We then estimated pr based on the ratio between the first EPSC amplitude of the stimulus train and the cumulative EPSC amplitude, and observed no significant pr differences between presynaptic thinRNAi and controls (Figure 4G). We noted that the paired-pulse ratio between the second and first EPSC amplitude during 60 Hz stimulation was slightly increased after presynaptic thinRNAi expression compared to controls (Figure 4H), implying a slight decrease in pr. These data suggest that the increase in release after presynaptic thinRNAi expression is unlikely caused by an increase in pr, and that presynaptic thinRNAi expression may even slightly decrease pr. Presynaptic thinRNAi expression also slightly increased Brp number (Figure 4—figure supplement 1), which may contribute to the increase in release after presynaptic thinRNAi expression (see Discussion). However, our analysis of thinΔA mutants implies that changes in NMJ size unlikely underlie the defects in synaptic physiology after presynaptic loss of thin (Figures 2 and 3). Together, we conclude that presynaptic thin opposes release by limiting the number of release-ready synaptic vesicles with largely unchanged pr.
Thin localizes in proximity to Dysbindin
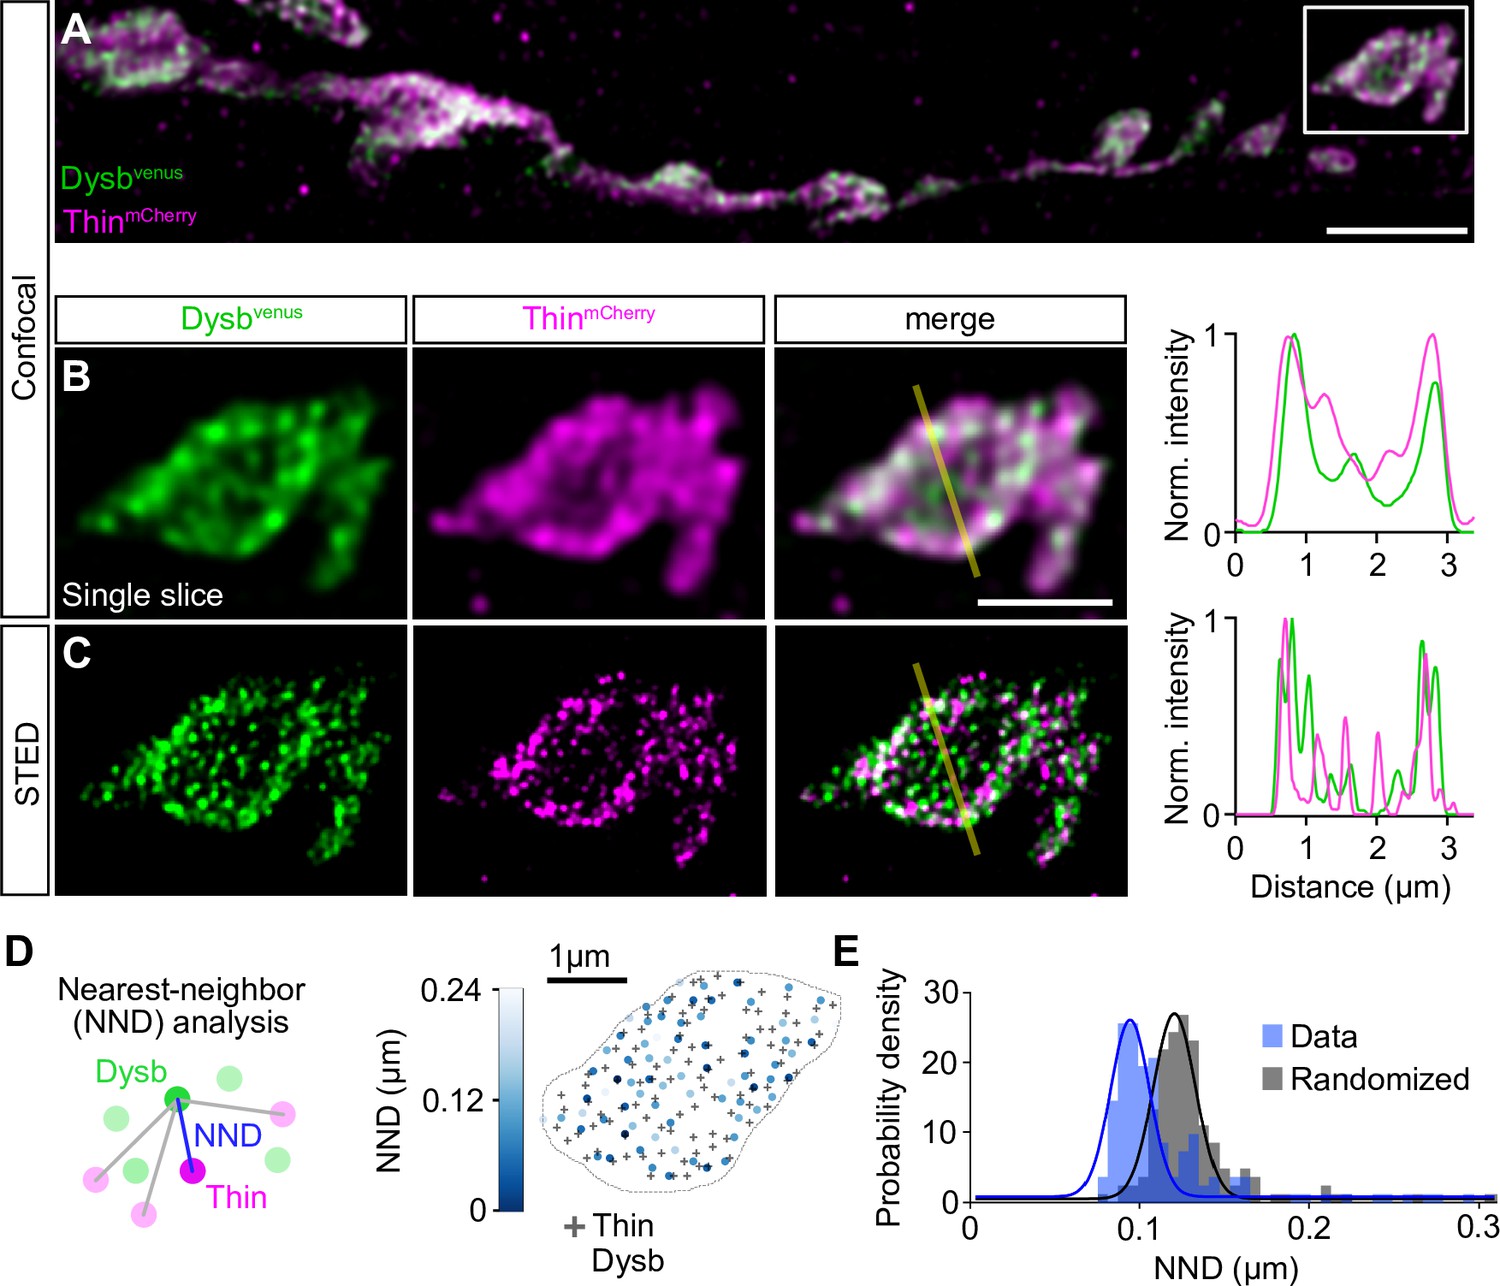
TRIM32, Thin’s predicted human ortholog (Figure 1—figure supplement 2), ubiquitinates Dysbindin and targets it for degradation in cultured human cells (Locke et al., 2009). dysbindin, in turn, is required for PHP at the Drosophila NMJ (Dickman and Davis, 2009), and genetic evidence suggests that the UPS controls Dysbindin under baseline conditions and during PHP at the Drosophila NMJ (Wentzel et al., 2018). We therefore explored the relationship between Thin and Dysbindin. First, we investigated the localization of Thin in relation to Dysbindin within synaptic boutons (Figure 5). Previous studies suggest very low endogenous Dysbindin levels that preclude direct immunohistochemical analysis at the Drosophila NMJ (Dickman and Davis, 2009; Wentzel et al., 2018). However, presynaptic expression of a fluorescently tagged dysbindin transgene revealed that Dysbindin localizes in close proximity to synaptic vesicle markers (Dickman and Davis, 2009; Figure 5—figure supplement 1A–C). The localization of fluorescently tagged Dysbindin likely overlaps with the one of endogenous Dysbindin, as its presynaptic expression rescues the PHP defect in dysbindin mutants (Dickman and Davis, 2009). Although we observed anti-Thin fluorescence in close proximity to Brp (Figure 5—figure supplement 1D, E), thin expression in Drosophila muscles makes it difficult to distinguish between presynaptic and postsynaptic Thin (LaBeau-DiMenna et al., 2012; Figure 5—figure supplement 1D, E). This prompted us to analyze the localization of fluorescently tagged Thin, which we expressed presynaptically (elavc155-Gal4>UAS-thinmCherry), in relation to Dysbindin. Presynaptic ThinmCherry partially overlapped with presynaptic fluorescently tagged Dysbindin (elavc155-Gal4>UAS-dysbvenus) at confocal resolution (Figure 5A and B). The localization of fluorescently tagged Thin also likely overlaps with endogenous Thin, because presynaptic thin expression restores PHP and synaptic transmission in thin mutants (Figure 2). As indicated by the line profile across a bouton (Figure 5B), Dysbindin and Thin fluorescence intensity increased toward the bouton periphery (Figure 5B), similar to synaptic vesicle markers, such as synapsin (Figure 5—figure supplement 1A, B). With stimulated emission depletion microscopy with time-gated detection (gSTED), fluorescently tagged Thin and Dysbindin appeared as distinct spots (Figure 5C). To investigate the relationship between fluorescently tagged Thin and Dysbindin, we quantified the nearest-neighbor distance (NND) between Thin and Dysbindin spots (Figure 5D; see Materials and methods). This analysis revealed significantly smaller NNDs between ThinmCherry and Dysbvenus spots than expected from random spot distributions (Figure 5E), implying a relationship between Thin and Dysbindin localization within synaptic boutons. Based on the proximity between Dysbindin and synaptic vesicle markers (Dickman and Davis, 2009; Figure 5—figure supplement 1A–C), these data indicate that a fraction of Thin localizes in the vicinity of Dysbindin and synaptic vesicles.
Figure 5 with 2 supplements see all
Thin localizes in close proximity to Dysbindin.
(A) Confocal maximum intensity projection of a representative neuromuscular junction (NMJ) branch (muscle 6–7) after presynaptic coexpression (elavc155-Gal4) of venus-tagged Dysbindin (UAS-venus-Dysbindin, ‘Dysbvenus’, green) and mCherry-tagged Thin (UAS-mCherry-thin, ‘ThinmCherry’, magenta) detected with anti-GFP and anti-DsRed, respectively. (B) Single plane of the synaptic bouton highlighted by the white square in (A) with corresponding line profile (right). The yellow line demarks the location of the line profile. (C) gSTED image of the synaptic bouton shown in (B) with corresponding line profile (right). Scale bar, A: 5 µm; B, C: 2 µm. Note the partial overlap between ThinmCherry and Dysbindinvenus at confocal and STED resolution. (D) Left: Schematic of nearest-neighbor (NND) analysis between ThinmCherry and Dysbindinvenus puncta at STED resolution. Right: ThinmCherry puncta (‘+’, maximum locations, see Materials and methods) and the NNDs and locations of Dysbindinvenus puncta (color code denotes NND) of a representative bouton. (E) Histogram of mean ThinmCherry − Dysbindinvenus NND per bouton of the recorded gSTED data (blue), or after randomized punctum distribution (gray, see Materials and methods). N = 10 NMJs, average n = 13 boutons per NMJ for data and simulations. Observed vs. randomized NNDs, p < 0.001; Student’s t-test.
-
Figure 5—source data 1
Related to Figure 5.
- https://cdn.elifesciences.org/articles/71437/elife-71437-fig5-data1-v2.xlsx
To provide independent evidence for a relationship between Thin and Dysbindin localization, and to explore if Thin acts as an E3 ubiquitin ligase for Dysbindin in Drosophila, we turned to cultured Drosophila Schneider 2 (S2) cells. Interestingly, while anti-Thin fluorescence was homogenously distributed within S2 cells under control conditions (Figure 5—figure supplement 2A), dysbindin (dysbvenus) overexpression led to a redistribution of anti-Thin fluorescence into clusters that localized in close proximity to anti-Dysbindin clusters (Figure 5—figure supplement 2A). Moreover, anti-Thin and anti-Dysbindin fluorescence intensities were highly correlated (Figure 5—figure supplement 2B), suggesting a possible interaction between Thin and Dysbindin in S2 cells, similar to the Drosophila NMJ (Figure 5). Next, we assessed whether Thin expression affects Dysbindin abundance in S2 cells by western blot analysis. We observed a decrease in Dysbvenus levels upon increasing ThinHA expression levels (Figure 5—figure supplement 2C, D). Although we cannot exclude the possibility that Thin overexpression induced artificial Dysbindin ubiquitination by excess enzyme binding with low affinity, these data are consistent with the idea that Thin acts as an E3 ligase for Dysbindin in Drosophila, similar to TRIM32 in humans (Locke et al., 2009).
thin represses release through dysbindin
We next explored a possible genetic interaction between thin and dysbindin in the context of synaptic physiology. As thin and dysbindin mutants alone disrupt PHP, the analysis of double mutants would not be informative. We therefore investigated baseline synaptic transmission after presynaptic thinRNAi expression in the dysbindin mutant background (Figure 6). Neither presynaptic thinRNAi expression (elavc155-Gal4>UAS-thinRNAi) in the WT background, nor in the dysb1 mutant background affected mEPSC amplitude (Figure 6A, B). While presynaptic thinRNAi expression enhanced EPSC amplitude and quantal content in the WT background (Figure 6C, D; see also Figure 4), presynaptic thinRNAi expression neither affected EPSC amplitude (Figure 6C) nor quantal content (Figure 6D) in the dysb1 mutant background. These data provide genetic evidence that thin negatively controls release through dysbindin (Figure 6E).
Figure 6
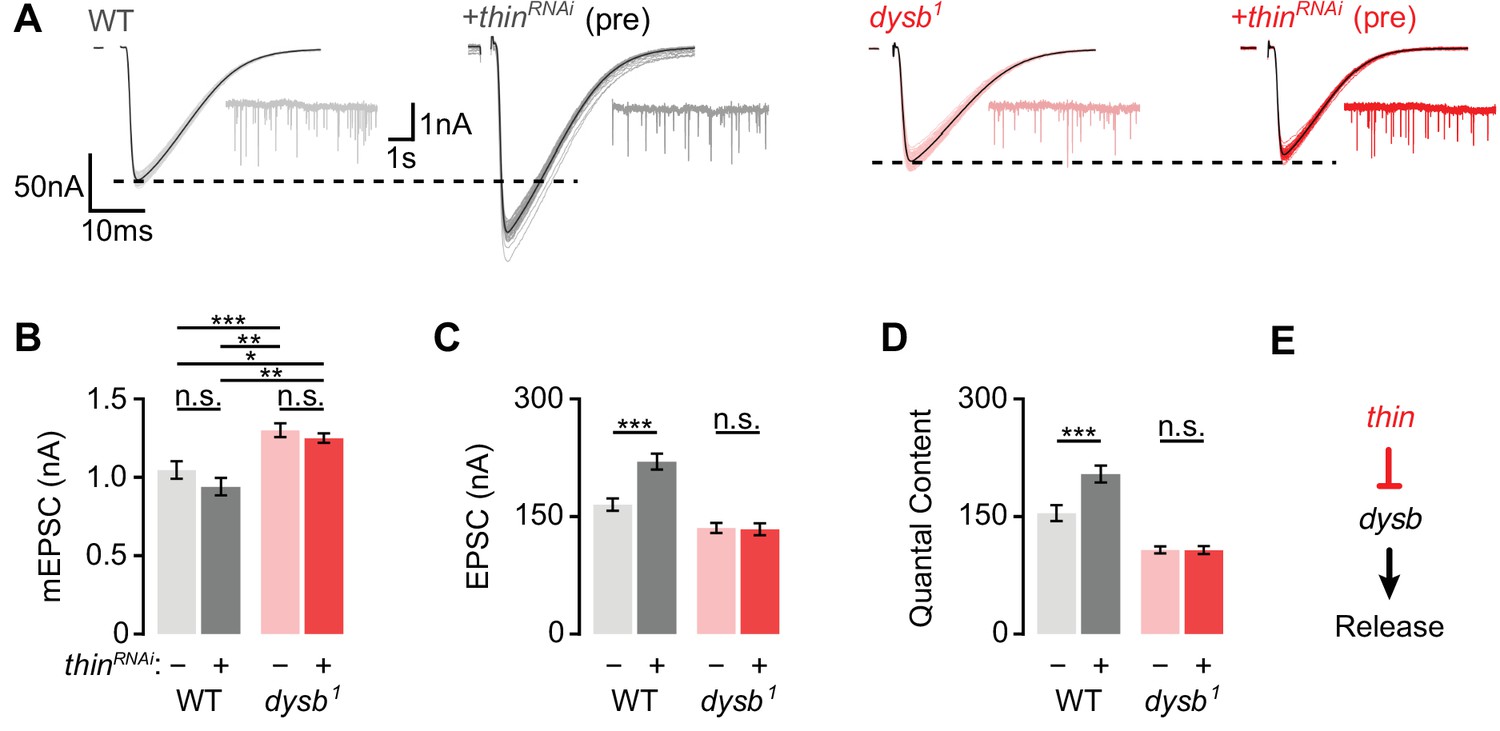
Thin represses release through dysbindin.
(A) Representative excitatory postsynaptic currents (EPSCs) (individual sweeps and averages are shown in light colors and black, respectively), and mEPSCs (insets) of wild-type (WT) (gray) and presynaptic thinRNAi (elavc155-Gal4>UAS-thinRNAi, ‘+thinRNAi (pre)’, dark gray), dysb1 mutants (light red), and presynaptic thinRNAi in the dysb1 mutant background (elavc155-Gal4/Y; UAS-thinRNAi/+; dysb1, ‘+thinRNAi (pre)’, dark red). Mean mEPSC amplitudes (B), EPSC amplitudes (C), and quantal content (D) of the indicated genotypes. Note that presynaptic thinRNAi expression increases EPSC amplitude and quantal content in WT, but not in dysb1 mutants. Mean ± standard error of the mean (SEM); WT: n = 17, elavc155-Gal4>UAS-thinRNAi: n = 17, dysb1: n = 12, elavc155-Gal4/Y; UAS-thinRNAi/+; dysb1: n = 12; *p < 0.05; **p < 0.01; ***p < 0.001; n.s.: not significant; two-way analysis of variance (ANOVA) followed by Tukey’s post hoc test. (E) Working model: Our genetic data support a model in which thin controls neurotransmitter release (‘Release’) through negative regulation of dysbindin (‘dysb’).
-
Figure 6—source data 1
Related to Figure 6.
- https://cdn.elifesciences.org/articles/71437/elife-71437-fig6-data1-v2.xlsx
Discussion
Employing an electrophysiology-based genetic screen targeting 157 E3 ligase-encoding genes at the Drosophila NMJ, we discovered that a mutation in the E3 ligase-encoding gene thin disrupts acute and sustained PHP. Presynaptic loss of thin led to increased release and RRP size, largely independent of gross synaptic morphological changes. Thin and Dysbindin localize in proximity within synaptic boutons, and biochemical evidence suggests that Thin degrades Dysbindin in vitro. Finally, presynaptic thin perturbation did not enhance release in the dysbindin mutant background, providing genetic evidence that thin represses release through dysbindin. As thin and dysbindin are required for PHP, these data are consistent with a model in which thin controls neurotransmitter release during PHP and under baseline conditions through dysbindin.
Our study represents the first systematic investigation of E3 ligase function in the context of synaptic transmission. A considerable fraction of the transgenic lines tested (11%) displayed a decrease in EPSC amplitude after PhTX treatment (Figure 1C–E). These E3 ligase-encoding genes may either be required for PHP and/or baseline synaptic transmission. Previous PHP screens in the same system identified PHP mutants with a hit rate of ~3% (Dickman and Davis, 2009; Müller et al., 2011). Thus, our data indicate that E3 ligase function plays a special role in PHP and/or baseline synaptic transmission. As more transgenic or mutant lines exhibited a decrease in synaptic transmission, we conclude that the net effect of E3 ligases is to promote synaptic transmission at the Drosophila NMJ. Given the evolutionary conservation of most E3 ligase-encoding genes tested in this study (Figure 1, Supplementary file 1), the results of our screen may allow predicting the roles of the tested E3 ligases in neurotransmitter release regulation in other systems.
Previous studies linked E3 ligases to synaptic development and synaptic function at the Drosophila NMJ (Wan et al., 2000; van Roessel et al., 2004). For instance, the E3 ligase highwire (hiw) restrains synaptic growth and promotes evoked synaptic transmission at the Drosophila NMJ (Wan et al., 2000). Similarly, the deubiquitinating protease fat facets represses synaptic growth and enhances synaptic transmission (DiAntonio et al., 2001). Although different molecular pathways have been implicated in hiw-dependent regulation of synaptic growth and function (Russo et al., 2019), it is generally difficult to disentangle effects on synaptic morphology from synaptic function. thin and its mammalian ortholog TRIM32 are required for maintaining the cytoarchitecture of muscle cells (Kudryashova et al., 2005; LaBeau-DiMenna et al., 2012; Cijsouw et al., 2018). Hence, the changes in synaptic transmission described in the present study may be a secondary consequence of impaired muscle structure. However, presynaptic thin expression in the thin mutant background restored presynaptic function under baseline conditions and during homeostatic plasticity (Figure 2). Conversely, while postsynaptic thin expression largely rescued the defects in muscle morphology in thin mutants, the defects in synaptic function persisted. These genetic data suggest that the neurotransmitter release impairment under baseline condition and during PHP in thin mutants is unlikely caused by muscular dystrophy.
We also noted a slight increase in NMJ size and/or Brp number after postsynaptic rescue in the thin mutant background (Figure 3) or following presynaptic thinRNAi expression (Figure 4—figure supplement 1). Moreover, Brp intensity was decreased in thinΔA mutants, after presynaptic rescue (Figure 3), or after postsynaptic thin overexpression in WT (Figure 3—figure supplement 1). The reasons for the increase in NMJ size or the decrease in Brp intensity after thin manipulations are unknown, but point at a potential dysregulation of thin-dependent pathways regulating NMJ size and Brp abundance. In principle, the changes in synaptic physiology observed in these genotypes may be a consequence of altered NMJ morphology. However, the observed changes in NMJ morphology were separable from changes in synaptic physiology (Figures 2 and 3, Figure 3—figure supplement 1), implying that presynaptic thin regulates neurotransmitter release under baseline conditions and during homeostatic plasticity largely independent of changes in synaptic morphology.
We revealed that presynaptic thin perturbation results in enhanced neurotransmitter release (Figures 2, 4 and 6), indicating that the E3 ligase Thin represses neurotransmitter release under baseline conditions. Notably, there are just a few molecules that have been implicated in repressing neurotransmitter release, such as the SNARE-interacting protein tomosyn (Hatsuzawa et al., 2003; Chen et al., 2011), or the RhoGAP crossveinless-c (Pilgram et al., 2011). How could the E3 ligase Thin oppose neurotransmitter release? We discovered that dysbindin is required for the increase in release induced by presynaptic thin perturbation (Figure 6). Moreover, Thin localizes in close proximity to Dysbindin in synaptic boutons (Figure 5), and we provide evidence that Thin likely degrades Dysbindin in vitro (Figure 5—figure supplement 2), similar to its mammalian ortholog TRIM32 (Locke et al., 2009). At the Drosophila NMJ, 26S-proteasomes are transported to presynaptic boutons (Kreko-Pierce and Eaton, 2017), where they degrade proteins on the minute time scale (Speese et al., 2003; Wentzel et al., 2018). Previous genetic data suggest a positive correlation between Dysbindin levels and neurotransmitter release (Dickman and Davis, 2009; Wentzel et al., 2018), and there is genetic evidence for rapid, UPS-dependent degradation of Dysbindin at the Drosophila NMJ (Wentzel et al., 2018). In combination with these previous observations, our data are consistent with the idea that Thin opposes release by acting on Dysbindin. Although the low abundance of endogenous Dysbindin at the Drosophila NMJ precludes direct analysis of Dysbindin levels (Dickman and Davis, 2009), we speculate that Thin decreases Dysbindin abundance by targeting it for degradation. Alternatively, Thin may modulate Dysbindin function through mono-ubiquitination. Genetic data suggest that Dysbindin interacts with the SNARE protein SNAP25 through Snapin (Dickman et al., 2012). Hence, Thin-dependent regulation of Dysbindin may modulate release via Dysbindin’s interaction with the SNARE complex.
Our study identified a crucial role for thin in PHP. How does the increase in neurotransmitter release in thin mutants under baseline conditions relate to the PHP defect? mEPSC amplitudes were decreased in thin mutants, after presynaptic and postsynaptic rescue (Figure 2), and largely unchanged after presynaptic thinRNAi expression (Figure 4). The decrease in mEPSC amplitude implies a postsynaptic role of thin in regulating quantal size, possibly by regulating GluR levels (Figure 2—figure supplement 1). Quantal content was increased in thin mutants, after postsynaptic rescue (Figure 2), and after presynaptic thinRNAi expression (Figure 4). Together, these data imply that the increase in quantal content under baseline conditions induced by presynaptic thin manipulations is separable from a decrease in miniature amplitude. By definition, PHP is induced by a relative decrease in miniature amplitude. Given that quantal content increased after presynaptic thin manipulations independent of changes in miniature amplitude, we consider it unlikely that the increased quantal content under baseline conditions represents a homeostatic response. Could the increase in release after presynaptic thin perturbation simply occlude PHP? The relative increase in release during PHP of WT synapses exceeds the increase in release under baseline conditions in thin mutants. Thus, although we cannot exclude that PHP is solely occluded by enhanced baseline release in thin mutants, we consider this scenario unlikely.
PHP is blocked by acute pharmacological, or prolonged genetic proteasome perturbation at the Drosophila NMJ (Wentzel et al., 2018). Moreover, PHP at this synapse requires dysbindin (Dickman and Davis, 2009), and genetic data suggest UPS-dependent control of a Dysbindin-sensitive vesicle pool during PHP (Wentzel et al., 2018). Based on our finding that thin is required for acute and sustained PHP expression (Figure 2, Figure 2—figure supplement 1), and the links between thin und dysbindin in the context of release modulation outlined above, we propose a model in which Thin-dependent ubiquitination of Dysbindin is decreased during PHP. Given the positive correlation between Dysbindin levels and release (Dickman et al., 2012; Wentzel et al., 2018), the resulting increase in Dysbindin abundance would potentiate release. Further work is needed to test how Thin is regulated during PHP. Thin is the first E3 ubiquitin ligase linked to homeostatic regulation of neurotransmitter release. Interestingly, a recent study revealed a postsynaptic role for Insomniac, a putative adaptor of the Cullin-3 ubiquitin ligase complex, in PHP at the Drosophila NMJ (Kikuma et al., 2019), suggesting a key function of the UPS in both synaptic compartments during PHP at this synapse.
TRIM32, the human ortholog of thin, is required for synaptic down-scaling in cultured hippocampal rat neurons (Srinivasan et al., 2020), as well as long-term potentiation in hippocampal mouse brain slices (Ntim et al., 2020), implying a broader role of this E3 ubiquitin ligase in synaptic plasticity. TRIM32 has been implicated in various neurological disorders, such as depression (Ruan et al., 2014), Alzheimer’s disease (Yokota et al., 2006), autism spectrum disorder (Lionel et al., 2014; Ruan et al., 2014), or attention deficit hyperactivity disorder (Lionel et al., 2011). It will be exciting to explore potential links between TRIM32-dependent control of synaptic homeostasis and these disorders in the future.
Materials and methods
Key resources table
| Reagent type (species) or resource | Designation | Source or reference | Identifiers | Additional information |
|---|---|---|---|---|
| Genetic reagent (Drosophila melanogaster) | thinΔA | LaBeau-DiMenna et al., 2012 | ||
| Genetic reagent (Drosophila melanogaster) | UAS-abba | LaBeau-DiMenna et al., 2012 | ||
| Genetic reagent (Drosophila melanogaster) | UAS-mCherry-thin | This study | Stock is available upon request | |
| Genetic reagent (Drosophila melanogaster) | GluRIIASP16 | Petersen et al., 1997 | ||
| Genetic reagent (Drosophila melanogaster) | dysbindin1 | Dickman and Davis, 2009 | ||
| Genetic reagent (Drosophila melanogaster) | UAS-thinRNAi | Perkins et al., 2015 | RRID:BDSC_42826 | |
| Genetic reagent (Drosophila melanogaster) | UAS-mCherryRNAi (P{VALIUM20-mCherry}attP2) | Bloomington Drosophila Stock Center | RRID:BDSC_35785 | |
| Genetic reagent (Drosophila melanogaster) | UAS-venus-dysbindin | Dickman and Davis, 2009 | ||
| Genetic reagent (Drosophila melanogaster) | elavc155-Gal4 | Bloomington Drosophila Stock Center | RRID:BDSC_458 | |
| Genetic reagent (Drosophila melanogaster) | 24B-Gal4 | Bloomington Drosophila Stock Center | RRID:BDSC_1767 | |
| Antibody | anti-Bruchpilot (nc82) (mouse monoclonal) | DSHB, University of Iowa, USA | RRID:AB_2314866 | (1:100) |
| Antibody | anti-GFP (rabbit polyclonal) | Thermo Fisher Scientific | Thermo Fisher Scientific Cat# G10362, RRID:AB_2536526 | IF: (1:500) WB: (1:1000) |
| Antibody | anti-GFP (mouse mono clonal) | Thermo Fisher Scientific | Thermo Fisher Scientific Cat# A-11120, RRID:AB_221568 | (1:500) |
| Antibody | anti-DsRed (mouse monoclonal) | Santa Cruz Biotechnology | Santa Cruz Biotechnology Cat# sc-390909, RRID:AB_2801575 | (1:500) |
| Antibody | anti-SYNORF1 (Synapsin, 3C11) (mouse monoclonal) | DSHB, University of Iowa, USA | RRID:AB_528479 | (1:250) |
| Antibody | anti-Thin (guinea pig polyclonal) | LaBeau-DiMenna et al., 2012 | Larva: (1:200) S2: (1:400) | |
| Antibody | anti-HRP Alexa-Fluor 647 (goat polyclonal) | Jackson ImmunoResearch Labs | Jackson ImmunoResearch Labs Cat# 123-605-021, RRID:AB_2338967 | (1:200) |
| Antibody | Anti-HA (mouse monoclonal) | Biolegend | BioLegend Cat# 901533, RRID:AB_2801249 | (1:1000) |
| Antibody | Anti-BetaTubulin (mouse monoclonal) | DSHB, University of Iowa, USA | DSHB Cat# E7, RRID:AB_528499 | (1:1000) |
| Antibody | Goat anti-Mouse IgG (H+L) Secondary Antibody, HRP (goat polyclonal) | Thermo Fisher Scientific | Thermo Fisher Scientific Cat# 31430, RRID:AB_228307 | (1:2000) |
| Antibody | Goat anti-Rabbit IgG (H+L) Secondary Antibody, HRP (goat polyclonal) | Thermo Fisher Scientific | Thermo Fisher Scientific Cat# 32460, RRID:AB_1185567 | (1:2000) |
| Antibody | Alexa-Fluor anti-mouse 488 (goat polyclonal) | Thermo Fisher Scientific | Thermo Fisher Scientific Cat# A32723, RRID:AB_2633275 | (1:500) |
| Antibody | Alexa Fluor anti-guinea pig 555 (goat polyclonal) | Thermo Fisher Scientific | Thermo Fisher Scientific Cat# A-21435 RRID:AB_2535856 | (1:400) |
| Antibody | Atto 594 conjugated anti-mouse (goat polyclonal) | Sigma-Aldrich | Sigma-Aldrich Cat# 76,085 | (1:100) |
| Antibody | Abberior STAR 635P (goat polyclonal) | Abberior | Abberior Cat# ST635P-1002-500 UG, RRID:AB_2893229 | (1:100) |
| Chemical compound, drug | Bouin’s fixative | Sigma-Aldrich | HT-10132 | |
| Chemical compound, drug | Ethanol | Merck | CAS# 64-17-5 | |
| Chemical compound, drug | ProLong Gold Antifade | Thermo Fisher Scientific | P36930 | |
| Chemical compound, drug | Philanthotoxin-433 | Santa Cruz Biotechnology | Cat# sc-255421 | |
| Chemical compound, drug | Schneider’s Drosophila medium | Gibco | Cat# 21720024 | |
| Chemical compound, drug | FuGENE HD | Promega | Cat# E2311 | |
| Chemical compound, drug | Paraformaldehyde | Merck | HT501128 | |
| Chemical compound, drug | NP-40 | Thermo Fisher Scientific | 85,125 | |
| Chemical compound, drug | Deoxycholate | Sigma-Aldrich | D6750 | |
| Chemical compound, drug | cOmplete | Sigma-Aldrich | 11697498001 | |
| Chemical compound, drug | ECL Prime Western Blotting Detection Reagent | GE Healthcare | Cat# 28980926 | |
| Cell line (D. melanogaster) | Drosophila Schneider 2 (S2) Cells | Thermo Fisher Scientific | Cat# R69007 | |
| Commercial assay, kit | Nitrocellulose membrane | Amersham Hibond GE Healthcare | Cat# 88,018 | |
| Recombinant DNA reagent | pMT-Gal4 | Addgene | RRID:Addgene_53366 | |
| Software, algorithm | Fiji / ImageJ | https://fiji.sc | RRID:SCR_002285 | Version 1.51n |
| Software, algorithm | Clampex | Axon CNS, Molecular Devices | RRID:SCR_011323 | |
| Software, algorithm | Leica Application Suite X | Leica Microsystems | RRID:SCR_013673 | |
| Software, algorithm | Huygens Software | https://svi.nl/HuygensSoftware | RRID:SCR_014237 | |
| Software, algorithm | Igor Pro | WaveMetrics | RRID:SCR_000325 | Version 6.37 |
| Software, algorithm | NeuroMatic | Rothman and Silver, 2018 | RRID:SCR_004186 | Version 3.0c |
| Software, algorithm | NumPy | https://www.numpy.org | RRID:SCR_008633 | |
| Software, algorithm | SciPy | https://www.scipy.org | RRID:SCR_008058 | |
| Software, algorithm | IPython | http://ipython.org | RRID:SCR_001658 | |
| Software, algorithm | Neo | http://neuralensemble.org/neo | RRID:SCR_000634 | |
| Software, algorithm | Shapely | (Gillies, 2007) https://github.com/shapely/shapely | ||
| Software, algorithm | RStudio | (R Studio Team, 2020) http://www.rstudio.com/ | RRID:SCR_000432 | Version 2021.09.0 |
| Software, algorithm | pwr-package | (Champely, 2020) https://github.com/heliosdrm/pwr | ||
| Software, algorithm | GNU Image Manipulation Program | https://www.gimp.org/ | RRID:SCR_003182 | Version 2.8.10 |
| Software, algorithm | Inkscape | http://www.inkscape.org | RRID:SCR_014479 | Version 0.92.2 |
| Software, algorithm | Affinity Designer | https://affinity.serif.com/en-us/designer/ | RRID:SCR_016952 | Version 1.10.4 |
Fly stocks and genetics
Request a detailed protocolDrosophila stocks were maintained at 21–25°C on normal food. The w1118 strain was used as the WT control. GluRIIASP16 mutants (Petersen et al., 1997) and dysbindin1 mutants (Dickman and Davis, 2009) were a kind gift from Graeme Davis’ lab. thinΔA mutants and UAS-abba transgenic flies, now referred to as UAS-thin (LaBeau-DiMenna et al., 2012), were a generous gift from Erika Geisbrecht. The UAS-thinRNAi stock (BDSC stock 42826, Perkins et al., 2015) and the UAS-mCherryRNAi stock (BDSC stock 35785) were obtained from the Bloomington Drosophila Stock Center (BDSC, Bloomington, IN, USA), and the UAS-venus-dysbindin line was provided by Dion Dickman’s lab. For pan-neuronal expression, the elavc155-Gal4 (on the X chromosome) driver line was used and analysis was restricted to male larvae. For expression in muscle cells, we used the 24B-Gal4 driver line. Both driver lines were obtained from the BDSC. Standard second and third chromosome balancer lines (BDSC) and genetic strategies were used for all crosses and for maintaining the mutant lines. For the generation of transgenic flies carrying UAS-mCherry-thin, constructs based on the pUAST-attB vector backbone were injected into the ZP-attP-86Fb fly line harboring a landing site on the third chromosome according to standard procedures (Bischof et al., 2014).
Cell culture and transfection
Request a detailed protocolSchneider S2 cells were obtained from Thermo Fisher Scientific (‘Gibco Drosophila S2 cells’; Cat# R69007). The supplier’s Master Seed Bank was characterized by isozyme and karyotype analysis, and was tested for contamination of bacteria, yeast, mycoplasma, and virus. We have not independently verified cell line identity or tested for mycoplasma contamination. However, contamination with other cell lines is unlikely, because the used cell line is (1) the only cell line used in the lab, (2) the only Drosophila cell line present at the institute, and (3) cells grow at 25° and in a different medium compared to human cell lines. Cells were used within 10 months after purchase. Schneider S2 cells were cultivated in standard Schneider’s Drosophila medium (Gibco) containing 10% fetal calf serum and 5% penicilin/streptomycin at 25°C. For immunohistochemistry and microscopy, cells were plated on cover slips in 12-well plates with 80% density and transfected with 1.5 μg (total) vector DNA using FuGENE HD Transfection Reagent according to the standard protocol. The following vectors were used: pMT-Gal4 (Addgene), pUAS-mCherry-thin, pUAS-HA-thin, pUAS-venus-dysbindin (Dion Dickman), and empty pUAS to adjust to equal DNA levels. Twenty-four hours after plating, CuSO4 (0.5 mM) was added to the culture for 24 hr to induce the expression of the pMT vector driving Gal4, which in turn drives transcription of UAS constructs.
Plasmid construction
Request a detailed protocolFor the pUAS-mCherry-thin vector, mCherry was cloned into pUAS-attB (Addgene) via EcoRI/NotI using the following primers:
(fw: 5′-GCGAATTCATGGTGAGCAAGGGCGAGGAG-3′, rev: 5′- GCGCGGCCGCCCTTGTACAGCTCGTCCATGCCG-3′).
Thin isoform A (NM_137546.3) was amplified from Drosophila cDNA by PCR using the following primers:
(fw: 5′-CGGCGGCCGCATGGAGCAATTCGAGCAGCTGT-3′, rev: 5′-CGTCTAGAATGAAGACTTGGACGCGGTGATTCTCTCG-3′) and then cloned into the pUAS-mCherry vector via NotI/XbaI.
pUAS-HA-thin was generated by In-Fusion mutagenesis (TaKaRa) from the pUAS-mCherry-thin plasmid with the following primers:
(fw: 5′-AGATTACGCTTATCCATATGATGTTCCAGATTATGCTGGCCGCATGGAGCAATTC-3′ and rev: 5′-GGATAAGCGTAATCTGGAACATCGTATGGGTACATAATTCCCAATTCCCTATTCAGAGT-3′).
Correct cloning was confirmed by sequencing on all final vectors.
Electrophysiology
Request a detailed protocolElectrophysiological recordings were made from third-instar larvae at the wandering stage. Larvae were dissected and sharp-electrode recordings were made from muscle 6 in abdominal segments 3 and 4 using an Axoclamp 900 A amplifier (Molecular Devices). The extracellular HL3 saline contained (in mM): 70 NaCl, 5 KCl, 10 MgCl2, 10 Na-HEPES (N-2-hydroxyethylpiperazine-N'-2-ethanesulfonic acid), 115 sucrose, 5 trehalose, 5 HEPES, 1.5 CaCl2. To induce PHP, larvae were incubated with 20 μM PhTX-433 (Santa Cruz Biotechnology) for 10 min at room temperature after partial dissection (see Frank et al., 2006). AP-evoked EPSCs were induced by stimulating hemi-segmental nerves with single APs (0.3-ms stimulus duration, 0.3 Hz), and recorded with a combination of a HS-9A × 10 and a HS-9A × 0.1 headstage (Molecular Devices) in two-electrode voltage clamp mode. mEPSPs and mEPSCs were recorded with one or two HS-9A × 0.1 headstage(s) (Molecular Devices), respectively. Muscle cells were clamped to a membrane potential of −65 mV for EPSC and −100 mV for mEPSC recordings to increase the signal-to-noise ratio.
A total of 50 EPSCs were averaged to obtain the mean EPSC amplitude for each NMJ. mEPSCs and EPSCs were recorded in different NMJs because different headstage combinations were used to improve the signal-to-noise-ratio for mEPSC recordings. Hence, quantal content was calculated by dividing the mean EPSC amplitude of each NMJ by the average of the average mEPSC amplitude of all NMJs of a given experimental group. RRP size was estimated by the method of cumulative EPSC amplitudes (Schneggenburger et al., 1999). NMJs were stimulated with 60 Hz trains (60 stimuli, 5 trains per cell), and the cumulative EPSC amplitude was obtained by back-extrapolating a linear fit to the last 15 cumulative EPSC amplitude values of the 60 Hz train to time zero. The cumulative EPSC amplitude of each NMJ was then divided by the average mEPSC amplitude of all NMJs of a given experimental group to obtain the RRP estimate.
Immunohistochemistry and microscopy
Drosophila NMJ
Request a detailed protocolThird-instar larval preparations were fixed for 3 min with Bouin’s fixative (100%, Sigma-Aldrich) for confocal microscopy, or ice-cold ethanol (100%, Merck) for 10 min for confocal/STED microscopy. Preparations were washed thoroughly with phosphate-buffered saline (PBS) containing 0.1% Triton X-100 (PBST). After washing, preparations were blocked with 3% normal goat serum in PBST. Incubation with the primary antibody was done at 4°C on a rotating platform overnight. The following antibodies and dilutions were used for NMJ stainings: (Primary) anti-Bruchpilot (nc82, mouse, DSHB, 1:100), anti-GFP (rabbit, Thermo Fisher Scientific, 1:500), anti-GFP (mouse, Thermo Fisher Scientific, 1:500), anti-DsRed (mouse, Santa Cruz Biotechnology, 1:500), anti-SYNORF1 (Synapsin, 3C11, mouse, DSHB, 1:250), anti-Thin (guinea pig, gift from Erika R. Geisbrecht, 1:200), and anti-HRP Alexa-Fluor 647 (goat, Jackson ImmunoResearch, 1:200). For confocal microscopy, Alexa-Fluor anti-mouse 488 (Thermo Fisher Scientific; 1:500) and Alexa Fluor anti-guinea pig 555 (Thermo Fisher Scientific; 1:400) were applied overnight at 4°C on a rotating platform. For gSTED microscopy, the following secondary antibodies (1:100) were applied for 2 hr at room temperature (RT) on a rotating platform: Atto 594 (anti-mouse, Sigma-Aldrich) and Abberior STAR 635P (anti-rabbit, Abberior). Experimental groups of a given experiment were processed in parallel in the same tube. Preparations were mounted onto slides with ProLong Gold (Thermo Fisher Scientific).
S2 cell culture
Request a detailed protocolS2 cells grown on coverslips were washed with PBST and fixed with 10% PFA (paraformaldehyde) for 10 min. After washing three times with PBST, preparations were blocked with 5% normal goat serum in PBST for 30 min. Incubation with primary antibodies was done at RT on a rotating platform for 2 hr. The following antibodies were used for S2 cell stainings: anti-thin (guinea pig, gift from Erika R. Geisbrecht, 1:400), anti-Dysbindin (mouse, gift from Dion Dickman, 1:400). After washing three times with PBST, cells were incubated with the secondary antibodies Alexa Fluor anti-guinea pig 555 and Alexa Fluor anti-mouse 488 (Thermo Fisher Scientific; both 1:400) at RT on a rotating platform for 2 hr. Cover slips were mounted onto slides with ProLong Gold (Thermo Fisher Scientific) after three PBST washes.
Confocal and gSTED microscopy
Request a detailed protocolImages were acquired with an inverse Leica TCS SP8 STED 3× microscope (Leica Microsystems, Germany) of the University of Zurich Center for Microscopy and Image Analysis. Excitation light (580 or 640 nm) of a flexible white light laser was focused onto the specimen using a 100× objective (HC PL APO 1.40 NA Oil STED WHITE; Leica Microsystems, Germany) with immersion oil conforming to ISO 8036 with a diffraction index of n = 1.5180 (Leica Microsystems, Germany). For gSTED imaging, the flexible white light laser was combined with a 775 nm STED depletion laser. Emitted light was detected with two HyD detectors in photon counting mode (Leica Microsystems, Germany). Pixel size was 20 × 20 nm and z-stacks were acquired with a step size of 120 nm. For STED imaging, we used time-gated single photon detection (empirical adjustment within a fluorescence lifetime interval from 0.7 to 6.0 ns). Line accumulation was set to 1 and 6 for confocal and STED imaging, respectively. Images were acquired with Leica Application Suite X software (Leica Application Suite X, version 2.0; Leica Microsystems, Germany). Experimental groups were imaged side-by-side with identical settings.
Images were processed and deconvolved with Huygens Professional (Huygens compute engine 17.04, Scientific Volume Imaging B.V., Netherlands). In brief, the ‘automatic background detection’ tool (radius = 0.7 µm), and the ‘auto stabilize’ feature were used to correct for background and lateral drift. Images were deconvolved using the Good’s roughness Maximum Likelihood algorithm with default parameter settings (maximum iterations: 10; signal-to-noise ratio: 7 for STED and 15 for confocal; quality threshold: 0.003).
Western blot
Request a detailed protocolTransfected cells in 12-well plates were harvested after 72 hr, washed with PBS and lysed by adding 50 µl of RIPA buffer (50 mM Tris, pH 8.0, 150 mM NaCl, 1% Nonidet P-40, 0.5% deoxycholate, 0.1% sodium dodecyl sulfate (SDS), 0.4 mM EDTA (ethylenediaminetetraacetic acid), 10% glycerol) containing protease inhibitors (cOmplete, Mini, EDTA-free Protease Inhibitor Cocktail, Sigma-Aldrich) for 30 min on ice. The lysates were sonified three times for 1 min and boiled for 5 min in SDS-sample buffer containing 5% β-mercaptoethanol. Samples were separated on acrylamide gels using SDS–polyacrylamide gel electrophoresis (PAGE), then transferred to nitrocellulose membranes (Amersham Hibond GE Healthcare). After blocking in 5% milk in PBST for 1 hr, membranes were incubated in the following primary antibodies: anti-GFP (rabbit, Thermo Fisher Scientific, 1:1000), anti-HA (mouse, Biolegend, 1:1000), and anti-Tubulin (E7, mouse, DSHB, 1:1000) in blocking solution overnight. Horseradish peroxidase-conjugated secondary antibodies (anti-mouse-HRP and anti-rabbit-HRP, 1:2000 in blocking solution) were applied to membranes for 2 hr. Detection was performed using ECL Reagent (GE Healthcare, Chicago, IL, USA). Western blots were revealed using enhanced chemiluminescence and imaged using a Fusion FX7 system (Vilber Lourmat). Densitometric analyses (mean pixel intensity of a ROI containing a band of interest) were done in Fiji/ImageJ.
Data analysis
Electrophysiology
Request a detailed protocolElectrophysiology data were acquired with Clampex (Axon CNS, Molecular Devices) and analyzed with custom-written routines in Igor Pro (Wavemetrics). For the genetic screen data, mEPSPs were detected with a template matching algorithm implemented in Neuromatic (Rothman & Silver, 2018) running in Igor Pro (Wavemetrics). The average mEPSP amplitude was calculated from all detected events in a recording after visual inspection for false positives. For the remaining data, mEPSC data were analyzed using routines written with scientific python libraries, including numpy, scipy, IPython and neo (Garcia et al., 2014), and mEPSCs were detected using an implementation of a template-matching algorithm (Clements and Bekkers, 1997).
NMJ morphology
Request a detailed protocolMicroscopy images were analyzed using custom-written routines in ImageJ/Fiji (version 1.51n, National Institutes of Health, USA). Brp quantification was performed as follows: First, individual Brp puncta were isolated by segmenting binary fluorescence intensity threshold masks (15% or 35% of the maximum intensity value) of background corrected (rolling ball, radius = 1 μm) and filtered (3 × 3 median) maximum intensity projection images. The number of Brp objects in the mask served as a proxy for AZ number and was normalized to the area of the HRP mask (binary mask, 15% or 35% of the maximum intensity value). Average Brp-intensity values were calculated for each Brp punctum from background-corrected, unfiltered maximum intensity projection images.
NND analysis
Request a detailed protocolFor the NND analysis (Figure 5), individual synaptic boutons were segmented manually within a deconvolved gSTED stack and a single plane in the middle of the bouton was extracted for further analysis. Next, Fiji’s ‘Find Maxima’ algorithm was used to obtain the x,y coordinate of the brightest pixel within each Dysbindinvenus and ThinmCherry punctum. For the maximum of each Dysbindin punctum, the distances to the maxima of all Thin puncta within the same bouton were measured and the NNDs were calculated. For each bouton, the analysis was repeated after assigning random x,y coordinates to each Dysbindin and Thin punctum within the bouton boundaries using the Python package Shapely (Gillies and others, 2007; https://github.com/shapely/shapely). NND values were averaged for each bouton.
Correlation analysis S2 cells
Request a detailed protocolPearson’s correlation coefficients (r) were calculated for each pixel in single confocal planes of Drosophila S2 cells coexpressing Dysbindinvenus and ThinmCherry using Costes’ approach (Costes et al., 2004) implemented in the JACoP toolbox of ImageJ/Fiji (Bolte and Cordelières, 2006; Figure 5—figure supplement 2B). The algorithm also creates simulated images by randomly sampling point spread function-sized chunks of the original image, and calculating r for each pixel of the simulated data.
Statistics
Statistical analyses were done using RStudio Team (2021). RStudio: Integrated Development Environment for R. RStudio, PBC, Boston, MA, http://www.rstudio.com/. For more than two factors, we used two-way analysis of variance (ANOVA) followed by Tukey’s post hoc test to correct for multiple comparisons between genotypes and conditions. For one factor with more than two groups, one-way ANOVA with Tukey’s multiple comparisons was performed. Two-sided Student’s t-tests or nonparametric Mann–Whitney U-tests were used for comparison between two groups after a Shapiro–Wilk test and a Levene’s test. Statistical significance (p) was set to 0.05 (*), 0.01 (**), and 0.001 (***). Power analysis was performed using the pwr-package of Rstudio. Minimum desired effect size based on Cohen’s d value was used to estimate the minimum sample size for a power ≥0.8 and a significance level of 0.05 for two-sided Student’s t-tests or Mann–Whitney U-tests. Data are given as mean ± standard error of the mean (SEM).
Figures were assembled using GIMP (The GIMP team, 2.8.10, https://www.gimp.org/), Inkscape (Inkscape project, 0.92.2. http://www.inkscape.org), and Affinity Designer (1.10.4, Serif (Europe) Ltd, West Bridgford, Nottinghamshire, United Kingdom).
Data availability
All data generated or analyzed during this study are included in the manuscript and supporting files. Source data files have been provided for Figures 1-6.
References
-
Generation of a transgenic ORFeome library in DrosophilaNature Protocols 9:1607–1620.https://doi.org/10.1038/nprot.2014.105
-
A guided tour into subcellular colocalization analysis in light microscopyJournal of Microscopy 224:213–232.https://doi.org/10.1111/j.1365-2818.2006.01706.x
-
Detection of spontaneous synaptic events with an optimally scaled templateBiophysical Journal 73:220–229.https://doi.org/10.1016/S0006-3495(97)78062-7
-
Homeostatic plasticity-a presynaptic perspectiveCurrent Opinion in Neurobiology 54:155–162.https://doi.org/10.1016/j.conb.2018.10.003
-
Snapin is critical for presynaptic homeostatic plasticityThe Journal of Neuroscience 32:8716–8724.https://doi.org/10.1523/JNEUROSCI.5465-11.2012
-
Abba is an essential TRIM/RBCC protein to maintain the integrity of sarcomeric cytoarchitectureJournal of Cell Science 126:3314–3323.https://doi.org/10.1242/jcs.122366
-
Neo: an object model for handling electrophysiology data in multiple formatsFrontiers in Neuroinformatics 8:10.https://doi.org/10.3389/fninf.2014.00010
-
The R-SNARE motif of tomosyn forms SNARE core complexes with syntaxin 1 and SNAP-25 and down-regulates exocytosisThe Journal of Biological Chemistry 278:31159–31166.https://doi.org/10.1074/jbc.M305500200
-
The ubiquitin-proteasome pathway and synaptic plasticityLearning & Memory 17:314–327.https://doi.org/10.1101/lm.1504010
-
The Drosophila LC8 homolog cut up specifies the axonal transport of proteasomesJournal of Cell Science 130:3388–3398.https://doi.org/10.1242/jcs.207027
-
FlyBase: updates to the Drosophila melanogaster knowledge baseNucleic Acids Research 49:D899–D907.https://doi.org/10.1093/nar/gkaa1026
-
Rare copy number variation discovery and cross-disorder comparisons identify risk genes for ADHDScience Translational Medicine 3:95ra75.https://doi.org/10.1126/scitranslmed.3002464
-
TRIM32 is an E3 ubiquitin ligase for dysbindinHuman Molecular Genetics 18:2344–2358.https://doi.org/10.1093/hmg/ddp167
-
Variability, compensation and homeostasis in neuron and network functionNature Reviews. Neuroscience 7:563–574.https://doi.org/10.1038/nrn1949
-
RIM controls homeostatic plasticity through modulation of the readily-releasable vesicle poolThe Journal of Neuroscience 32:16574–16585.https://doi.org/10.1523/JNEUROSCI.0981-12.2012
-
TRIM family proteins and their emerging roles in innate immunityNature Reviews. Immunology 8:849–860.https://doi.org/10.1038/nri2413
-
The ubiquitin ligase Ariadne-1 regulates neurotransmitter release via ubiquitination of NSFJournal of Biological Chemistry 296:100408.https://doi.org/10.1016/j.jbc.2021.100408
-
Deletion of TRIM32 protects mice from anxiety- and depression-like behaviors under mild stressThe European Journal of Neuroscience 40:2680–2690.https://doi.org/10.1111/ejn.12618
-
Subclassification of the RBCC/TRIM superfamily reveals a novel motif necessary for microtubule bindingThe Journal of Biological Chemistry 281:8970–8980.https://doi.org/10.1074/jbc.M512755200
-
STRING: known and predicted protein-protein associations, integrated and transferred across organismsNucleic Acids Research 33:D433–D437.https://doi.org/10.1093/nar/gki005
-
Activity-dependent regulation of the binomial parameters p and n at the mouse neuromuscular junction in vivoJournal of Neurophysiology 104:2352–2358.https://doi.org/10.1152/jn.00460.2010
-
Rapid active zone remodeling during synaptic plasticityThe Journal of Neuroscience 31:6041–6052.https://doi.org/10.1523/JNEUROSCI.6698-10.2011
-
Emerging links between homeostatic synaptic plasticity and neurological diseaseFrontiers in Cellular Neuroscience 7:223.https://doi.org/10.3389/fncel.2013.00223
-
Brain site-specific gene expression analysis in Alzheimer’s disease patientsEuropean Journal of Clinical Investigation 36:820–830.https://doi.org/10.1111/j.1365-2362.2006.01722.x
-
Ubiquitin ligases: structure, function, and regulationAnnual Review of Biochemistry 86:129–157.https://doi.org/10.1146/annurev-biochem-060815-014922
Article and author information
Author details
Martin Baccino-Calace

Funding
Schweizerischer Nationalfonds zur Förderung der Wissenschaftlichen Forschung (PP00P3-15)
- Martin Müller
European Research Council (SynDegrade-679881)
- Martin Müller
The funders had no role in study design, data collection, and interpretation, or the decision to submit the work for publication.
Acknowledgements
We are grateful to the members of the Müller lab for helpful discussions and critical comments on the manuscript. We thank Dr. Damian Szklarczyk for help with STRING-based protein–protein interaction analysis used for prioritization of E3 ligases, and Dr. Marian Hruska-Plochan for help with the western blot analysis. Stocks obtained from the Bloomington Drosophila Stock Center (NIH P40OD018537) were used in this study.
Version history
- Preprint posted: June 16, 2021 (view preprint)
- Received: June 19, 2021
- Accepted: July 6, 2022
- Accepted Manuscript published: July 7, 2022 (version 1)
- Version of Record published: July 20, 2022 (version 2)
Copyright
© 2022, Baccino-Calace et al.
This article is distributed under the terms of the Creative Commons Attribution License, which permits unrestricted use and redistribution provided that the original author and source are credited.
Metrics
-
- 794
- views
-
- 256
- downloads
-
- 8
- citations
Views, downloads and citations are aggregated across all versions of this paper published by eLife.
Download links
A two-part list of links to download the article, or parts of the article, in various formats.
Downloads (link to download the article as PDF)
Open citations (links to open the citations from this article in various online reference manager services)
Cite this article (links to download the citations from this article in formats compatible with various reference manager tools)
The E3 ligase Thin controls homeostatic plasticity through neurotransmitter release repression
eLife 11:e71437.
https://doi.org/10.7554/eLife.71437
Further reading
-
- Cancer Biology
- Genetics and Genomics
Enhancers are critical for regulating tissue-specific gene expression, and genetic variants within enhancer regions have been suggested to contribute to various cancer-related processes, including therapeutic resistance. However, the precise mechanisms remain elusive. Using a well-defined drug-gene pair, we identified an enhancer region for dihydropyrimidine dehydrogenase (DPD, DPYD gene) expression that is relevant to the metabolism of the anti-cancer drug 5-fluorouracil (5-FU). Using reporter systems, CRISPR genome-edited cell models, and human liver specimens, we demonstrated in vitro and vivo that genotype status for the common germline variant (rs4294451; 27% global minor allele frequency) located within this novel enhancer controls DPYD transcription and alters resistance to 5-FU. The variant genotype increases recruitment of the transcription factor CEBPB to the enhancer and alters the level of direct interactions between the enhancer and DPYD promoter. Our data provide insight into the regulatory mechanisms controlling sensitivity and resistance to 5-FU.
-
- Computational and Systems Biology
- Genetics and Genomics
Gene expression is known to be affected by interactions between local genetic variation and DNA accessibility, with the latter organized into three-dimensional chromatin structures. Analyses of these interactions have previously been limited, obscuring their regulatory context, and the extent to which they occur throughout the genome. Here, we undertake a genome-scale analysis of these interactions in a genetically diverse population to systematically identify global genetic–epigenetic interaction, and reveal constraints imposed by chromatin structure. We establish the extent and structure of genotype-by-epigenotype interaction using embryonic stem cells derived from Diversity Outbred mice. This mouse population segregates millions of variants from eight inbred founders, enabling precision genetic mapping with extensive genotypic and phenotypic diversity. With 176 samples profiled for genotype, gene expression, and open chromatin, we used regression modeling to infer genetic–epigenetic interactions on a genome-wide scale. Our results demonstrate that statistical interactions between genetic variants and chromatin accessibility are common throughout the genome. We found that these interactions occur within the local area of the affected gene, and that this locality corresponds to topologically associated domains (TADs). The likelihood of interaction was most strongly defined by the three-dimensional (3D) domain structure rather than linear DNA sequence. We show that stable 3D genome structure is an effective tool to guide searches for regulatory elements and, conversely, that regulatory elements in genetically diverse populations provide a means to infer 3D genome structure. We confirmed this finding with CTCF ChIP-seq that revealed strain-specific binding in the inbred founder mice. In stem cells, open chromatin participating in the most significant regression models demonstrated an enrichment for developmental genes and the TAD-forming CTCF-binding complex, providing an opportunity for statistical inference of shifting TAD boundaries operating during early development. These findings provide evidence that genetic and epigenetic factors operate within the context of 3D chromatin structure.


