FMRP regulates mRNAs encoding distinct functions in the cell body and dendrites of CA1 pyramidal neurons
- Laboratory of Molecular Neuro-Oncology, Rockefeller University, United States
- Bio-Imaging Resource Center, The Rockefeller University, United States
- Bioinformatics Resource Center, The Rockefeller University, United States
- Howard Hughes Medical Institute, Rockefeller University, United States
Figures
Figure 1 with 2 supplements
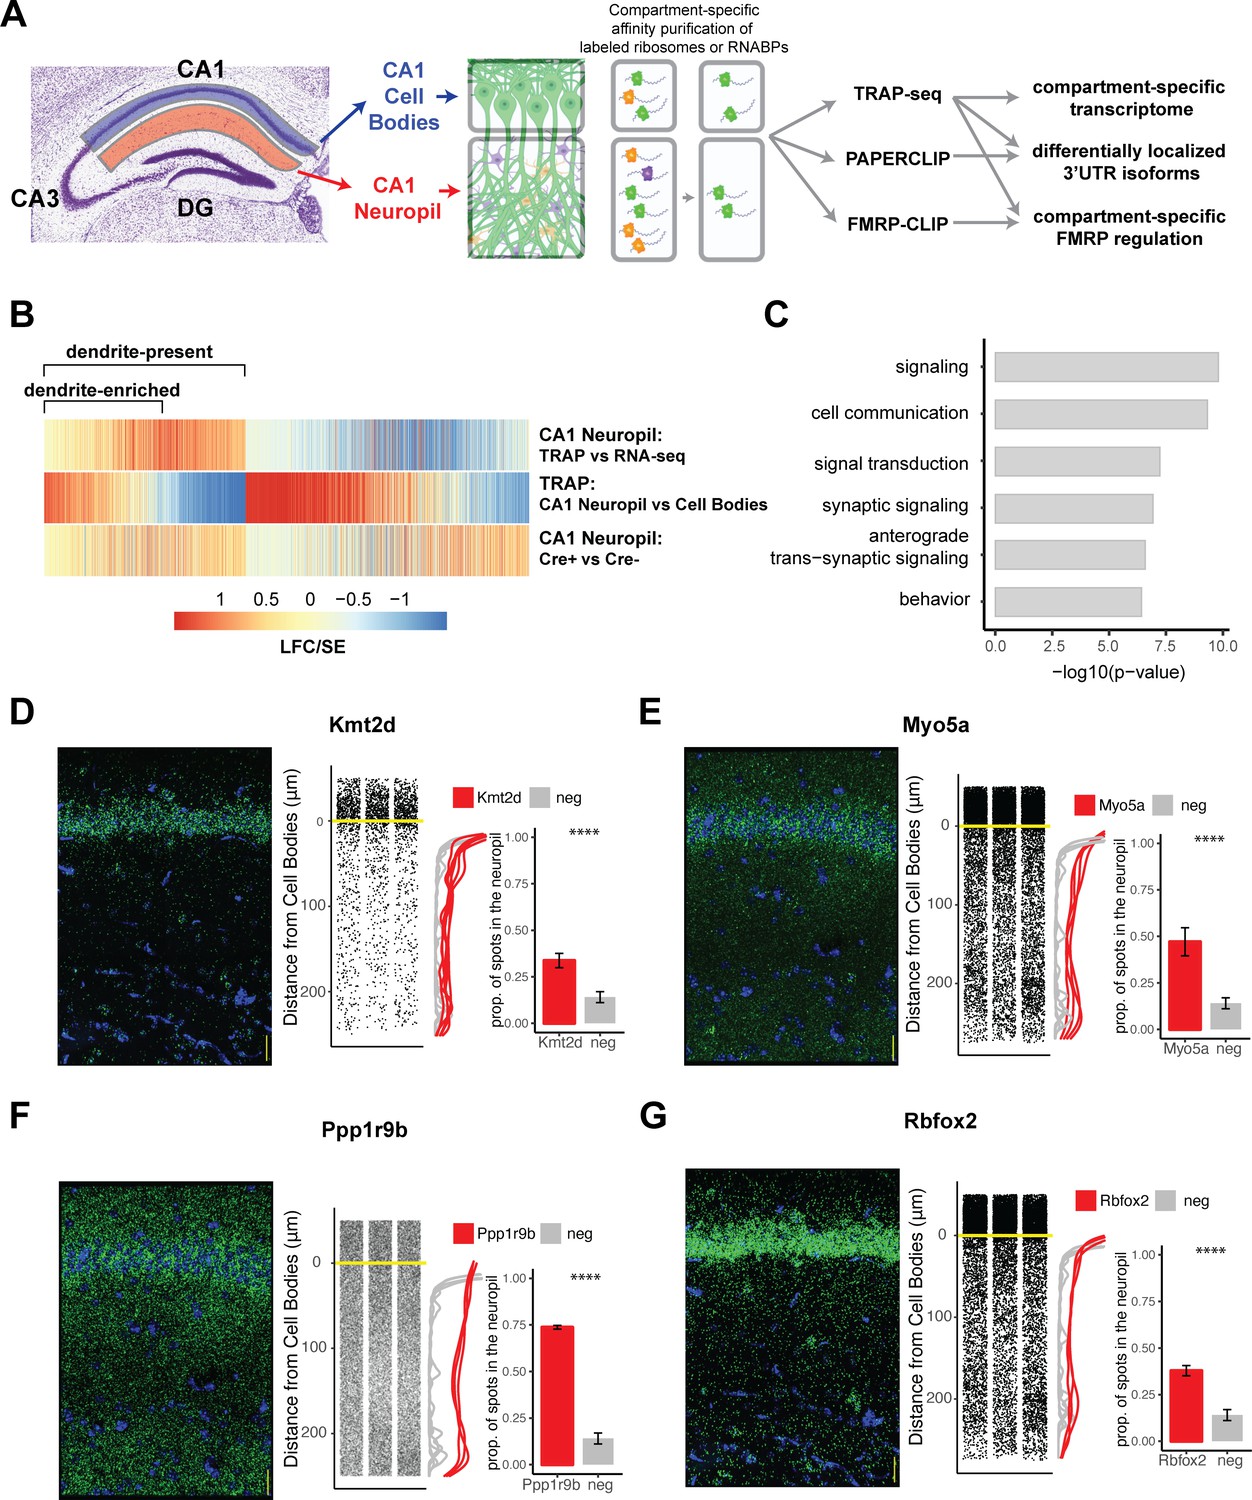
Combining cell-type-specific protein tagging and manual microdissection allows for precise definition of the CA1 dendritic transcriptome.
(A) Experimental design. Hippocampal slices from Camk2a-Cre-expressing conditionally tagged mouse lines were subject to microdissection in order to separate the CA1 cell bodies and CA1 neuropil layers. These layers contained material from pyramidal neurons (in which proteins of interest contain an affinity tag, green) and contaminating cell types (other colors). Microdissected compartments were subject to affinity purification in order to obtain pyramidal neuron-specific ribosomes or affinity-tagged RNA-binding proteins and bound mRNAs. In order to obtain the dendritic ribosome-bound transcriptome, TRAP-seq was performed from tagged ribosomes in the CA1 neuropil compartment. Compartment-specific cTag-PAPERCLIP was performed in order to determine mRNAs with 3′UTR isoforms that undergo differential localization, and compartment-specific FMRP regulation was determined by cTag FMRP-CLIP of the microdissected compartments. (B) Identification of dendritic mRNAs. Differential gene expression analysis was performed on bulk RNA-seq and TRAP-seq from microdissected CA1 compartments. All CA1-expressed mRNAs as shown. Colors indicate the log2 fold change (LFC)/SE (standard error, stat) from DESeq analysis. mRNAs significantly enriched in CA1 neuropil TRAP over bulk RNA-seq of the CA1 neuropil were defined as ‘dendrite-present.’ mRNAs that were also significantly enriched in CA1 neuropil TRAP when compared to cell bodies TRAP were considered to be ‘dendrite-enriched.’ In addition, only mRNAs that were enriched in CA1 neuropil TRAP in Camk-Cre-expressing RiboTag mice when compared to RiboTag mice not expressing Cre were considered. (C) Localized mRNAs are highly enriched for genes involved in synaptic signaling and synapse organization. GO analysis was performed comparing dendrite-enriched mRNAs to all mRNAs expressed in CA1 neurons. (D–G) Validation of localized mRNAs. Fluorescence in situ hybridization (FISH) was performed using the RNAscope method using probes designed against the entire mRNA of the indicated gene. Left: representative FISH image of RNAscope on the CA1 region of coronal brain sections. mRNA spots are shown in green, and DAPI staining is shown in blue. Scale bars represent 30 µm. Middle: the distance between the mRNA punctae and the cell bodies was quantitated for three representative images. Density is plotted for all collected images (red) and compared to a negative control mRNA (Snca) that was identified as sequestered in the cell bodies (gray). Right: mRNAs more than 10 µm from the cell bodies were considered to be in the neuropil. The proportion of indicated mRNAs that were found in the neuropil is plotted. A cell body-sequestered mRNA (Snca) is used as a negative control (neg). Asterisks indicate results of the Wilcoxon rank-sum test (****p<0.00001).
Figure 1—figure supplement 1
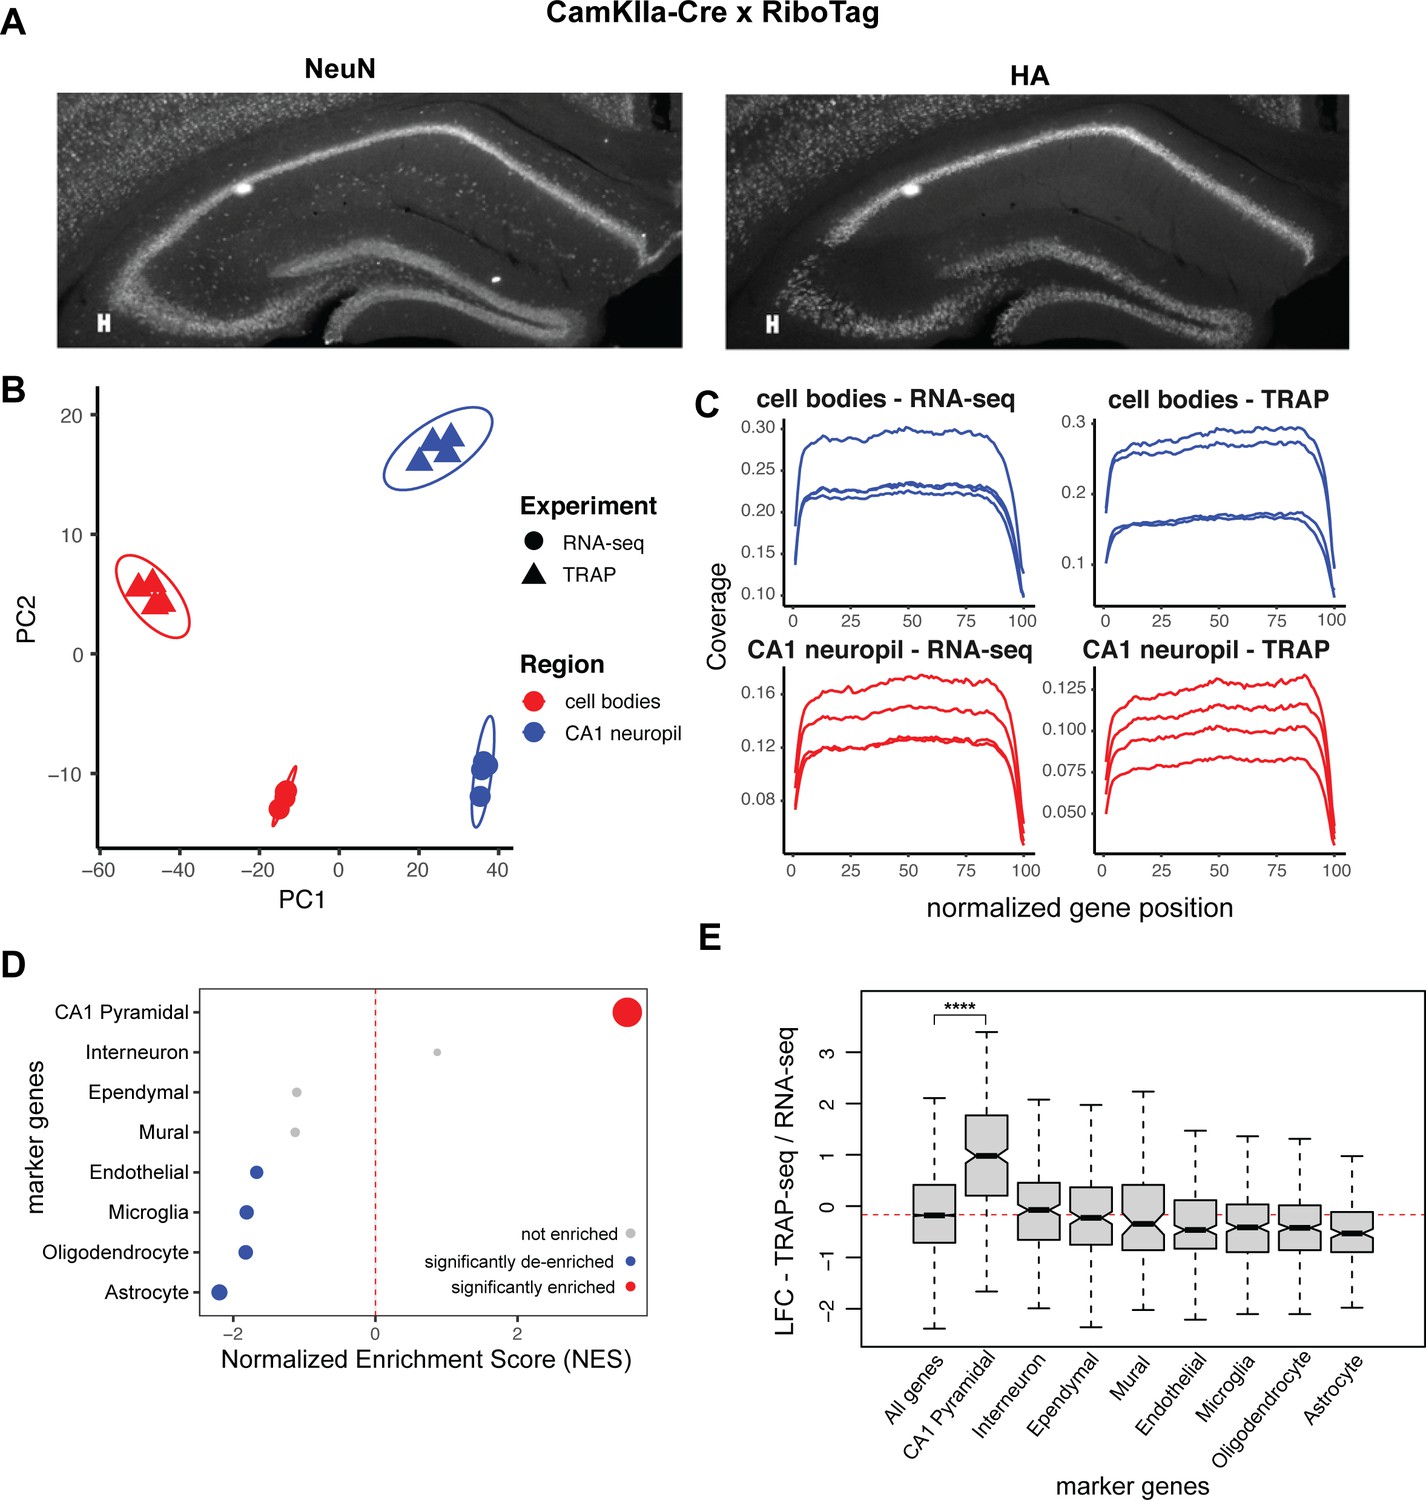
CA1 compartment-specific TRAP-seq enriches for dendritic mRNAs derived specifically from Camk2a-expressing pyramidal neurons.
(A) Crossing the RiboTag mice with Camk2aIIα-Cre mice allows for expression of HA-tagged Rpl22 ribosomal subunits only in the pyramidal neurons of the hippocampus. Immunostaining was performed on coronal brain sections from 8- to 10-week Camk2aIIα-RiboTag mice. Sections were stained with a pan-neuronal marker (NeuN, left panel) and for the HA-tagged ribosomal subunit RPL22 (right panel). (B) Principal component analysis of microdissected TRAP- and RNA-seq samples. Point shape is decided by sample type (TRAP or bulk RNA-seq), and color is determined by compartment (cell body layer [CB] or CA1 neuropil). (C) Gene coverage in TRAP- and bulk RNA-seq samples. Coverage of sequenced samples, as determined by Picard. (D) Contaminating cell types are not enriched in CA1 neuropil TRAP. Genes were ranked by log2 fold change/standard error (LFC/SE) in TRAP samples (CA1 neuropil TRAP/bulk RNA-seq), and marker gene sets were used for gene set enrichment analysis (GSEA). Significantly enriched (false discovery rate [FDR] < 0.05) markers are shown in red, significantly de-enriched markers are shown in blue, and not enriched cell types are shown in gray. Point size indicates -log10(FDR). (E) CA1 pyramidal markers are enriched in CA1 neuropil TRAP samples. Boxplots compare LFC (CA1 neuropil TRAP/bulk RNA-seq) of various marker genes in CA1 neuropil TRAP. Asterisks indicate significance in Wilcoxon rank-sum test (****p<0.00001).
Figure 1—figure supplement 2

Characteristics of CA1 dendritic mRNAs.
(A) Some dendrite-present mRNAs were found in previous rat CA1 bulk RNA-seq experiments. Overlap of mRNAs found to be dendrite-present in CA1 neurons (as defined by enrichment in CA1 neuropil TRAP vs. bulk RNA-seq, Figure 1B) with mRNAs identified previously (Cajigas et al., 2012). (B) Previously identified localized mRNAs are enriched in CA1 dendrites. Cumulative distribution function (CDF) plots show the level of enrichment in CA1 neuropil TRAP vs. neuropil bulk RNA-seq. Plotted is the log2 fold change/standard error (CA1 neuropil TRAP/bulk RNA-seq, determined by DESeq2) for all genes (black) and the localized genes identified in rats by Cajigas et al., 2012 (cyan). Significance is determined by Kolmogorov–Smirnov test. (C) Comparison of mRNA length of all CA1-expressed mRNAs and the dendrite-enriched mRNAs. The mRNA with the highest expression for each gene in CA1 neurons (determined by TRAP; Sawicka et al., 2019) was used for this analysis. Length of dendrite-enriched and all CA1 mRNAs was compared for the full-length transcript, 5′UTRs, coding sequence (CDS), and 3′UTRs. Significance was determined by Wilcoxon rank-sum test (***p<0.0001, ****p<0.00001).
Figure 2 with 2 supplements
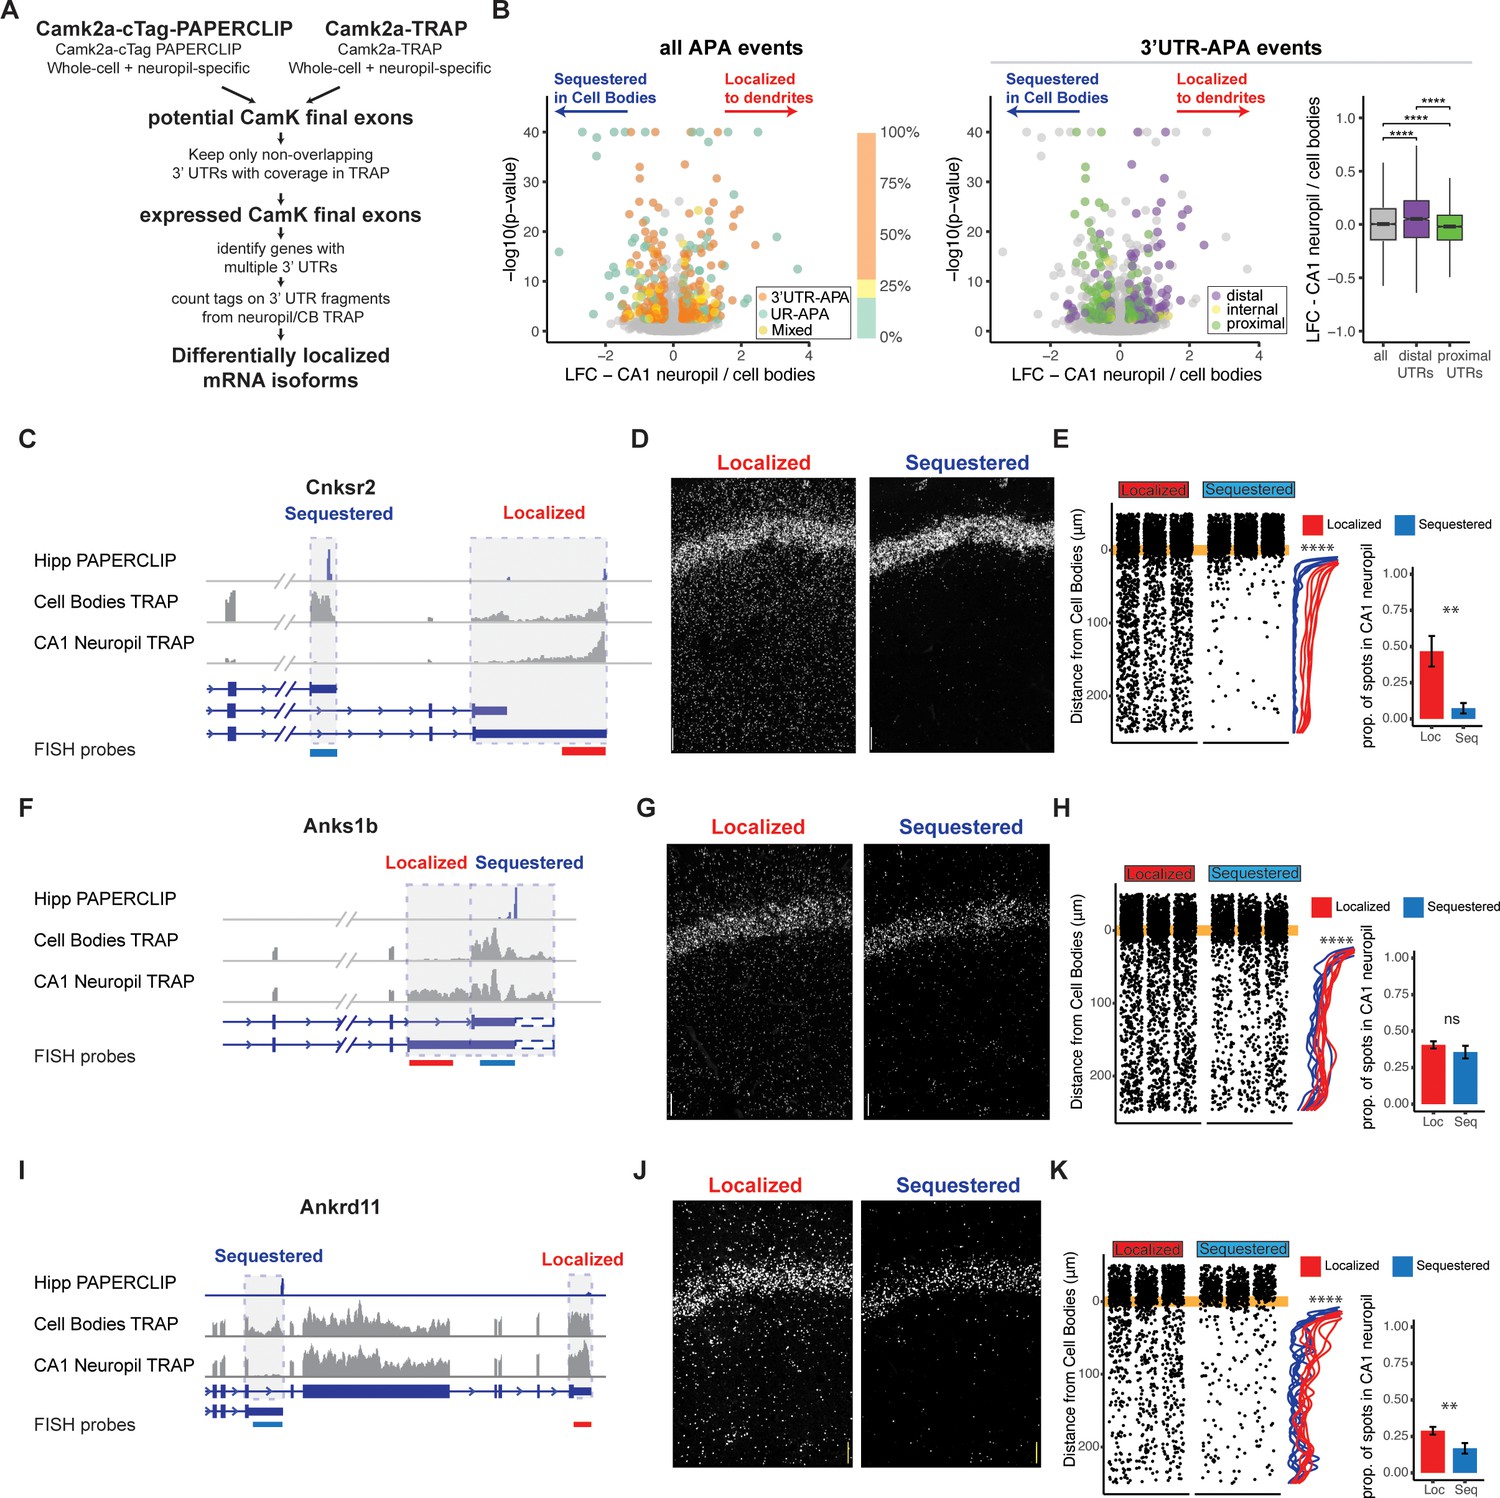
Combining cTag-PAPERCLIP and TRAP in order to identify genes with differentially localized 3′UTR isoforms.
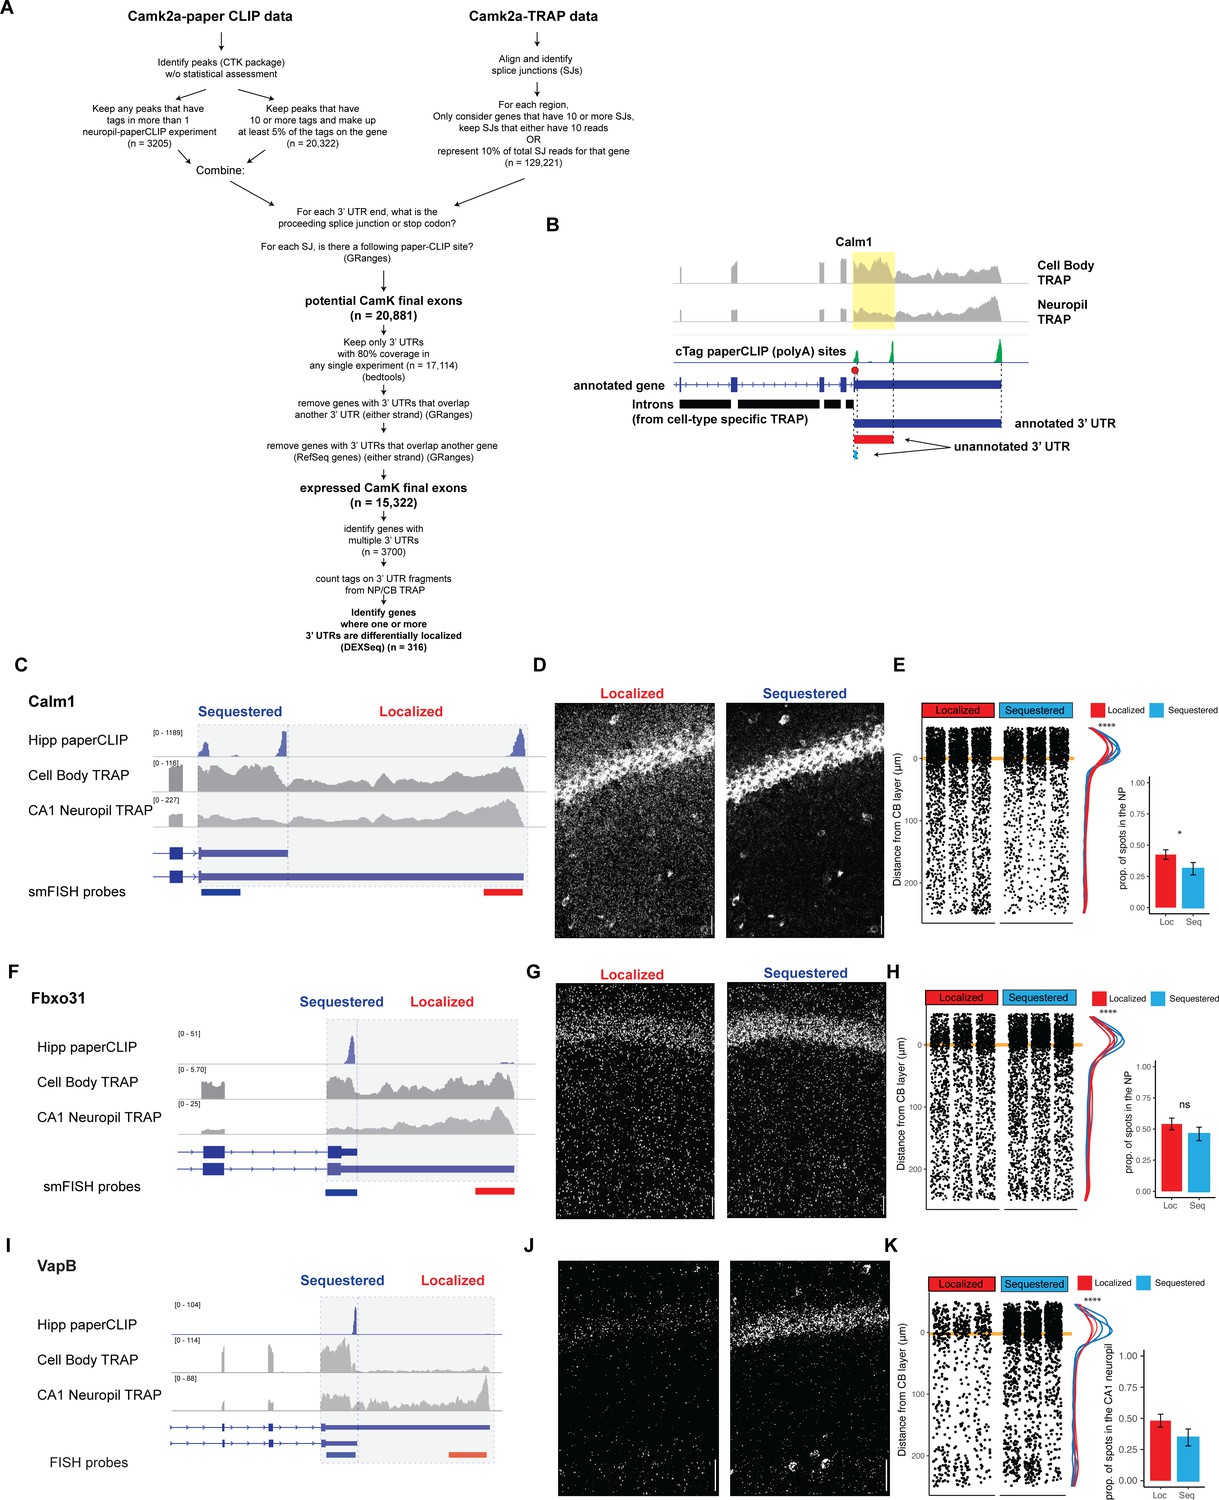
(A) Scheme for identification of expressed 3′UTR isoforms in CA1 neurons followed by analysis of differential localization. Boundaries of expressed 3′UTR isoforms in CA1 neurons were determined by combining polyA sites, determined by cTag-PAPERCLIP from both the whole hippocampus and microdissected CA1 compartments, with splice junctions from cell-type-specific TRAP experiments. These potential final exons were filtered for nonoverlapping 3′UTRs with complete coverage in TRAP. Compartment-specific expression of the resulting 3′UTRs was quantitated, and DEXSeq was used to determine 3′UTRs that were differentially localized in the dendrites of CA1 neurons. (B) Differential localization of 3′UTR isoforms. Left: volcano plot shows log2 fold change (LFC) (calculated by DEXSeq) vs. false discovery rate (FDR) for genes that produce significant differentially localized 3′UTR isoforms, colored by types of alternative polyadenylation (APA) events. 3′UTR-APA (orange) are 3′UTRs with multiple polyA sites; APA changes do not affect the coding sequence (CDS) of the resulting mRNAs. Genes that undergo upstream region APA, or UR-APA (green), utilize polyA sites within introns upstream of the 3′UTR, and result in mRNAs with truncated CDS. Genes that undergo both types of APA are shown in yellow. Proportion of significant events that fall into each of these groups is summarized in bar graph, with the same color scheme as the volcano plot. Middle: the 3′UTR-APA events shown in left are here colored according to their position in the gene, either proximal to the stop codon (green), internal (yellow), or distal (purple). Right: for all 3′UTR-APA events detected, distal 3′UTRs (purple) are significantly enriched in the CA1 neuropil (determined by the LFC of CA1 neuropil/cell bodies) when compared to proximal (green) 3′UTRs. p-Values for paired Wilcoxon rank-sum tests are indicated (****p<0.00001). (C–K) Validation of differential localization of 3′UTRs by fluorescence in situ hybridization (FISH). (C) Differential localization of Cnksr2 3′UTR isoforms. Distribution of cell bodies- and CA1 neuropil TRAP-seq reads for the 3′ end of the Cnksr2 mRNA. Camk2a-cTag-PAPERCLIP tags from the hippocampus are shown in blue. Coverage is normalized for read depth and scaled in order to best illustrate isoform expression. Predicted mRNA isoforms are indicated below, and the positions of the FISH probes are indicated (the sequestered probe is shown in blue, and the localized probe in red). (D) smFISH on the CA1 region using probes against localized (left) and sequestered (right) 3′UTR sequences. (E, left) Spots were counted in either the CB or CA1 neuropil region and distance traveled from the cell body was determined for each spot. Plots show location of spots in all quantitated replicates. Line plots show the density of the detected spots that were found in the CA1 neuropil in either the cell body-sequestered (blue) or neuropil-localized 3′UTR isoform (red) for the 300 nts proximal to the cell bodies. Asterisks indicate significance in Kolomogorov–Smirnov tests (****p<0.00001) between distribution of sequestered and localized 3′UTR isoforms. Right: overall quantitation of spots in the cell bodies (<10 μm from the cell body layer) and CA1 neuropil (>10 μm from the cell bodies) is shown in barplots. Results of Wilcoxon rank-sum tests are shown (**p<0.001). (F–H) Differential localization of Anks1b 3′UTR isoforms. See description for (C–E). Dashed box indicates a potential underutilized 3′UTR extension that is observed by TRAP, but represents only a minor fraction of PAPERCLIP reads. (I–K) Differential localization of Ankrd11 3′UTR isoforms.
Figure 2—figure supplement 1
CA1 compartment-specific cTag-PAPERCLIP.
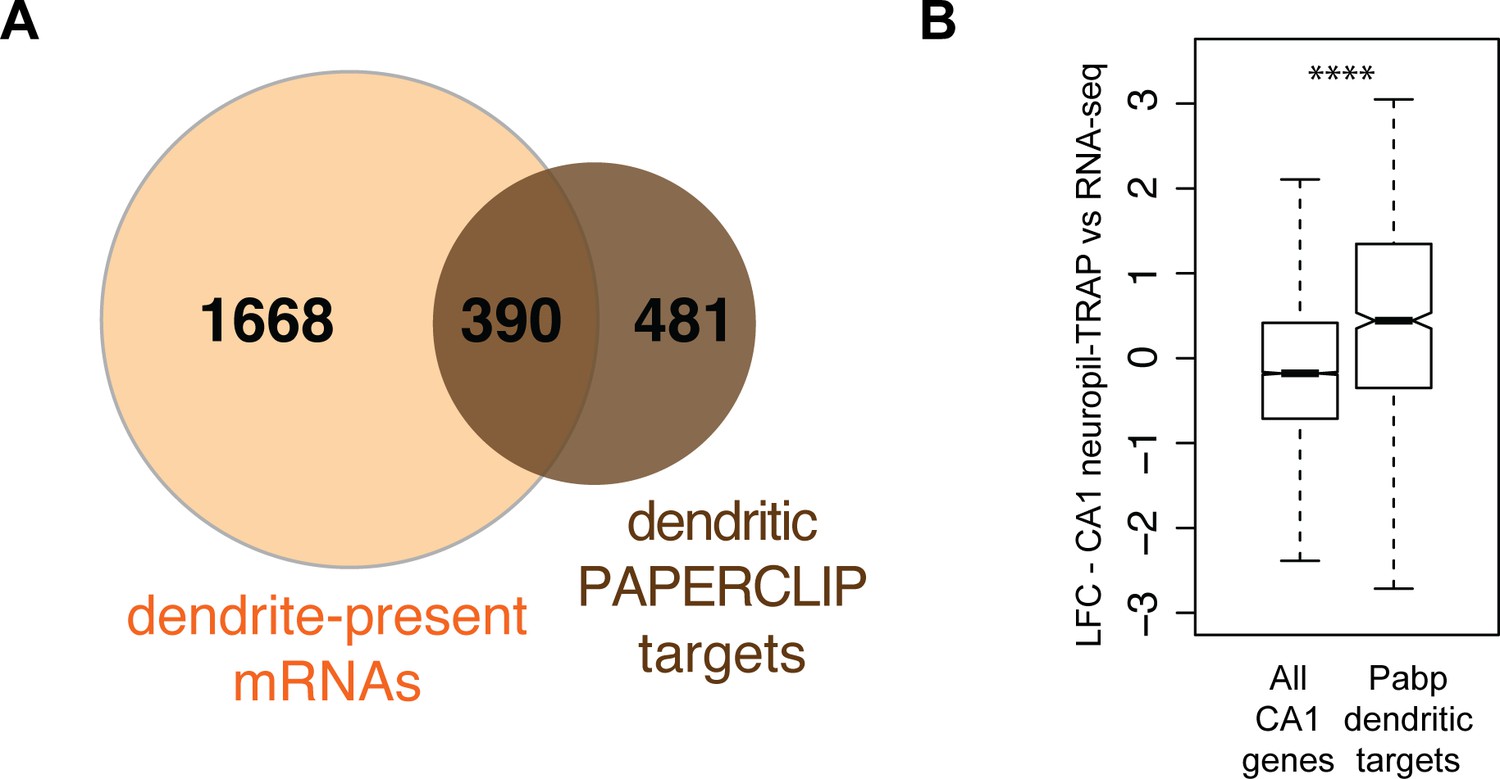
(A) Dendritic PAPERCLIP identifies a subset of dendrite-present mRNAs. Overlap of mRNAs identified by cTag-PAPERCLIP in microdissected CA1 material (brown) and dendrite-present mRNAs (orange). (B) mRNAs identified by microdissected cTag-PAPERCLIP are enriched in CA1 neuropil TRAP. Boxplots compare the LFC/SE (CA1 neuropil TRAP vs. bulk RNA-seq) in all CA1-expressed mRNAs and those identified by microdissected cTag-PAPERCLIP. Significance was determined by Wilcoxon rank-sum test (****p<0.00001).
Figure 2—figure supplement 2
Differentially localized 3′UTR-APA events.
(A) Detailed schematic of 3′UTR identification pipeline. When applicable, the software used for analysis is indicated and n indicates the number of 3′UTRs or polyA sites found at each step. (B) Identification of expressed 3′UTR boundaries by combining polyA sites from cTag-PAPERCLIP and splice junctions for cell-type-specific TRAP data, illustrated for Calm1 3′UTRs. Coverage of 3′UTR regions in CA1 cell bodies and neuropil TRAP is shown in gray. polyA sites identified by cTag-PAPERCLIP are shown in green. Introns, as determined from TRAP, are indicated by black bars. For each PAPERCLIP site (representing the 3′ end of a potential final exon), the potential 5′ boundary was determined by the nearest upstream intron (defined by TRAP). (C–E) Validation of differential localization of Calm1 3′UTR isoforms. For 3′UTR-APA events (i.e., expressing a distal and proximal 3′UTR isoform), fluorescence in situ hybridization (FISH) probes detected common (found in both proximal and distal UTRs) and specific (found only in localized isoform) sequences. Therefore, localization of distal 3′UTR-containing mRNAs was readily detectable as decreased levels in the cell bodies of CA1 neurons. Analysis of FISH data was performed as described in Figure 2. (F–H) Validation of differential localization of Fbxo31 3′UTRs. (I–K) Validation of differential localization of VapB 3′UTRs.
Figure 3
Differential localization of mRNAs with alternative splice events.
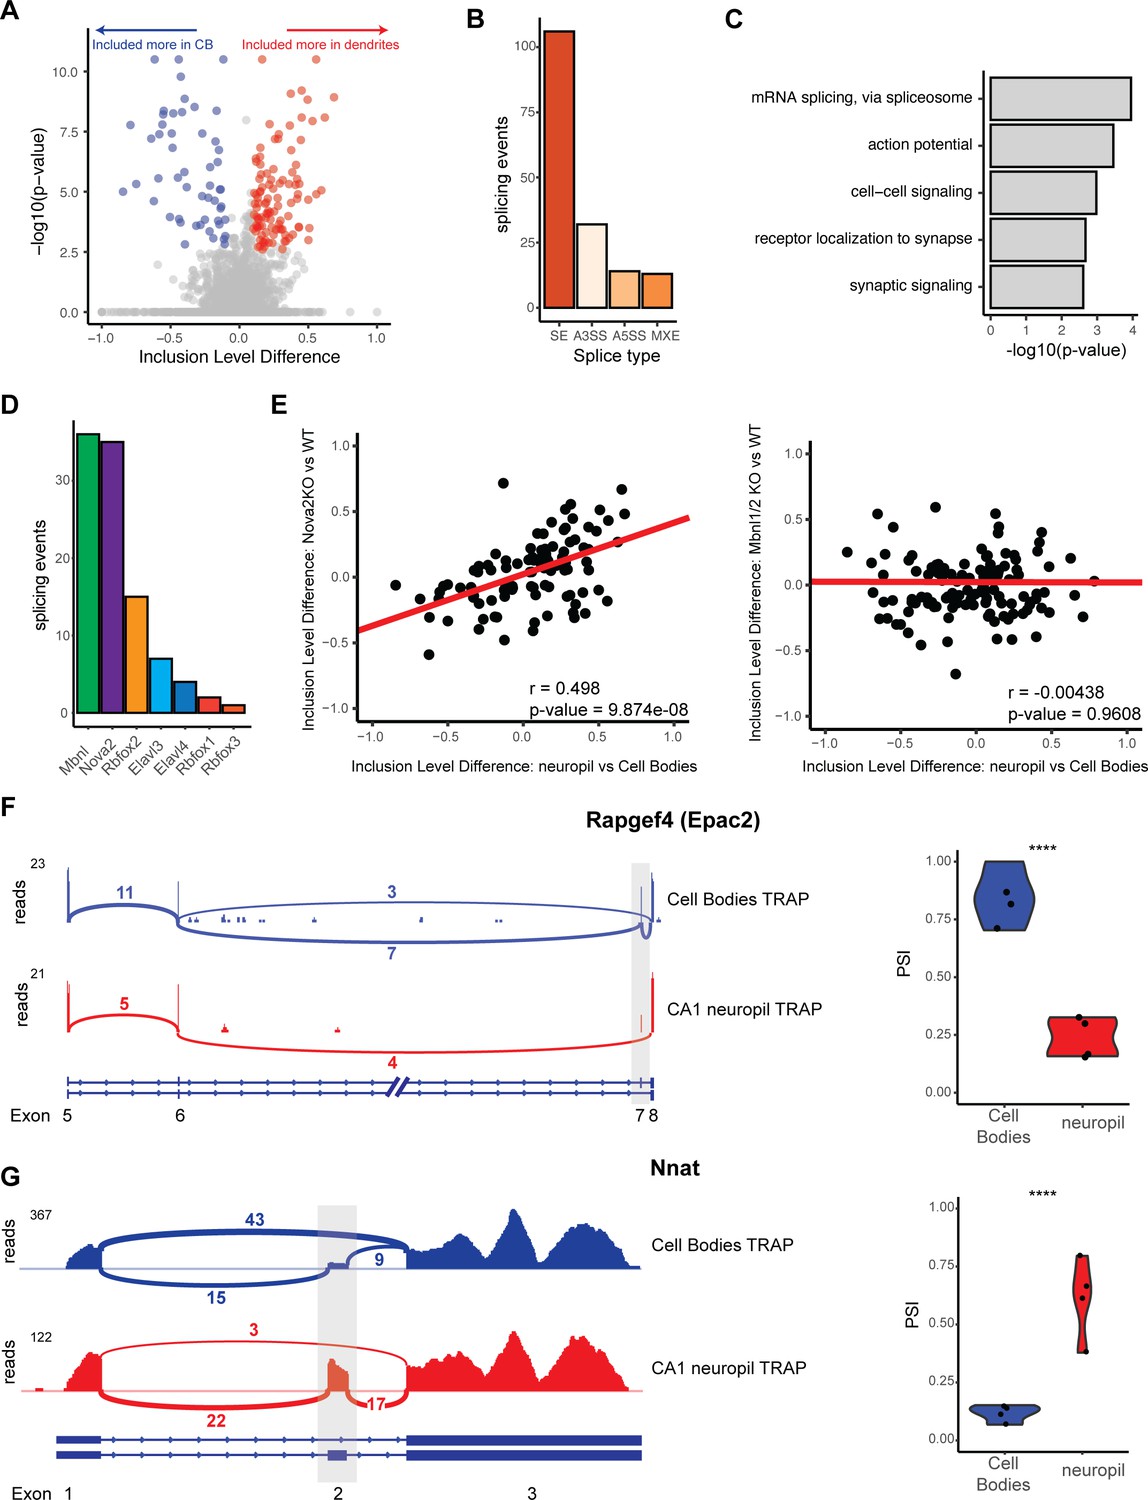
(A) Analysis of cell bodies and CA1 neuropil TRAP by rMATS reveals differentially abundant alternative splice events. Volcano plot shows the inclusion level difference vs. the -log10(p-value) for each detected splice event. Significant events (false discovery rate [FDR] < 0.05, |dPSI| > 0.1) are colored either red (included more in the CA1 dendrites) or blue (included more in cell bodies). (B) Types of splicing events identified as differentially localized. (C) GO analysis reveals enriched functional terms for mRNAs with differentially localized alternative splice events. All mRNAs expressed in CA1 neurons were used as a background. (D) Neuronal RNA-binding proteins that are responsible for differentially localized alternative splicing (AS) events. AS analysis was performed on RNA-binding protein KO vs. WT RNA-seq data (see Supplementary file 1F for sources of data). Splicing events that were shown to be differentially localized (seen in A) and also changed in the absence of the RNA-binding protein are plotted. (E) NOVA2 neuronal splicing factor generates cell body-restricted mRNA transcripts. Inclusion-level differences in CA1 neuropil vs. cell bodies-TRAP-seq are compared with the inclusion-level differences in NOVA2-/- vs. WT RNA-seq data (left) and MBNL1/2-/- RNA-seq (right). Red line indicates a fitted linear model of the data. Results of the Pearson correlation test are shown. (F) Differential localization of spliced Rapgef4 (Epac2) mRNAs. Representative Sashimi plots (left) are shown for cell bodies (blue) and CA1 neuropil (red) TRAP-seq. Exon numbers are indicated. Coverage indicates aligned reads. Numbers of detected splice junctions are shown. Violin plots (right) show the percent spliced in (PSI) values for the alternative splice event shown in the Sashimi plot. Each dot represents a single TRAP-seq replicate. Asterisks indicate significance (FDR) of the splicing change, as determined by rMATS (****FDR < 0.00001). (G) Differential localization of spliced Nnat mRNAs (see F for description).
Figure 4 with 1 supplement
CA1 FMRP targets are overrepresented in the dendritic ribosome-associated transcriptome.
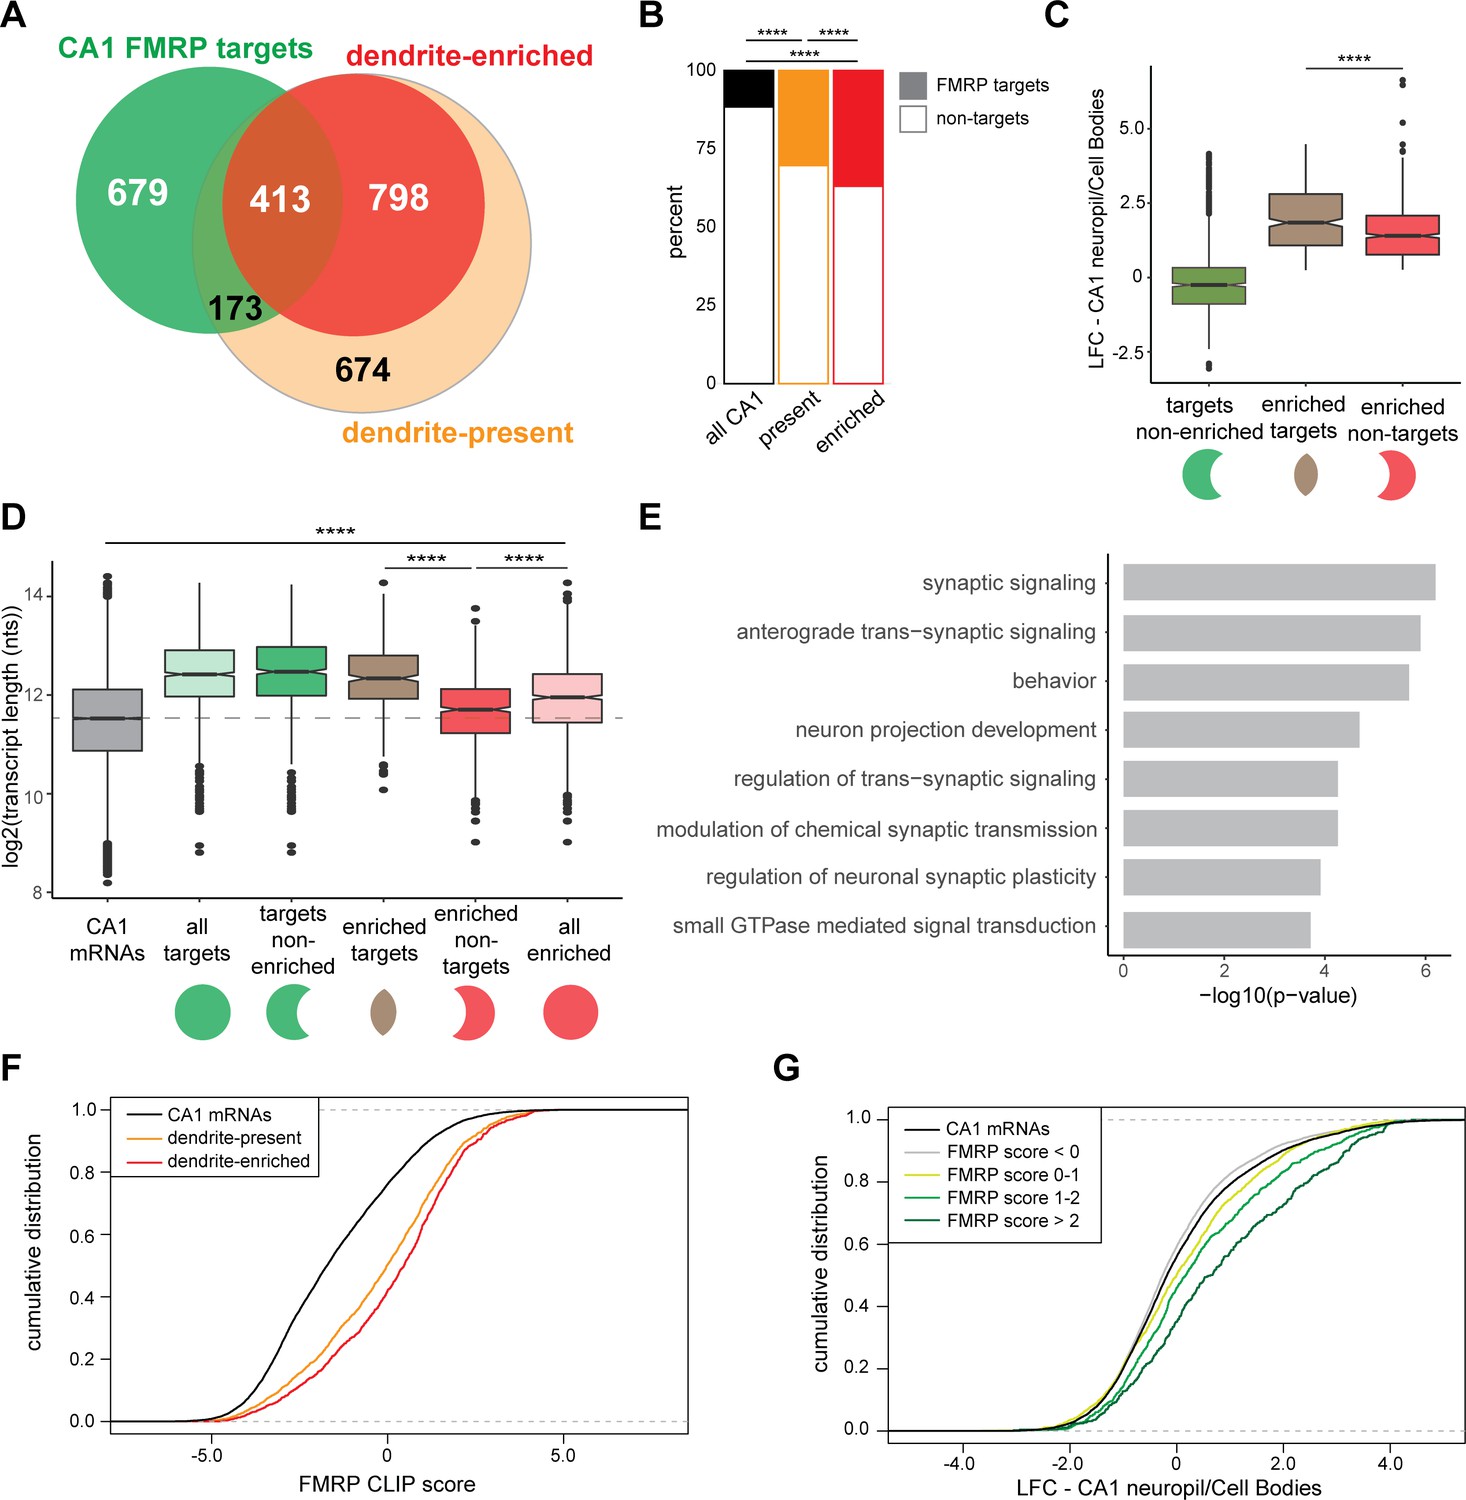
(A) Overlap of CA1 FMRP targets and the dendritic transcriptome defined by CA1 neuropil TRAP. CA1 FMRP targets are defined as those with FMRP CLIP-scores > 1 in hippocampal CamK-cTag-FMRP (Sawicka et al., 2019). Dendrite-enriched and dendrite-present mRNAs are defined in Figure 1. (B) CA1 FMRP targets are more overrepresented in the dendrite-enriched mRNAs than in the dendrite-present mRNAs. Chi-squared analysis was performed to determine the enrichment of CA1 FMRP targets among dendrite-present mRNAs (p-value=1.42e-175) and dendrite-enriched mRNAs (p-value=1.70e-170) in comparison to the fraction of FMRP targets that are expressed in CA1 neurons (as defined by CA1-specific TRAP). (C) CA1 FMRP targets are highly abundant in dendrites. Dendrite-enriched mRNAs were subdivided into CA1 FMRP targets (enriched targets) and nontargets (enriched nontargets), and the dendritic abundance (defined by log2 fold change [LFC] CA1 neuropil/cell bodies in DESeq2 analysis) was compared for each group. Dendrite-enriched mRNAs that are also CA1 FMRP targets are significantly more abundant in dendrites than dendritic non-FMRP targets. Wilcoxon rank-sum test was used to determine significance (****p<0.00001). (D) CA1 FMRP targets in the dendritic transcriptome are significantly longer than non-FMRP targets. mRNA transcript lengths (in log2(nts)) for all CA1-expressed genes and the subsets defined in (A) were compared. For each gene expressed in the CA1 transcriptome, the length of the most highly expressed mRNA was considered. Wilcoxon rank-sum test was used to determine significance. Dashed line indicates the mean transcript length for all CA1 mRNAs. (E) CA1 FMRP targets in the dendritic transcriptome encode proteins involved in synaptic signaling and synaptic plasticity. GO analysis was performed by comparing the dendrite-enriched CA1 FMRP targets (enriched targets) with all dendrite-enriched mRNAs. (F) CA1 FMRP targets in the dendritic transcriptome have large CA1 FMRP CLIP scores. CA1 FMRP CLIP scores for all CA1 genes were determined previously for whole-cell FMRP cTag CLIP and CA1-specific TRAP. Cumulative distribution function (CDF) plots compare the CA1 FMRP CLIP scores (Sawicka et al., 2019) for all CA1 genes (black) and those defined as either dendrite-present (orange) or dendrite-enriched (red). (G) Relative abundance in dendrites of CA1 FMRP targets found in the dendritic transcriptome correlates with FMRP binding. Relative abundance in dendrites (LFC/standard error [SE] CA1 neuropil TRAP vs. cell bodies TRAP) was compared by CDF plots for all CA1 genes (black) and subsets with CA1 FMRP-CLIP scores less than 0, 0–1, 1–2, or over 2.
Figure 4—figure supplement 1
Sequence characteristics of FMRP targets found in the dendrites.
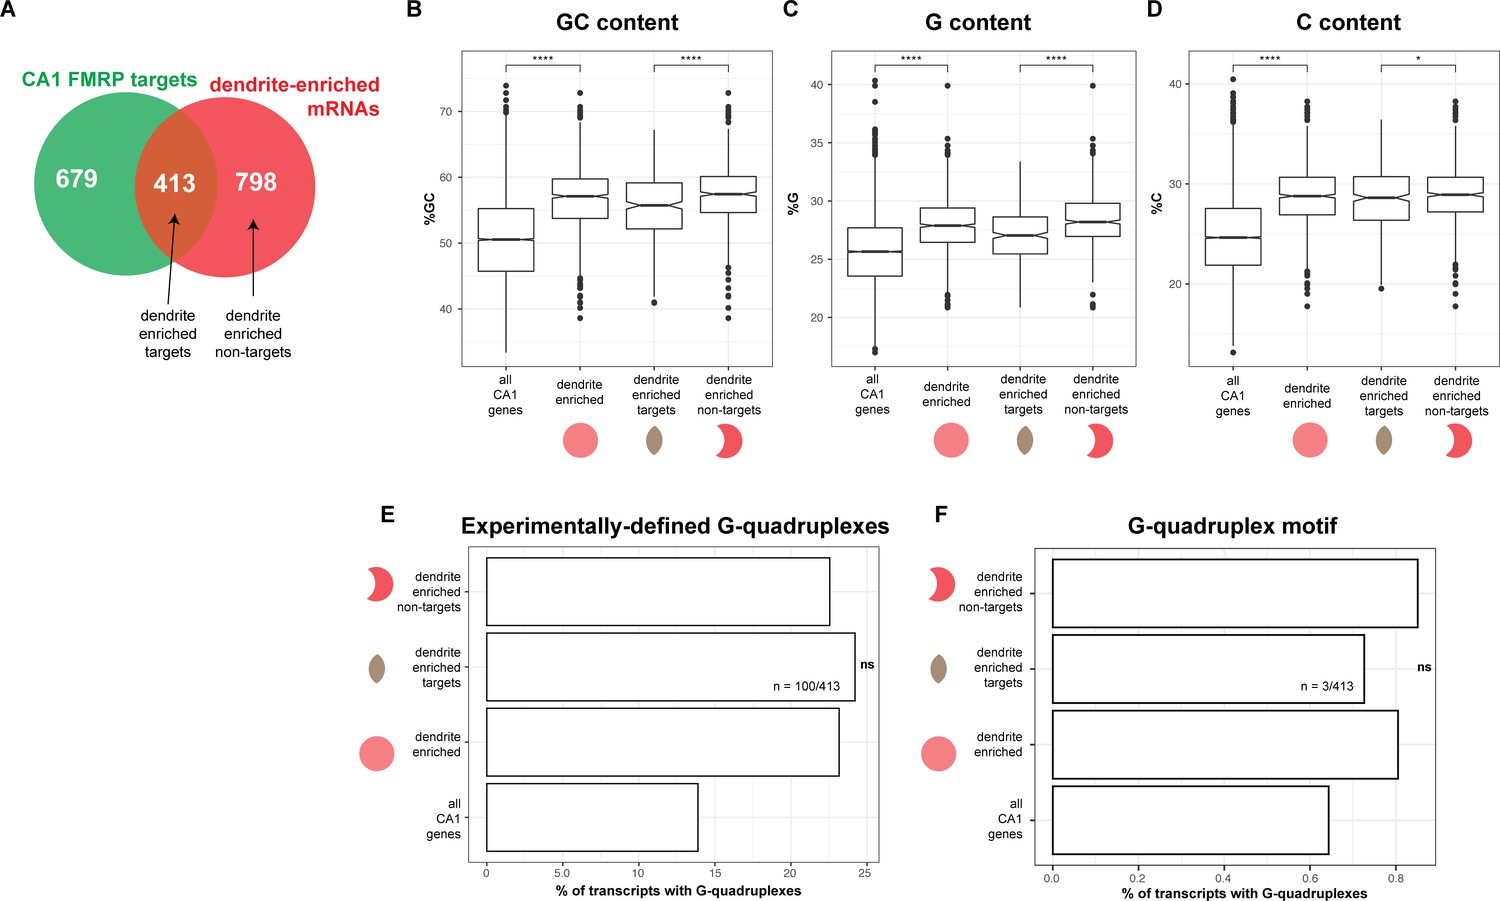
(A) Schematic of the overlap between CA1 FMRP targets and dendrite-enriched mRNAs. (B) Dendritic mRNAs are GC-rich. GC content, as defined by percent G+C for all CA1 mRNAs, dendrite enriched mRNAs (1211), dendrite-enriched FMRP targets (413), and dendrite-enriched non-FMRP targets (798, see A). Asterisks indicate significance in Wilcoxon rank-sum tests (*p<0.05, ****p<0.0001). (C) Dendritic mRNAs are G-rich, as defined by percent G, (D) Dendritic mRNAs are C-rich, as defined by percent C. (E) Experimentally defined G-quadruplexes are not enriched in dendrite-enriched FMRP targets. The percent of all CA1 mRNAs, all dendrite-enriched mRNAs, dendrite-enriched FMRP-bound targets (413), and dendrite-enriched non-FMRP targets (798) that contain experimentally defined G-quadruplexes is plotted. Shown are the results of chi-squared analysis comparing the enrichment of G-quadruplex containing mRNAs in dendrite-enriched FMRP targets vs. dendrite-enriched non-FMRP targets. ‘ns’ indicates a p>0.01 (F) Predicted G-quadruplex motifs are not enriched in dendrite-enriched FMRP targets. As in (E), except looking for the presence of mRNAs with G-quadruplex motifs in 3′UTRs as described in Goering et al., 2020.
Figure 5
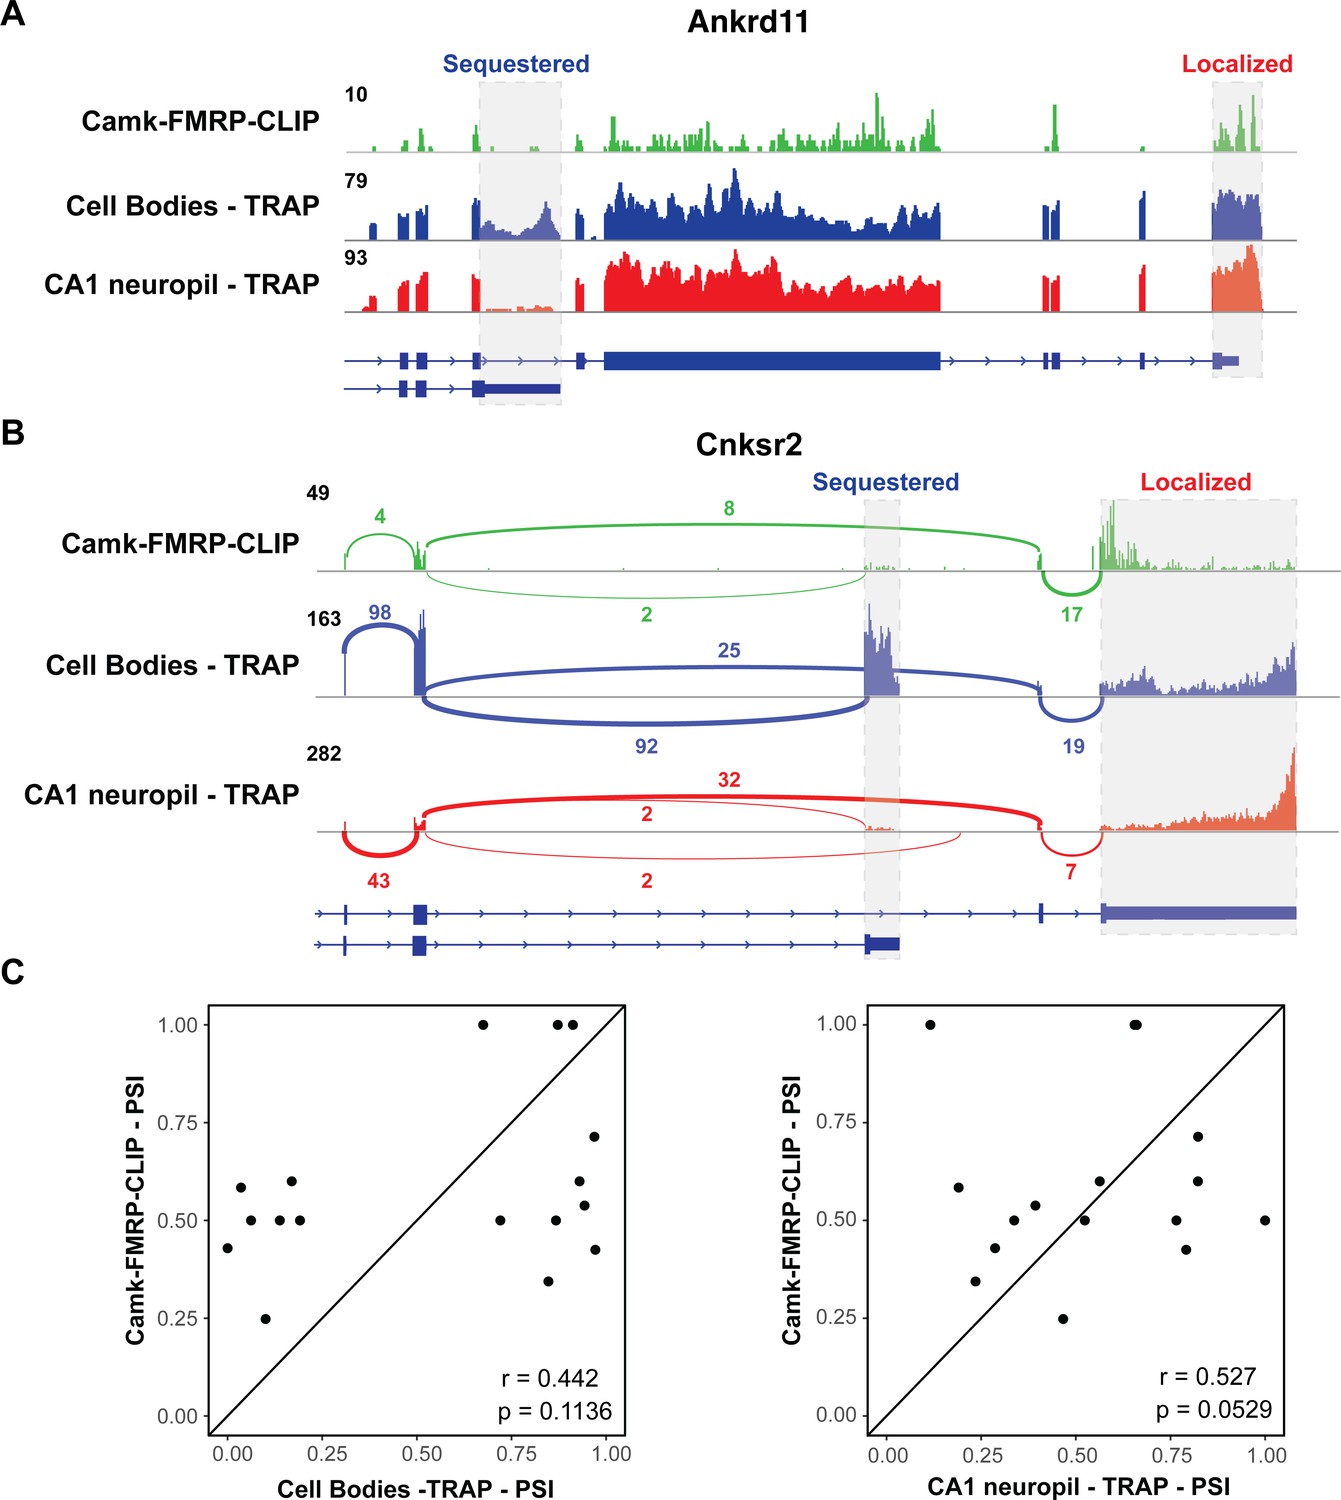
FMRP specifically binds localized mRNA isoforms.
(A) FMRP preferentially binds long, localized Ankrd11 mRNAs. The Ankrd11 gene encodes mRNAs with two potential 3′UTRs (gray boxes). CA1 FMRP-CLIP tags (from hippocampal Camk-cTag FMRP CLIP reported previously; Sawicka et al., 2019) are shown in green, and representative coverage from CA1 cell bodies (blue) and CA1 neuropil-(red) TRAP is shown. (B) Splice junctions in FMRP-CLIP derived from Cnksr2 mRNA isoforms. Cnksr2 expresses two mRNA isoforms, indicated by gray boxes. Sashimi plots illustrate coverage and junction-spanning reads from CA1 FMRP-CLIP in green (tags are aggregated from three replicates). Sashimi plots are also shown for cell bodies TRAP (blue) and CA1 neuropil TRAP (red). (C) Splicing isoforms discovered in FMRP-CLIP tags resemble those found in the localized transcriptome. Percent spliced in (PSI) values derived from splice junction reads in CA1 FMRP-cTag-CLIP tags were compared to PSI values from the same events in cell bodies-TRAP (left) and CA1 neuropil TRAP (right). Results of Pearson correlation tests are shown.
Figure 6 with 2 supplements
Compartment-specific cTag FMRP-CLIP reveals dendritic FMRP targets.
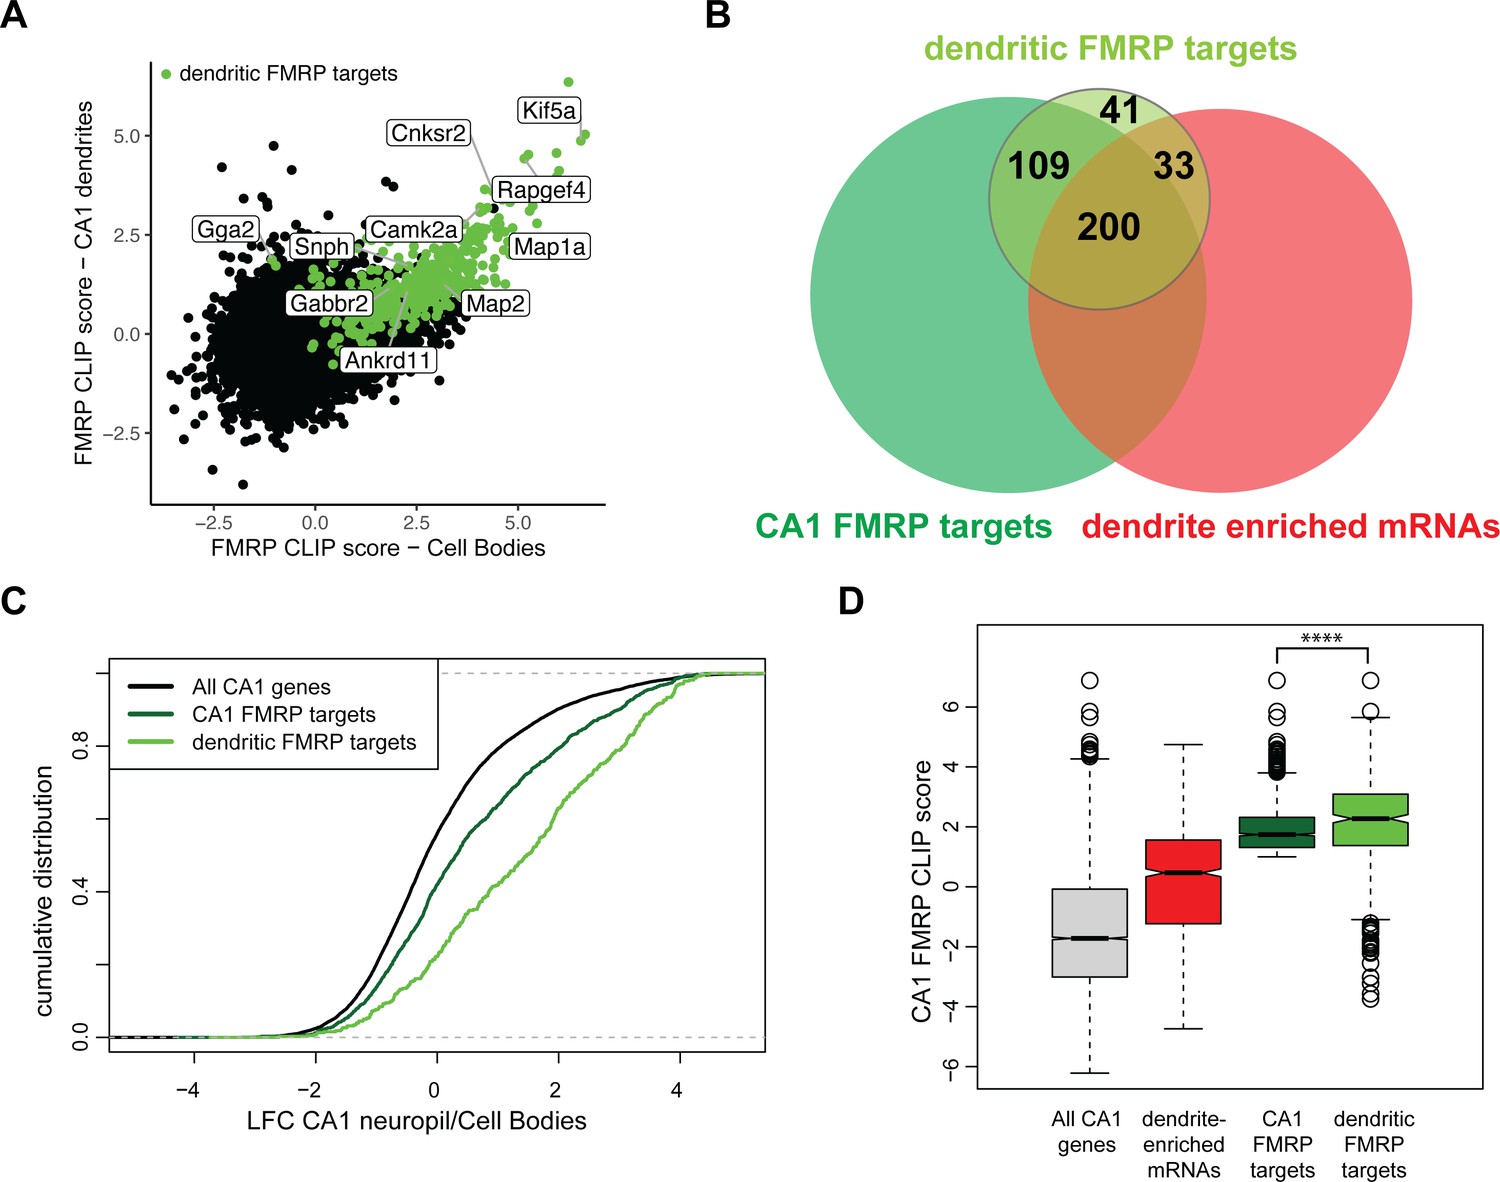
(A) Compartment-specific Camk2a-cTag FMRP-CLIP and TRAP-seq were integrated to determine compartment-specific FMRP CLIP scores. CLIP scores were determined for all replicates. Plotted is the mean CLIP scores for the CA1 cell bodies and dendrites. Dendritic FMRP targets are colored in green. Genes of interest are labeled. (B) A subset of CA1 FMRP-CLIP targets (previously defined [Sawicka et al., 2019], dark green) were identified as dendritic FMRP-CLIP targets (light green). These are overlapped with dendrite-enriched mRNAs (Figure 1B) and whole-cell CA1 FMRP targets. (C) Dendritic FMRP targets are abundant in dendrites when compared to cell bodies. Dendrite-enrichment (log2 fold change [LFC]/standard error [SE] CA1 neuropil TRAP/cell bodies-TRAP) is plotted for all CA1 genes, all CA1 FMRP targets, and dendritic FMRP-CLIP targets. (D) Dendritic FMRP targets have high whole-cell FMRP-binding scores. Whole-cell CA1 FMRP CLIP scores (Sawicka et al., 2019) are plotted for all CA1 mRNAs, dendrite-enriched mRNAs, all CA1 FMRP targets and dendritic FMRP targets. Asterisks indicate significance in Wilcoxon rank-sum tests (****p<0.00001).
Figure 6—figure supplement 1
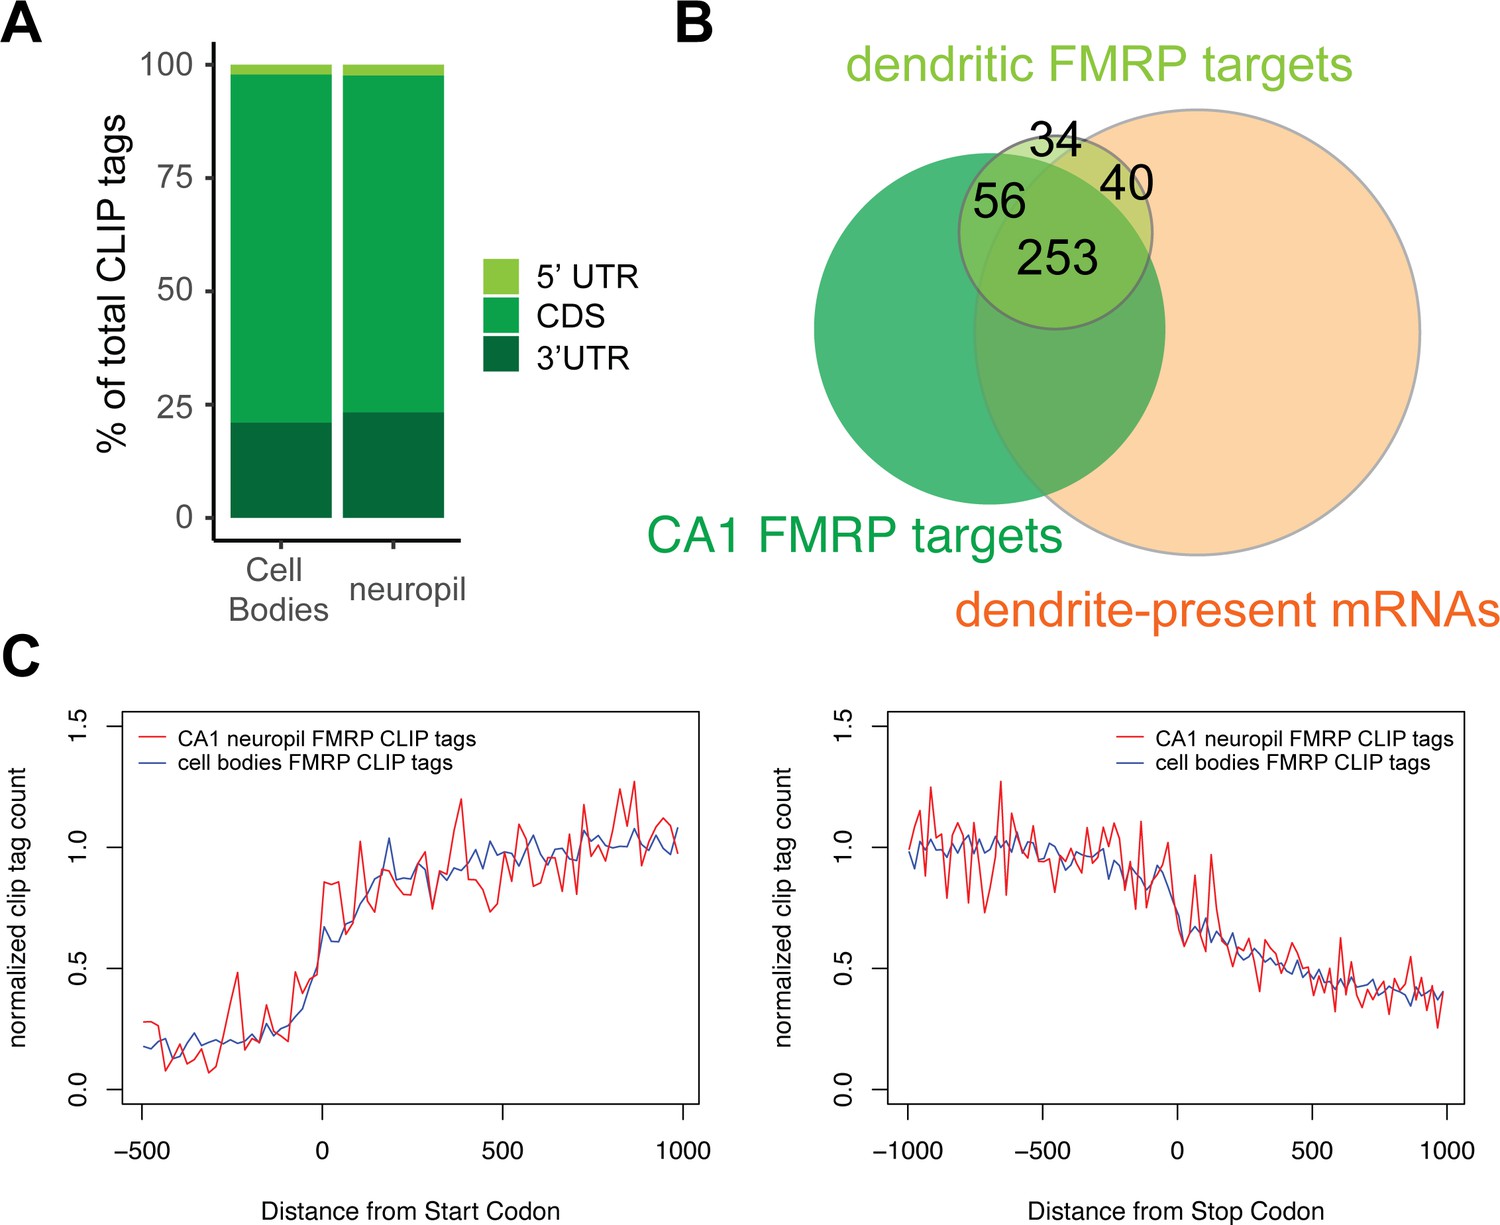
Compartment-specific cTag-FMRP-CLIP.
(A) Genomic distribution of FMRP cTag-CLIP tags in CA1 cell bodies and neuropil. Tags are aggregated for five biological replicates, and distribution is defined by the first nucleotide of the aligned read. (B) Overlap between dendritic FMRP targets, CA1 FMRP targets (Sawicka et al., 2019), and dendrite-present mRNAs (Figure 1) (C) Compartment-specific FMRP-CLIP normalized coverage across mRNAs. Normalized tag counts (determined as described in Sawicka et al., 2019) are plotted for cell bodies (blue) or CA1 neuropil FMRP-cTag-CLIP (red) for the 1000 nts surrounding the start (left) or stop (right) codon.
Figure 6—figure supplement 2
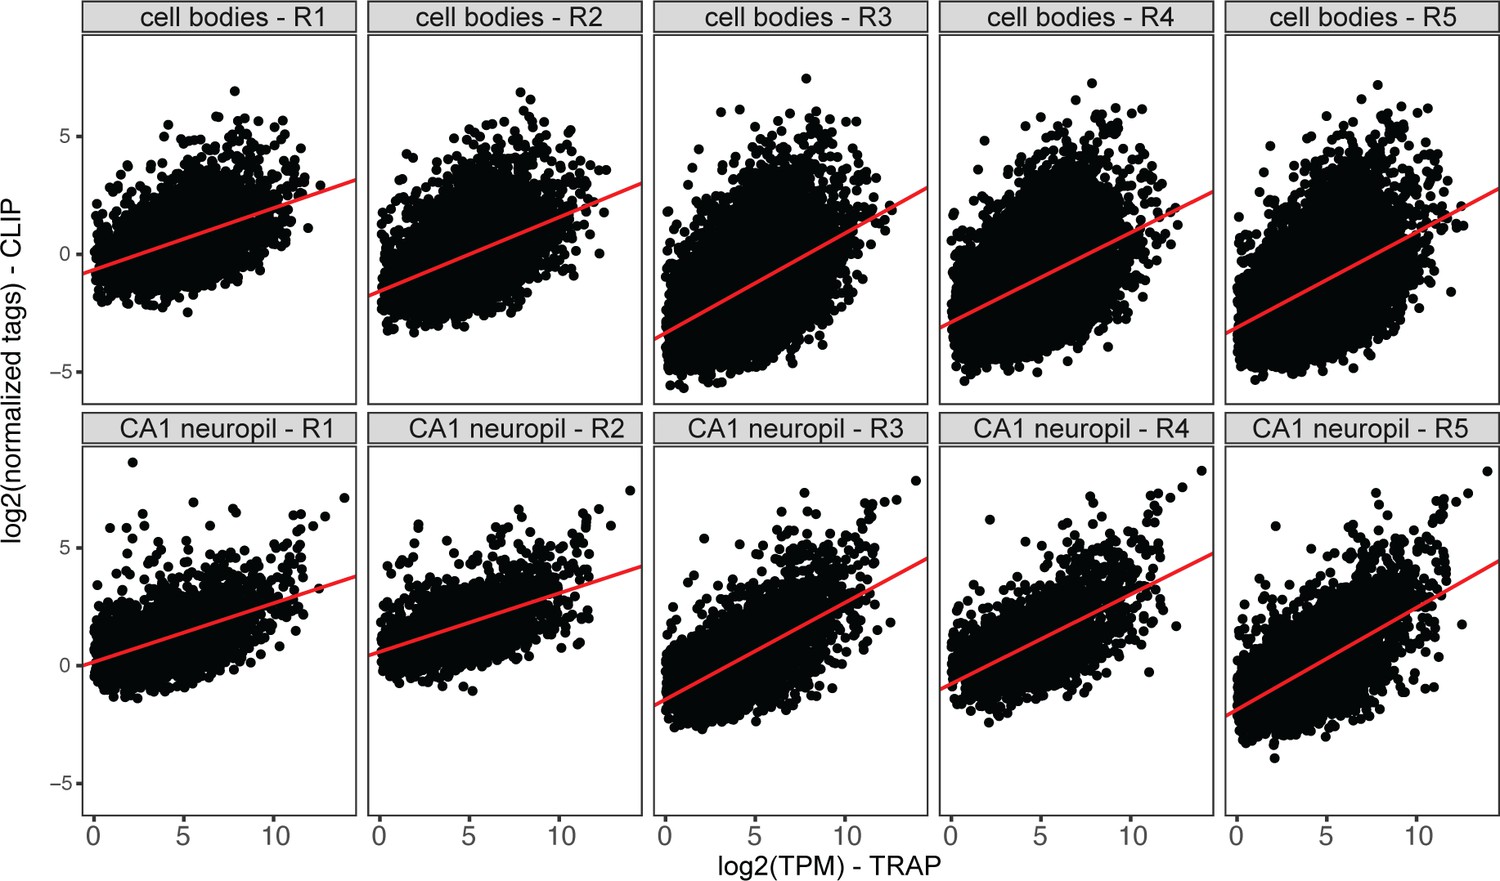
Compartment-specific FMRP-CLIP scores.
Plots represent normalized CA1 neuropil or cell bodies FMRP-CLIP tags (log2) vs. TRAP log2(TPM) for cell bodies- or CA1 neuropil-CLIP and TRAP experiments. For each replicate, linear models were generated (shown in red). Compartment-specific CLIP scores are determined for each gene as the distance between each gene and the linear model line. Average CLIP scores for the five replicates were used as compartment-specific FMRP-CLIP scores for each gene.
Figure 7 with 4 supplements
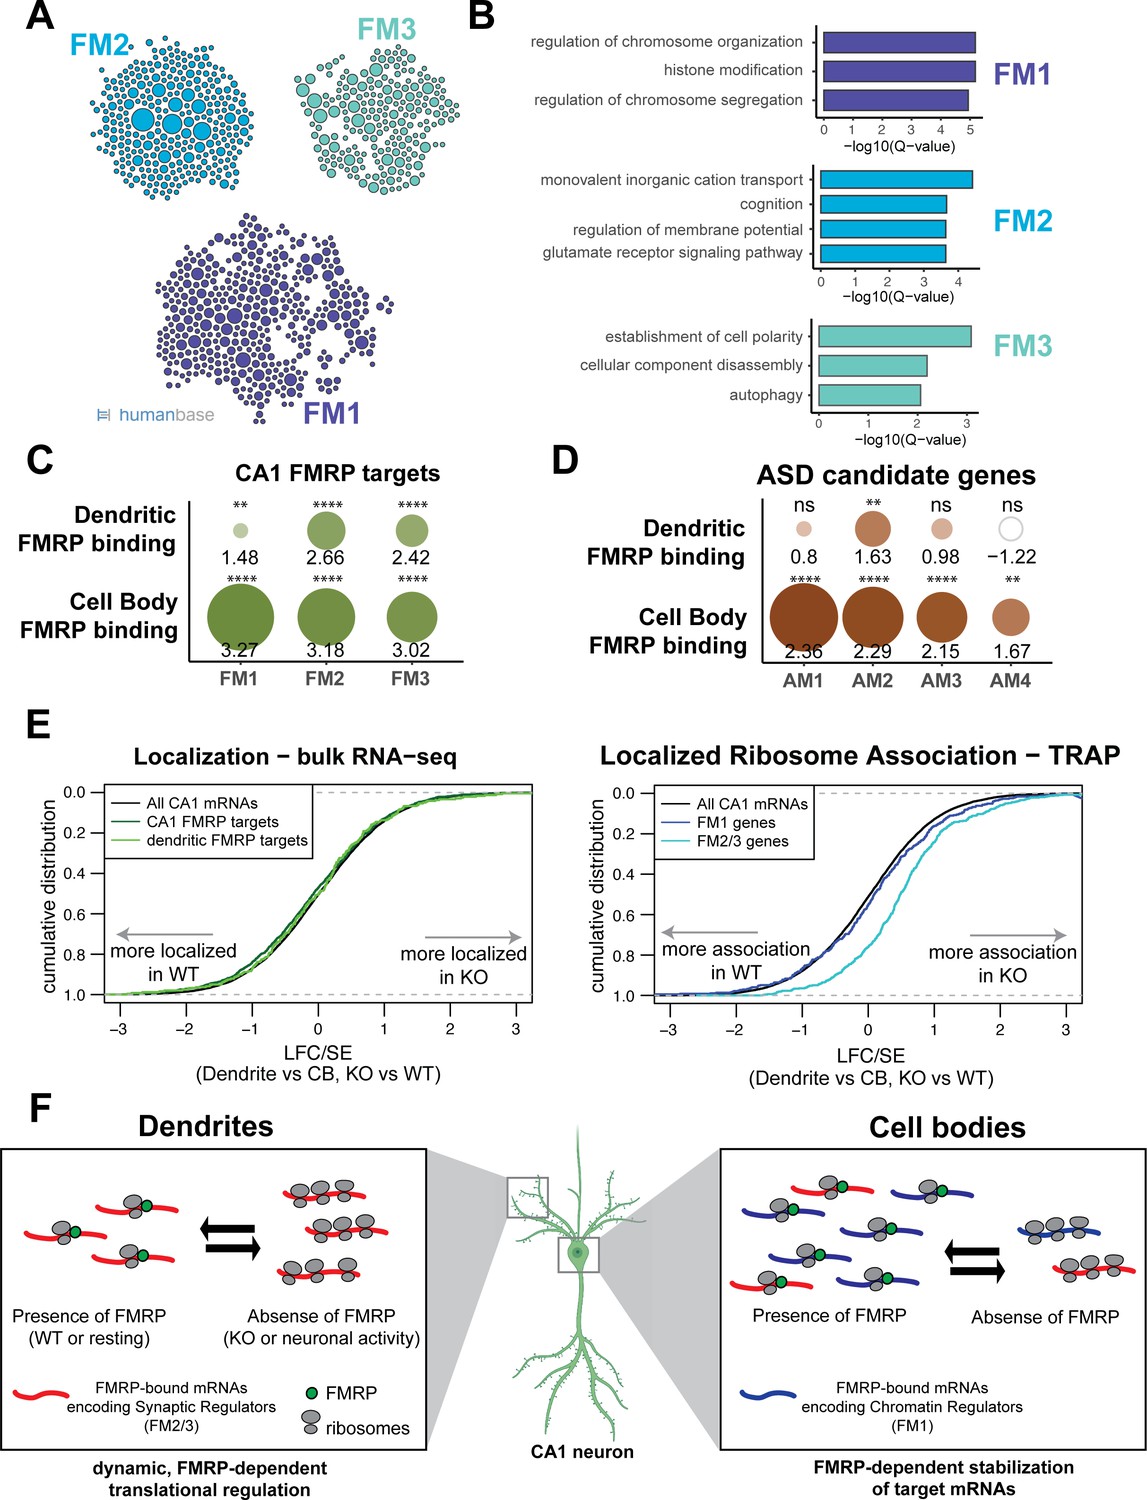
FMRP regulates functionally distinct mRNAs in the cell bodies and dendrites of CA1 neurons.
(A) Whole-cell CA1 FMRP targets fall into three functional clusters. Functional module detection was performed for CA1 FMRP targets by the HumanBase software. (B) Top GO terms for the three largest functional modules of CA1 FMRP targets. Q-values for enrichment of terms were determined by the HumanBase software. (C) Dendritic FMRP targets are enriched in functionally distinct modules of CA1 FMRP targets. CA1 genes were ranked according to FMRP dendritic and cell bodies FMRP-CLIP scores, and gene set enrichment analysis (GSEA) was performed using the FMRP functional clusters (from A) as gene sets. Circles are colored according to normalized enrichment scores (NES) and sized according to false discovery rate (FDR) from the GSEA. NES values are shown, and asterisks indicate significance (**FDR <0.001, ****FDR<0.00001). (D) Dendritic FMRP targets are enriched in a functional module of autism candidate genes. GSEA was performed as shown in (C), with functional modules of autism candidate genes (SFARI) clustered according to the HumanBase software. (E) Localization of FM2/3 FMRP targets is largely unchanged in compartment-specific bulk RNA-seq of FMRP KO animals, but increased in TRAP. Left: neuropil localization (log2 fold change [LFC]/standard error [SE] of CA1 neuropil bulk RNA-seq vs. cell bodies bulk RNA-seq) was assessed in FMRP KO vs. WT animals. Cumulative distribution plots are shown. Shifts to the right indicate more localization in the FMRP KO animals, and shifts to the left indicate more localization in WT animals. All CA1-expressed genes, all CA1 FMRP targets and dendritic FMRP targets are shown. Right: localized ribosome association in TRAP-seq on FMRP KO vs. WT animals, with subsets including the FM1/2/3 groups of CA1 FMRP targets as described in (A). (F) Distinct, compartment-specific FMRP regulation of functionally distinct subsets of mRNAs in CA1 cell bodies and dendrites. Localization of mRNA to the dendrites does not appear to be FMRP-dependent in CA1 neurons, but likely depends on other factors (e.g., other RNA-binding proteins or mRNA characteristics such as GC content, length, or secondary structure) that target mRNAs to the dendrite or compartments within the neuronal soma. In dendrites, the absence of FMRP increases the ribosome association of its targets; this finding is consistent with a model in which FMRP inhibits ribosomal elongation and thereby translation (Darnell et al., 2011). In resting neurons, the translation of FMRP-bound mRNAs encoding synaptic regulators (FM2 and FM3 mRNAs) is repressed. When FMRP is not functioning, due to either genetic alteration (FMRP KO or FXS) or neuronal activity-dependent regulation (e.g., FMRP calcium-dependent dephosphorylation; Lee et al., 2011; Bear et al., 2004), ribosome association and translation of targets are increased. In cell bodies, FMRP binds mRNAs that encode for chromatin regulators (the FM1 cluster of FMRP targets), as well as FM2/3 mRNAs (consistent with synapses forming on the cell soma). FM1 targets show patterns of mRNA regulation similar to what our group observed in bulk CA1 neurons: FMRP target abundance is decreased in FMRP KO cells, perhaps due to loss of FMRP-mediated block of degradation of mRNAs with stalled ribosomes (Sawicka et al., 2019; Darnell, 2020). This does not preclude the observation that FMRP also inhibits translation of chromatin regulators (Korb et al., 2017).
Figure 7—figure supplement 1
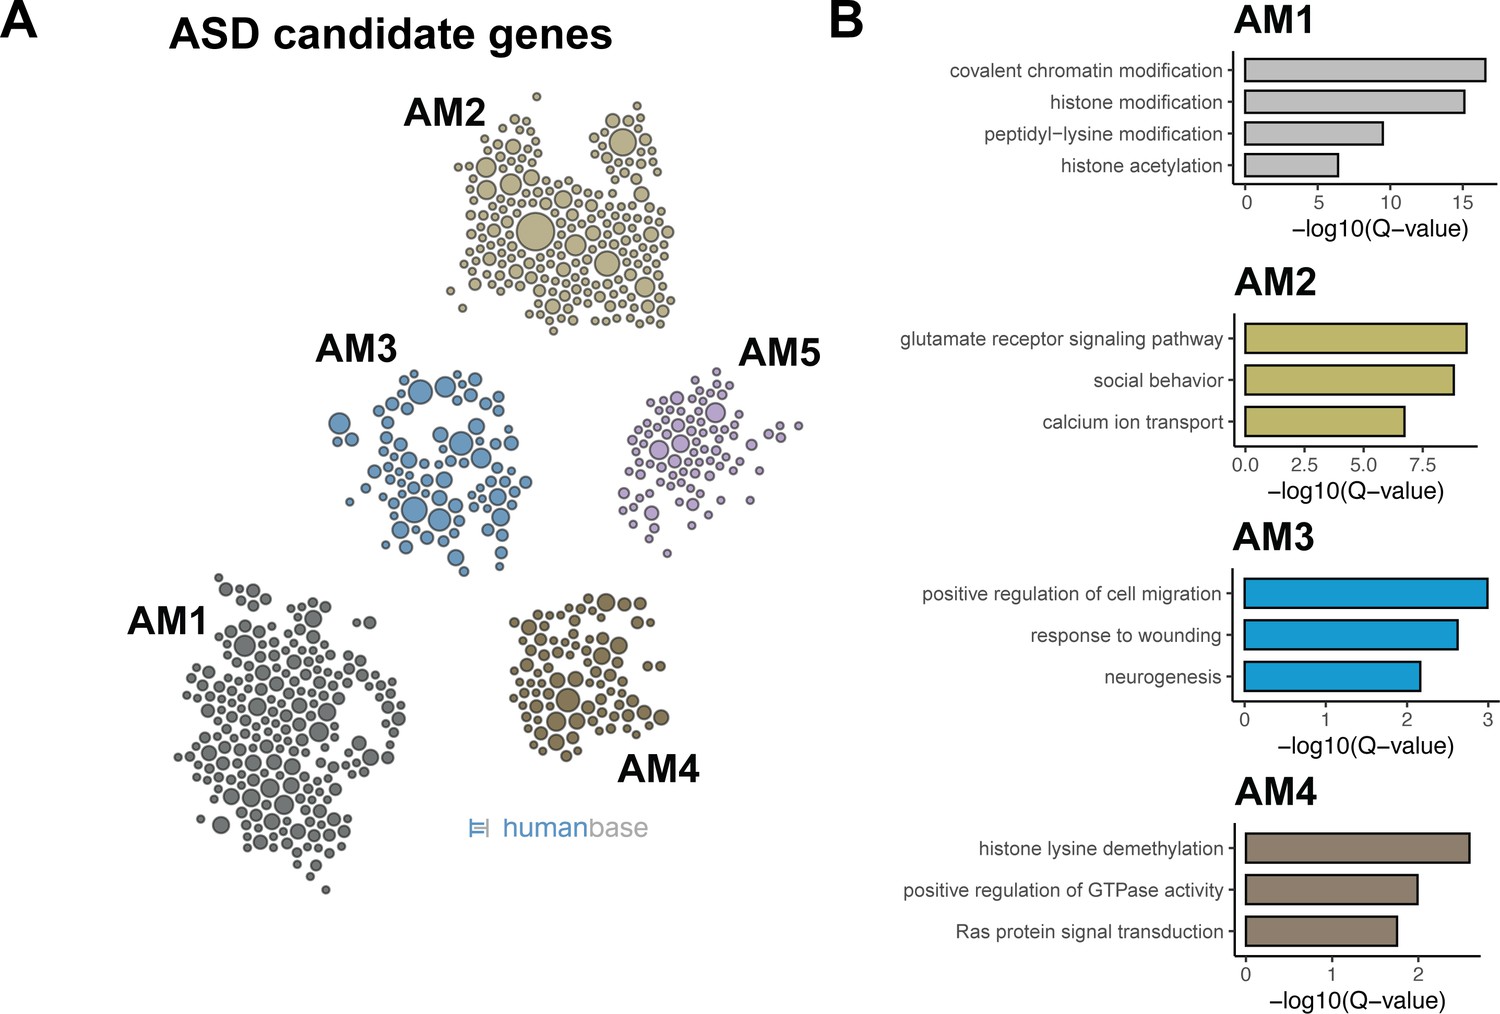
Predicted compartment-specific FMRP regulation of autism spectrum disorder (ASD) candidate genes.
(A) Functional clusters of SFARI ASD candidate genes. Potential ASD candidate genes as identified by SFARI were clustered with HumanBase software. (B) GO terms of top functional clusters of ASD candidate genes GO terms were identified by HumanBase software. Q-values of top GO terms were determined by the HumanBase software.
Figure 7—figure supplement 2
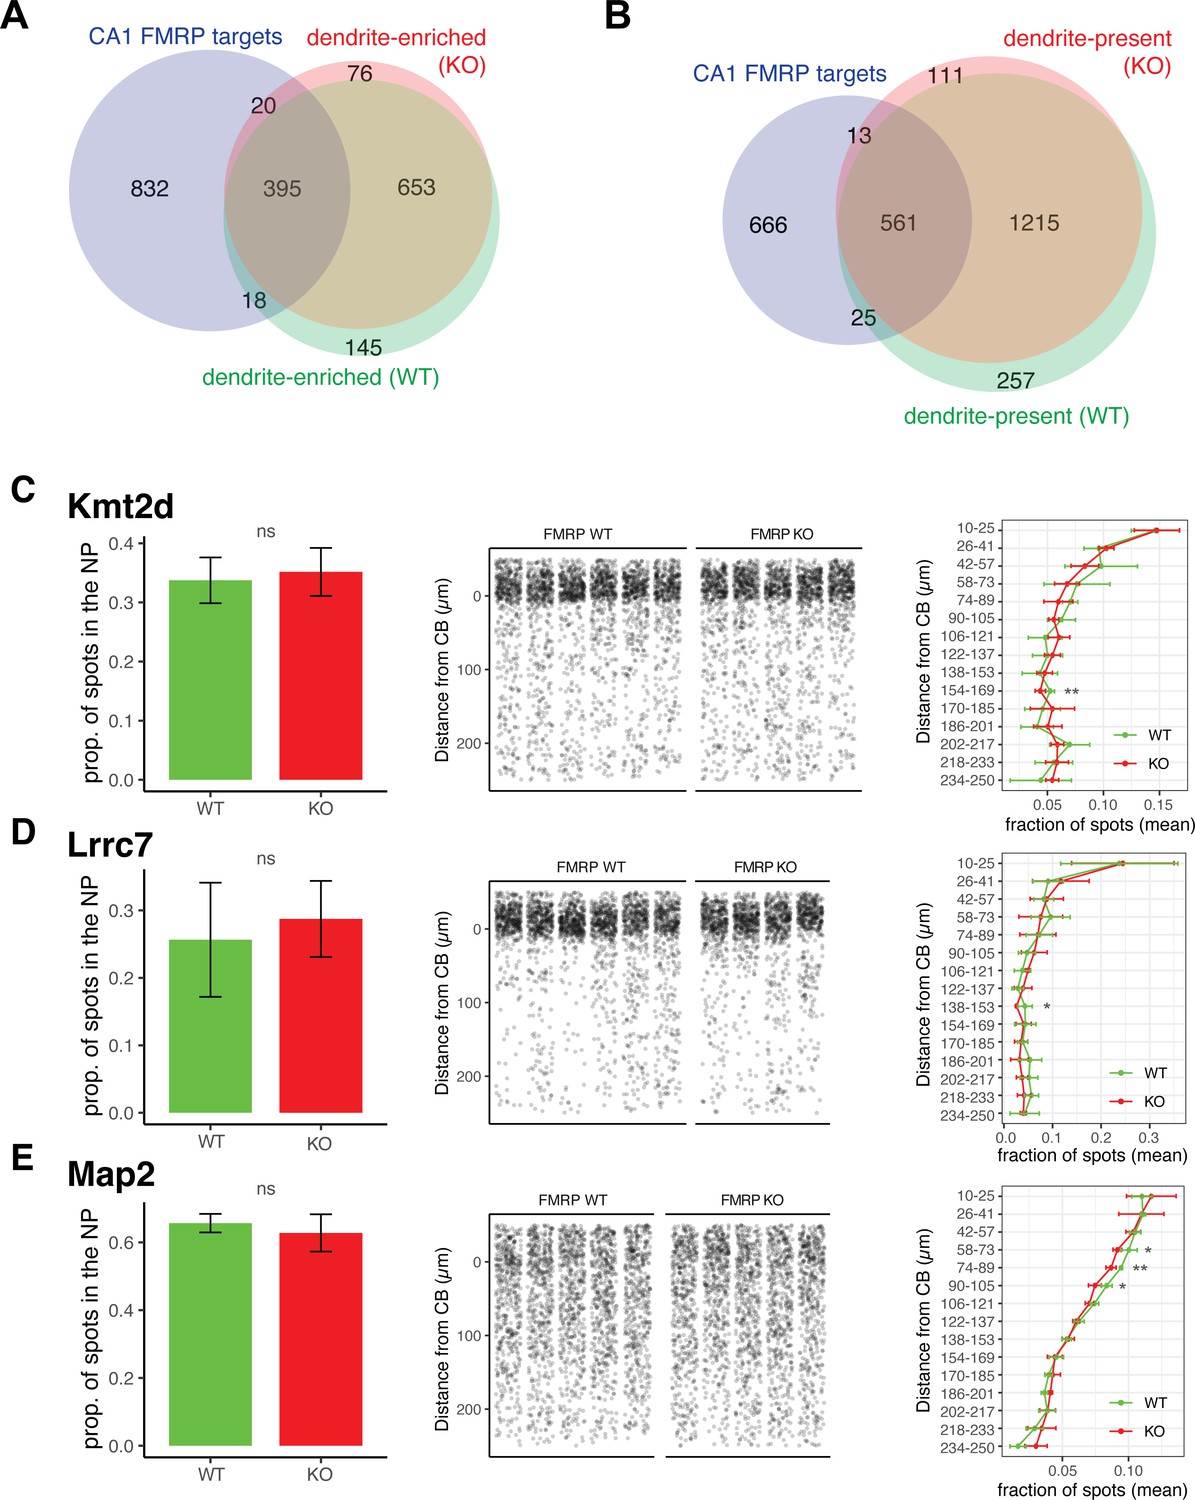
Dendritic localization of FMRP targets is unaffected in FMRP KO animals.
(A) Dendrite-enriched mRNAs largely overlap in FMRP WT and KO animals. Dendrite-enriched mRNAs were defined in FMRP KO mice (red) in the same manner as in Figure 1 for FMRP WT animals using bulk RNA-seq and TRAP-seq data. Overlap with dendrite-enriched mRNAs in WT (Figure 1, shown here in green) and CA1 FMRP targets (blue) in shown. 95.6% of dendrite-enriched FMRP targets in the WT were also found to be enriched in the dendrites of FMRP KO animals. (B) Dendrite-present mRNAs largely overlap in FMRP WT and KO animals. Dendrite-present mRNAs were defined in FMRP KO animals. Overlap with dendrite-present mRNAs in WT (Figure 1) and CA1 FMRP targets is shown. 95.7% of dendrite-present FMRP targets in WT are also to be found as dendrite-present in KO animals. (C–E) Validation of FMRP target localization in WT and KO animals. Fluorescence in situ hybridization (FISH) was performed to assess FMRP target localization (Kmt2d [C], Lrrc7 [D}, and Map2 [E]) in FMRP KO mouse brain slices. Left panel shows the proportion of detected mRNAs that were detected in the neuropil (>10 µm from the predicted cell bodies [CB] layer) in WT and KO animals. Wilcoxon rank-sum was performed to detect significance. Middle panel shows densitometry of 1000 spots samples from each picture analyzed. Distance from the CB was determined as described in Materials and methods and Figure 1. In the right panel, spots were binned into 15 groups according to the distance traveled from the CB, and the fraction of spots in each genotype in this range was analyzed by t-test to determined differences in the fraction of spots at each location in FMRP WT and KO animals (*p<0.05, **<0.01).
Figure 7—figure supplement 3
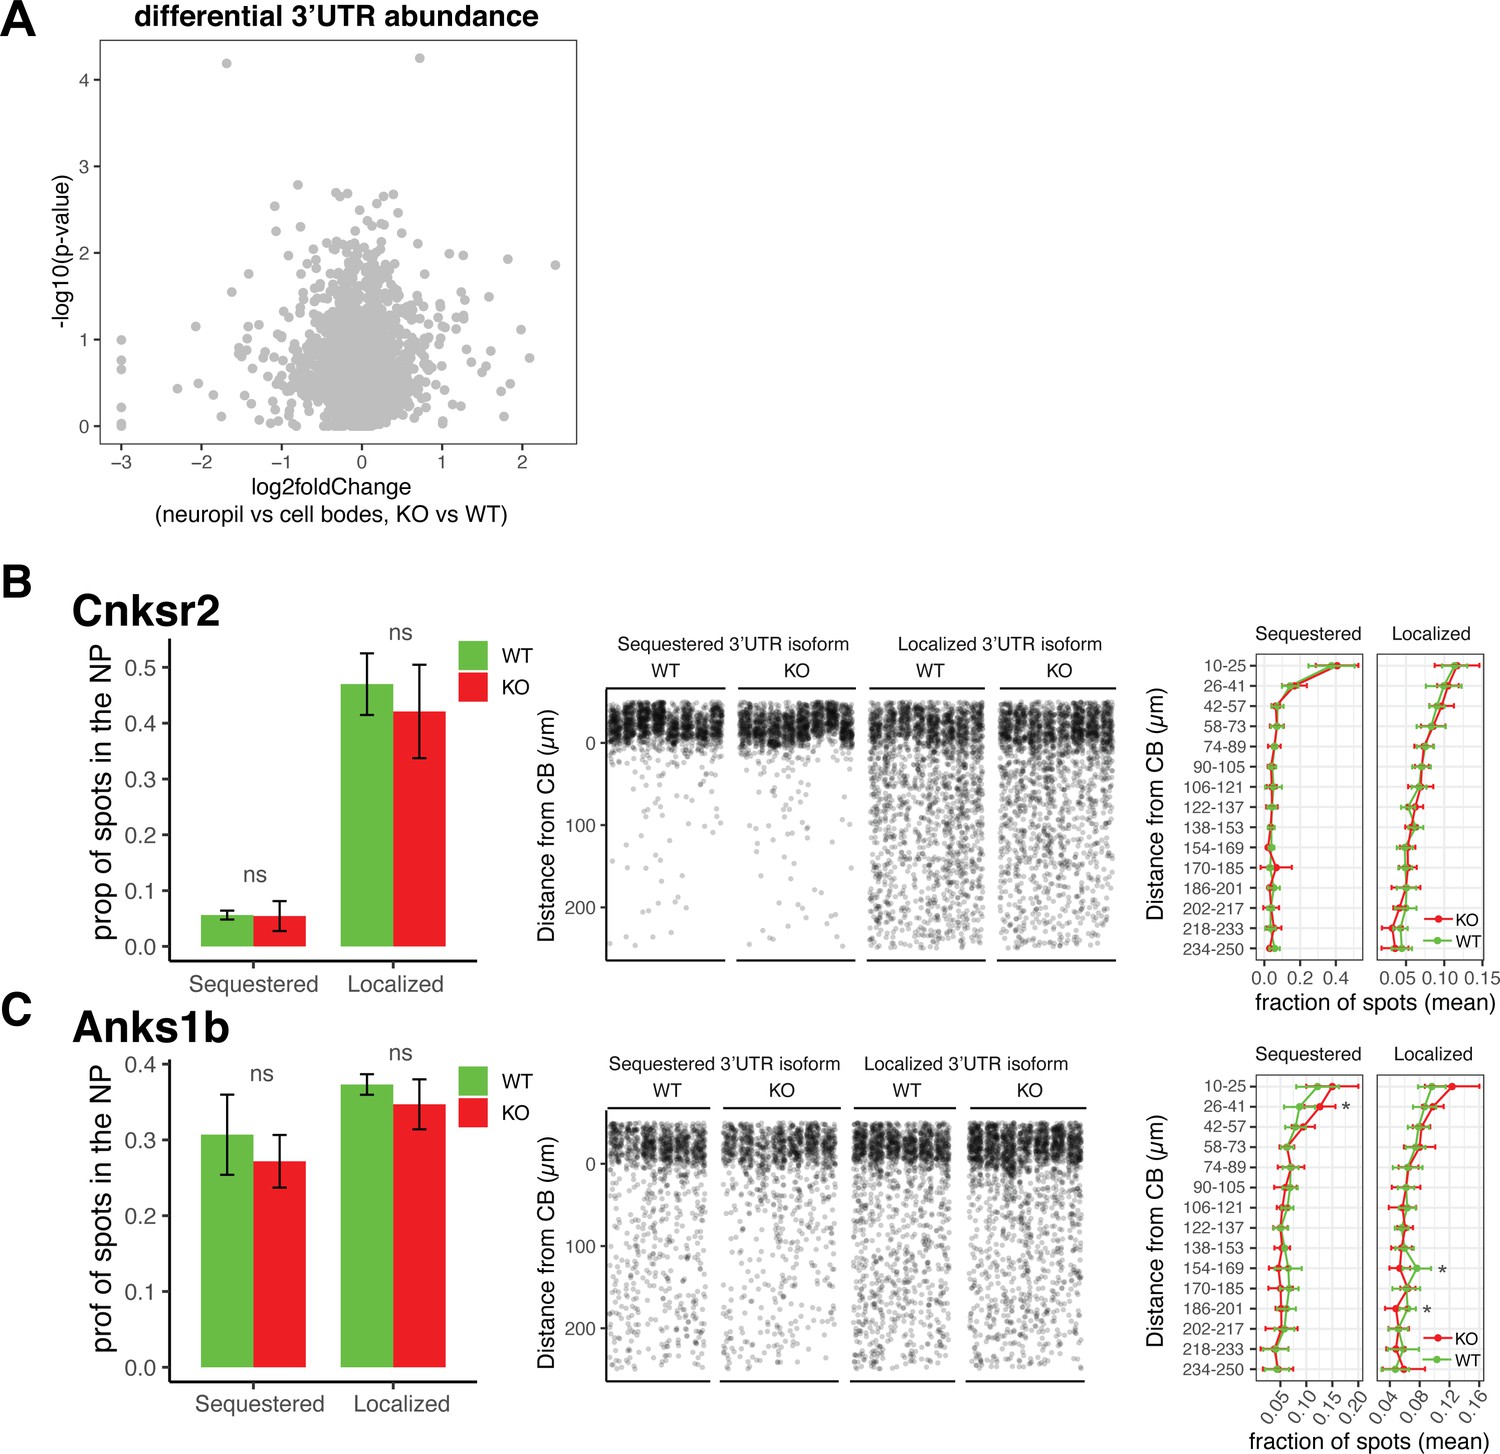
Differential localization of 3′UTR isoforms is unaffected in FMRP KO animals.
(A) Differential 3′UTR isoform usage in FMRP WT vs. KO animals. Differential 3′UTR usage was analyzed using DEXSeq as described in Figure 2 to identify 3′UTRs whose ratio of usage between neuropil and cell body (CB) in FMRP WT and KO animals was altered. Shown are results from DEXSeq analysis showing the log2 fold change (neuropil vs. cell bodies, KO vs. WT) and -log10(p-value) of each 3′UTR. Gray spots indicate that all 3′UTRs analyzed have a false discovery rate (FDR) > 0.05, indicating no significant change in usage between FMRP KO and WT animals. (B, C) Validation of 3’UTR isoform localization in FMRP WT and KO animals. Fluorescence in situ hybridization (FISH) analysis of localization of 3′UTR isoforms of Cnksr2 (B) and Anks1b (C) isoforms in FMRP WT and KO animals. These genes were found in Figure 2 to express 3′UTR isoforms that are differentially localized to dendrites. Sequestered isoforms are those that are significantly localized to cell bodies in FMRP WT, and localized are those that are significantly used in the dendrites of WT CA1 neurons. Left: the fraction of spots that are found to be localized to the neuropil (>10 µm from the cell body layer) is shown for each isoform in FMRP WT and KO animals. Differences were assessed by Wilcoxon rank-sum tests. Middle: densitometry of the distance traveled from the cell bodies for a representative 1000 spots from each picture that was analyzed. Right: as described in Figure 7—figure supplement 2, detected mRNAs were binned into 15 bins according to the distance traveled from the cell bodies, and differences in the fractions of spots in each bin in FMRP WT and KO slices were analyzed. Significance indicates results of t-tests (* indicates p<0.05).
Figure 7—figure supplement 4
FMRP target RNAs are downregulated in the cell bodies and upregulated in the dendrites of CA1 neurons.
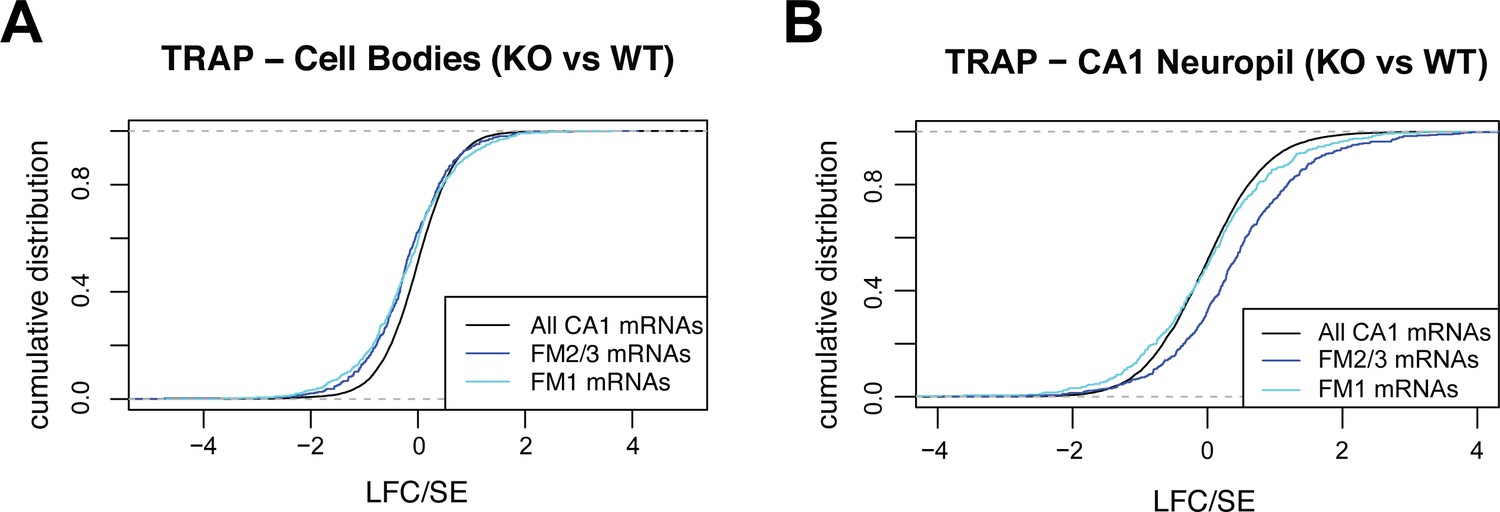
(A) Steady-state levels of FMRP targets on ribosomes are decreased in FMRP KO animals. FMRP-dependent changes in target abundance (log2 fold change/standard error [LFC/SE], KO/WT as determined by DESeq2) were analyzed in cell bodies TRAP. Cumulative distribution function (CDF) plots are shown, and colors indicate FMRP functional clusters, as defined in Figure 7A. (B) FM2/3 target mRNAs are increasingly ribosome associated in FMRP KO animals. Changes in FMRP target levels (LFC/SE, KO/WT) were analyzed in CA1 neuropil TRAP. CDF plots are shown, and colors indicate FMRP functional clusters.
Tables
Key resources table
| Reagent type (species) or resource | Designation | Source or reference | Identifiers | Additional information |
|---|---|---|---|---|
| Strain, strain background(Mus musculus C57BL6/J) | B6.Cg-Tg(Camk2a-cre)T29-1Stl/J | Jackson Laboratory | RRID:IMSR_JAX:005359 | Referred to as Camk2a-Cre |
| Strain, strain background(M. musculus C57BL6/J) | B6N.129-Rpl22tm1.1 Psam/J | Jackson Laboratory | RRID:IMSR_JAX:011029 | Referred to as RiboTag |
| Strain, strain background(M. musculus C57BL6/J) | B6.129P2-Fmr1tm1Cgr/J | Gift from W.T. Greenough | RRID:IMSR_JAX:003025 | Referred to as Fmr1 KO |
| Strain, strain background(M. musculus C57BL6/J) | Fmr1-cTag | Sawicka et al., 2019 | ||
| Strain, strain background(M. musculus C57BL6/J) | cTag-PABP | PMID:28910620 | ||
| Antibody | NeuN, guinea pig polyclonal | Millipore | Millipore Cat# ABN90P; RRID:AB_2341095 | For IF (1:2000) |
| Antibody | Anti-HA tag, rabbit polyclonal | Abcam | Abcam Cat# ab9110; RRID:AB_307019 | For IP (20–80 µg/mL depending on region) |
| Antibody | Anti-HA tag, rabbit monoclonal | Cell Signaling | Cell Signaling Cat# C29F4; RRID:AB_1549585 | For IF (1:4000) |
| Antibody | Anti-GFP antibodies HtzGFP19C8 and HtzGFP19F7, mouse monoclonal | PMID:19013281 | Heintz Lab; Rockefeller University Cat# Htz-GFP-19C8; RRID:AB_2716737Heintz Lab; Rockefeller University Cat# Htz-GFP-19F7; RRID:AB_2716736 | For IP (25 µg each antibody for 1.2 mL lysate prepared from 8 to 10 animals) |
| Antibody | Anti-BrdU, mouse monoclonal [IIB5] | Abcam | Abcam Cat# ab8955; RRID:AB_306886 | For IP (5 µg per pooled RT reaction) |
| Software, algorithm | Zen Black | Zeiss | RRID:SCR_018163 | |
| Software, algorithm | Imaris | Oxford Instruments | RRID:SCR_007370 | |
| Software, algorithm | featureCounts | PMID:24227677 | RRID:SCR_012919 | |
| Software, algorithm | DESeq2, Bioconductor | PMID:25516281 | RRID:SCR_015687 | |
| Software, algorithm | CLIP Tool Kit (CTK) | PMID:27797762 | ||
| Software, algorithm | goseq,Bioconductor | PMID:20132535 | RRID:SCR_017052 | |
| Software, algorithm | RSeQC | PMID:22743226 | RRID:SCR_005275 | |
| Software, algorithm | GenomicRanges, Bioconductor | PMID:23950696 | RRID:SCR_000025 | |
| Software, algorithm | Limma, Bioconductor | PMID:25605792 | RRID:SCR_010943 | |
| Software, algorithm | fgsea,Bioconductor | Korotkevich et al., 2021 | RRID:SCR_020938 | |
| Software, algorithm | DEXSeq | PMID:22722343 | RRID:SCR_012823 | |
| Software, algorithm | rMATS | PMID:25480548 | ||
| Software, algorithm | HumanBase | Simons Foundation | RRID:SCR_016145 | |
| Commercial assay or kit | Quant-iT RiboGreen RNA Assay Kit | Thermo Fisher Scientific | Cat# R11490 | |
| Commercial assay or kit | High Pure RNA isolation kit | Roche | Cat# 11828665001 | |
| Commercial assay or kit | Dynabeads mRNA Purification Kit | Thermo Fisher Scientific | Cat# 61006 | |
| Commercial assay or kit | TruSeq RNA library prep kit | Illumina | Cat# RS-122-2001 | |
| Commercial assay or kit | RNAscope Multiplex Fluorescent Reagent Kit v2 | Advanced Cell Diagnostics | Cat# 323100 |
Additional files
-
Supplementary file 1
Tables used in this study.
(A) Dendrite-present mRNAs results of DESeq2 analysis. ‘Neuropil_vs_CB’ indicates results of CA1 neuropil/CA1 cell bodies TRAP comparison, ‘TRAP_vs_RNAseq’ indicates results of CA1 neuropil TRAP/CA1 neuropil RNAseq comparison. ‘CrePos_vs_CreNeg’ indicates results of Camk2a-Cre-positive CA1 neuropil TRAP/Camk2a-Cre-negative CA1 neuropil TRAP comparison. (B) Dendrite-enriched mRNAs results of DESeq2 analysis. ‘Neuropil_vs_CB’ indicates results of CA1 neuropil/CA1 cell bodies TRAP comparison, ‘TRAP_vs_RNAseq’ indicates results of CA1 neuropil TRAP/CA1 neuropil RNAseq comparison. ‘CrePos_vs_CreNeg’ indicates results of Camk2a-Cre-positive CA1 neuropil TRAP/Camk2a-Cre-negative CA1 neuropil TRAP comparison. (C) RNAscope probes used in this study. (D) DEXSeq analysis of differentially localized 3′UTR isoforms. Results of DEXSeq analysis comparing 3′UTR expression in CA1 neuropil and cell bodies TRAP is shown. APA event types are indicated (APA type), and the relative location (UTR type) of the 3′UTR-APA UTRs is indicated. Genomic coordinates for mm10 are given. (E) rMATs analysis of differentially localized AS events. Results of rMATs analysis comparing alternative splice events from CA1 neuropil vs. cell bodies TRAP. Results are organized by event type, and coordinates of the exons involved in the splice event are given. (F) RNABP KO data used for splicing analysis. Description of RNA-seq data used for analysis of RNABP KO data in mouse brain. (G) Compartment-specific FMRP-CLIP scores. All CA1-expressing genes with detectable FMRP binding in the CA1 cell bodies and dendrites were assigned a compartment-specific FMRP-CLIP score. (H) dendritic FMRP targets. (I) FMRP target functional clusters. Whole-cell FMRP targets were divided into functional clusters by the HumanBase software. Three clusters had >100 genes. The gene names for those clusters are shown here. (J) ASD SFARI genes functional clusters. Potential ASD genes (from SFARI) were divided into functional clusters by the HumanBase software. Four clusters had >100 genes. The gene names for those clusters are shown here. (K) DESeq2 analysis for FMRP KO vs. WT TRAP. Results of DESeq2 analysis. ‘Localization’ indicates results of CA1 neuropil/CA1 cell bodies TRAP, FMRP KO/WT comparison, ‘CB_only’ indicates results of CA1 cell bodies TRAP only, FMRP KO/WT. ‘Neuropil_only’ indicates results of CA1 neuropil TRAP only, FMRP KO/WT comparison.
- https://cdn.elifesciences.org/articles/71892/elife-71892-supp1-v2.xlsx
-
Transparent reporting form
- https://cdn.elifesciences.org/articles/71892/elife-71892-transrepform1-v2.docx
Download links
A two-part list of links to download the article, or parts of the article, in various formats.
Downloads (link to download the article as PDF)
Open citations (links to open the citations from this article in various online reference manager services)
Cite this article (links to download the citations from this article in formats compatible with various reference manager tools)
FMRP regulates mRNAs encoding distinct functions in the cell body and dendrites of CA1 pyramidal neurons
eLife 10:e71892.
https://doi.org/10.7554/eLife.71892


