Inflammasome activation leads to cDC1-independent cross-priming of CD8 T cells by epithelial cell-derived antigen
- Division of Immunology and Pathogenesis, Department of Molecular and Cell Biology, University of California, Berkeley, United States
- Department of Molecular Microbiology and Immunology, Oregon Health and Science University, United States
- Cancer Research Laboratory, University of California, Berkeley, United States
- Howard Hughes Medical Institute, University of California, Berkeley, United States
Figures
Figure 1

Genetic OvaFla VillinER-CreT2 system results in NAIP–NLRC4 activation in intestinal epithelial cells (IECs) of mice upon tamoxifen chow administration.
(A) Schematic of the OvaFla gene cassette in the Rosa26 locus. The cassette contains full-length mature (non-secreted) ovalbumin fused to the C-terminal 166 amino acids of flagellin, and an IRES-GFP. When OvaFla mice are crossed to mice containing the tamoxifen-inducible Villin-ER-CreT2, tamoxifen administration results in Cre-controlled excision of the stop cassette and expression of the OvaFla fusion protein and GFP within IECs. (B) Daily weight (top) and rectal temperature (bottom) measurements of OvaFla mice during a 2-day course of tamoxifen chow (depicted as red bar). (C) Quantification of IL-18 ELISA performed on serum from the mice shown in panel B at day 2 post tamoxifen chow start. Each dot represents an individual mouse. (D) Daily weight (top) and rectal temperature (bottom) measurements of OvaFla mice following a single day pulse of tamoxifen chow (depicted as red bar). (E) Quantification of IL-18 ELISA performed on serum from the mice shown in panel D at day 5 post tamoxifen chow start. (B–E) Data shown as mean ± SD and are from a single representative experiment. Each dot represents an individual mouse. Significance calculated using one-way ANOVA and Tukey’s multiple comparisons test (*p < 0.05, **p < 0.01, ***p < 0.001). See Figure 1—source data 1 for exact p values.
-
Figure 1—source data 1
Statistical data and individual data points for Figure 1.
- https://cdn.elifesciences.org/articles/72082/elife-72082-fig1-data1-v2.xlsx
Figure 2
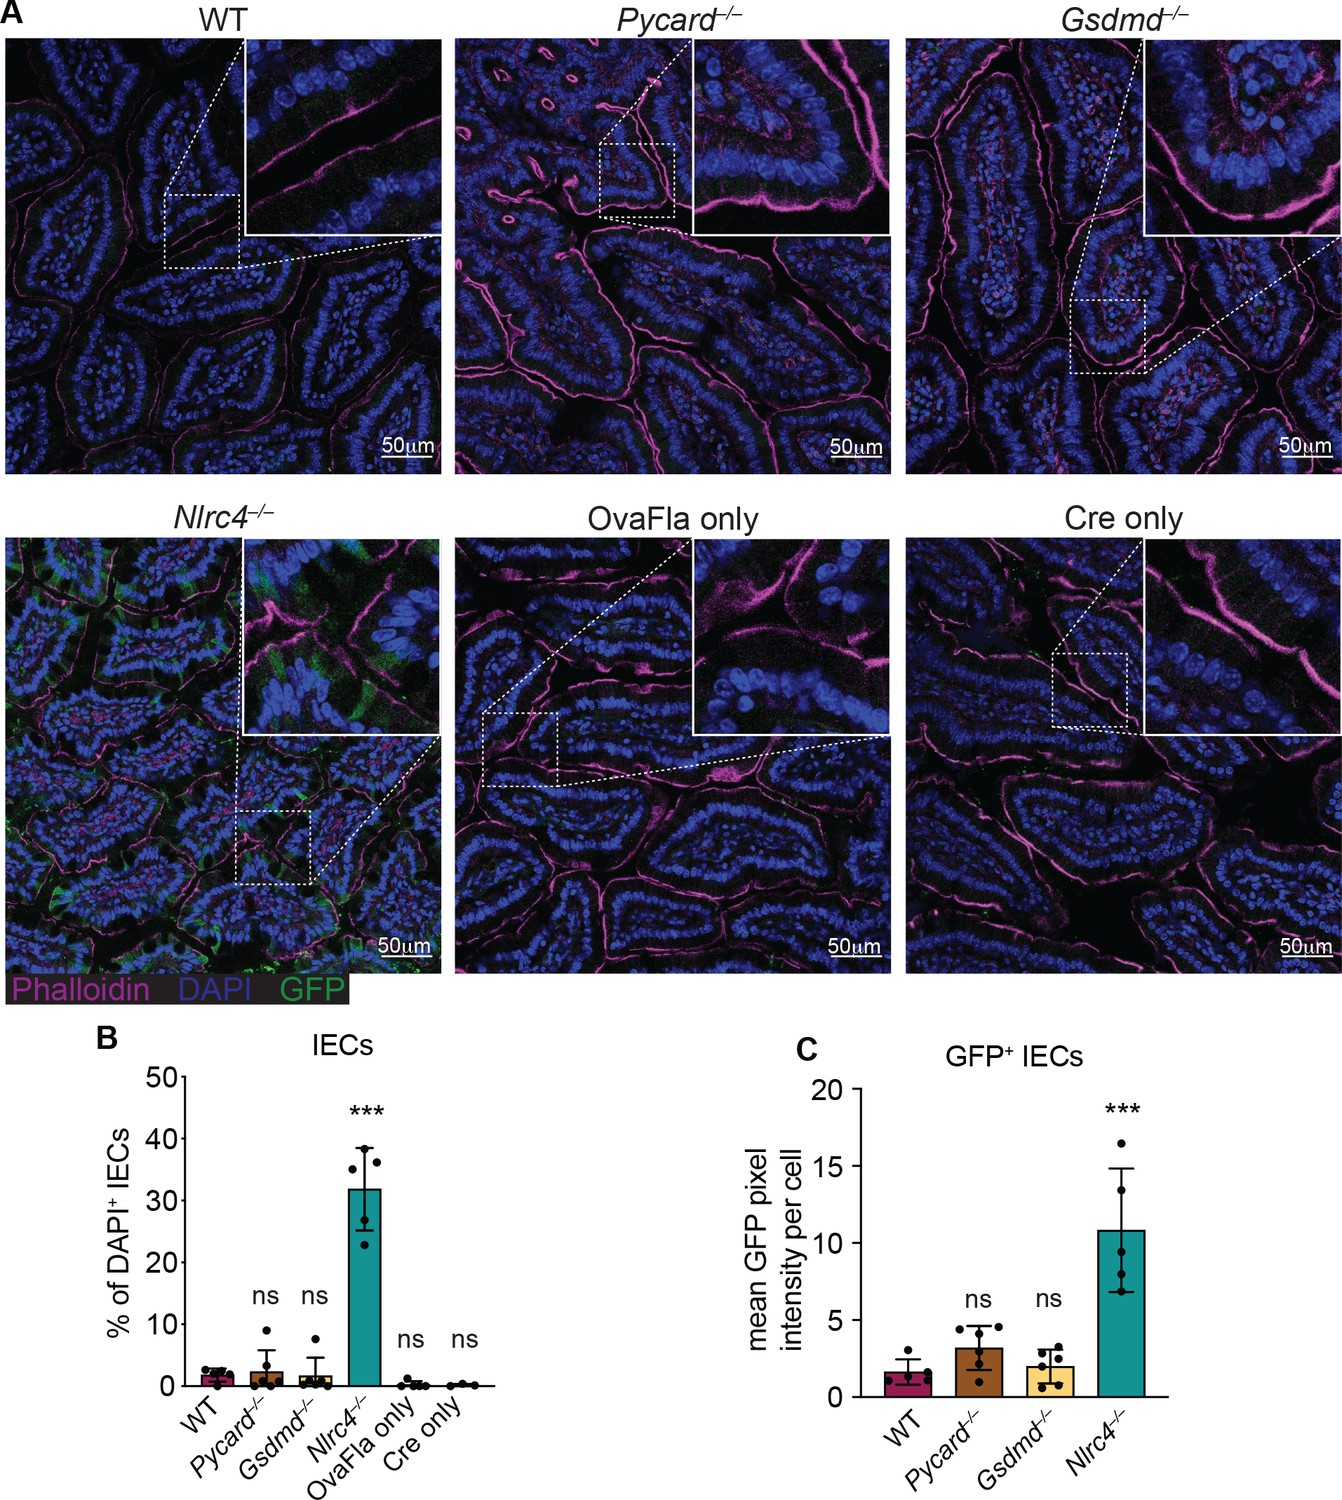
GFP+ cells accumulate in Nlrc4–/– OvaFla mice following tamoxifen administration.
(A) Representative immunofluorescence images of the small intestines of indicated OvaFla mice on day 2 following a single day pulse of tamoxifen chow. (B) Quantification of DAPI+ IECs that are also GFP+ for each OvaFla line. Approximately 100 cells from least 15 separate villi across four to five images were counted per mouse. (C) Quantification of mean GFP pixel intensity for GFP+ intestinal epithelial cells (IECs) in each OvaFla line. Data represent an averaged value from 12 to 20 cells per image across four to five images per mouse. (B–C) Data are pooled from two biological replicates, and each dot represents an individual mouse. Data shown as mean ± SD. Significance calculated using one-way ANOVA and Tukey’s multiple comparisons test (*p < 0.05, **p < 0.01, ***p < 0.001). Only p values between wild-type (WT) and other experimental groups are shown. See Figure 2—source data 1 for exact p values.
-
Figure 2—source data 1
Statistical data for Figure 2.
- https://cdn.elifesciences.org/articles/72082/elife-72082-fig2-data1-v2.xlsx
Figure 3 with 1 supplement
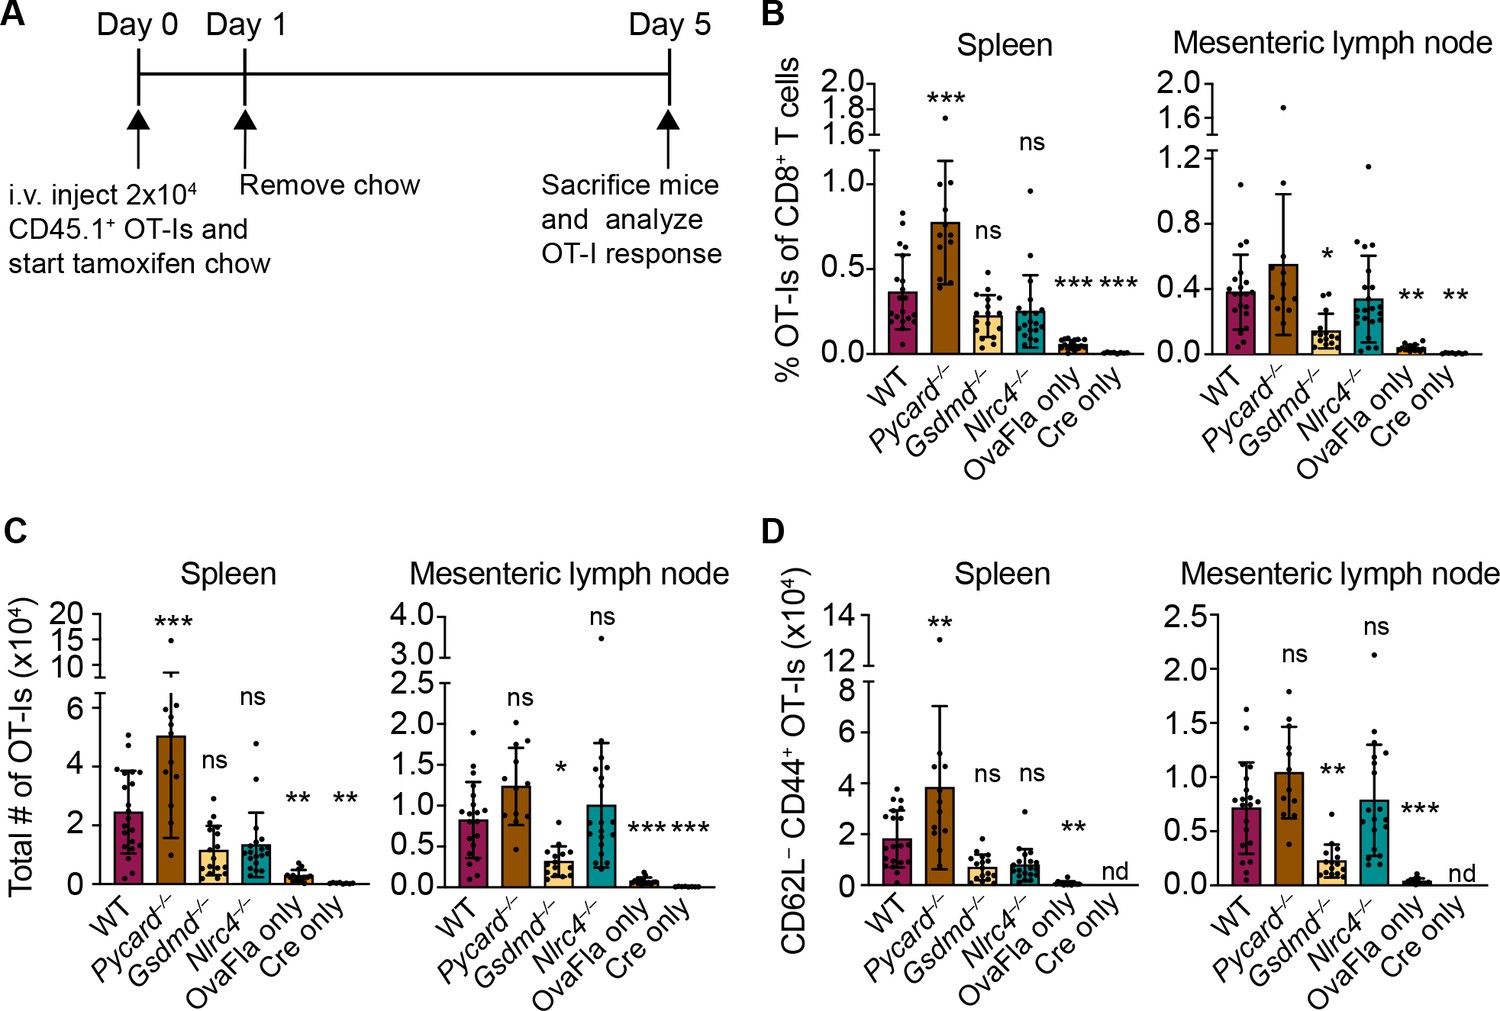
OvaFla expression in intestinal epithelial cells (IECs) results in OT-I proliferation and activation that is independent of ASC and NLRC4 but partially dependent on gasdermin D.
(A) Overview of experimental setup for analyzing OT-I responses to OvaFla production in IECs. (B) Quantification of OT-Is as a percent of total CD8+ T cells per spleen (left) and mesenteric lymph node (right). (C) Total number of OT-Is per spleen (left) and mesenteric lymph node (right). (D) Total number of CD62L–CD44+ OT-Is per spleen (left) and mesenteric lymph node (right). Samples with fewer than 20 OT-Is were excluded from CD62L, CD44 calculations. Tissues were harvested and analyzed at day 5 post tamoxifen chow start. Data are pooled from three biological replicates, and each dot represents an individual mouse. Data shown as mean ± SD. Significance calculated using one-way ANOVA and Tukey’s multiple comparisons test (*p < 0.05, **p < 0.01, ***p < 0.001). Only p values between wild-type (WT) and other experimental groups are shown. See Figure 3—source data 1 for exact p values.
-
Figure 3—source data 1
Statistical data for Figure 3.
- https://cdn.elifesciences.org/articles/72082/elife-72082-fig3-data1-v2.xlsx
Figure 3—figure supplement 1
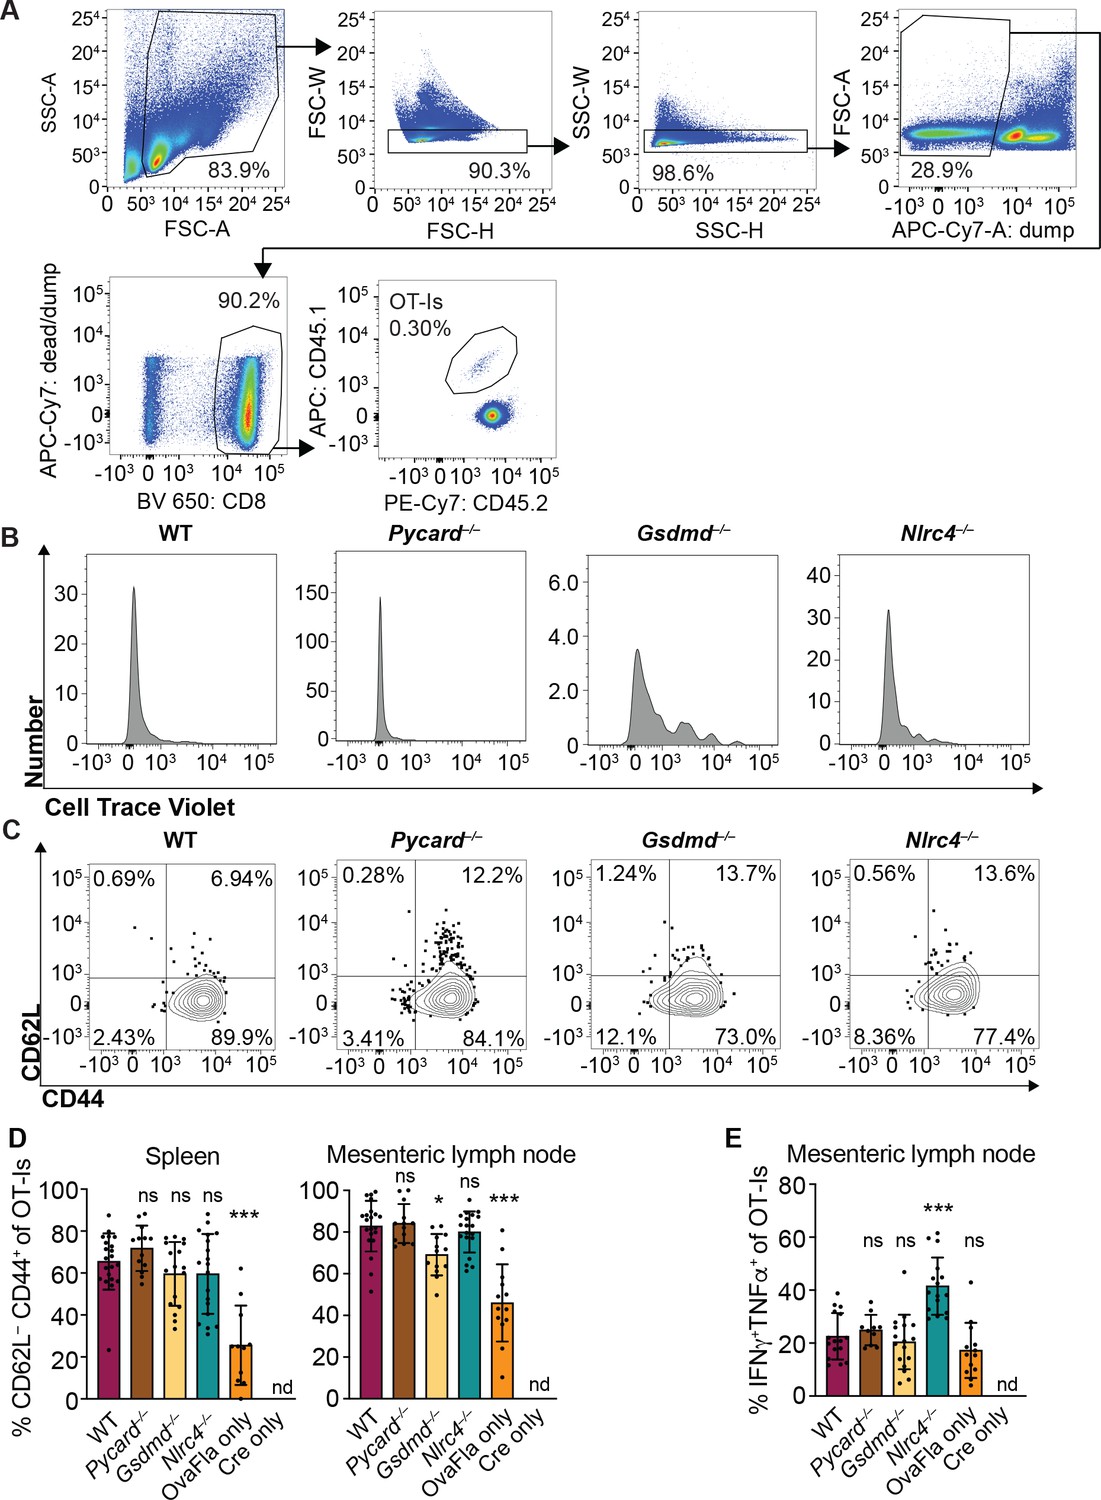
OvaFla expression in intestinal epithelial cells (IECs) results in OT-I proliferation and activation that is independent of ASC and NLRC4 but partially dependent on gasdermin D.
(A) Flow cytometry gating strategy for identifying OT-I T cells. (B) Representative histograms of CellTrace Violet dilution for each of the OvaFla mouse lines. (C) Representative dot plots of each OvaFla mouse line showing the gating strategy for identifying CD62L–CD44+ OT-Is. (D) Percent of OT-Is that are CD62L–CD44+ per spleen (left) and mesenteric lymph node (right). (E) Percent of OT-Is from the mesenteric lymph node that are IFNγ+TNFα+ following a 5 hr ex vivo stimulation with phorbol myristate acetate (PMA) (1 μg/mL) and ionomycin (1 μg/mL). (D–E) Data are from three independent experiments, and each dot represents an individual mouse. Tissues were harvested and analyzed at day 5 post tamoxifen chow start. Samples with fewer than 20 OT-Is were excluded from CD62L, CD44, and cytokine calculations. Data shown as mean ± SD. Significance calculated using one-way ANOVA and Tukey’s multiple comparisons test (*p < 0.05, **p < 0.01, ***p < 0.001). Only p values between wild-type (WT) and other experimental groups are shown. See Figure 3—figure supplement 1—source data 1 for exact p values.
-
Figure 3—figure supplement 1—source data 1
Statistical data for Figure 3—figure supplement 1.
- https://cdn.elifesciences.org/articles/72082/elife-72082-fig3-figsupp1-data1-v2.xlsx
Figure 4 with 2 supplements
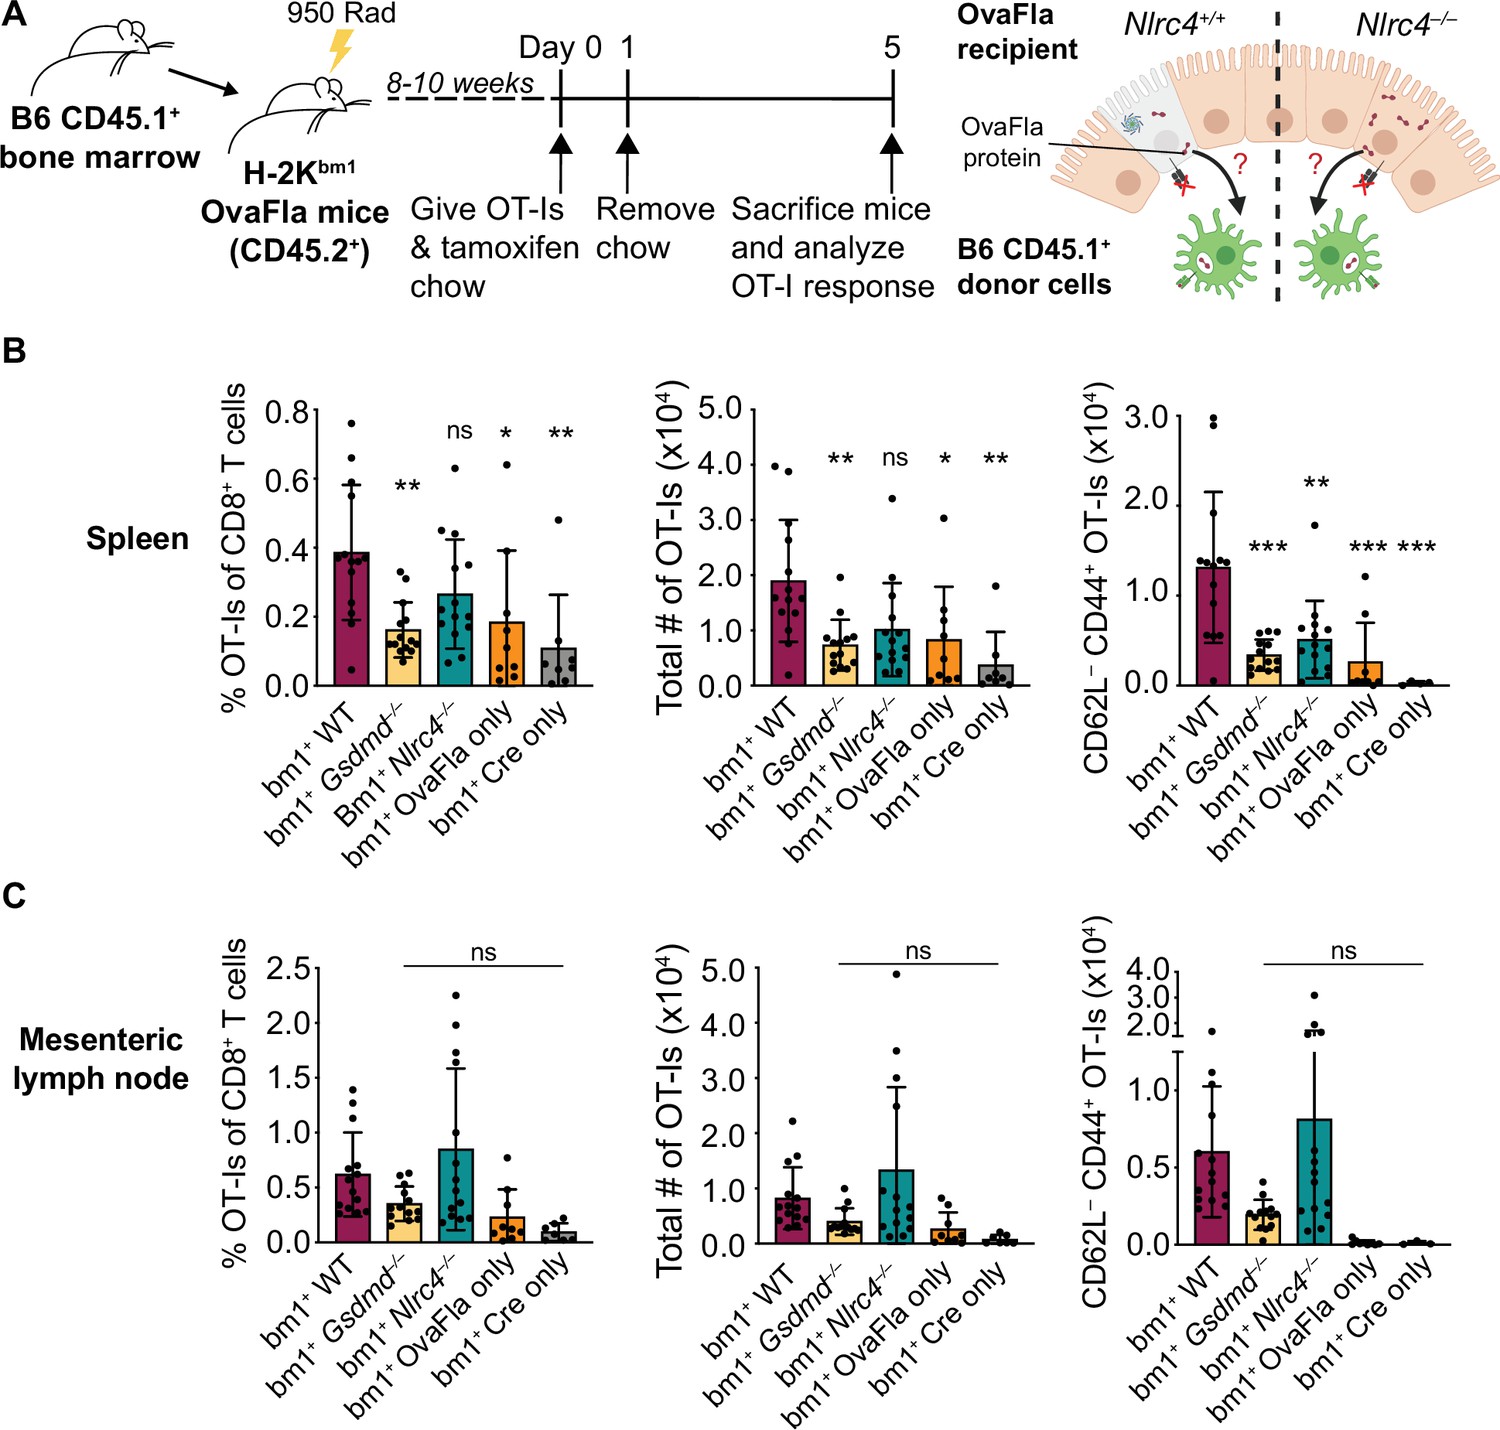
OvaFla expression in intestinal epithelial cells (IECs) results in OT-I cross-priming that is independent of NLRC4 but partially dependent on gasdermin D.
(A) Schematic depicting the production and analysis workflow of chimeric bm1+OvaFla mice (left). At the right, an illustration of either wild-type (WT) OvaFla mice (left of the dashed line) or Nlrc4–/– OvaFla mice (right of the dashed line) following lethal irradiation and reconstitution with bone marrow from B6.SJL mice. (B) Quantification of OT-Is as a percent of total CD8+ T cells (left), the total number of OT-Is (middle), and the total number of CD62L–CD44+ OT-Is (right) in the spleen. (C) Quantification of OT-Is as a percent of total CD8+ T cells (left), the total number of OT-Is (middle), and the total number of CD62L–CD44+ OT-Is (right) in the mesenteric lymph nodes. Tissues were harvested and analyzed at day 5 post tamoxifen chow start. (B–C) Data are pooled from three biological replicates, and each dot represents an individual mouse. Data shown as mean ± SD. Significance calculated using one-way ANOVA and Tukey’s multiple comparisons test (*p < 0.05, **p < 0.01, ***p < 0.001). Only p values between WT and other experimental groups are shown. See Figure 4—source data 1 for exact p values.
-
Figure 4—source data 1
Statistical data for Figure 4.
- https://cdn.elifesciences.org/articles/72082/elife-72082-fig4-data1-v2.xlsx
Figure 4—figure supplement 1
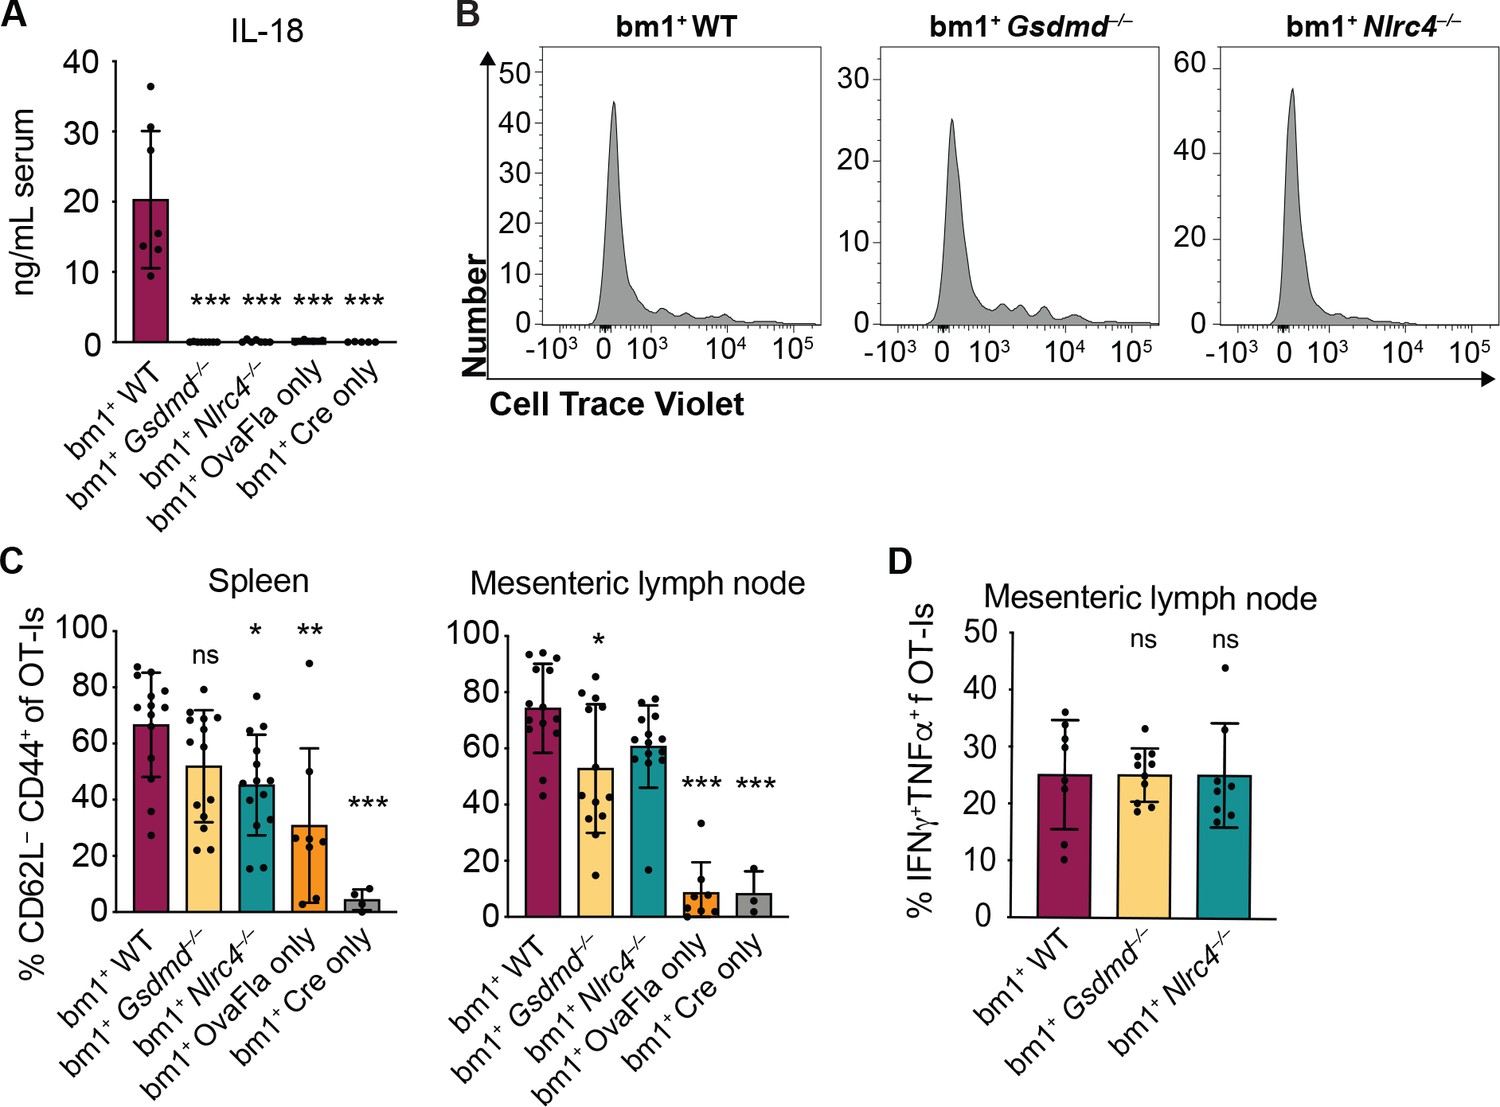
OvaFla expression in intestinal epithelial cells (IECs) of bm1+OvaFla mice results in NAIP–NLRC4 expression and OT-I cross-priming that is independent of NLRC4 but partially dependent on gasdermin D.
(A) Quantification of IL-18 ELISA performed on serum from the mice shown in Figure 4 at day 5 post tamoxifen chow start. (B) Representative histograms of CellTrace Violet dilution for the indicated OvaFla mouse lines. (C) Percent of OT-Is that are CD62L–CD44+ in the spleen (left) and mesenteric lymph nodes (right) of the mice shown in Figure 4. (D) Percent of OT-Is from the mesenteric lymph nodes of the mice in Figure 4 that are IFNγ+TNFα+ following a 5 hr ex vivo stimulation with phorbol myristate acetate (PMA) (1 μg/mL) and ionomycin (1 μg/mL). Tissues were harvested and analyzed at day 5 post tamoxifen chow start. Samples with fewer than 20 OT-Is were excluded from CD62L, CD44, and cytokine calculations. (A) Data are pooled from two biological replicates. (C) Data are pooled from three biological replicates. Each dot represents an individual mouse. Data shown as mean ± SD. Significance calculated using one-way ANOVA and Tukey’s multiple comparisons test (*p < 0.05, **p < 0.01, ***p < 0.001). Only p values between wild-type (WT) and other experimental groups are shown. See Figure 4—figure supplement 1—source data 1 for exact p values.
-
Figure 4—figure supplement 1—source data 1
Statistical data for Figure 4—figure supplement 1.
- https://cdn.elifesciences.org/articles/72082/elife-72082-fig4-figsupp1-data1-v2.xlsx
Figure 4—figure supplement 2
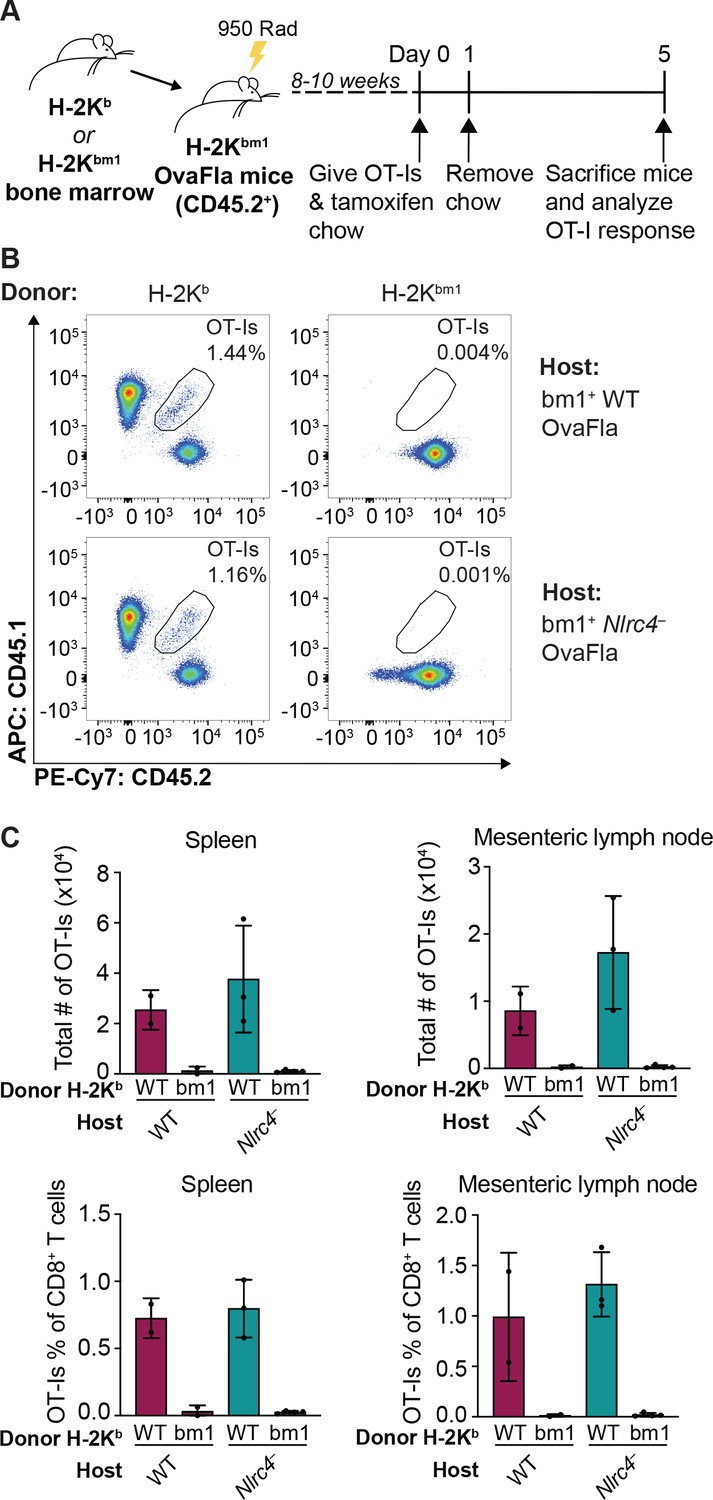
Kb donor bone marrow is required for OT-I proliferation and activation in bm1+ OvaFla bone marrow chimeras.
(A) Schematic depicting the production and analysis workflow of chimeric bm1+OvaFla mice that were given either B6 H-2Kb or H-2Kbm1 bone marrow. (B) Representative flow plots demonstrating the absence of OT-Is in the mice given H-2Kbm1 bone marrow, as depicted in A. (C) Quantification of the total number of OT-Is (top) and the OT-Is as a percent of total CD8+ T cells (bottom) in the spleen (left) and mesenteric lymph nodes (right) of bm1+ wild-type (WT) and bm1+ Nlrc4– OvaFla mice as depicted in A. Data are from a single experiment, and each dot represents an individual mouse. Data shown in C as mean ± SD.
Figure 5 with 4 supplements
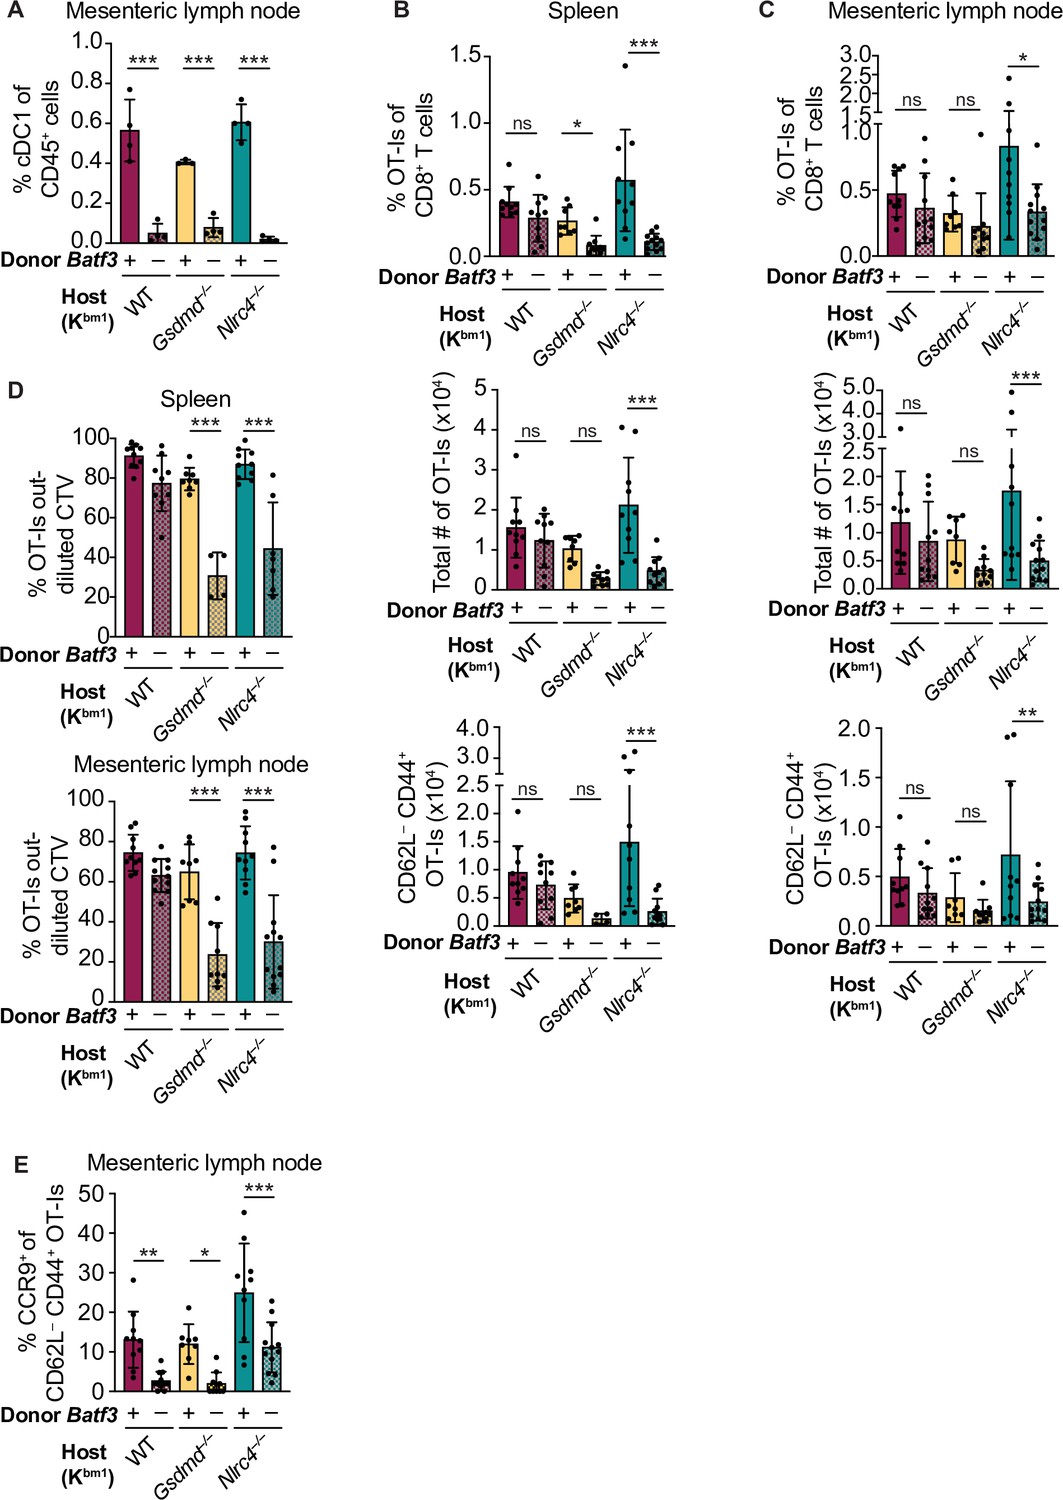
Cross-priming of OT-Is is independent of Batf3+ cDC1s following NAIP–NLRC4 activation in intestinal epithelial cells (IECs).
(A) Percent of CD45+ cells that are conventional type one dendritic cells (cDC1s) in bm1 chimera mice that received either Batf3+ or Batf3– donor bone marrow. (B) Quantification of OT-Is as a percent of total CD8+ T cells (top), the total number of OT-Is (middle), and the total number of CD62L–CD44+ OT-Is (bottom) in the spleen. (C) Quantification of OT-Is as a percent of total CD8+ T cells (top), the total number of OT-Is (middle), and the total number of CD62L–CD44+ OT-Is (bottom) in the mesenteric lymph nodes. (D) Quantification of OT-Is that have out-diluted the CellTrace Violet dye in the spleen (top) and mesenteric lymph nodes (bottom). (E) Percent of CD62L–CD44+ OT-Is in the mesenteric lymph node that are CCR9+. Tissues were harvested and analyzed at day 5 post tamoxifen chow start. Samples with fewer than 20 OT-Is were excluded from CD62L, CD44, and CCR9 calculations. (A) Data are from a single experiment. (B–D) Data are pooled from three biological replicates. (E) Data are pooled from two biological replicates. Each dot represents an individual mouse. Data shown as mean ± SD. Significance calculated using one-way ANOVA and Šídák’s multiple comparisons test (*p < 0.05, **p < 0.01, ***p < 0.001). See Figure 5—source data 1 for exact p values.
-
Figure 5—source data 1
Statistical data for Figure 5.
- https://cdn.elifesciences.org/articles/72082/elife-72082-fig5-data1-v2.xlsx
Figure 5—figure supplement 1
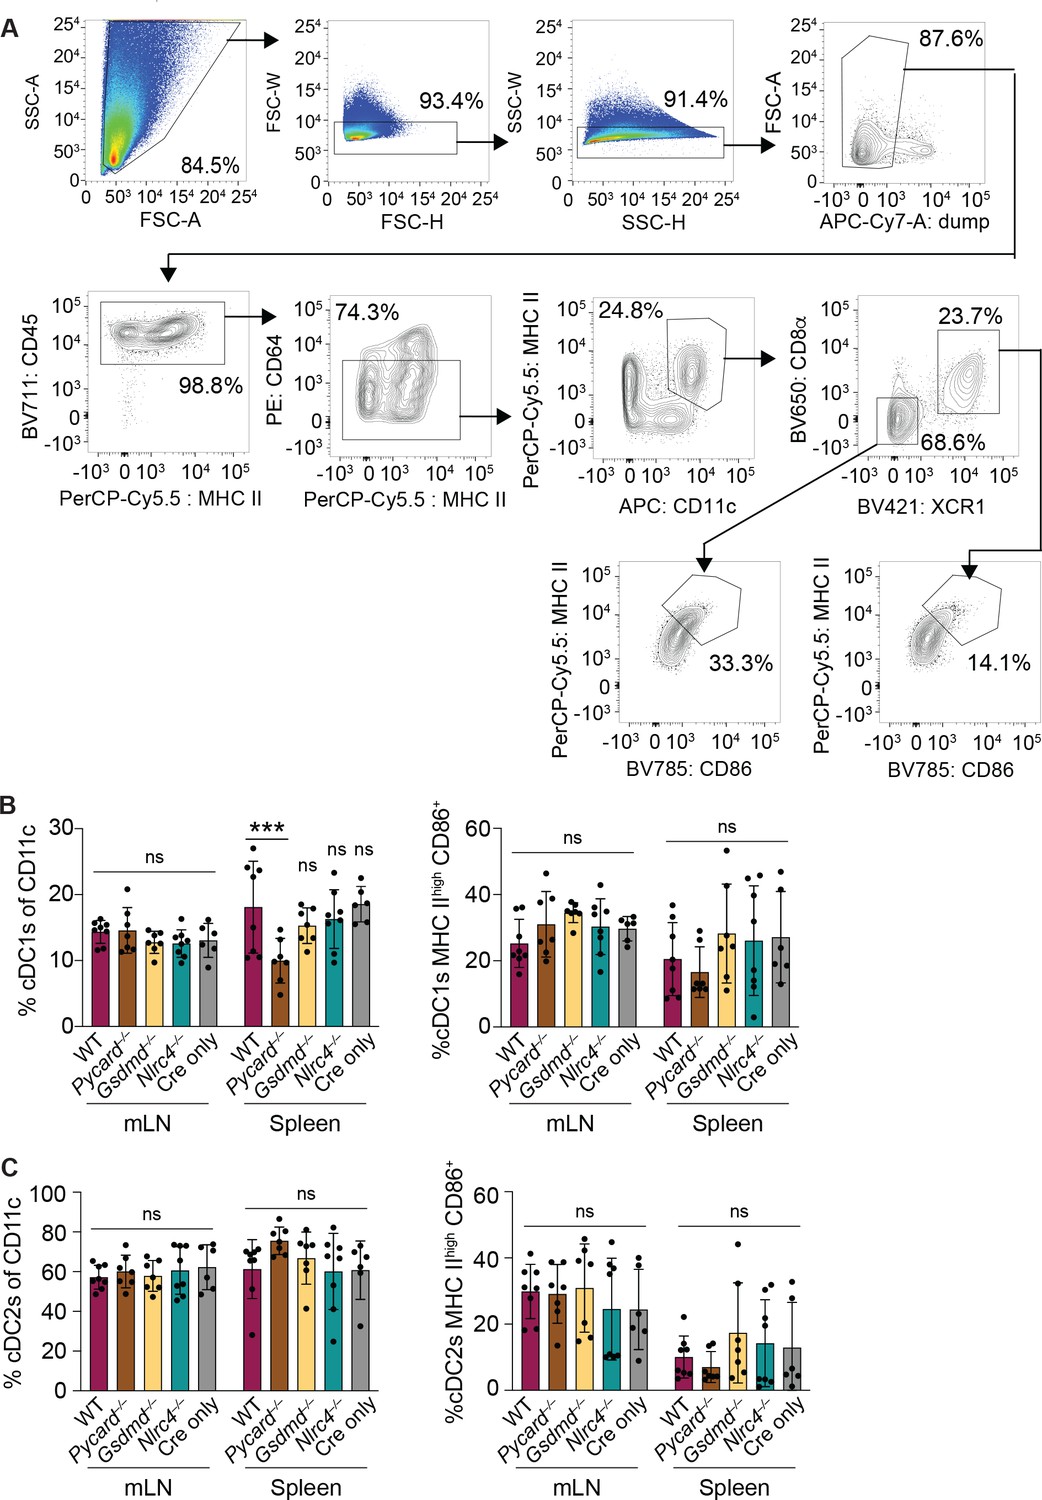
NAIP–NLRC4 activation in intestinal epithelial cells (IECs) does not lead to an increase in relative numbers of cDCs or an increase in their maturation state in the mesenteric lymph nodes or spleen.
(A) Flow cytometry gating strategy for identifying conventional type one dendritic cells (cDC1s) and cDC2s. (B) Relative numbers (left) and percent of MHC IIhigh CD86+ (right) cDC1s in the mesenteric lymph nodes and spleen 3 days post the start of tamoxifen chow. (C) Relative numbers (left) and percent of MHC IIhigh CD86+ (right) cDC2s in the mesenteric lymph nodes and spleen 3 days post the start of tamoxifen chow. See Figure 5—figure supplement 1—source data 1 for exact p values.
-
Figure 5—figure supplement 1—source data 1
Statistical data for Figure 5—figure supplement 1.
- https://cdn.elifesciences.org/articles/72082/elife-72082-fig5-figsupp1-data1-v2.xlsx
Figure 5—figure supplement 2
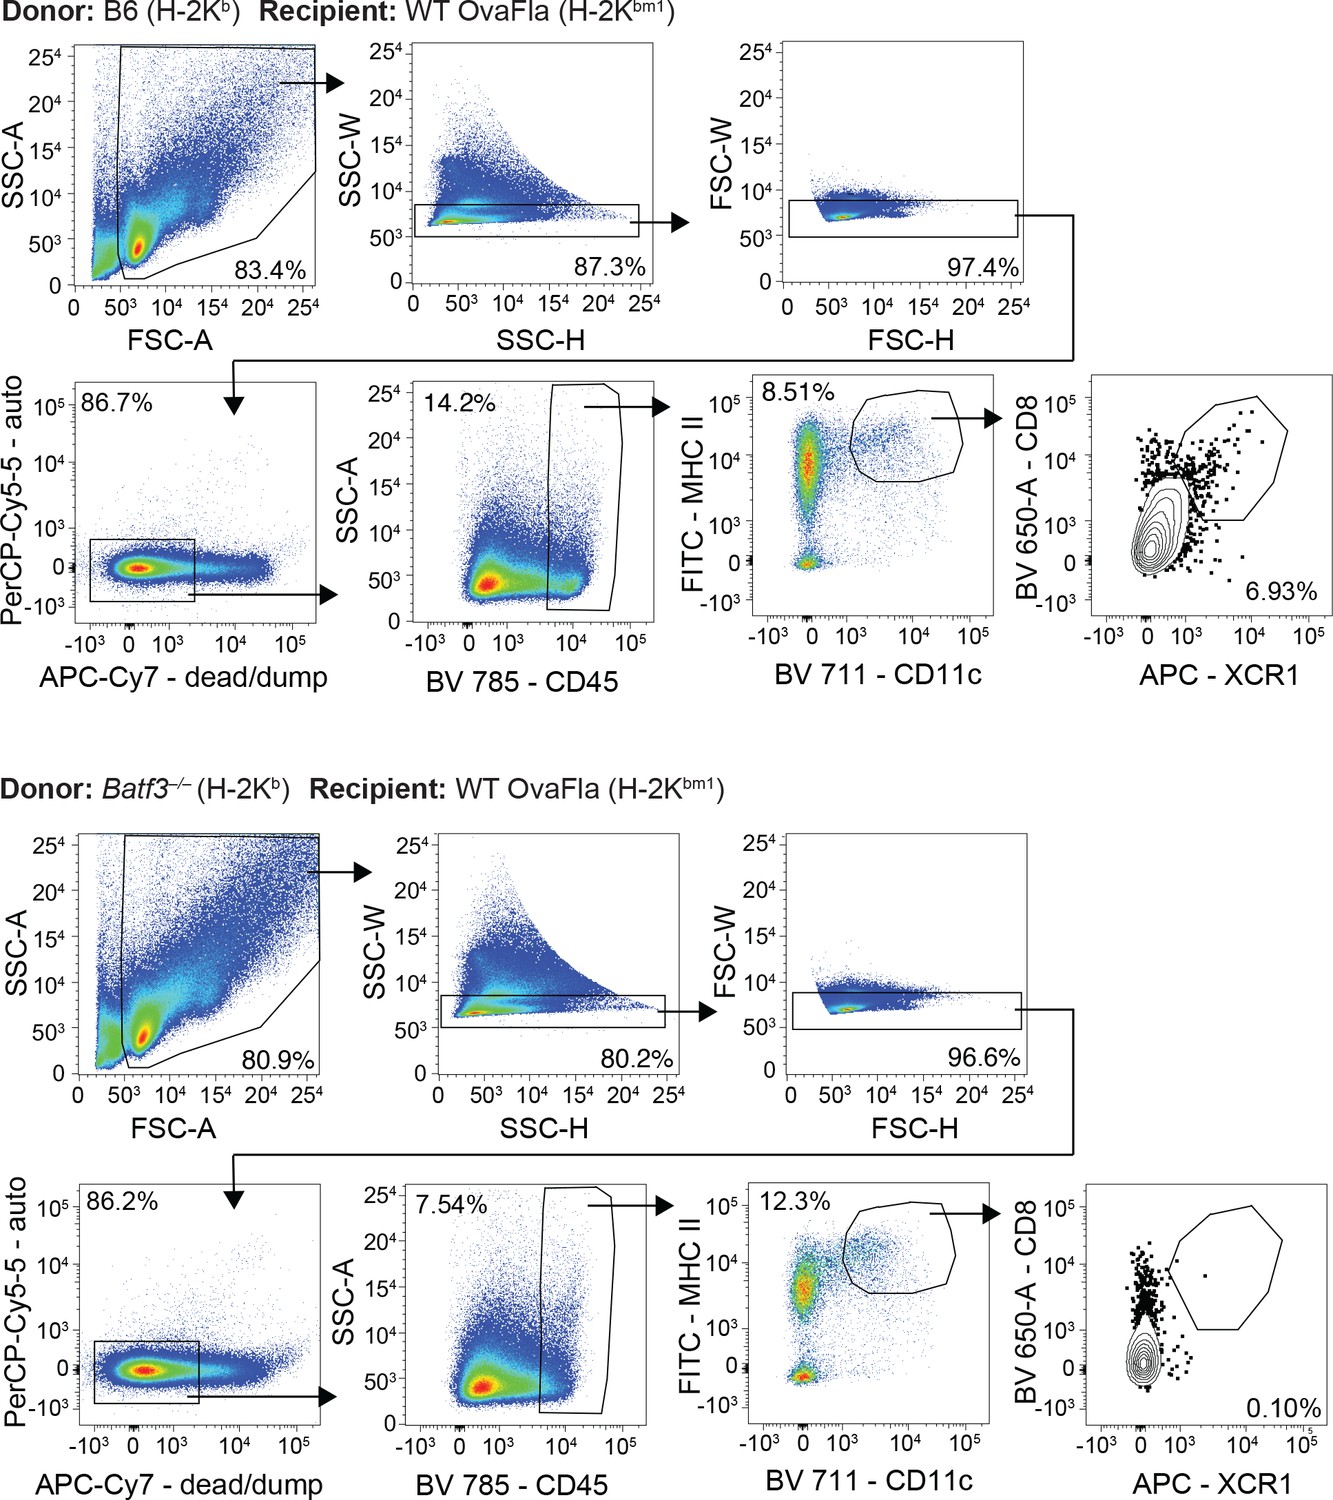
Gating demonstration for Figure 5A.
Representative dot plots from one bm1+ wild-type (WT) OvaFla mouse that received B6 bone marrow (top) and one bm1+ WT OvaFla mouse that received batf3–/– bone marrow (bottom).
Figure 5—figure supplement 3
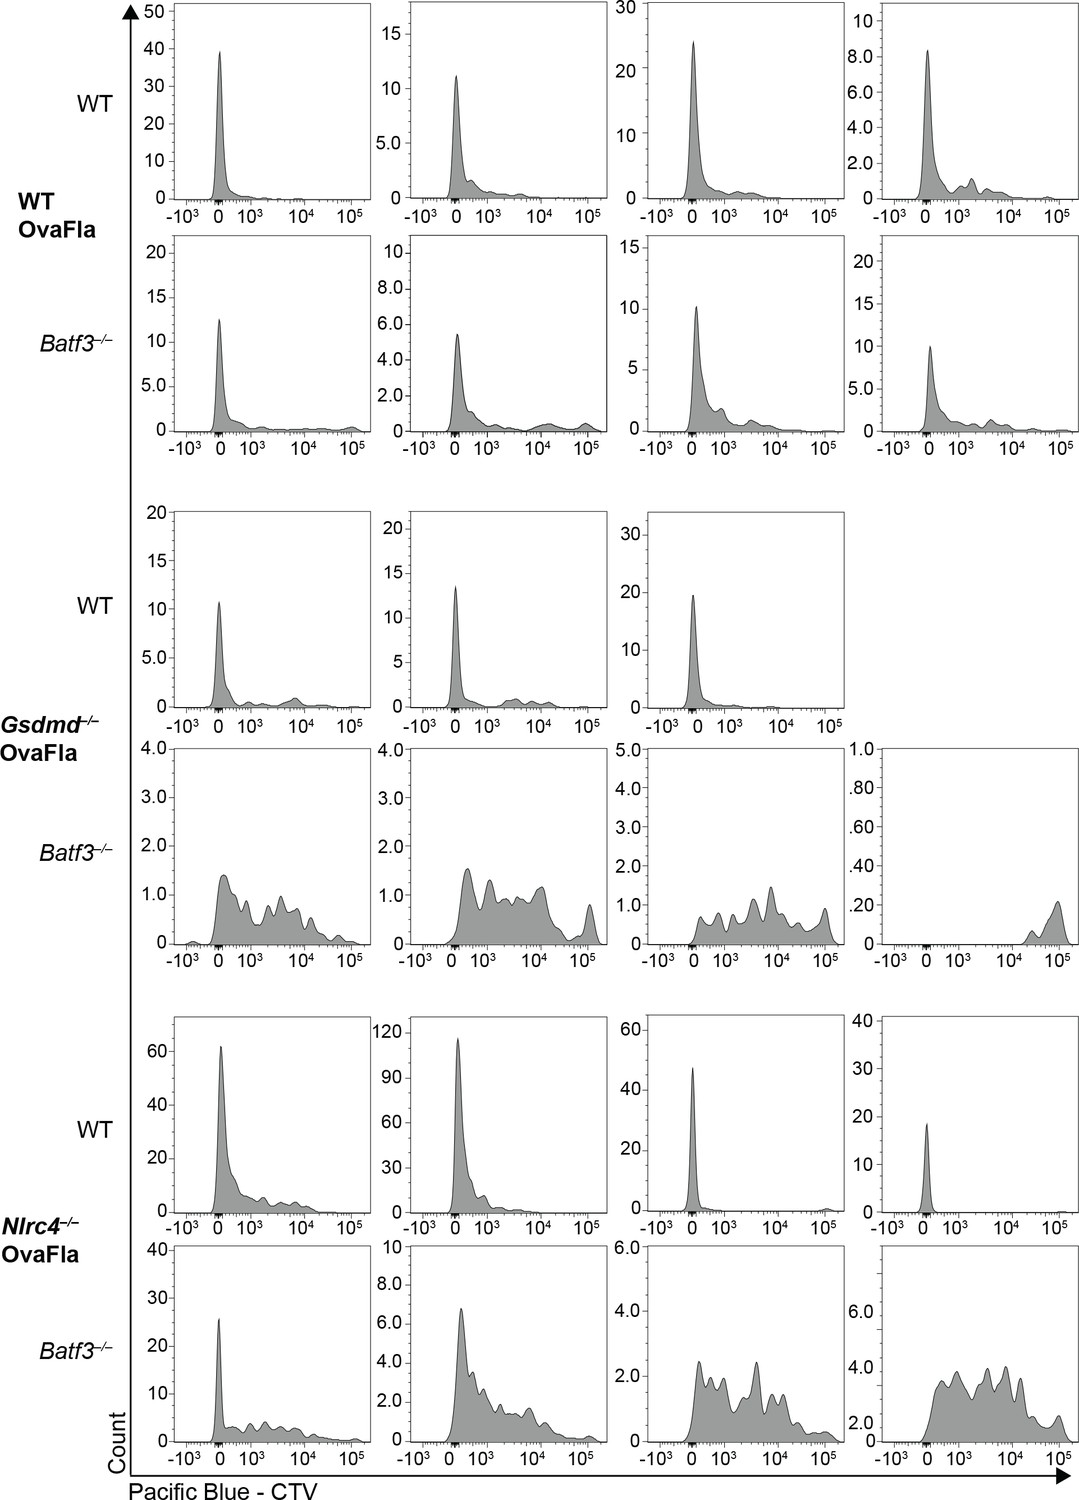
Representative histograms demonstrating the dilution of CellTrace Violet dye of OT-Is from individual mice shown in Figure 5D.
OT-Is are gated per Figure 3—figure supplement 1.
Figure 5—figure supplement 4
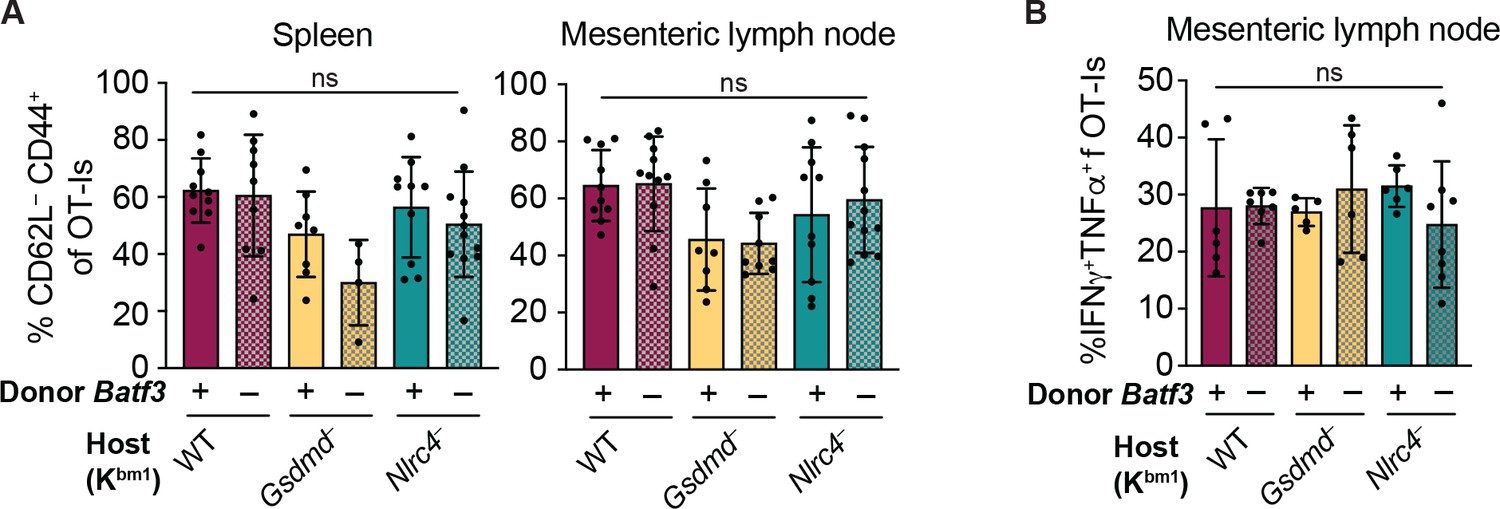
No difference in the percent of CD62L–CD444+ OT-I T cells or in the TNFα and IFNγ production between genotypes of bm1+ OvaFla mice.
(A) Percent of OT-Is that are CD62L– CD44+ in the spleen (left) and mesenteric lymph nodes (right). (B) Percent of OT-Is from the mesenteric lymph node that are IFNγ+TNFα+ following a 5 hr ex vivo stimulation with phorbol myristate acetate (PMA) (1 μg/mL) and ionomycin (1 μg/mL). Tissues were harvested and analyzed at day 5 post tamoxifen chow start. Samples with fewer than 20 OT-Is were excluded from CD62L, CD44, and cytokine calculations. (A) Data are pooled from three biological replicates. (B) Data are pooled from two biological replicates. Each dot represents an individual mouse. Data shown as mean ± SD. Significance calculated using one-way ANOVA and Šídák’s multiple comparisons test (*p < 0.05, **p < 0.01, ***p < 0.001). See Figure 5—figure supplement 4—source data 1 for exact p values.
-
Figure 5—figure supplement 4—source data 1
Statistical data for Figure 5—figure supplement 4.
- https://cdn.elifesciences.org/articles/72082/elife-72082-fig5-figsupp4-data1-v2.xlsx
Figure 6 with 2 supplements

Cross-presentation of intestinal epithelial cell (IEC)-derived antigen is dependent on cDCs.
(A) Quantification of OT-Is as a percent of total CD8+ T cells (top) and the total number of OT-Is (bottom) in the spleen. (B) Quantification of OT-Is as a percent of total CD8+ T cells (top) and the total number of OT-Is (bottom) in the mesenteric lymph nodes. All mice were given two doses of diphtheria toxin (DT) (see Materials and methods), and tissues were harvested and analyzed at day 5 post tamoxifen chow start. Data are pooled from two biological replicates. Data shown as mean ± SD. Significance calculated using one-way ANOVA and Šídák’s multiple comparisons test (*p < 0.05, **p < 0.01, ***p < 0.001). See Figure 6—source data 1 for exact p values.
-
Figure 6—source data 1
Statistical data for Figure 5.
- https://cdn.elifesciences.org/articles/72082/elife-72082-fig6-data1-v2.xlsx
Figure 6—figure supplement 1
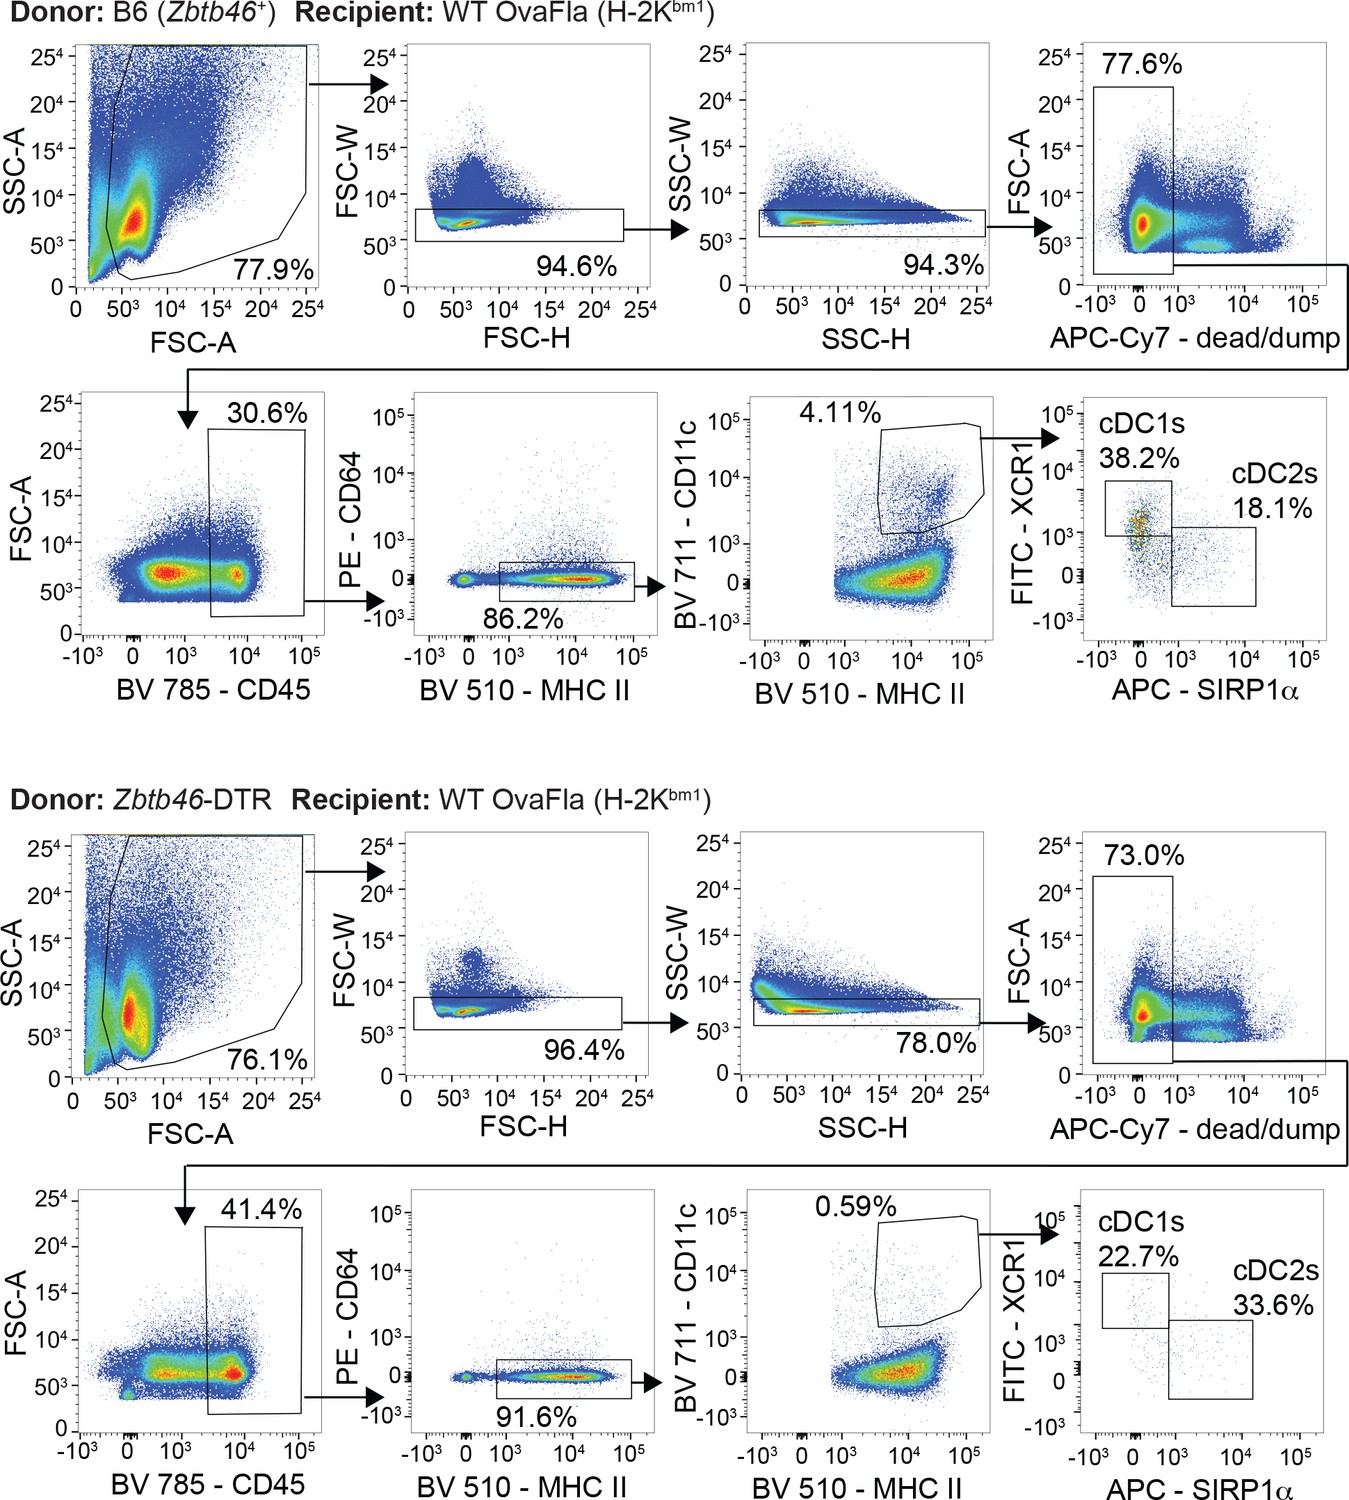
Gating strategy to identify conventional type one dendritic cells (cDC1s) and cDC2s in chimeric bm1+ OvaFla mice that received bone marrow from either B6 mice (top) or Zbtb46–DTR mice (bottom).
Figure 6—figure supplement 2

Injection of diphtheria toxin (DT) results in the depletion of conventional type one dendritic cells (cDC1s) and cDC2s from chimeric bm1+ OvaFla mice given Zbtb46–DTR bone marrow.
Percent of CD45+ cells in the mesenteric lymph node that are cDC1 (left) or cDC2 (right) from two separate experiments. See Figure 6—figure supplement 2—source data 1 for exact p values.
-
Figure 6—figure supplement 2—source data 1
Statistical data for Figure 6—figure supplement 2.
- https://cdn.elifesciences.org/articles/72082/elife-72082-fig6-figsupp2-data1-v2.xlsx
Author response image 1
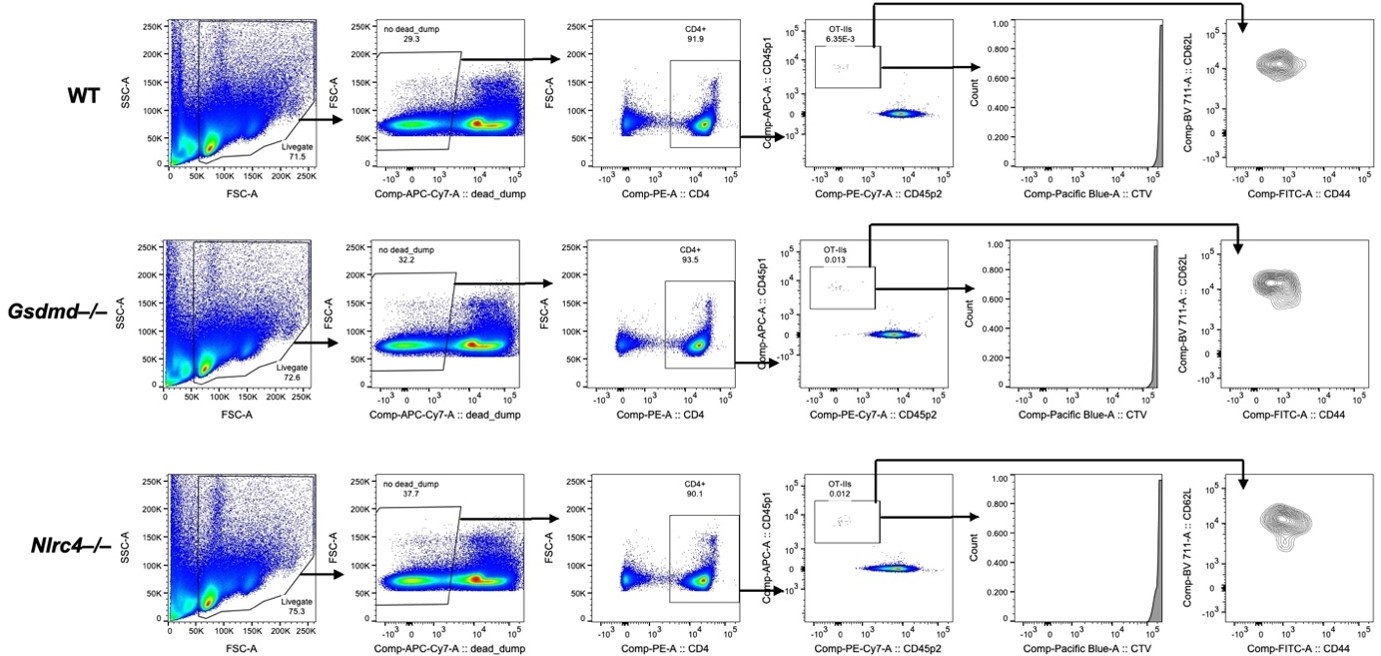
Adoptively transferred OT-II T cells fail to proliferate or become CD62L–CD44+ in OvaFla mice by day five post tamoxifen chow pulse.
Shown are representative flow plots demonstrating the gating strategy for identifying OT-Iis in the mesenteric lymph nodes of WT (top), Gsdmd–/– (middle), or Nlrc4–/– (bottom) OvaFla mice.
Author response image 2
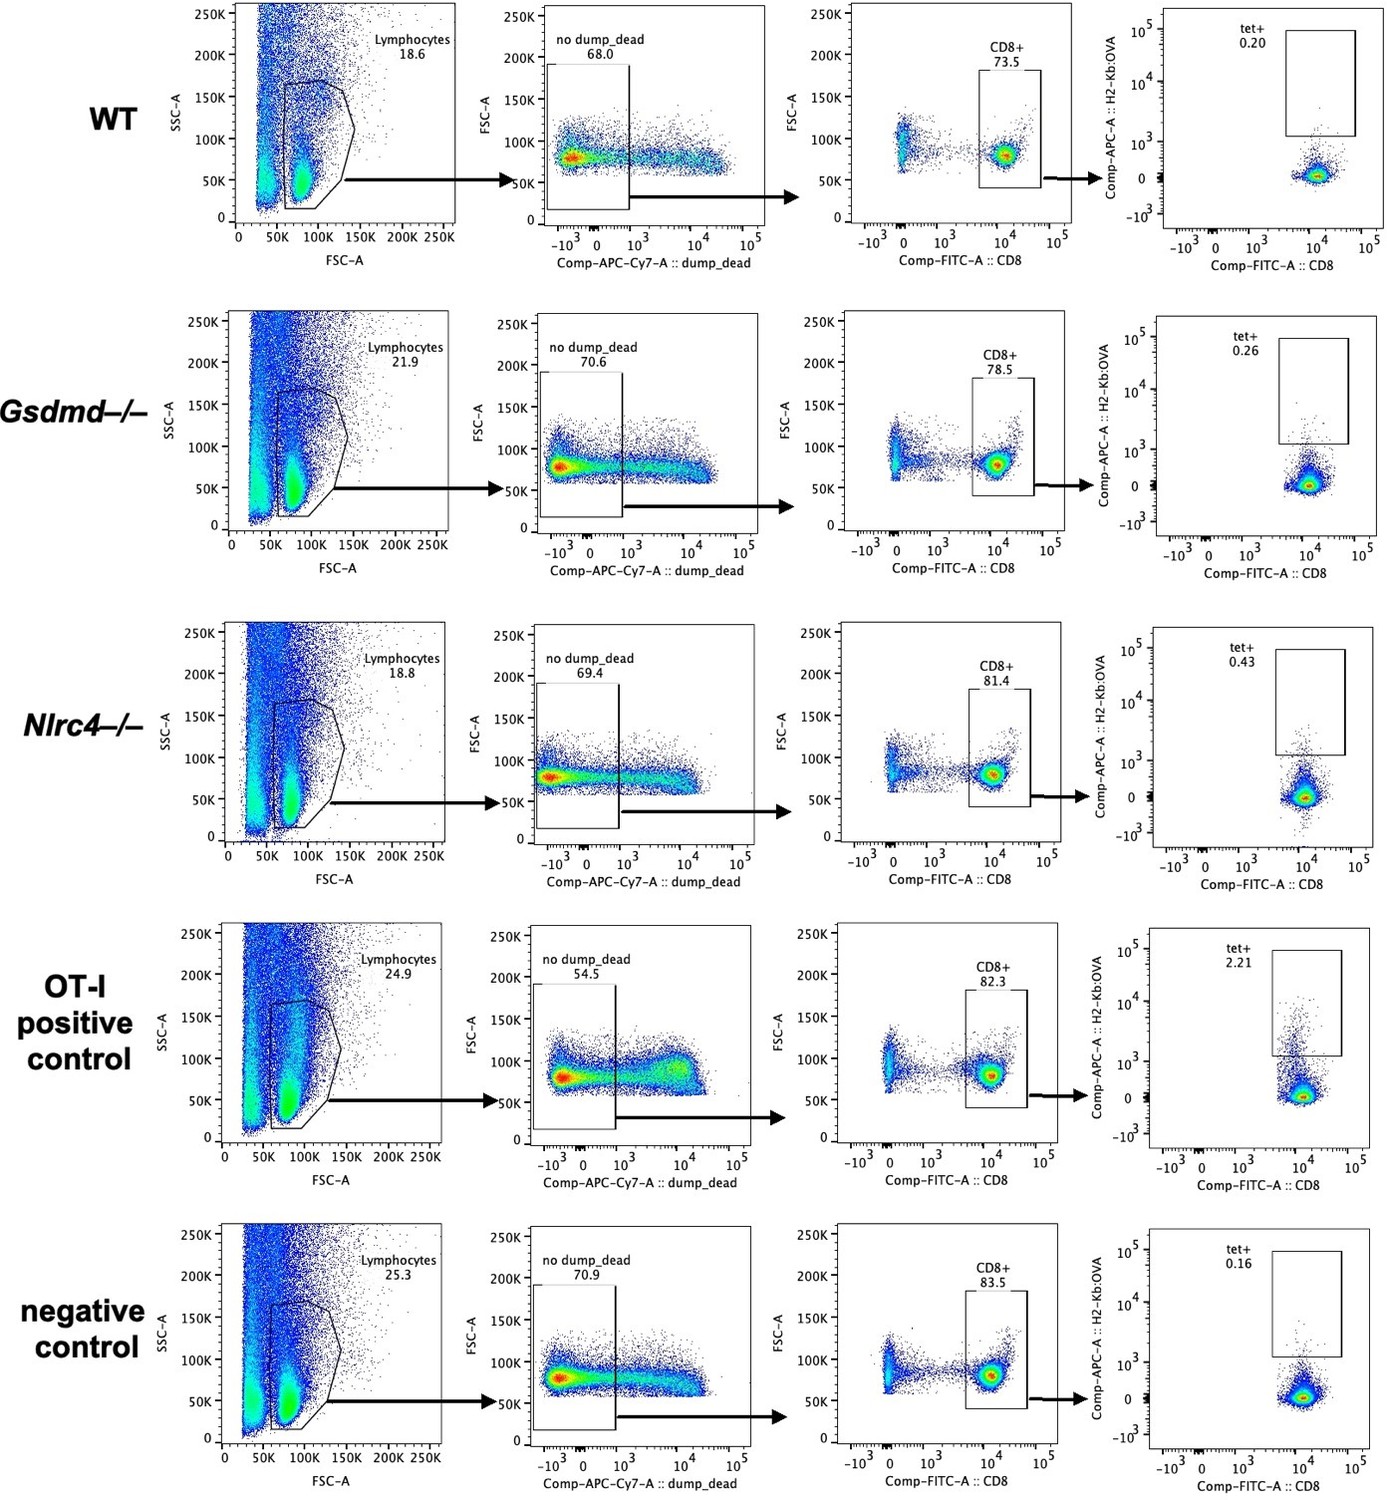
Endogenous SIINFEKL-specific CD8+ T cells cannot be found using tetramer staining in OvaFla mice at seven days post tamoxifen chow pulse.
Shown are representative flow plots demonstrating the gating strategy used to identify CD8+ T cells that recognize SIINFEKL presented on MHC I. Included is a positive control from a mouse given OT-I T cells and a negative control naïve B6 mouse.
Author response image 3
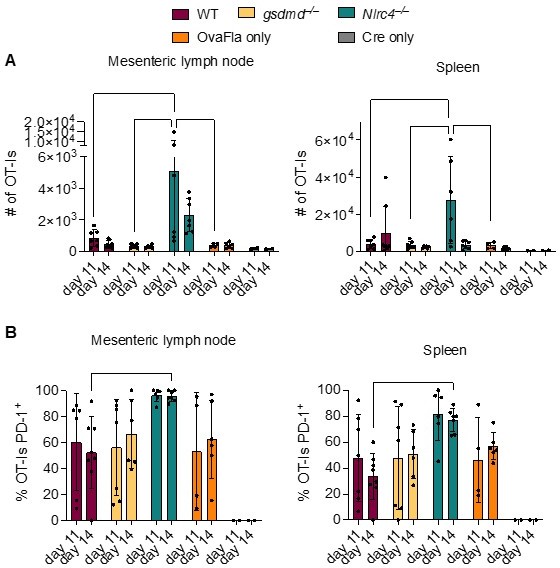
OT-Is in WT, Gsdmd–/–, and Nlrc4–/– OvaFla mice upregulate PD-1 at 11 and 14 days after tamoxifen chow pulse.
A. Total number of OT-Is in the mesenteric lymph nodes (left) and spleens (right) of the indicated OvaFla mouse lines at 11 and 14 days after tamoxifen chow pulse. B. Percent of OT-Is in the mesenteric lymph nodes (left) and spleens (Right) of the indicated OvaFla mouse lines that are expressing PD-1 at 11 and 14 days after tamoxifen chow pulse. Data are pooled from two biological replicates, and each dot represents an individual mouse. Data shown as mean ± SD. Significance calculated using two-way ANOVA and Tukey’s multiple comparisons test (*p < 0.05, **p < 0.01, ***p < 0.001).
Tables
Key resources table
| Reagent type (species) or resource | Designation | Source or reference | Identifiers | Additional information |
|---|---|---|---|---|
| Gene (Mus musculus) | Nlrc4 | GenBank | Gene ID: 268973 | |
| Gene (Mus musculus) | Gsdmd | GenBank | Gene ID: 69146 | |
| Gene (Mus musculus) | Pycard | GenBank | Gene ID: 66824 | |
| Gene (Mus musculus) | Batf3 | GenBank | Gene ID: 55509 | |
| Gene (Mus musculus) | Zbtb46 | GenBank | Gene ID: 72147 | |
| Strain, strain background (Mus musculus) | Nlrc4–/– | PMID:15190255 | RRID:MGI:3047280 | Vishva Dixit, Genentech, South San Francisco, CA |
| Strain, strain background (Mus musculus) | Gsdmd–/– | PMID:28410991 | RRID:IMSR_JAX:032663 | Generated via CRISPR/Cas9 from UC Berkeley Gene Targeting Facility |
| Strain, strain background (Mus musculus) | Pycard–/– | PMID:15190255 | RRID:MGI:3047277 | Vishva Dixit, Genentech, South San Francisco, CA |
| Strain, strain background (Mus musculus) | Batf3–/– | Jackson Laboratory | RRID:IMSR_JAX:013755 | C57BL/6J background |
| Strain, strain background (Mus musculus) | Zbtb46–/– | Jackson Laboratory | RRID:IMSR_JAX:019506 | |
| Strain, strain background (Mus musculus) | Villin-Cre-ERT2 | Jackson Laboratory | RRID:IMSR_JAX:020282 | C57BL/6NJ background |
| Strain, strain background (Mus musculus) | OT-I Rag2–/– | Jackson Laboratory | RRID:IMSR_JAX:003831 | C57BL/6 background |
| Genetic reagent (Mus musculus) | OvaFla | PMID:29263322 | MGI:6196853 | |
| Antibody | CD16/CD32 Purified (rat monoclonal) | eBioscience | Clone: 93; Cat#: 14-0161-85 | FC(1:1000) |
| Antibody | Anti-mouse CD45.1 APC (mouse monoclonal) | eBioscience | Clone: A20; Cat#: 17-0453-81 | FC(1:300) |
| Antibody | Anti-mouse CD45 APC (rat monoclonal) | Biolegend | Clone: 30-F11; Cat#: 103111 | FC(1:300) |
| Antibody | Anti-mouse CD45.2 PE/Cy7 (mouse monoclonal) | BioLegend | Clone: 104; Cat#: 109830 | FC(1:300) |
| Antibody | Anti-mouse CD8a Brilliant Violet 650 (rat monoclonal) | BioLegend | Clone: 53–6.7; Cat#: 100742 | FC(1:300) |
| Antibody | Anti-mouse CD44 BB515 (rat monoclonal) | BD | Clone: IM9; Cat#: 564587 | FC(1:300) |
| Antibody | Anti-mouse CD62L Brilliant Violet 711 (rat monoclonal) | BioLegend | Clone: MEL-14; Cat#: 104445 | FC(1:300) |
| Antibody | Anti-mouse CD199 (CCR9) PE (rat monoclonal) | BioLegend | Clone: 9B1; Cat#: 129707 | FC(1:100) |
| Antibody | Anti-mouse TNFa FITC (mouse monoclonal) | eBioscience | Clone: MP6-XT22; Cat#: 11-7321-82 | FC(1:100) |
| Antibody | Anti-mouse CD11c PE (arm hamster monoclonal) | eBioscience | Clone: 418; Cat#: 12-0114-81 | FC(1:300) |
| Antibody | Anti-mouse MHC Class II (I-A/I-E) APC-eFluor 780 (rat monoclonal) | BioLegend | Clone: M5/114.15.2; Cat#: 107628 | FC(1:300) |
| Antibody | Anti-mouse CD4 APC/Fire 750 (rat monoclonal) | BioLegend | Clone: GK1.5; Cat#: 100460 | FC(1:300) |
| Antibody | Anti-Mouse CD11b PE-Cyanine7 (rat monoclonal) | eBioscience | Clone: M1/70; Cat#: 25-0112-81 | FC(1:300) |
| Antibody | Anti-mouse CD11c Brilliant Violet 711 (arm hamster monoclonal) | BioLegend | Clone: N418; Cat#: 117349 | FC(1:300) |
| Antibody | Anti-mouse CD45 Brilliant Violet 785(rat monoclonal) | BioLegend | Clone: 30-F11; Cat#: 103149 | FC(1:300) |
| Antibody | Anti-mouse MHC II I-A/I-E FITC (rat monoclonal) | BioLegend | Clone: M5/114.15.2; Cat#: 107605 | FC(1:400) |
| Antibody | Anti-mouse/rat XCR1 APC (mouse monoclonal) | BioLegend | Clone: ZET; Cat#: 148206 | FC(1:300) |
| Antibody | Anti-mouse CD90.2 (Thy-1.2) APC/Fire 750 (rat monoclonal) | BioLegend | Clone: 53–2.1; Cat#: 140326 | FC(1:300) |
| Antibody | Anti-mouse Ly-6G/Ly-6C (Gr-1) APC/Cyanine7 (rat monoclonal) | BioLegend | Clone: Gr1; Cat#: 108424 | FC(1:300) |
| Antibody | Anti-mouse CD64 (FcγRI) APC (mouse monoclonal) | BioLegend | Clone: X54-5/7.1; Cat#: 139306 | FC(1:100) |
| Antibody | Anti-mouse CD45.2 PerCP-Cyanine5.5 (mouse monoclonal) | eBio | Clone: 45-0454-82; Cat#: 17-0454-82 | FC(1:100) |
| Antibody | Anti-mouse MHC Class II (I-A/I-E) FITC (rat monoclonal) | Fisher | Clone: M5/114.15.2; Cat#: 11-5321-82 | FC(1:300) |
| Antibody | Anti-mouse CD64 PE (mouse monoclonal) | Fisher | Clone: X54-5/7.1; Cat#: 12-0641-82 | FC(1:200) |
| Antibody | Anti-mouse CD45.2 PE (mouse monoclonal) | Fisher | Clonne: 104; Cat#: 12-0454-82 | FC(1:300) |
| Antibody | Anti-mouse CD11b PE-Cyanine7 (rat monoclonal) | Fisher | Clone: M1/70; Cat#: 25-0112-82 | FC(1:300) |
| Antibody | Anti-mouse CD90.2 (Thy-1.2) Pacific Blue (rat monoclonal) | BioLegend | Clond: 53–2.1; Cat#: 140306 | FC(1:300) |
| Antibody | Anti-mouse CD86 Brilliant Violet 785 (rat monoclonal) | BioLegend | Clone: GL-1; Cat#: 105043 | FC(1:200) |
| Antibody | Anti-mouse CD172a (SIRPα) Brilliant Violet 510 (rat monoclonal) | BioLegend | Clone: P84; Cat#: 144032 | FC(1:200) |
| Antibody | Ghost Dye Red 780 | Tonbo | Cat#: 13–0865T500 | FC(1:1000) |
| Antibody | Anti-rabbit IgG (H + L) AF 488 (donkey polyclonal) | Jackson Immunoresearch | Cat#: 711-545-152 | IF(1:500) |
| Antibody | Anti-mouse GFP Polyclonal Antibody (rabbit polyclonal) | Invitrogen | Cat#: A-6455 | IF(1:300) |
| Antibody | Anti-mouse IL-18 Biotin (rat monoclonal) | MBL | Clone: 93–10 C; Cat#: D048-6 | ELISA(1 µg/mL) |
| Antibody | Anti-mouse IL-18 (rat monoclonal) | BioXcell | Clone: YIGIF74-1G7; Cat#: BE0237 | ELISA(1:2000) |
| Antibody | Anti-mouse CD3 biotin (arm ham monoclonal) | BioLegend | Clone:145–2 C11; Cat#: 100304 | For depletion, 10 µL/107 cells |
| Antibody | BD Pharmingen Streptavidin HRP | BD Biosciences | RRID:AB_2868972; Cat#: 554066 | ELISA(1:1000) |
| Commercial assay or kit | CellTrace Violet Cell Proliferation Kit | ThermoFisher | Cat#: C34557 | See Materials and methods section; 1 µL/106 cells |
| Commercial assay or kit | Anti-Biotin MicroBeads | Miltenyi | Cat#: 130-105-637 | For depletion, 20 µL/107 cells |
| Commercial assay or kit | LD Columns | Miltenyi | Cat#: 130-042-901 | See Materials and methods section |
| Chemical compound, drug | DAPI | Invitrogen | Cat#: D1306 | IF(10 nM) |
| Chemical compound, drug | BD GolgiPlug | BD Biosciences | Cat#: 555029 | FC(1:1000) |
| Chemical compound, drug | Phorbol myristate acetate (PMA) | Invivogen | Cat#: tlrl-pma | FC(1 µg/mL) |
| Chemical compound, drug | Ionomycin | Calbiochem | Cat#: 407952–1MG | FC(1 µg/mL) |
| Chemical compound, drug | o-Phenylenediamine dihydrochloride | Sigma | Cat#: P3804-100TAB | ELISA(one tab/ 5 mL) |
| Chemical compound, drug | Tamoxifen chow | envigo | Cat#: 130856 | See Materials and methods section |
| Chemical compound, drug | Diphtheria toxin from Corynebacterium diphtheriae | Sigma | Cat#: D0564-1MG | See Materials and methods section |
| Software, algorithm | ImageJ | NIH | RRID:SCR_003070 | |
| Software, algorithm | FlowJo | BD | RRID:SCR_008520 | |
| Software, algorithm | Prism | GraphPad | RRID:SCR_002798 |
Additional files
Download links
A two-part list of links to download the article, or parts of the article, in various formats.
Downloads (link to download the article as PDF)
Open citations (links to open the citations from this article in various online reference manager services)
Cite this article (links to download the citations from this article in formats compatible with various reference manager tools)
Inflammasome activation leads to cDC1-independent cross-priming of CD8 T cells by epithelial cell-derived antigen
eLife 10:e72082.
https://doi.org/10.7554/eLife.72082


