Correct regionalization of a tissue primordium is essential for coordinated morphogenesis
- MRC Laboratory of Molecular Biology,Cambridge Biomedical Campus, United Kingdom
- Genetics and Genomic Medicine Programme, Institute of Child Health, University College London, United Kingdom
- Department of Physiology, Development and Neuroscience, University of Cambridge, United Kingdom
Figures
Figure 1 with 2 supplements
Patterned apical constriction remains fixed around the pit over time.
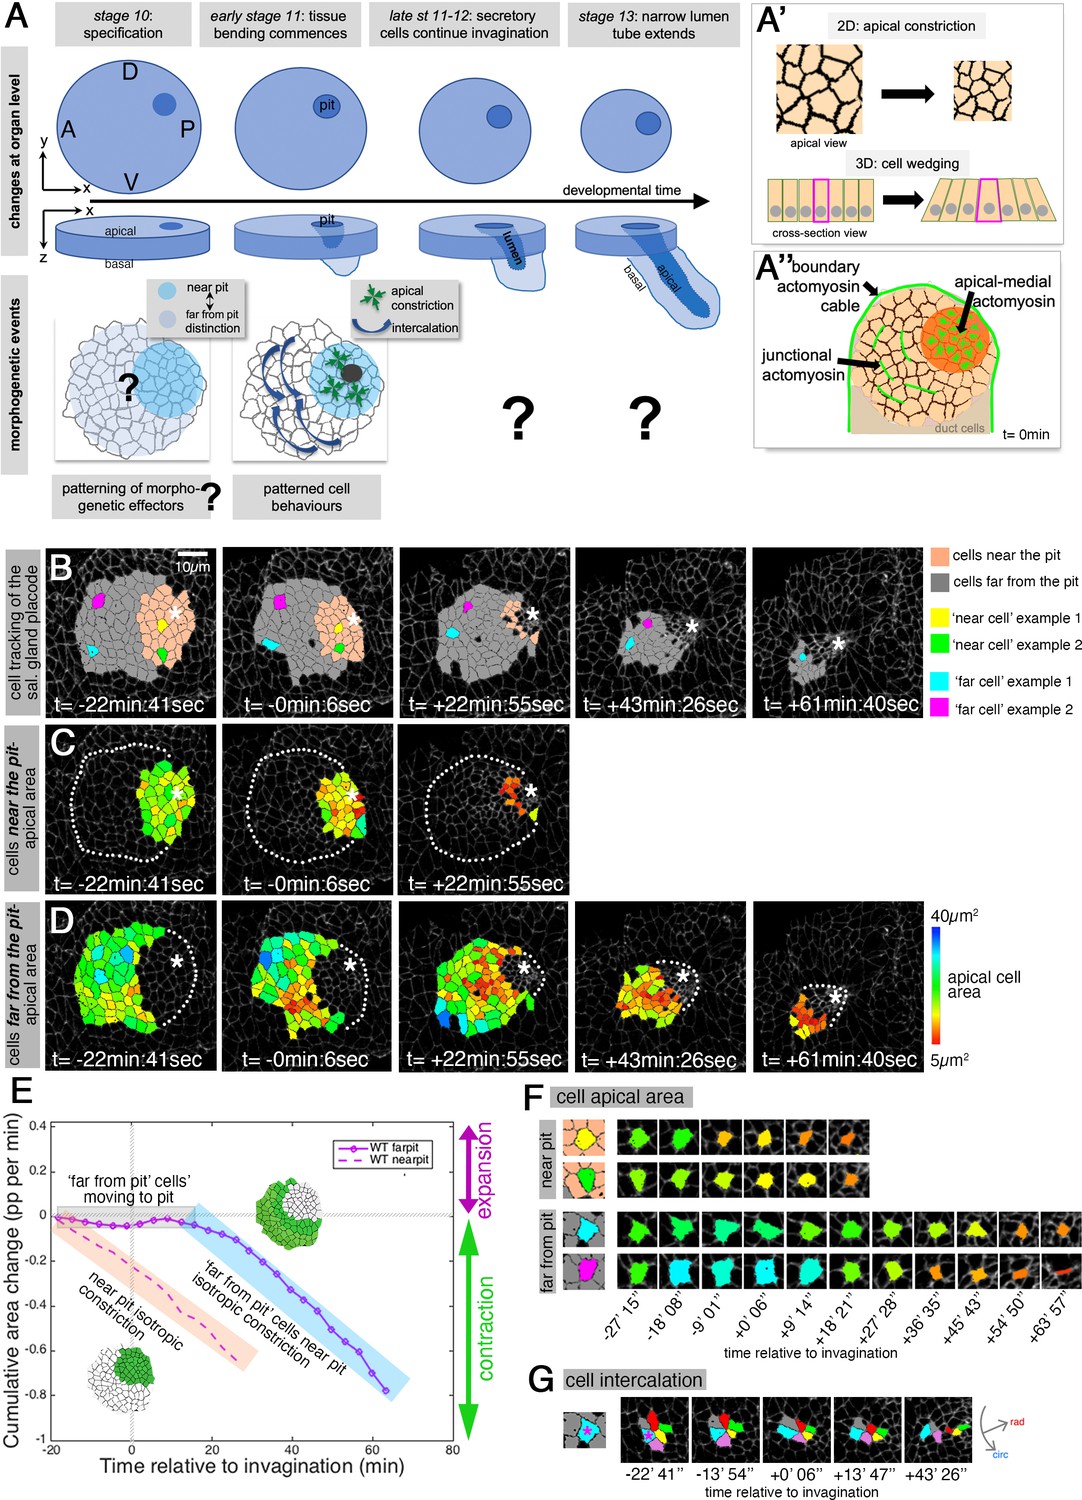
(A) The tubes of the salivary glands form from a flat epithelial placode with a circular geometry. Cells invaginate through an asymmetrically positioned invagination pit at the dorsal-posterior corner, embryonic axes of anterior-posterior (AP) and dorso-ventral (DV) are indicated. In the placode at early stages cell behaviors are highly patterned, with cells near the pit predominantly constricting isotropically and cells far from the pit predominantly intercalating (Sanchez-Corrales et al., 2018). (A’) Apical constriction within the apical domain of an epithelial cell, a 2D change, equates to a behavior of cell wedging within the 3D context of a whole cell, as shown in a cross-sectional view. (A’’) Patterned cell behaviors are driven by distinct pools of apical actomyosin. Three pools of actomyosin can be distinguished in the placode: apical-medial actomyosin in cells near the invagination pit (dark orange), leading to isotropic apical constriction; polarised junctional actomyosin, driving the initiation of directed cell intercalation events in cells further away from the pit (light orange); a circumferential actomyosin cable at the boundary of the placode. (B) Stills of a representative segmented time-lapse movie, color-coded to indicate cell near (pink) and far (gray) from the invagination pit, with individual cell examples in both regions highlighted. As calculated previously (Sanchez-Corrales et al., 2018), we employ a radial coordinate system centered at the invagination point at t=0 min. We specify the ‘near to the pit’ region as the region located between the invagination point and up to 33% of the distance between the invagination point and the far edge of the placode (with this region usually being within 13.7±3 µm of the pit), and with the rest of the cells defined as ‘far from the pit.’ The cell outlines in the time-lapse movie are labeled using Armadillo-YFP. These and all confocal panels shown in the figures are always oriented with anterior to the left and dorsal up. See Figure 1—video 1. (C, D) Placodal cells visually split into near the pit (C) and far from the pit (D) cells and color-coded for apical area size. The asterisks in (B–D) indicate the (future) position of the invagination pit, white dotted lines indicate the boundary of the placode in regions where cells are not highlighted. (E) Analysis of apical area change expressed in proportion (pp) per minute, pooled from seven time-lapse movies for cells that were specified at t=0 min to be located near the invagination pit (dashed line) and cells that were specified at t=0 min to be located far from the invagination pit (solid line). Wild-type movies were aligned in time using as t=0 min the frame just before the first sign of invagination at the future tube pit was evident. Note that cells near the pit continuously constrict until internalized (pink shaded box), whereas cells far from the pit do not constrict significantly until t=20 min whilst moving closer to the pit (gray shaded box), but once they are in close proximity to the pit they also constrict until internalized (blue shaded box). Details of cell numbers and lengths of movies analyzed are shown in Figure 1—figure supplement 1. (F) Apical area size evolution of individual cell examples of cells near the pit and far from the pit as highlighted in color in (B). (G) Example of a cell from the far from the pit region (blue cell in (B) and (F)) undergoing a cell intercalation process as part of a rosette of cells that contracts circumferentially and resolves to elongate the tissue radially toward the invagination point.
Figure 1—figure supplement 1
Patterned apical constriction remains fixed around the pit over time.
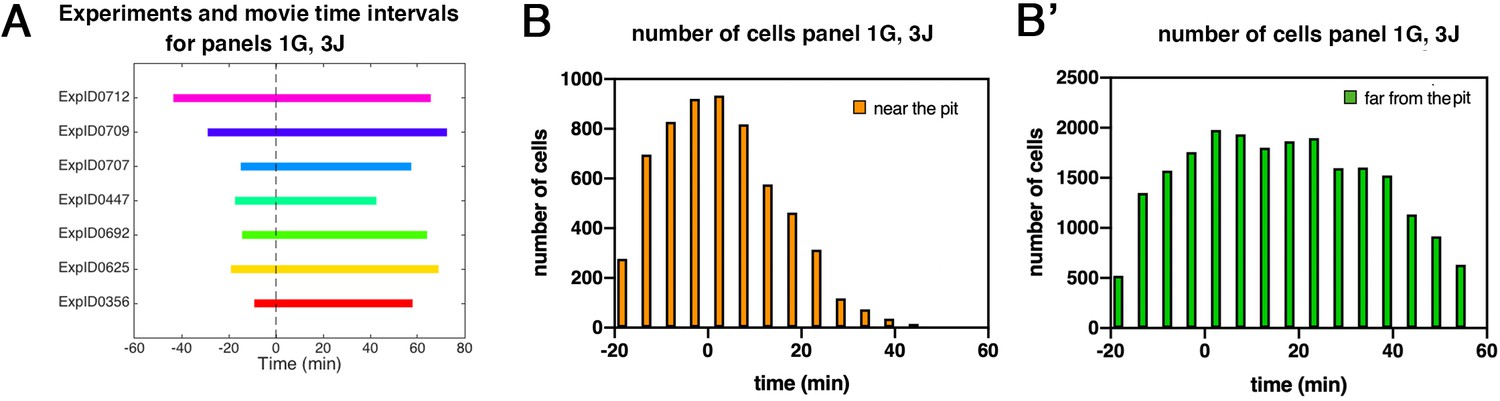
(A) Illustration of time intervals covered by wild-type time-lapse movies analyzed in Figures 1G ,, 3J. (B) Number of cells in ‘near the pit’ region used in wild-type experiments per time interval to calculate cell area change shown in Figures 1G and 3J. (B’) Numbers of cells in ‘far from the pit’ region used in wild-type experiments per time interval to calculate cell area change shown in Figures 1G and 3J. In all analyses, t=0 min is defined as the frame just before the first sign of invagination at the future pit was evident.
Figure 1—video 1
Contiunous apical constriction near the pit and switch to apica constriction of cell approaching the pit.
Time-lapse movie of an embryo expressing Armadillo-YFP to label cell outlines. Placodal cells are labeled according to position, with gray cells located far from the pit and pink cells located near to the pit at t=0 min (see Materials and methods for definition of near and far). Four individual cells are highlighted and further analyzed in Figure 1F and G.
Figure 2 with 2 supplements
Sustained apical constriction near the pit is driven by apical-medial myosin.
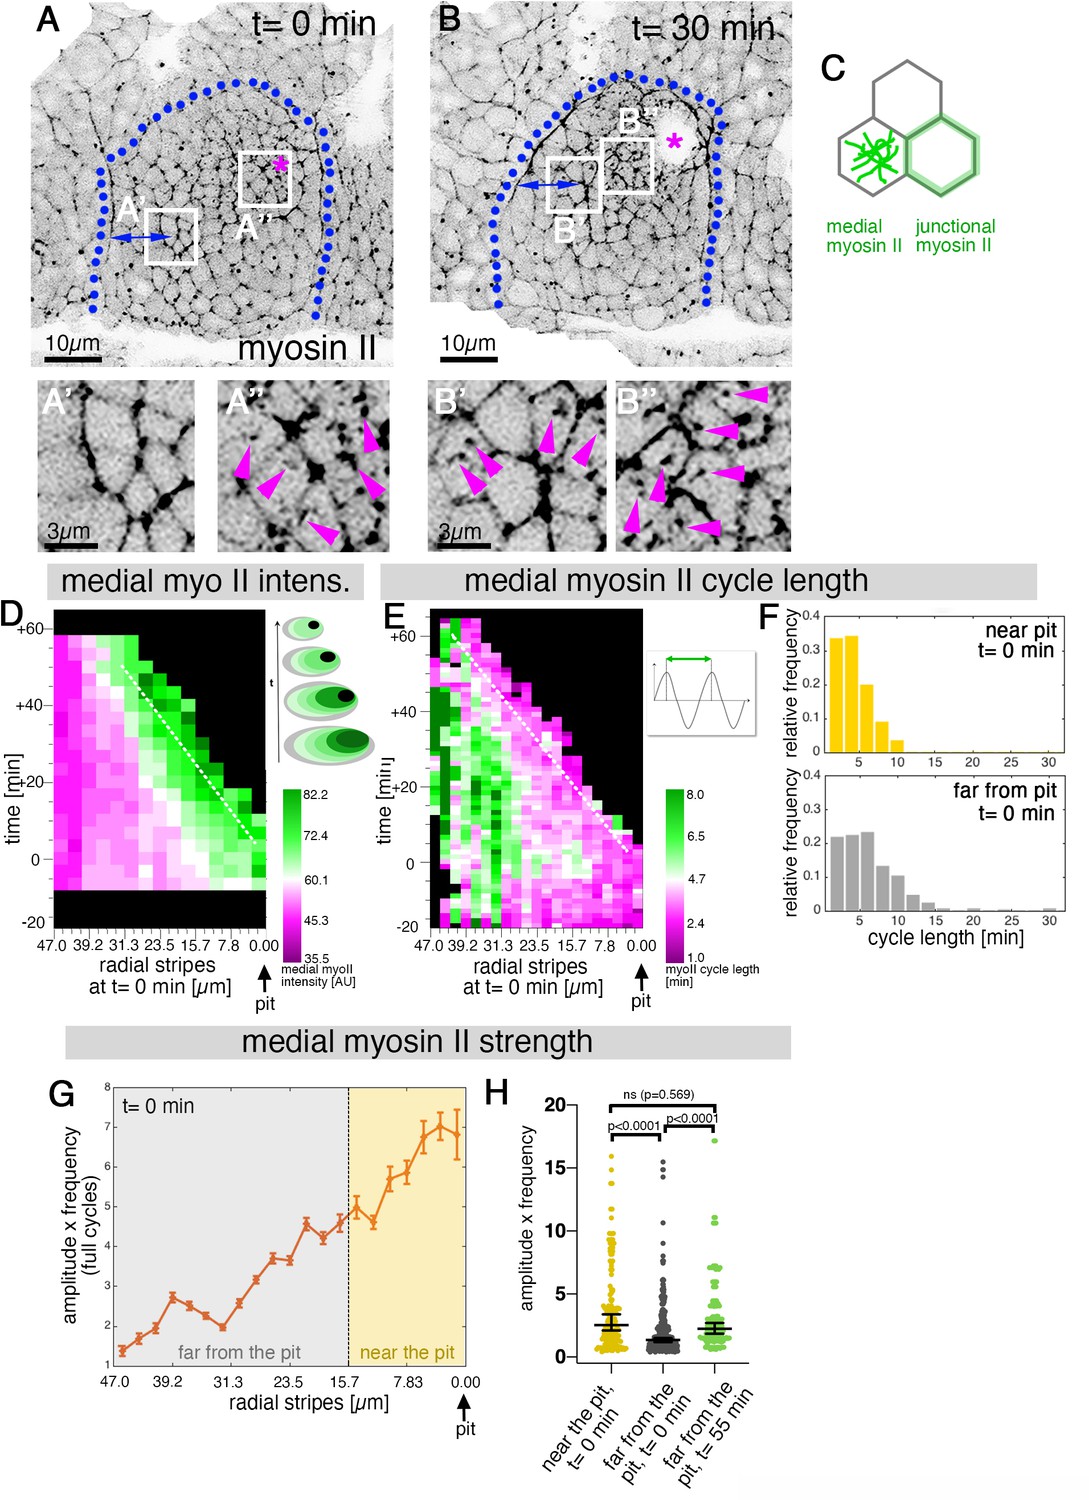
(A-B’’) Still images of a time-lapse movie of embryos expressing SqhGFP to label myosin II at t = 0 min (A-A’’) and t = 30 min (B-B’’). White boxes indicate the corresponding higher magnifications shown below, with (A’’,B’’) showing cells that are at these timepoints located near the pit, and (A’,B’) showing cells near the boundary (small blue double arrows indicate similar closeness to the boundary). Magenta asterisk marks the invagination pit, blue dotted lines mark the boundary of the placode. (C) Schematic apical view of epithelial cells, illustrating junctional and apical-medial pools of actomyosin. Arrows in (A’’, B’, B’’) point to apical-medial actomyosin. See also Figure 2—video 1. (D) Spatial representation of the average medial myosin intensity from an exemplary time lapse movie, with radial location (collapsed into stripes) of cells specified at t = 0min. The dashed white line marks the peak of medial myosin intensity that is always adjacent to the invagination pit as cells flow into it over time. The schematic illustrates the evolution of the radial stripes analysed, with stripes initially close to the pit internalised first and hence a position close to the pit ‘moving’ across this type of plot diagonally in wild-type placodes. (E) Spatial representation of the distribution of the myosin cycle length across the salivary gland placode, with radial location (collapsed into stripes) of cells specified at t = 0 min. The dashed line marks the region of shortest cycle length that is always adjacent to the invagination pit as cells flow into it over time. The mean of 3 movies is shown. The schematic illustrates one cycle of a myosin pulsation defined as periodic increases and decreases in medial myosin II intensity. (F) The distribution of myosin II cycle lengths between cells near the pit and far from the pit varies: the median of the cycle length for cells near the pit is 3.7 min (n = 146) and SD+/- 2.08 min, while cells far from the pit have a median myosin II cycle length of 4.64 min (n = 301) and SD+/- 2.72 min. Thus, the cells that are located far from the pit show longer cycle length (p < 0.0001 Mann Whitney test). Data is pooled from 3 movies at t = 0 min. (G) Spatial representation of the strength of myosin oscillations in radial stripes from the pit (0 µm) to the boundary of the placode (47µm) at t = 0 min. Mean and standard error of the mean are shown. Data are pooled from 3 movies ranging from -7.5-56.25 min; -16.76 to 55.48 min and -17.42 to 67.26 min. Regions corresponding to cells near the pit and far from the pit are indicated by coloured shading. (H) Medial myosin strength, expressed as the product of amplitude x frequency of the oscillations, for all cells analysed from 3 movies, split into cells located near to the pit (n=148) compared to cell located far from the pit (n = 302) at t = 0 min from 3 movies. Cells near the pit have significantly higher medial myosin strength than cells located far from the pit; statistical significance as determined (Mann Whitney test, with p<0.0001). Cells far from the pit at later time points (t = 55-60 min, n = 134) increased the medial myosin strength and were not significantly different from cells near the pit at t = 0 min (Mann Whitney test, p = 0.5690). In all analyses, t = 0 min is defined as the frame just before the first sign of invagination at the future pit was evident. See also Figure 2—figure supplement 1 and Figure 2—video 1.
Figure 2—figure supplement 1
Sustained apical constriction near the pit is driven by apical-medial myosin.
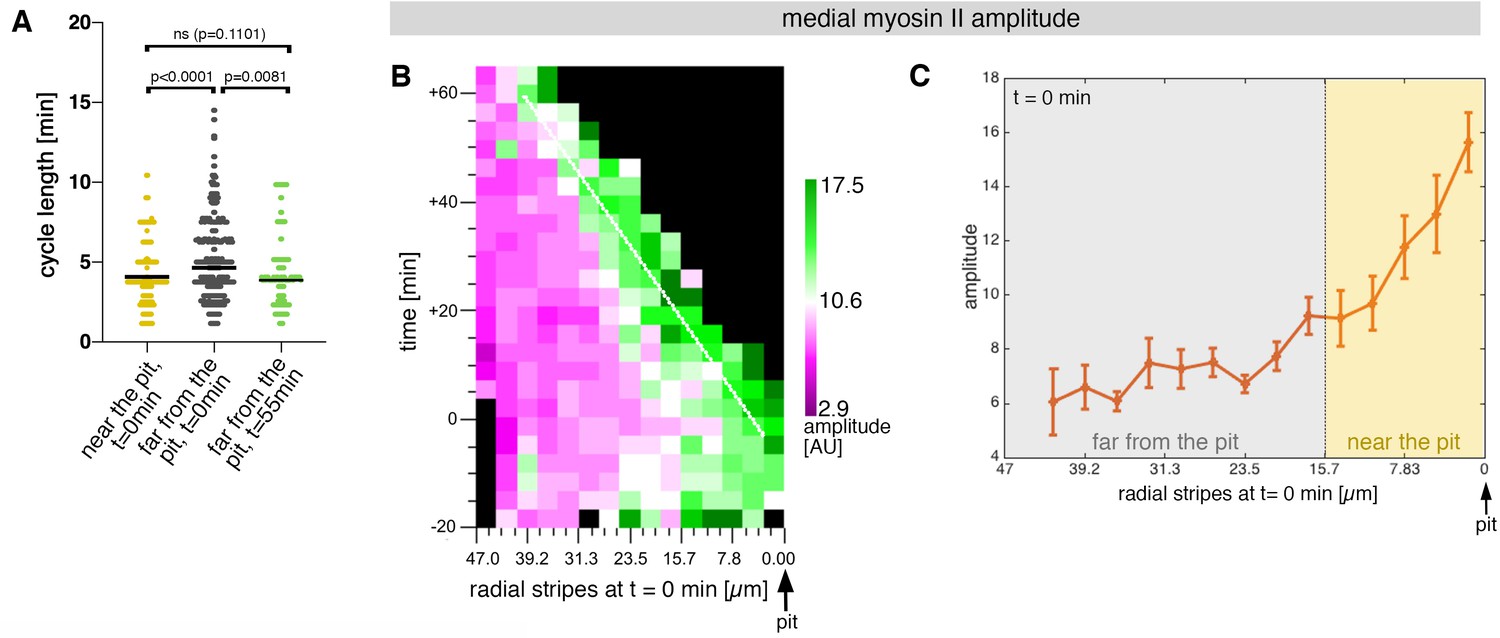
(A) Myosin cycle length for all cells analysed from 3 movies, split into cells located near the pit (n=148) compared to cell located far form the pit (n=302) at t=0. Cells near the pit have significantly higher shorter, myosin cycle length than cell located far from the pit; statistical significance as determined using Mann Whitney test, with p<0.0001. The myosin cycle length of cells far from the pit at later time points (t=55-60 min, n = 134) was not significantly different from cells near the pit at t=0 (p = 0.1101 using a Mann Whitney test). (B) Spatial representation of the distribution of the myosin amplitude across the salivary gland placode, with radial location (collapsed into stripes) of cells specified at t = 0min. The dashed line marks the region of highest amplitude that is always adjacent to the invagination pit as cells flow into it over time. The mean of 3 movies is shown. (C) Spatial representation of the amplitude of myosin oscillations in radial stripes from the pit (0 µm) to the boundary of the placode (47µm) at t = 0min. Mean and standard error of the mean are shown. Data are pooled from 3 movies ranging from -7.5-56.25 min; -16.76 to 55.48 min and -17.42 to 67.26min. Regions corresponding to cells near the pit and far from the pit are indicated by coloured shading. In all analyses, t = 0min is defined as the frame just before the first sign of invagination at the future pit was evident.
Figure 2—video 1
Continuous medial myosin oscillations near the pit.
Time-lapse movie of an exemplary embryo expressing SqhGFP to label myosin II. SqhGFP is shown in the left panel, and the calculated apical-medial myosin II intensity in the right panel.
Figure 3 with 6 supplements

hkb−/− mutants show a delayed symmetrical apical constriction.
(A-F’’’) Stills of a representative wild-type (A-C’’’) and a hkb-/- mutant (D-F’’’) embryo time lapse movie at the indicated time points. (A-A’’’) and (D-D’’’) show the SqhGFP channel of the movies visualising myosin II, (B-B’’’) and (E-E’’’) show the average apical-medial myosin II intensity of segmented placodal cells, (C-C’’) and (F-F’’’) show the corresponding apical cell areas. (E-E’’’) hkb-/- mutants show apical-medial accumulation of myosin II at the centre at a delayed time point. Indicated colour scales correspond to the 5-95% range in each movie. Magenta dotted lines indicate the boundary of the placode. (F-F’’’) The delayed accumulation of myosin II in hkb-/- mutants is mirrored by the changed apical constriction pattern, with the wild-type constricting in the dorsal-posterior corner (C-C’’’) and hkb-/- mutants in the centre, but very delayed (F-F’’’). (G, H) Rate of apical area change of cells in wild-type (G; data from 7 movies) and hkb-/- mutant (H; data from 7 movies) embryos shown over time and across radial distance of cells from the eccentric wild-type pit location (0 µm) at t = 0 min. 47 µm represents the boundary of the placode. The blue line in (G) indicates where cells have just disappeared into the pit in the wild-type. Greatest apical area change in the wild-type is always confined to the area in front of the pit (brackets in G), whereas in hkb-/- mutant embryos cells in a broader central region show a delayed apical constriction (blue brackets in H). See also Figure 3—figure supplement 1. (I, I’) Schematic representation of a segmented wild-type and hkb-/- mutant placode, with cells near the eccentric wild-type pit and central hkb-/- mutant pit/area of constriction indicated in orange, and cells far from the pit for both in magenta. (J) Comparative analysis of cumulative apical area change of hkb-/- mutant embryos expressed as proportion per minute (pp/min), pooled from 7 time-lapse movies for cells that were specified at t = 0 min to be located near the central constricting pit (dashed blue curve; see schematic on the right) and cells that were specified at t = 0 min to be located far from the central pit (solid blue line; see schematic on the right) versus wild-type placodal cells as previously shown in Figure 1C. (K) Spatial representation of the average medial myosin intensity from an exemplary time-lapse movie of a hkb-/- mutant embryo, with radial location (collapsed into stripes) of cells specified at t = 0min. The blue brackets mark the peak of medial myosin intensity that is located in the centre of the placode in hkb-/- mutant embryos rather than tracking near the forming eccentric pit as in the wild-type. In all analyses of the wild-type, t = 0min is defined as the frame just before the first sign of invagination at the future pit was evident. hkb-/- mutants were aligned using as a reference of embryo development the level of invagination of the tracheal pits that are not affected in the hkb-/- mutant as well as other morphological markers such as appearance and depth of segmental grooves in the embryo. See also Figure 3—figure supplements 1 and 2 and Figure 3—videos 1–4.
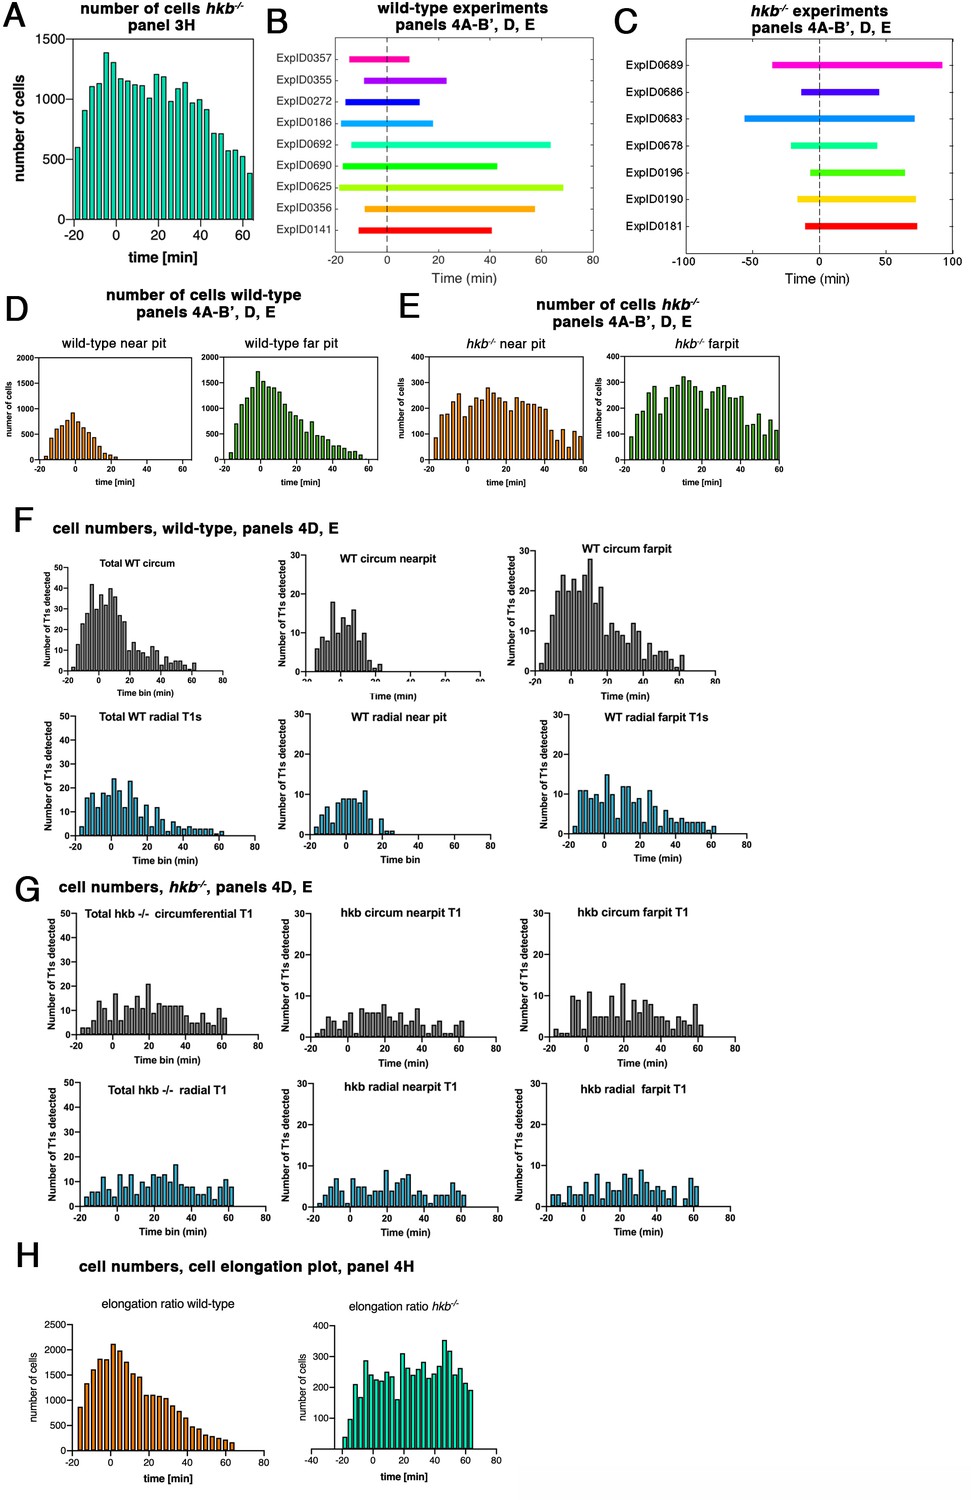
Figure 3—figure supplement 1
hkb−/− mutants show a delayed symmetrical apical constriction.
(A) Number of cells used in hkb−/− mutant experiments per time interval to calculate cell area change shown in Figure 3H. (B) Illustration of time intervals covered by the time-lapse movies for wild-type experiments used to calculate strain rates in Figure 4A, B' and T1 productive neighbor exchanges in Figure 4D and E. For cell area change in the wild-type shown in Figure 3G, the experiments ExpID356, ExpID0625, ExpID0692, ExpID0447, ExpID0707, ExpID0709, and ExpID0712 were analyzed (details of time interval for the last four experiments are shown in Figure 1—figure supplement 1). (C) Illustration of time intervals covered by the time-lapse movies for hkb−/− mutant experiments. All experiments shown were used to calculate the cell area change shown in Figure 3H. Experiments ExpID0181, ExpID0190, ExpID0196, ExpID0689, and ExpID0678 were used to calculate strain rates in Figure 3I–J’ and T1 neighbor exchanges in Figure 4D and E. (D, E) Number of cells in wild-type experiments (D) and hkb−/− mutant experiments (E) used to calculate strain rates in Figure 4AI–B’ and T1 exchanges in Figure 4D and E by time interval and region (near the pit and far from the pit, with eccentric pit for the wild-type and central pit for the hkb−/− mutants). (F, G) Total number of T1 exchanges detected in wild-type experiments (F) and hkb−/− mutant experiments (G), divided into circumferential and radial T1s. The cumulative plots of T1 exchanges are shown in Figure 4D and E. (H) Number of cells used for analysis of cell elongation ratio in Figure 4H in wild-type and hkb−/− mutant.
Figure 3—figure supplement 2
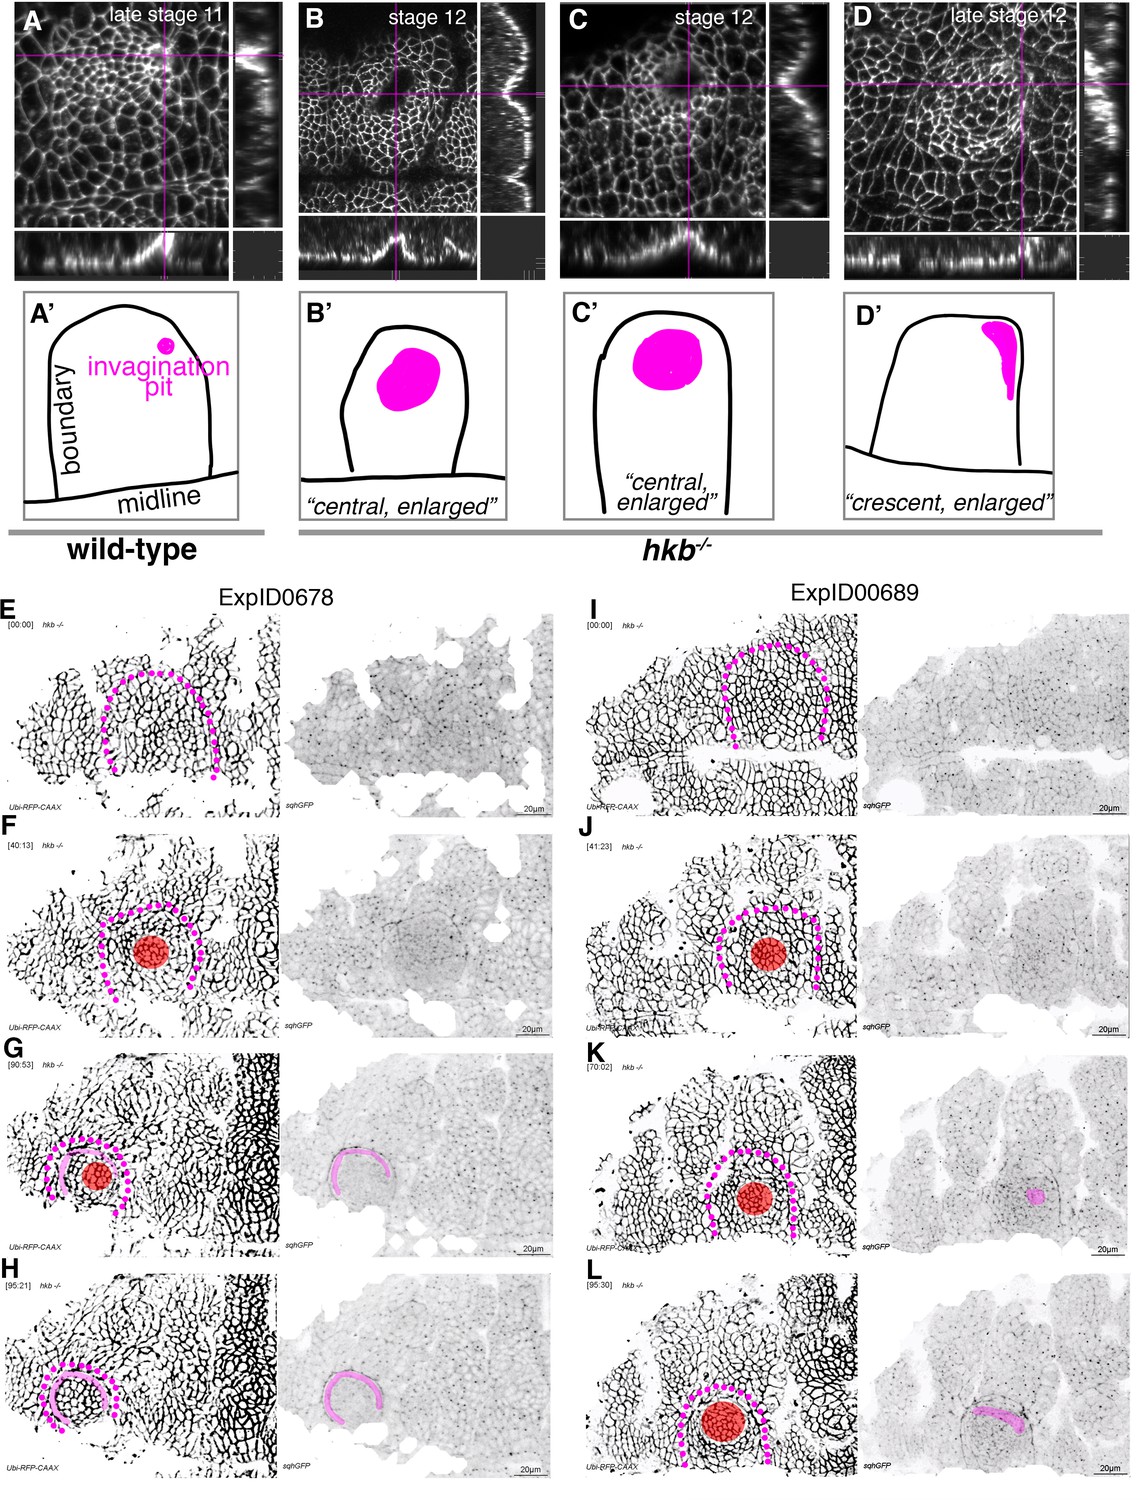
hkb−/− mutants show a delayed symmetrical apical constriction followed by aberrant invagination.
(A, A’) The invagination pit in wild-type embryos at stage 11 and beyond is small, eccentric in its position in the placode (dorsal-posterior corner). (B–D’) In hkb−/− mutant embryos, the invagination pit that forms at a delayed stage is often centrally positioned within the placode and enlarged, leading to a very much widened invagination as visible in the cross-sections. These central pits often enlarge toward the boundary and sometimes collapse into a more crescent-shaped invagination at later stages. Magenta crosshairs in (A–D) indicate the positions of the cross-sections shown. Labeling in these panels is for anti-phospho-tyrosine. In (A’–D’), the position and shape of the invagination pit, drawn from the images in (A–D), is shown in magenta, and the boundary of the placode as well as the ventral midline, where visible, are in black. (E–H) Still images from time-lapse movie ExpID0678 shown in Figure 3—video 3. The delayed central constriction is visible in (F), the crescent-shaped enlarged invagination front is highlighted in magenta, the central constricting area in red in (F–H). (I–L) Still images from time-lapse movie ExpID0689 shown in Figure 3—video 4. The delayed central constriction is visible in (J), the enlarged invagination is highlighted in magenta in (K, L). Membrane channel and myosin II channel are shown as individual panels in (E–L), placode boundaries are indicated by magenta dotted lines. In all analyses of the wild-type, t=0 min is defined as the frame just before the first sign of invagination at the future pit was evident. hkb−/− mutants were aligned using as a reference of embryo development the level of invagination of the tracheal pits that are not affected in the hkb−/− mutant as well as other morphological markers such as appearance and depth of segmental grooves in the embryo.
Figure 3—video 1
Extended wild-type embryo movie 1 for strain rate analysis.
Control embryo (sqh[AX3];;sqhGFP, UbiRFP) with cell membrane is shown in the left panel and myosin II in the right panel. This is ExpID0618.
Figure 3—video 2
Extended wild-type embryo movie 2 for strain rate analysis.
Control embryo (sqh[AX3];;sqhGFP, UbiRFP) with cell membrane is shown in the left panel and myosin II in the right panel. This is ExpID0690.
Figure 3—video 3
Extended hkb–/– mutant embryo movie 1 for strain rate analysis.
hkb−/− mutant embryo (sqhGFP42, UbiRFP; hkb[2]) with cell membrane is shown in the left panel and myosin II in the right panel. This is ExpID0678.
Figure 3—video 4
Extended hkb–/– mutant embryo movie 2 for strain rate analysis.
hkb−/− mutant embryo (sqhGFP42, UbiRFP; hkb[2]) with cell membrane is shown in the left panel and myosin II in the right panel. This is ExpID0689.
Figure 4 with 1 supplement
hkb−/− mutants show aberrant cell behaviors during invagination.
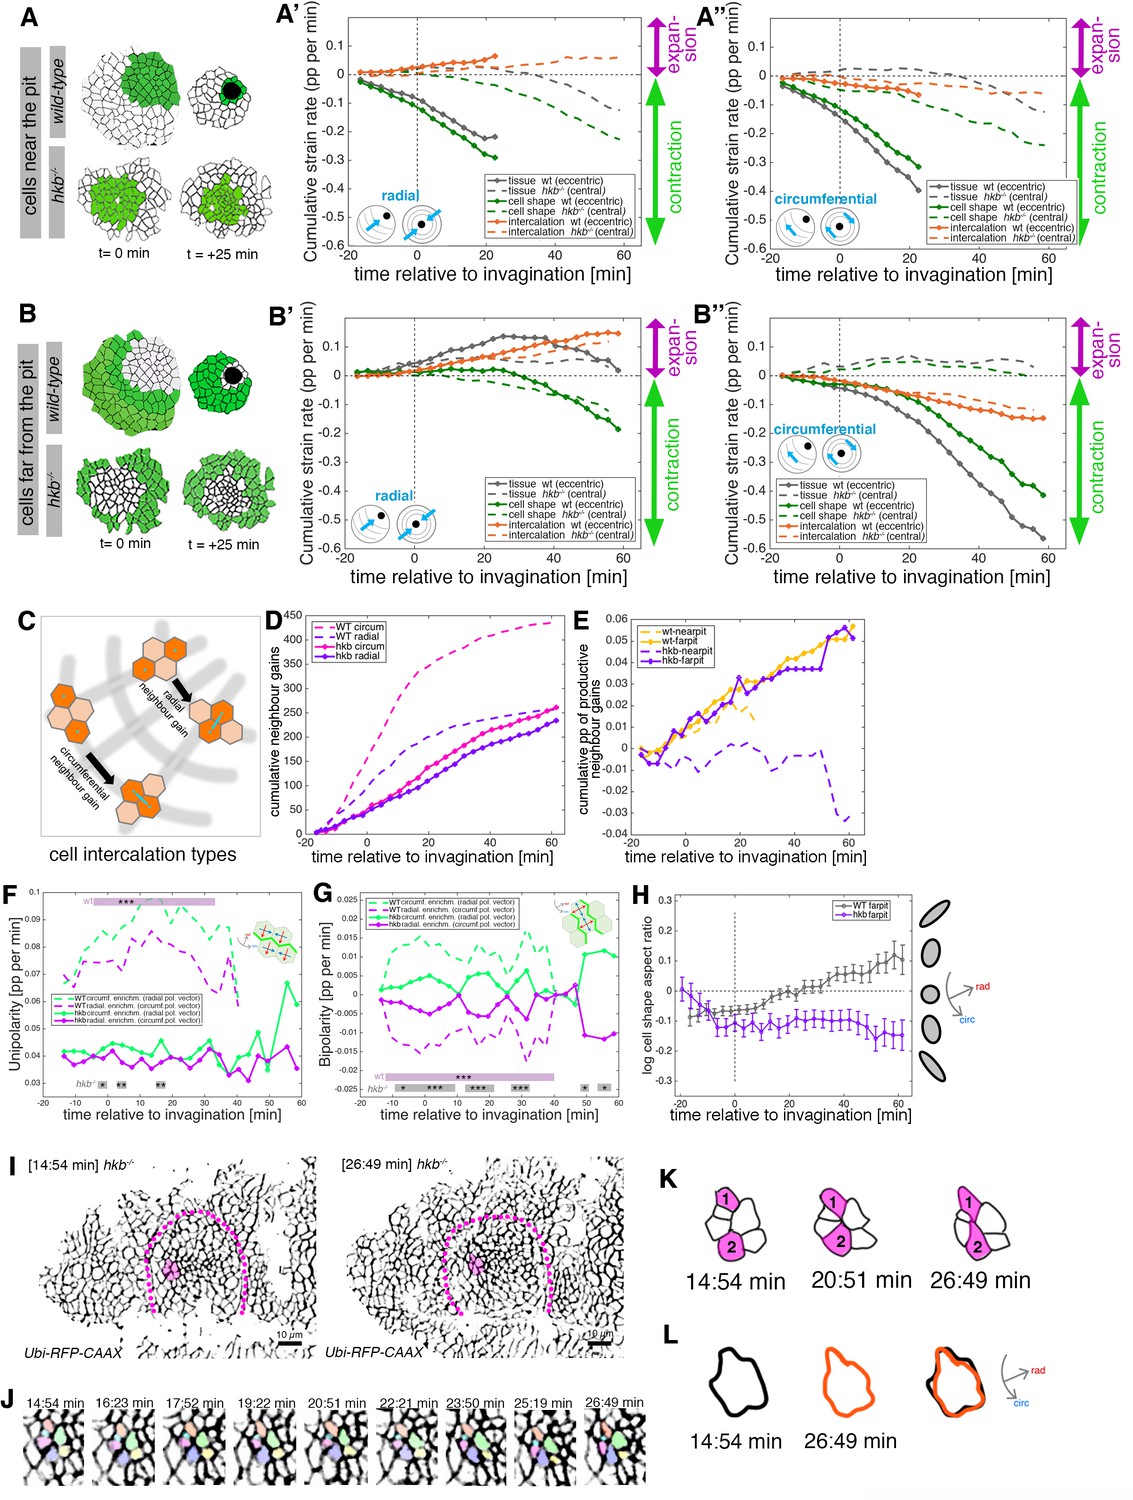
(A–B’’) Regional breakdown of time-resolved cumulative strain rates, with regions defined at t=0 min based on eccentric pit for the wild-type and a central pit for hkb−/− mutants. For cells ‘near the pit’ in the wild-type (A), tissue constriction dominates (solid gray curves in (A’, A’’)) and is due to isotropic cell constriction (solid green curves in (A’, A’’)), whilst intercalation only plays a minor role in this region (solid orange curves in (A’, A’’)). Cells in this region have completely internalized by about t=20 min. By contrast, in hkb−/− mutant embryos, cells ‘near the (central) pit’ (A), show strongly reduced tissue (dashed gray curves in (A’, A’’)) and cell strain rates (dashed green curves in (A’, A’’)) and mildly reduced intercalation (dashed orange curves in (A’, A’’)). For cells ‘far from the pit’ in the wild-type (B), the tissue elongates toward the pit until t=20 min (solid gray curve in (B’)), with a corresponding contraction circumferentially (solid gray curve in (B’’)), and this is predominantly due to cell intercalation (solid orange curves in (B’, B’’)). Beyond t=20 min, these cells have reached the invagination pit and also constrict isotropically, thereby leading the tissue change (solid gray curves in (B’, B’’) >20 min) to mirror the cell shape change (solid green curves in (B’, B’’) >20 min). By contrast, in hkb−/− mutant embryos, cells ‘far from the (central) pit’ (B) show a slight tissue expansion both radially and circumferentially (dashed gray curves in (B’, B’’)), paired with abnormal circumferential cell elongation (dashed green curves in (B’, B’’)), and some reduced intercalation (dashed orange curves in (B’, B’’)). The corresponding instantaneous strain rate plots can be found in Figure 4—figure supplement 1. Data from nine wild-type movies and five hkb−/− movies were analyzed (see Figure 3—figure supplement 1). (C–E) Quantification of neighbor gains as a measure of T1 and intercalation events. Examples of a circumferential neighbor gain (leading to radial tissue expansion), and a radial neighbor gain (leading to circumferential tissue expansion) are shown in (C). (D) Circumferential neighbor gains dominate over radial neighbor gains in the wild-type (dashed curves), with the rate of neighbor exchanges dropping beyond 20 min. In contrast, in hkb−/− mutant embryos, the amount of circumferential and radial gains is identical (solid curves). (E) Cumulative proportion of productive neighbor gains, defined as the amount of circumferential neighbor gains leading to radial tissue elongation and expressed as a proportion (pp) of cell-cell interfaces tracked at each time point, and split into cells near the pit (eccentric for wild-type and central for hkb−/− mutant) and far from the pit. Predicted productive neighbor gains are strongly reduced and near zero for cells near the pit in hkb−/− mutants compared to control (dashed curves), whereas cells far from the pit in hkb−/− mutant continue to intercalate similar to wild-type (solid curves). (F, G) Myosin II junctional polarity was quantified from segmented and tracked time-lapse movies. Myosin enrichment at junctions can occur in two flavors: Myosin II unipolarity is defined as myosin II enrichment selectively on side of a cell ((F), see schematic inset). Myosin II bi-polarity is defined as myosin II enrichment at two parallel oriented junctions of a single cell, calculated as the magnitude of a vector pointing at the enrichment (G). Data from six wild-type movies and five hkb−/− movies, number of cells is shown in Figure 3—figure supplement 1. Plotted are the rates of change of the uni- and bipolarity amplitudes as a proportion per minute (pp/min) of the mean cell perimeter fluorescence. (F) Circumferential myosin II uni-polar enrichment (i.e., the radial uni-polarity vector, red arrow in schematic, pointing at the myosin enrichment), increases and is high until ~40 min when it drops ((G), green dashed curve). The circumferential uni-polar enrichment is always higher than the radial myosin II uni-polar enrichment (green solid curve in (G)). The myosin II uni-polar enrichment in hkb−/− mutants is overall strongly reduced compared to wild-type (solid curves in (F)). (G) Circumferential myosin II bi-polar enrichment in the wild-type (i.e., the radial bi-polarity vector, red arrow in schematic, pointing at the myosin enrichment) is high until ~40 min when it drops ((G), green dashed curve). Until this point, it is higher than the radial myosin II bi-polar enrichment (green solid curve in (G)). The myosin II bi-polar enrichment in hkb−/− mutants is strongly reduced compared to the wild-type (solid curves in (G)). Statistical significance of p<0.05 (*), p<0.005 (**), p<0.0005 (***) using a mixed-effect model is indicated as shaded boxes at the top and bottom of the panels: comparing circumferential over radial enrichment for either the wild-type or hkb−/− mutants. (H) Analysis of cell shape aspect ratio dynamics in cells far from the pit (eccentric pit for wild-type, cental pit for hkb−/− mutant). In the wild-type, circumferential elongation as part of active circumferential neighbor gains (Sanchez-Corrales et al., 2018) persist until ~t=+20 min, when cells start to become elongated radially (gray curve). In hkb−/− mutants, cells become and remain circumferentially elongated (magenta curve). Data shown for seven wild-type and five hkb−/− mutant movies. (I–L) Analysis of an exemplary cell intercalation event in cells far from the pit in a segmented and tracked time-lapse movie of a hkb−/− mutant placode, stills at the beginning and end of the event shown are in (I), and stills of the whole event in (J). (K) Cells 1 and 2 gain a circumferential contact, mainly via cell elongation. (L) The cell cluster is already circumferentially elongated at t=+14:54 min (black outline) and remains near identically elongated at t=+26:49 min (orange outline). Data for (A–H) pooled from nine wild-type and five hkb−/− mutant movies. In all analyses of the wild-type, t=0 min is defined as the frame just before the first sign of invagination at the future pit was evident. hkb−/− mutants were aligned using as a reference of embryo development the level of invagination of the tracheal pits that are not affected in the hkb−/− mutant as well as other morphological markers such as appearance and depth of segmental grooves in the embryo. Panels (A, A’, B, B’, F, G) are expressed as proportion per minute (pp/min).
Figure 4—figure supplement 1
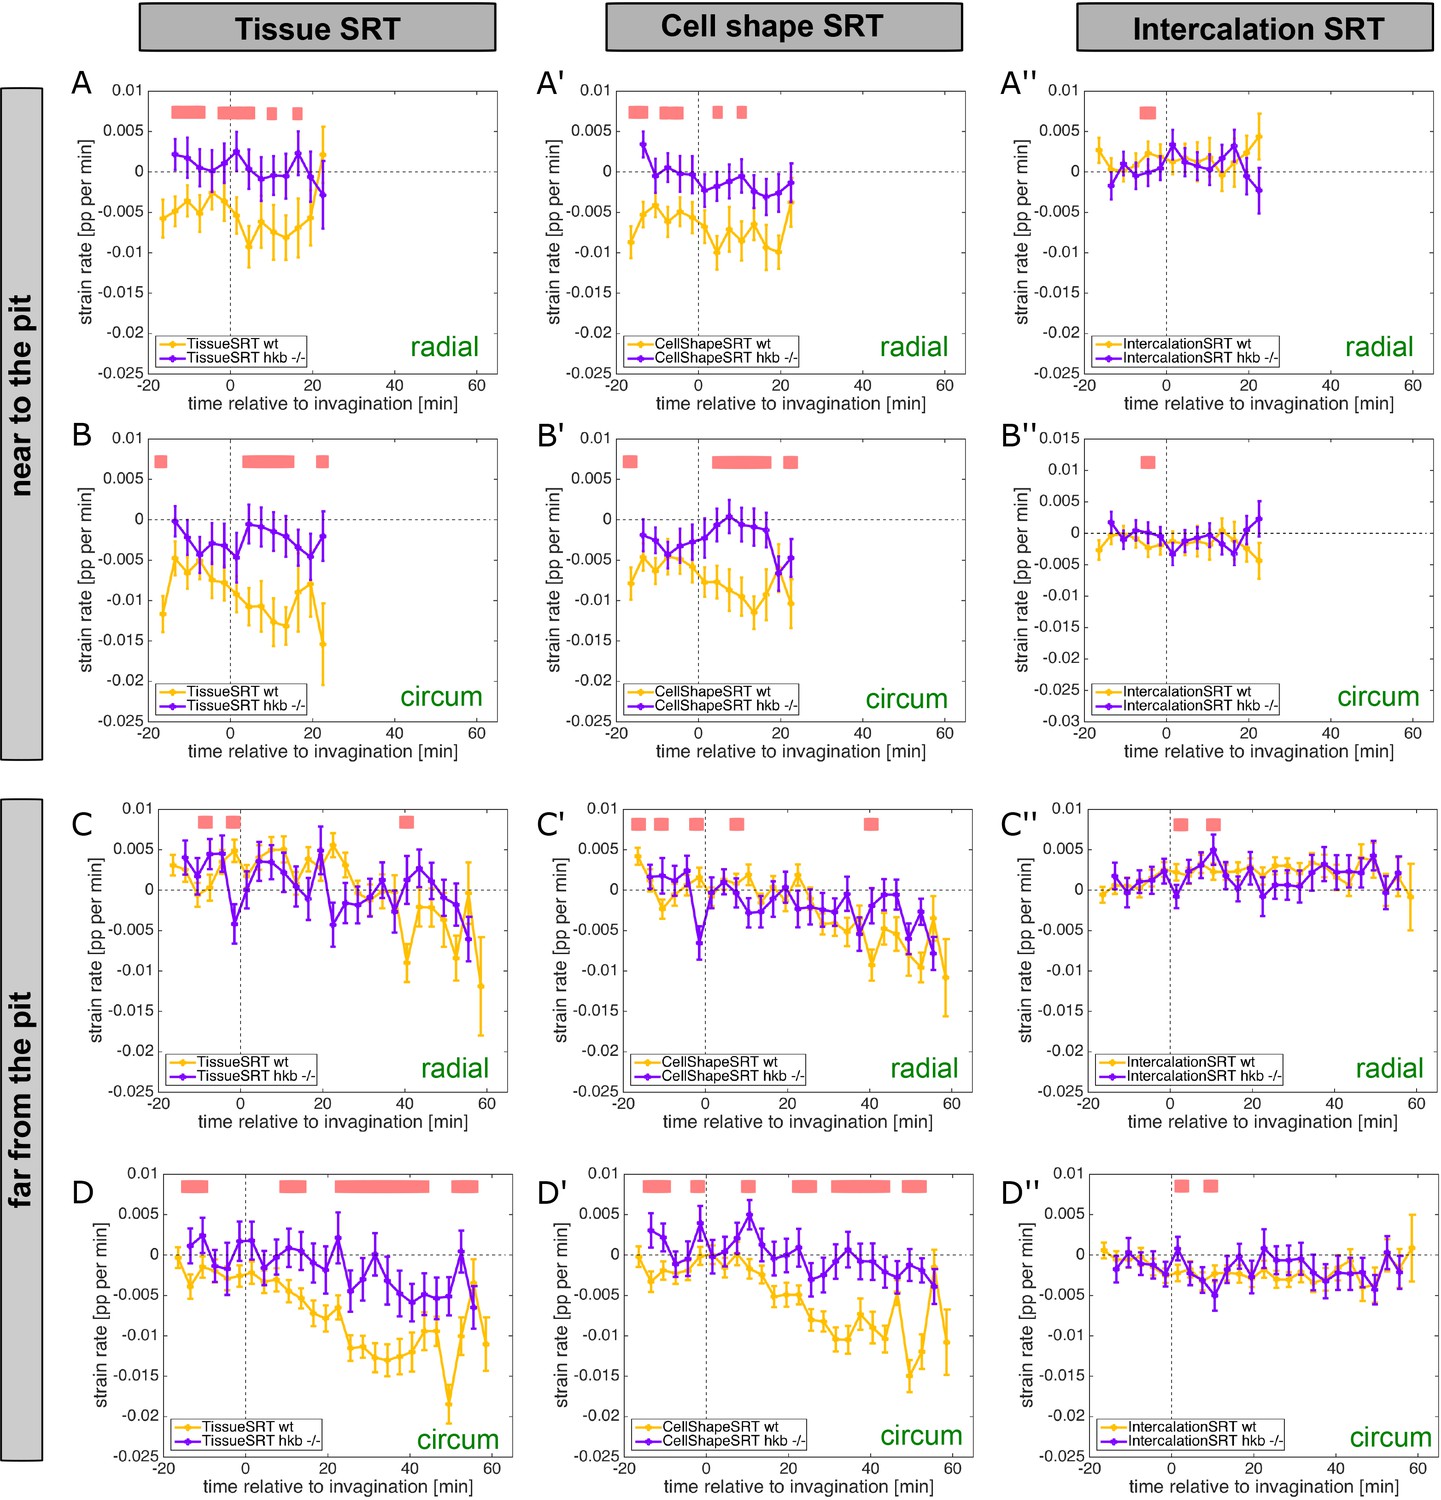
hkb−/− mutants show aberrant cell behaviors.
(A–D’’) Instantaneous strain rates relating to the cumulative strain rates shown in Figure 4A–B’. Panels for cell near the pit and far from the pit are shown, with an eccentric pit for the wild-type and a central pit for the hkb−/− mutant. Instantaneous strain rates are split into tissue, cell shape, and intercalation strain rate tensors, as well as the radial and circumferential contributions. Regions of statistically significant differences (p<0.05) are indicated by pink bars above the curves, and significance was determined using mixed-effects model. In all analyses of the wild-type, t=0 min is defined as the frame just before the first sign of invagination at the future pit was evident. hkb−/− mutants were aligned using as a reference of embryo development the level of invagination of the tracheal pits that are not affected in the hkb−/− mutant as well as other morphological markers such as appearance and depth of segmental grooves in the embryo.
Figure 5 with 3 supplements
The salivary gland placodal primordium is asymmetrically patterned by Hkb and Fkh prior to morphogenesis.
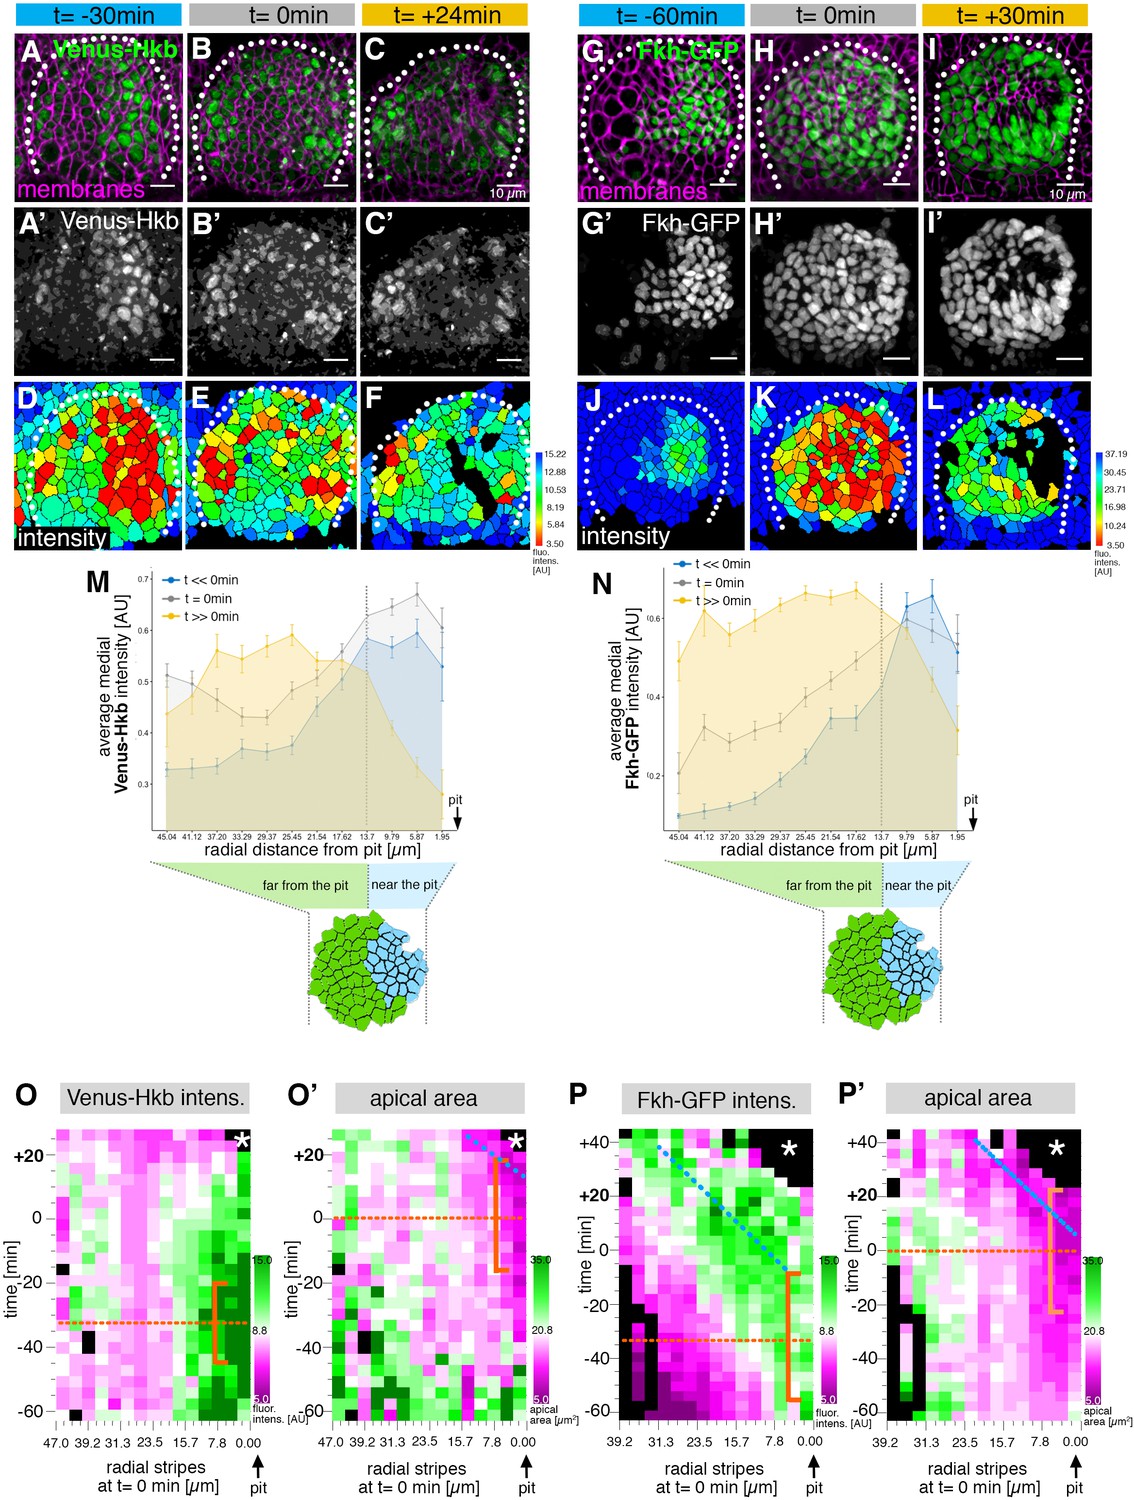
(A–F) Stills of a time-lapse movie of embryos with endogenously tagged Hkb, Venus-Hkb, at t=–38 min, +0 min and +38 min show the dynamic pattern of expression of Hkb. Expression starts at the posterior corner before tissue bending commences. Cell membranes are in magenta in (A–C), Venus-Hkb is green in (A–C) and as a single channel in (A’–C’). (D–F) show the quantification of Venus-Hkb fluorescence intensity at these time points. (G–L) Stills of a time-lapse movie of embryos with Fkh tagged by GFP under endogenous expression control, at t=–60 min, +0 min and +30 min show that as early as 1 hr before tissue bending, Fkh is already expressed at the posterior corner. Cell membranes are in magenta in (G–I), Fkh-GFP is green in (G–I) and as a single channel in (G’–I’). (J–L) show the quantification of Fkh-GFP fluorescence intensity at these time points. (M) Venus-Hkb expression starts at the posterior corner in a region similar to ‘near the pit’ population (between pit location and dashed line). At the start of invagination (around t=0 min) the expression increases across the placode, in particular at the anterior edge. At late stages, the level of Venus-Hkb expression decreases in the pit region, but it remains high in the rest of the placode. Data is pooled from selected frames of time-lapse movies and corresponding fixed samples. Number of cells are as follows: t<<0 min (equivalent to stage 10), n=777 cells from eight embryos; t=0 min (equivalent to early stage 11), n=1186 cells from 10 embryos and t>>0 min (equivalent to late stage 11/early stage 12), n=885 cells from 10 embryos. (N) Fkh-GFP expression initiates at the posterior corner and increases to cover the whole placode over time. Data is pooled from selected frames of time-lapse movies and corresponding fixed samples. Number of cells are as follows: t<<0 min (equivalent to stage 10), n=365 cells from four embryos; t=0 min (equivalent to early stage 11), n=1026 cells from nine embryos and t>>0 min (equivalent to late stage 11/early stage 12), n=659 cells from nine embryos. (O, O’) Spatial representation of the Venus-Hkb intensity (O) and apical area (O’) from an exemplary time-lapse movie of a wild-type embryo, with radial location (collapsed into stripes) of cells specified at t=0 min. The orange bracket in (O) marks the appearing peak of high Venus-Hkb intensity at the position of the eccentric pit, with the orange dotted line marking the highest point of intensity. The orange bracket in (O’) marks the appearing apical constriction at the position of the eccentric pit, with the orange dotted line marking the midway bracket point. The blue dotted line in (O’) marks where the smallest apical area begins to track in the near pit position (as shown in Figure 3G). (P, P’) Spatial representation of the Fkh-GFP intensity (P) and apical area (P’) from an exemplary time-lapse movie of a wild-type embryo, with radial location (collapsed into stripes) of cells specified at t=0 min. The orange bracket in (P) marks the appearing peak of high Fkh-GFP intensity at the position of the eccentric pit, with the orange dotted line marking the highest point of intensity. The orange bracket in (P’) marks the appearing strongest apical constriction at the position of the eccentric pit, with the orange dotted line marking the midway bracket point. The blue dotted lines in (P) and (P’) mark where the Fkh-GFP intensity and the smallest apical area begin to track in the near pit position. In all analyses, t=0 min is defined as the frame just before the first sign of invagination at the future pit was evident. See also Figure 5—figure supplement 1.
Figure 5—figure supplement 1
The salivary gland placodal primordium is asymmetrically patterned by Hkb and Fkh prior to morphogenesis.
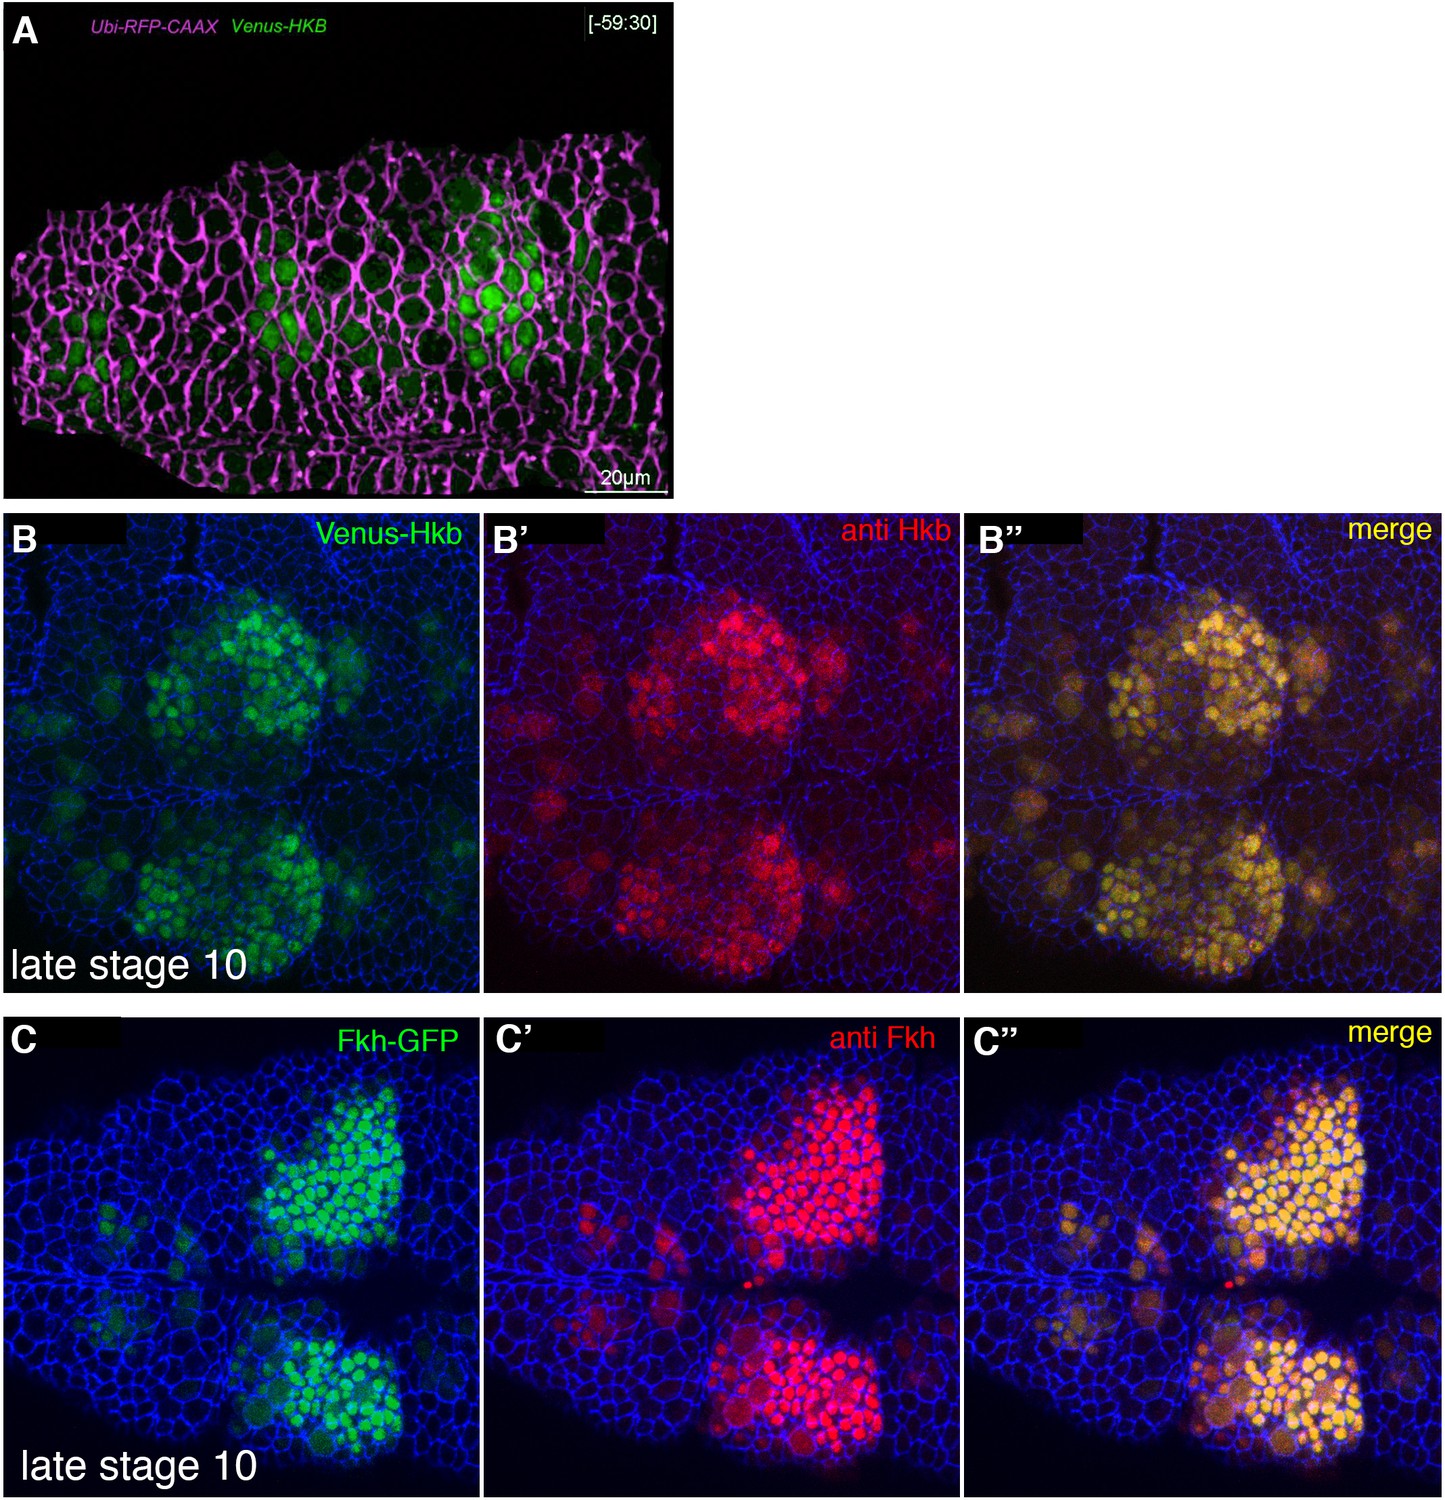
(A) Still of Figure 5—video 1 at t=–59.5 min. Cell membranes are shown in magenta, Venus-Hkb is in green. (B–B’) Comparison of Venus-Hkb (green in (B)) and anti-Hkb antibody staining (red in (B’)) at late stage 10. (B–B’) Comparison of Fkh-GFP (green in (B)) and anti-Fkh antibody staining (red in (B’)) at late stage 10.
Figure 5—video 1
Hkb dynamics in the placode.
Embryo of the genotype UbiRFP, Venus-Hkb to allow dynamic analysis of Hkb protein levels.
Figure 5—video 2
Fkh dynamics in the placode.
Embryo of the genotype UbiRFP, Fkh-GFP to allow dynamic analysis of Fkh protein levels.
Figure 6 with 1 supplement
Asymmetric Fog expression is controlled by Hkb and Fkh upstream of early differential behaviors in the placode.
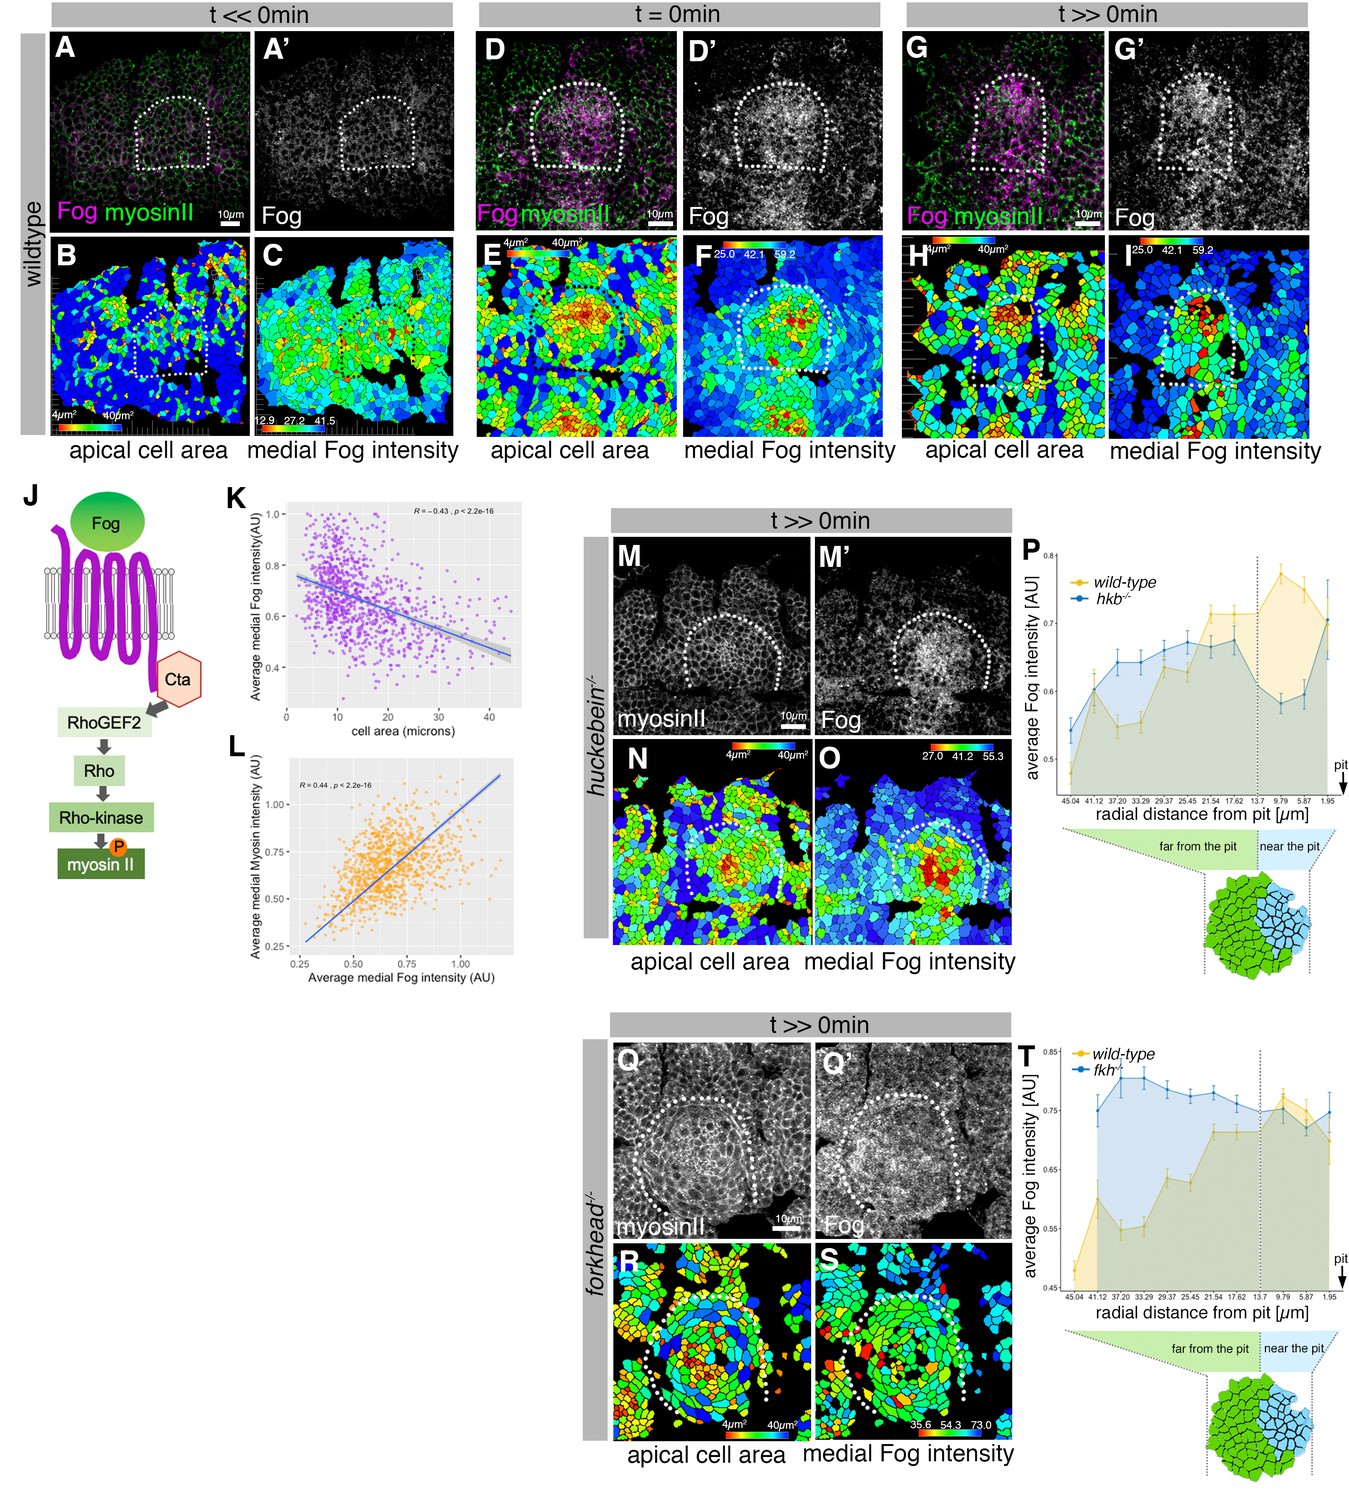
(A–I) Wild-type embryos labeled for Fog protein (the ligand to the GPCR upstream of Rho-dependent myosin II activation, (J)) and myosin II, visualized by SqhGFP. Fog is magenta in (A, D, G) and as a single channel in (A’, D’, G’), myosin II is green in (A, D, G). Also shown are corresponding quantifications of apical cell area (B, E, H) and average medial Fog fluorescence intensity (C, F, I). Time points analyzed were before any apical constriction and tissue bending commencing (t<<0 min; ~stage 10), at t=0 min (~early stage 11) and once invagination had commenced (t>>0 min; ~late stage 11/early stage 12). (J) Schematic of the GPCR pathway leading to myosin II activation. (K) Average medial Fog fluorescence intensity negatively correlates with apical cell area. Pearson coefficient r=–0.436; n=823 cells from seven embryos. (L) Average medial myosin II fluorescence intensity positively correlates with average medial Fog fluorescence intensity. Pearson coefficient r=0.439; n=823 cells from seven embryos. (M–O) In hkb−/− mutant embryos at a time point where invagination would have been well advanced in wild-type embryos (t>>0 min), medial myosin II (M) and Fog fluorescence ((M’) and quantified in (O)) are concentrated in cells in the center of the placode, where cells also show constricted apices (N). (P) Quantification of average medial Fog fluorescence intensity according to radial position in wild-type versus hkb−/− mutant embryos. Whereas in the wild-type Fog intensity peaks at the posterior end of the placode where the invagination pit forms, in hkb−/− mutant embryos Fog is dramatically reduced at the invagination pit. Number of cells: wild-type n=823 from seven embryos; hkb−/− n=765 cells from five embryos. (Q–S) In fkh−/− mutant embryos at a time point where invagination would have well advanced in wild-type embryos (t>>0 min), medial myosin II (Q) and Fog fluorescence ((Q’) and quantified in (S)) are very homogenous across the placode and no longer enriched within the placode compared to the surrounding epidermis. Apical area quantification shows there is only a mild central cell constriction and no invagination (R). (T) Quantification of average medial Fog intensity in fkh−/− mutant embryos. In contrast to wild-type embryos with Fog enrichment at the posterior pit, levels of Fog are more homogenous in the placode in fkh−/− mutant embryos with an increase toward the anterior. Levels are comparable to the rest of the epidermis (see Figure 3—video 3). The intensity curves shown for wild-type and fkh−/− mutant embryos are comparable in their shape, though the absolute intensities shown are not directly comparable, as fluorescence intensity was normalized in each image by dividing the average fluorescence per cell by the 98th percentile value to account for embryo to embryo variability in staining efficiency. Number of cells: wild-type n=823 from seven embryos; fkh−/− mutant n=512 cells from five embryos. In all analyses of the wild-type, t=0 min is defined as the frame just before the first sign of invagination at the future pit was evident. hkb−/− mutants were aligned using as a reference of embryo development the level of invagination of the tracheal pits that are not affected in the hkb−/− mutant as well as other morphological markers such as appearance and depth of segmental grooves in the embryo. See also Figure 6—figure supplement 1.
Figure 6—figure supplement 1

Asymmetric Fog expression is controlled by Hkb and Fkh and is upstream of early differential behaviors in the placode.
(A–C) Wild-type embryos expressing sqhGFP were analyzed before, at initiation of, and well beyond the start of pit invagination and medial myosin II intensity quantified per cell. (D–D’’) anti-Fog antibody labeling (green in (D) and (D’)) in a fkh−/− mutant embryo, showing no increased Fog accumulation in the placode over the surrounding epidermis. Cell membranes are in magenta in (D) and in (D’’). (E–J’) Analysis of Fkh levels and localization pattern in control and hkb−/− mutant embryos. (E–F’) show two examples of control Fkh pattern at late stage 10, (G, G’) at stage 11. (H–I’) show two examples of Fkh pattern in hkb−/− mutant embryos at late stage 10, (J, J’) at stage 11. Anti-Fkh staining is in red, cell outlines are labeled by anti-phospho-tyrosine in blue and GFP from the balancer chromosome identifying control embryos is shown in green. (K-N’) Analysis of Hkb levels and localization pattern in control and fkh−/− mutant embryos. (K–L’) show two examples of control Fkh pattern at late stage 10 (H, H’) and early stage 11 (L, L’). (M–N’) show two examples of Hkb levels and localization pattern in fkh−/− mutant embryos at late stage 10 (M, M’) and early stage 11 (N, N’). Anti-Hkb staining is in red, cell outlines are labeled by anti-phospho-tyrosine in blue, and GFP from the balancer chromosome identifying control embryos is shown in green. The boundaries of placodes are indicated by dotted lines.
Figure 7 with 2 supplements
Changes to asymmetric placode patterning and invagination pit shape lead to misshapen organs.
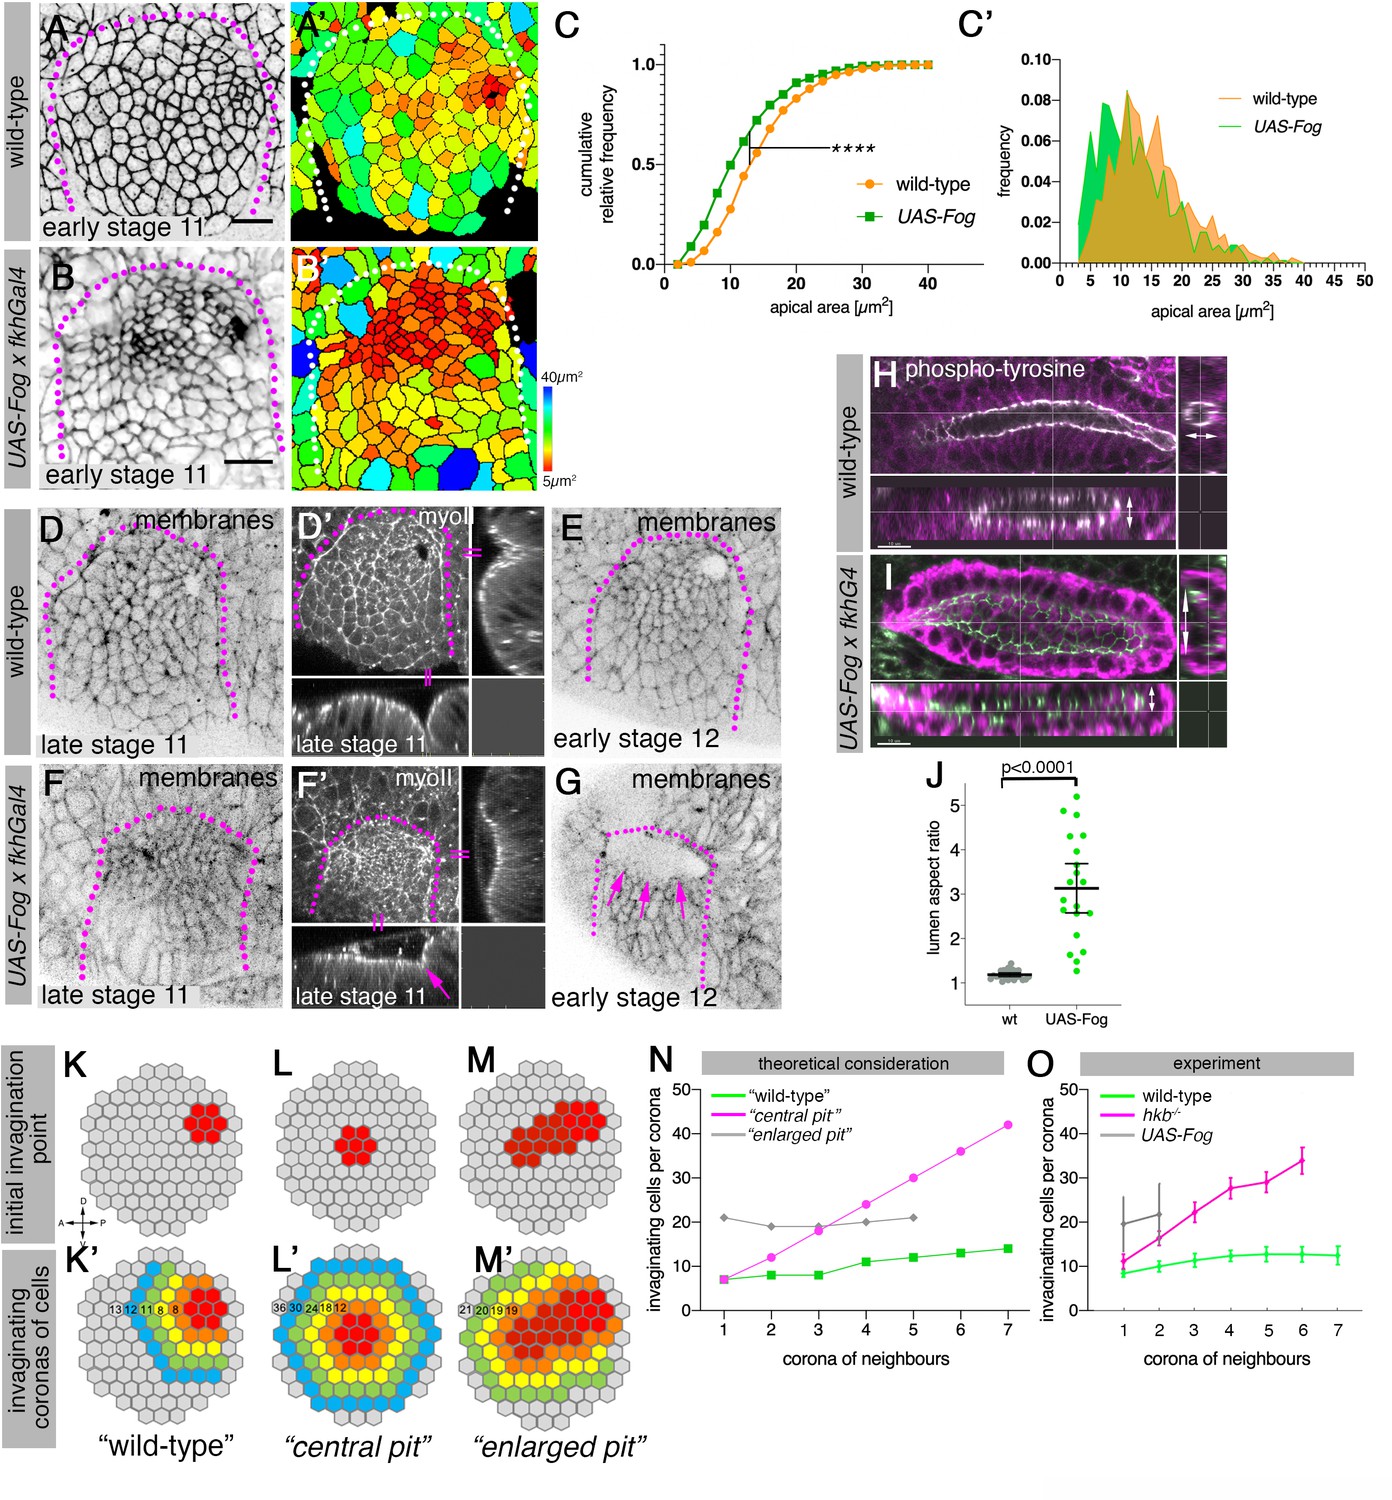
(A–C’) Whereas in wild-type placodes (A, A’) apical constriction commences only at the dorsal-posterior corner prior to the start of pit invagination, in placodes where Fog is overexpressed (using UAS-Fog x fkhGal4; B, B’) excess apical constriction occurs all across the dorsal side of the placode. (A, B) show cell apices labeled by anti-phospho-tyrosine labelling, (A’, B’) show apical area size. Colored scale for cell area as in Figure 1. (C, C’) Widening the Fog expression domain leads to significantly more constricted apices: cell area distribution of UAS-Fog x fkhGal4 differs from wild-type (Kolmogorov-Smirnov test, p<0.0001). Number of cells: wild-type, n=771 from seven embryos; UAS-Fog x fkhGal4, n=788 from five embryos. (D–G) In contrast to the narrow symmetrical pit and early invagination in wild-type placodes (D-D’), in UAS-Fog x fkhGal4 placodes cells in the whole Fog-overexpression domain constrict and initially start to form a large shallow depression (F, F’). (D–G) are stills from time-lapse movies, with (D’) and (F’) showing surface view and xz/yz-cross sections, the arrow in (F’) points to the corner from where cells start to invaginate. In comparison to the small opening of the invagination observed in wild-type placodes at stage 12 (E), the initial large depression is still present in UAS-Fog x fkhGal4 placodes at stage 12 whilst cells invaginate through a large pit ((G); magenta arrows). (H–J) At late stage 15, early stage 16, when salivary gland invagination and morphogenesis has finished, the final shape, and in particular lumen shape, of salivary gland cells overexpressing Fog (I); (UAS-Fog x fkhGal4) is altered compared to wild-type controls (H). Apical adherens junctions are marked by phospho-tyrosine labelling (white). Glands are shown in three orthogonal cross-sections. (J) Quantification of lumen aspect ratio, allowing identification of altered tube shapes such as widened tubes (Mann-Whitney test, p<0.0001; wild-type: n=23 embryos, UAS-Fog x fkhGal4 n=20 embryos). (K–O) Theoretical considerations and experimental test on how altering the shape and size of the original invagination pit will affect the geometry and shape of the invaginating and invaginated tube. (K, K’) In the wild-type, a focussed eccentric pit (red in (K)) leads to similar numbers (K’) of cells invaginating within each corona even in the absence of any cell rearrangements (green curve in (N)). (L, L’) A central pit would lead to an increasing number of cells invaginating in each corona, leading to a widening tube (magenta curve in (N)). (M, M’) An enlarged initial pit would lead to an increased but steady number of cells (M’) invaginating (gray curve in (N)), again leading to a tube with enlarged lumen. Numbers of cells per corona are indicated. (O) Experimental test of the number of cells per invaginating corona in wild-type placodes or when the pit is central (hkb−/− mutant embryos) or the pit is enlarged, covering eccentric and central position (UAS-Fog x fkhGal4 embryos). Shown are mean and SD of n=30, n=11, and n=5 for wild-type, hkb−/− mutant and UAS-Fog x fkhGal4 embryos, respectively. See also Figure 7—figure supplements 1 and 2.
Figure 7—figure supplement 1
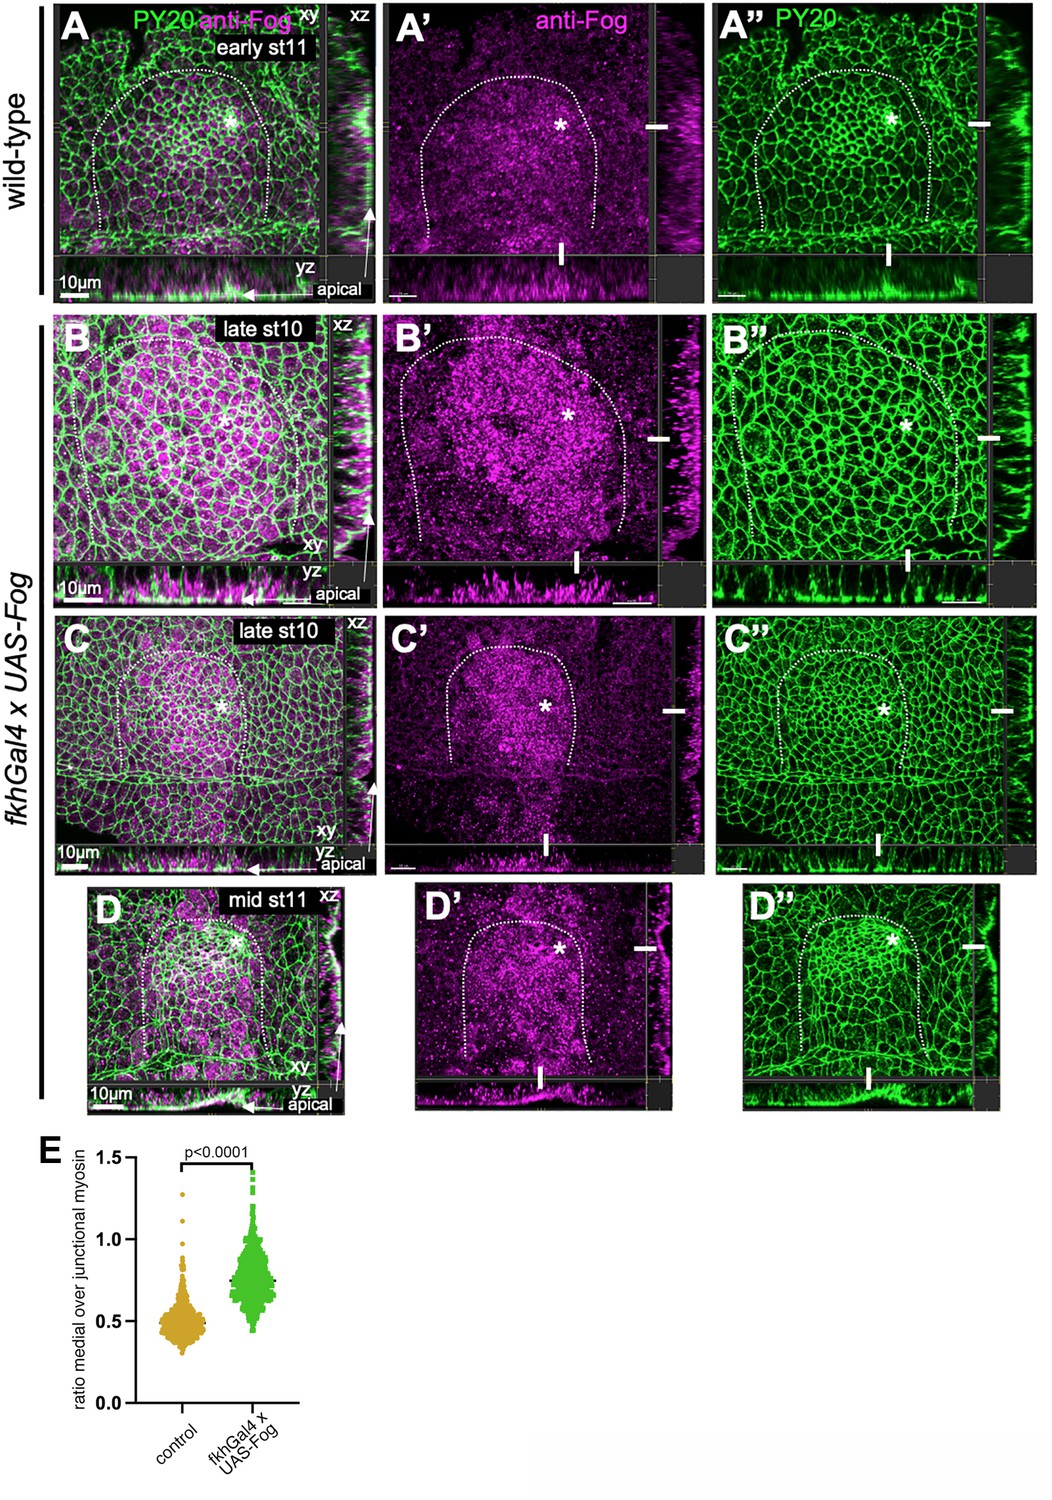
Fog overexpression in the salivary gland placode.
(A–A’’) In wild-type placodes at early stage 11, when tissue bending has just commenced (visible in the cross-sections, apical side is indicated, the white bars indicate the positions of the cross-section panels) Fog protein is most concentrated in cells near the pit and located in vesicles near the apical side. (B–C’’) In UAS-Fog x fkhGal4 embryos overexpressing Fog, already at late stage 10 (i.e., earlier than in panels (A–A’’)) Fog protein is found at very high levels and very homogeneously across the placode (with the exception of a few anterior cells where fkhGal4-driven expression usually increases slightly later). Cross-sections reveal that all cells show higher levels of Fog in vesicular structures, again mostly homogeneously across the placode in contrast to the gradient of Fog intensity observed in the wild-type. (D–D’’) At mid-stage 11, a very wide invagination has formed in UAS-Fog x fkhGal4 (as also shown in Figure 7E and F) and Fog levels remain increased and homogeneous across the placode. In (A–D’’), cell outlines are in green using labeling of junctional phosphotyrosine (PY20), anti-Fog antibody labeling is in magenta. White dotted lines indicate the boundary of the placode, the asterisks indicate the position of the (future) invagination point. (E) Quantification of medial myosin intensity in control embryos compared to embryos that overexpress Fog (UAS-Fog x fkhGal4). Shown is the ratio of medial to junctional myosin for individual cells to account for embryo-to-embryo differences.
Figure 7—figure supplement 2
Overepression of Fkh in the salivary gland placode.
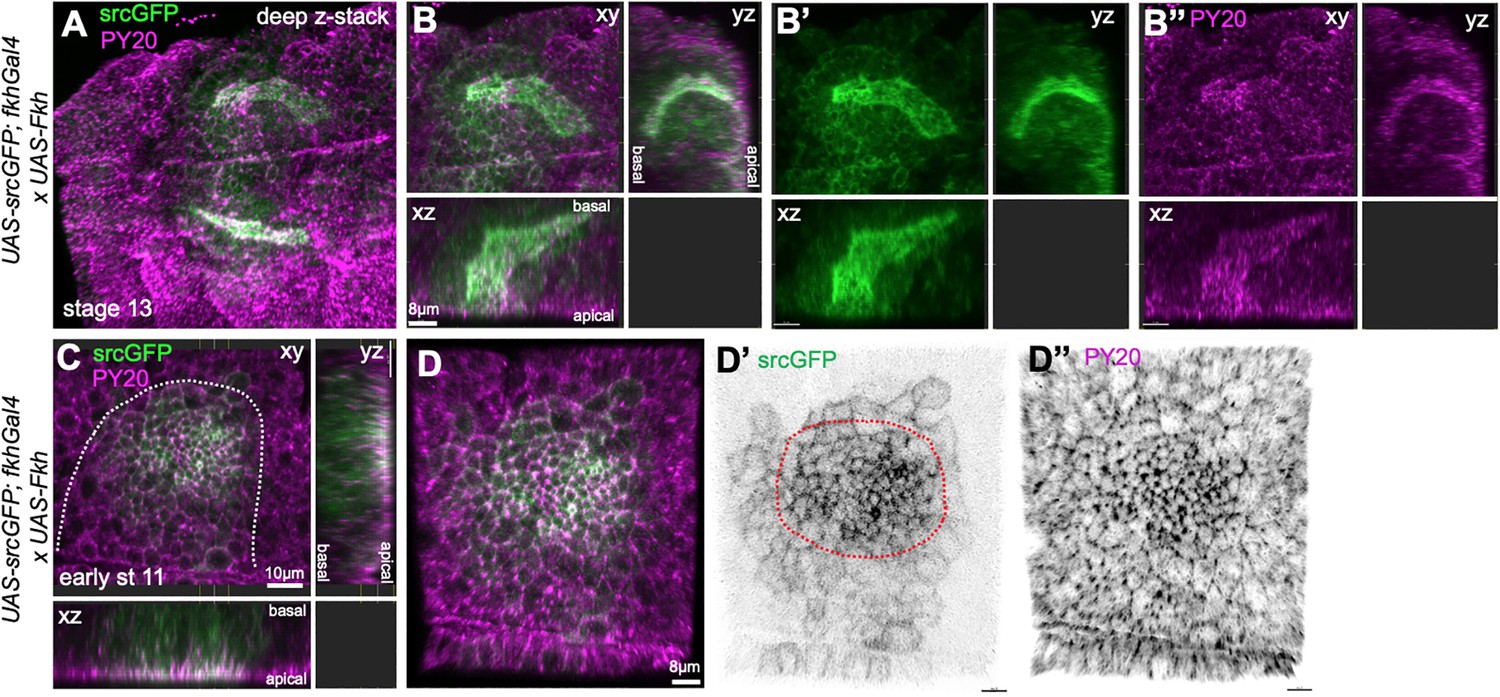
(A–B’’) Embryos overexpressing Fkh across the placode, using UAS-Fkh x fkhGal4 UAS-srcGFP, show highly aberrant lumen shapes at stage 13 when all secretory cells have invaginated. (A) A stage 13, embryo with two glands with highly inflated lumens marked by apical-lateral srcGFP (green) and PY20, labeling phosphotyrosine at adherens junctions (magenta). (B–B’’) show a deep z-stack projection as well as two orthogonal views of one of the glands shown in (A). (C–D’’) UAS-Fkh x fkhGal4 UAS-srcGFP glands at early stage 11, prior to any tissue bending, show an increased number of apically constricted cells compared to wild-type placodes, visible with both apical-junctional membrane markers, srcGFP (green) and PY20 (magenta). The dotted line marks the boundary of the placode.
Author response image 1
Comparison of endogenous Fkh protein and expression of transgenes via fkhGal4.
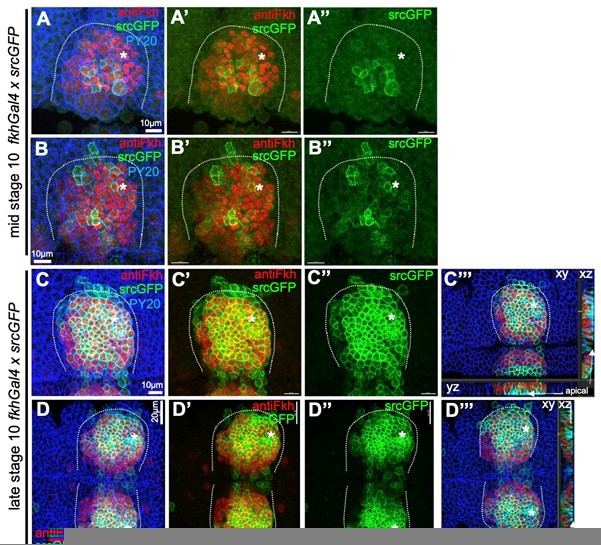
A-B’’ At mid stage 10, endogenous Fkh protein, revealed using an antibody against Fkh (red), is already spreading across the placode from the initial expression at the forming pit position (asterisks in all panels mark the position of the future pit). At this stage, a srcGFP transgene (green) expressed under fkhGal4 control can be clearly identified to begin to be expressed in central cells of the placode at varying levels. C-D’’’ At late stage 10, when endogenous Fkh protein (red) is seen in all secretory placodal cells but constriction near the forming invagination point is only just beginning and there is no tissue bending yet (see cross section panels in C’’’ and D’’’), srcGFP expression (green) driven by fkhGal4 is very strong in nearly all placodal cells, with only slightly lower levels in the most anterior cells. Note that the laser power used to reveal GFP was about 5 times higher for panels A-B’’ compared to panels C-D’’’. Cell outlines are marked by an antibody against junctional phosphotyrosine (PY20; blue).
Tables
Key resources table
| Reagent type (species) or resource | Designation | Source or reference | Identifiers | Additional information |
|---|---|---|---|---|
| Gene (Drosophila melanogaster) | Forkhead | GeneBank | FLYB:FBgn0000659 | |
| Gene (D. melanogaster) | Non-muscle myosin II /sqh | GeneBank | FLYB:FBgn0003514 | |
| Genetic reagent(D. melanogaster) | Armadillo-YFP | CPTI collectionPMID:25294944 | ||
| Genetic reagent (D. melanogaster) | fkh-Gal4 | PMID:10625560 | ||
| Genetic reagent (D. melanogaster) | UAS-Fog | PMID:16123312 | Gift from Thomas Lecuit | |
| Genetic reagent (D. melanogaster) | UAS-Cre | Bloomington Stock CenterBDSC:55801 | ||
| Genetic reagent (D. melanogaster) | UAS-Brainbow | PMID:22446736 | Gift from Stefan Luschnig | |
| Genetic reagent (D. melanogaster) | sqh[AX3]; sqh::sqhGFP42 | PMID:14657248 | ||
| Genetic reagent (D. melanogaster) | sqh[AX3];::sqhGFP42, UbiRFP-CAAX | Kyoto Drosophila Genomic Research Centre Number 109822PMID:30015616 | ||
| Genetic reagent (D. melanogaster) | Scribble-GFP | Kyoto Drosophila Genomic Research Centre | ||
| Genetic reagent (D. melanogaster) | Venus-Hkb | This study | See Materials and methods section for details | |
| Genetic reagent (D. melanogaster) | Fkh-GFP | Bloomington Stock CenterBDSC:43951 | ||
| Genetic reagent (D. melanogaster) | fkh[6] | Bloomington Drosophila Stock Center, PMID:2566386 | FLYB:FBal0004012 | |
| Genetic reagent (D. melanogaster) | hkb[2] | Bloomington Drosophila Stock CenterBDSC: 5457 | ||
| Antibody | Anti-DE-Cadherin (rat monoclonal) | Developmental Studies Hybridoma Bank at the University of Iowa | DSHB:DCAD2 | (1:10) |
| Antibody | PY-20, *P11120 (mouse monoclonal) | Transduction Laboratories | (1:500) | |
| Antibody | Anti-Fog (rabbit polyclonal) | PMID:24026125 | (1:1000) | |
| Antibody | Anti-Forkhead (guinea pig polyclonal) | PMID:2566386 | (1:2000) | |
| Antibody | Anti-Huckebein (rat polyclonal) | PMID:9056782 | (1:500) | |
| Antibody | Alexa Fluor 488/549/649-coupled secondary antibodies | Molecular Probes | (1:200) | |
| Antibody | Cy3-, Cy5-coupled secondary antibodies | Jackson ImmunoResearch | (1:200) | |
| Software, algorithm | otracks | PMID:19412170, PMID:24914560 | Software file (custom software written in IDL) | |
| Software, algorithm | nd-safir | PMID:19900849 | Denoising algorithm. Available at http://serpico.rennes.inria.fr/doku.php?id=software:nd-safir:index |
Table 1
Embryo genotypes as presented in figures.
| Genotype | Figure | Chromosome | Experiment type |
|---|---|---|---|
| Armadillo-YFP | 1 | 1 | Live-imaging |
| Armadillo-YFP;; sqhGFP42, UbiRFP/+ | 2 | 1,3 | Live-imaging |
| sqhAX3;sqhGFP; UbiRFP | 2 | 1,3 | Live-imaging |
| hkb[2] p’, ScribGFP | 3 | 3 | Live-imaging |
| sqhGFP42, UbiRFP; hkb[2] | 3 | 2,3 | Live-imaging |
| UbiRFP; VenusHkb | 4 | 2,3 | Live-imaging |
| UbiRFP; VenusHkb | 4 | 2,3 | Fixed samples |
| FkhGFP; wgGal4, UASpalmYFP, UbiRFP | 4 | 2,3 | Live-imaging |
| FkhGFP | 4 | 2 | Fixed samples |
| sqhAX3;sqhGFP; UbiRFP | 5 | 1,3 | Fixed samples |
| sqhGFP42, UbiRFP; hkb[2] | 5 | 2,3 | Fixed samples |
| sqhGFP42, UbiRFP; fkh[6] | 5 | 2,3 | Fixed samples |
| sqhAX3;sqhGFP; UbiRFP | 6 | 1,3 | Fixed samples |
| UAS-Fog; fkhGal4, sqhGFP42, UbiRFP | 6 | 2,3 | Fixed samples |
Additional files
Download links
A two-part list of links to download the article, or parts of the article, in various formats.
Downloads (link to download the article as PDF)
Open citations (links to open the citations from this article in various online reference manager services)
Cite this article (links to download the citations from this article in formats compatible with various reference manager tools)
Correct regionalization of a tissue primordium is essential for coordinated morphogenesis
eLife 10:e72369.
https://doi.org/10.7554/eLife.72369


