Deep-sequence phylogenetics to quantify patterns of HIV transmission in the context of a universal testing and treatment trial – BCPP/Ya Tsie trial
- Center for Communicable Disease Dynamics, Department of Epidemiology, Harvard T.H. Chan School of Public Health, Harvard University, United States
- Division of Molecular & Genomic Pathology, University of Pittsburgh Medical Center Presbyterian Shadyside, United States
- Oxford Big Data Institute, Li Ka Shing Center for Health Information and Discovery, Nuffield Department of Medicine, Old Road Campus, University of Oxford, United Kingdom
- Department of Biostatistics, Harvard T.H. Chan School of Public Health, Harvard University, United States
- Department of Statistics, The Wharton School, University of Pennsylvania, United States
- Harvard T.H. Chan School of Public Health AIDS Initiative, Department of Immunology and Infectious Disease, Harvard T.H. Chan School of Public Health, Harvard University, United States
- Botswana Harvard AIDS Institute Partnership, Botswana
- Division of Global HIV/AIDS and TB, Centers for Disease Control and Prevention, United States
- HIV Prevention Research Unit, Centers for Disease Control and Prevention, Botswana
- Ministry of Health, Republic of Botswana, Botswana
- Brigham and Women's Hospital, Division of Infectious Diseases, United States
Figures
Figure 1 with 2 supplements
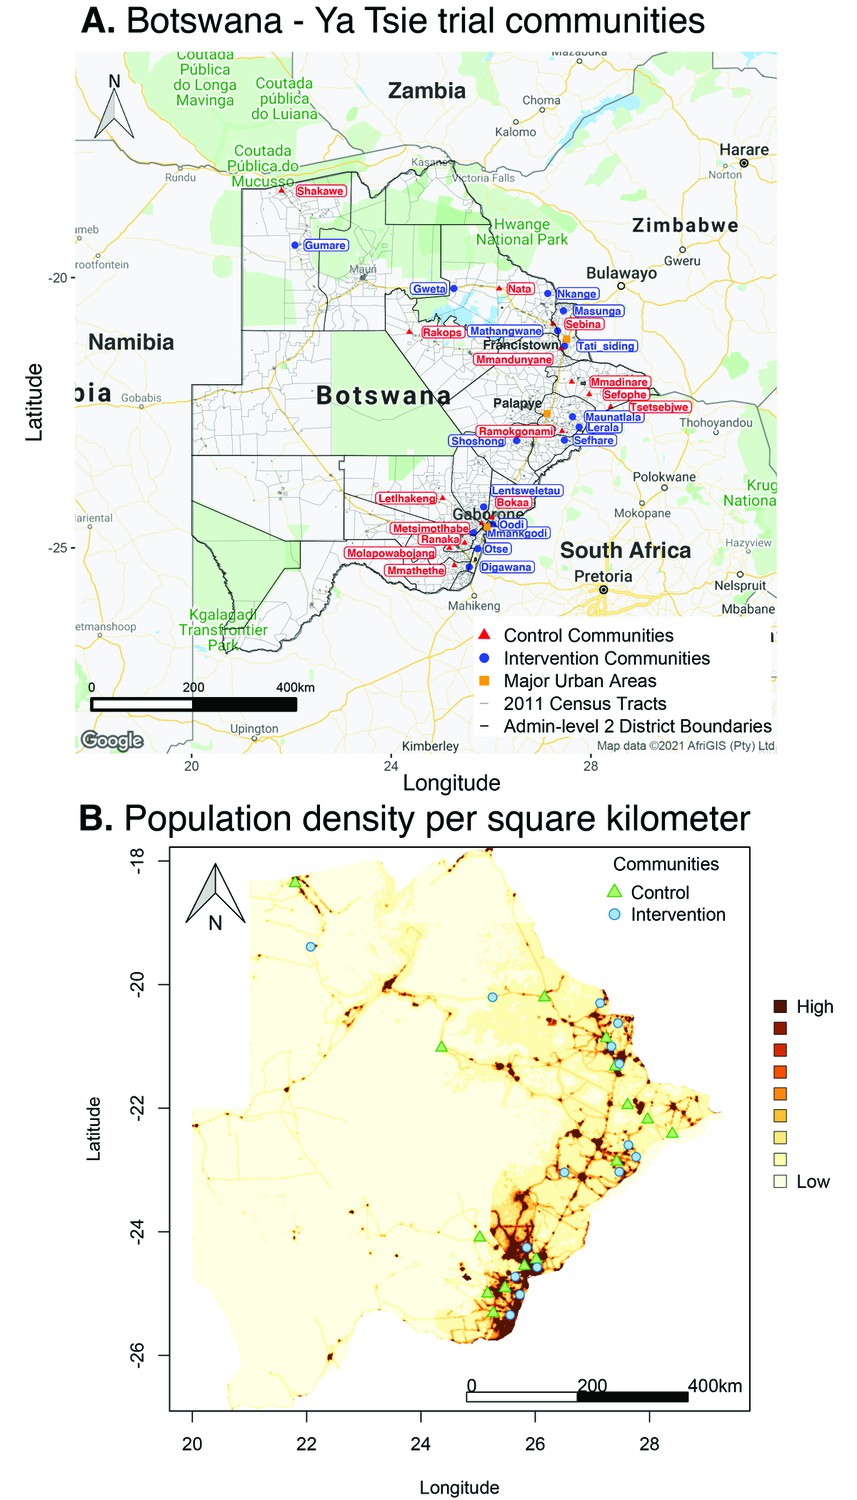
Location of 30 rural and peri-urban communities that participated in the Botswana/Ya Tsie trial.
(A) A map of Botswana showing the spatial distribution of intervention and control communities in the Botswana/Ya Tsie trial. Intervention communities are denoted by filled blue circles and control communities are represented by filled red triangles. Trial communities are shown in the context of level-2 administrative subdivisions (solid black lines) and 2011 census enumeration areas (solid gray lines). Major urban areas are symbolized as filled orange squares. (B) Spatial distribution of the estimated population density of persons per square kilometer in Botswana in 2011. Filled blue circles represent the location of intervention communities and filled green triangles denote control communities in the Botswana/Ya Tsie trial.
Figure 1—figure supplement 1
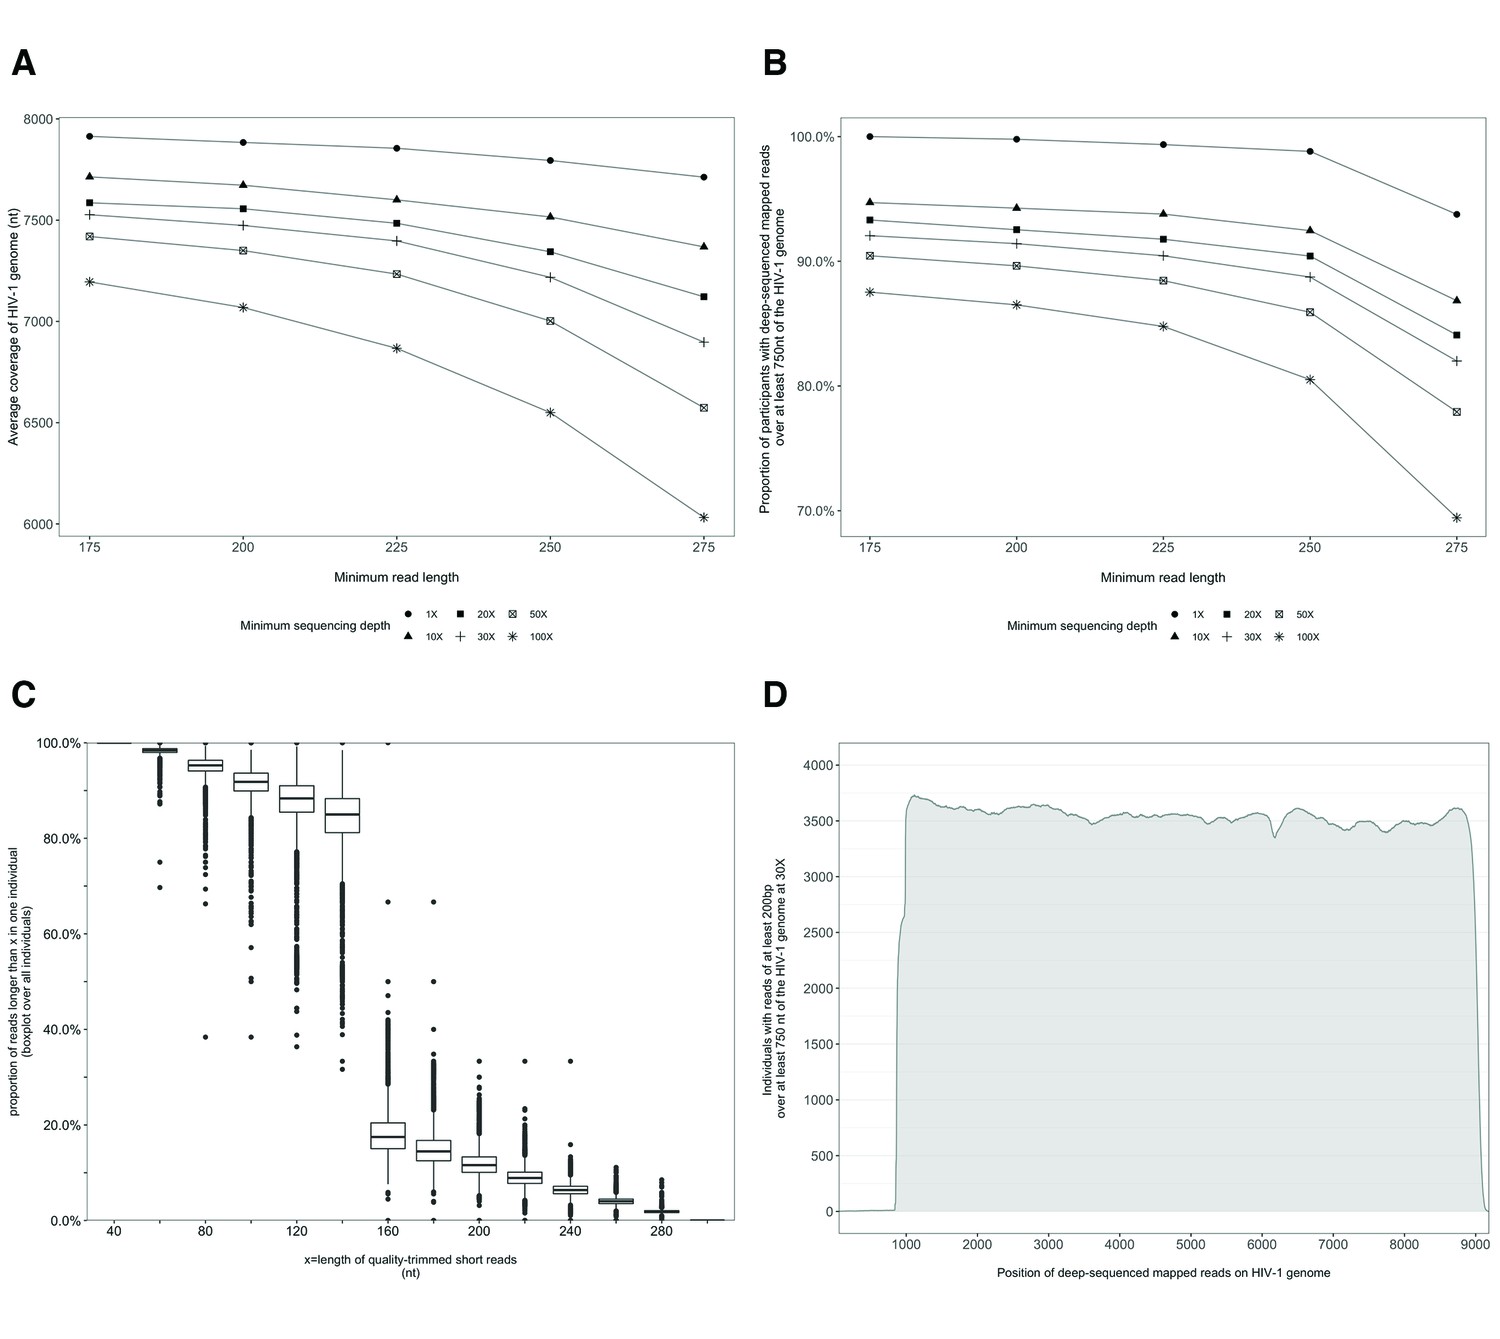
Characterization of deep-sequenced HIV-1 viral whole genomes of 4246 trial participants (88% had viral genomes sequenced from pro-viral DNA) sequenced at the Harvard biopolymers sequencing core facility.
Trial participants that consented to viral genotyping (n=5114) were sequenced at two locations, the Harvard biopolymers sequencing core facility in the United States (n=4246) and the Wellcome Trust Sanger Institute in the United Kingdom (n=868). Most trial participants were virally suppressed at the time of sampling; thus deep-sequencing of HIV-1 viral genomes was generally done on pro-viral DNA (Novitsky et al., 2015). Deep sequencing of viral genomes was performed with Illumina Miseq and Hiseq instruments. The resulting deep-sequencing reads were then assembled and mapped with the shiver sequence assembly software (Wymant et al., 2018a) against de-novo reference sequences tailored to each participant’s viral population. (A) Shows the length of the HIV-1 viral genome covered on average by deep-sequencing reads of varying minimum read lengths and sequencing depths; genome coverage dropped progressively beyond 200 nucleotides. (B) The proportion of participants with deep-sequenced mapped reads covering at least 750 nucleotides of the HIV-1 viral genome decreased with increasing minimum read length and depth of sequencing. (C) Read-length distribution of deep-sequenced mapped reads within an individual. (D) Distribution of participants with deep-sequencing mapped-reads at each position of the HIV-1 viral genome. Most participants sequenced to a depth of at least 30× with mapped reads that were at least 200-bp long and covered at least 750 nucleotides of the HIV-1 genome had reads distributed relatively uniformly along the HIV-1 genome.
Figure 1—figure supplement 2
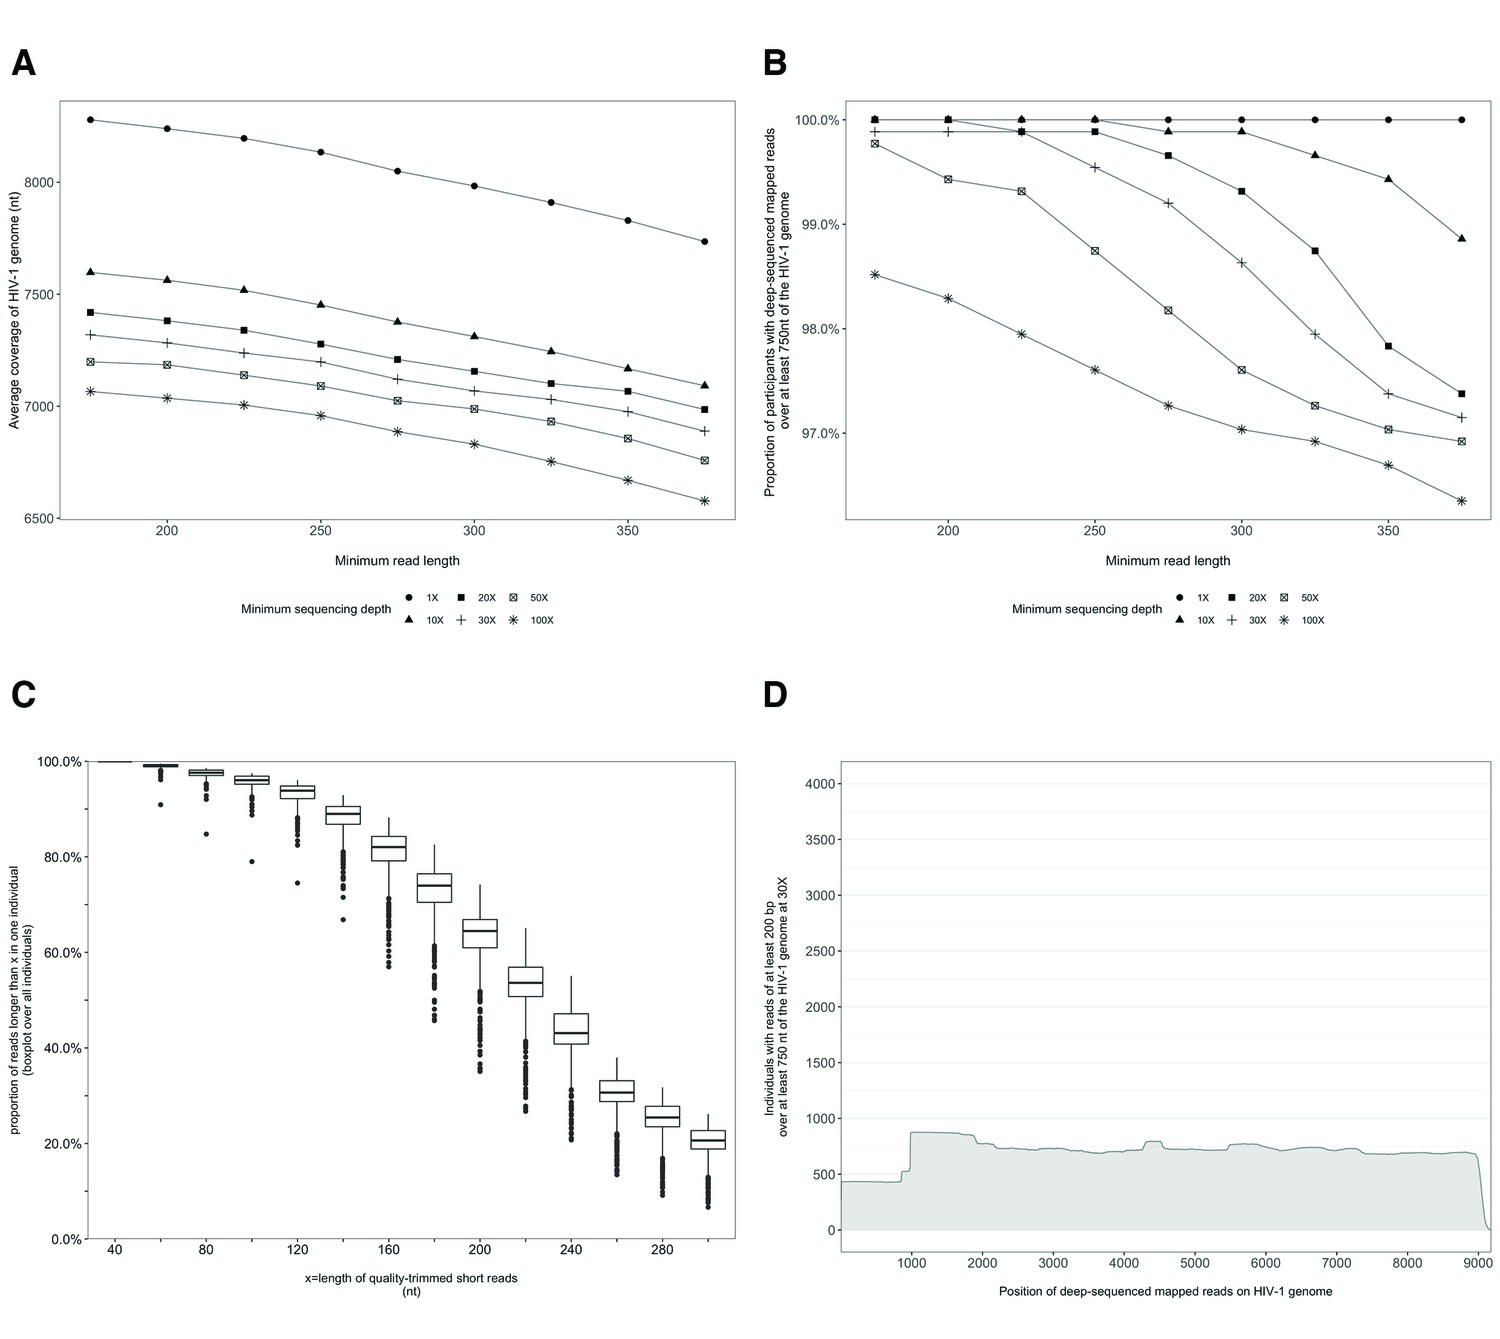
Characterization of deep-sequenced HIV-1 viral whole genomes of 868 trial participants (45% had viral genomes sequenced from pro-viral DNA) sequenced at the Wellcome Trust Sanger Institute.
Trial participants were sequenced as described in Figure 2. (A) Breadth of coverage of the HIV-1 viral genome for varying minimum read lengths and depths of sequencing. There was a marked decrease in average coverage of the HIV-1 genome at or above a sequencing depth of 10×. Furthermore, there was a progressive decline in average viral genome coverage beyond 200 nucleotides. (B) Proportion of participants with deep-sequencing mapped reads covering over 750 nucleotides of the HIV-1 genome decreased markedly with increasing minimum read lengths and sequencing depths. (C) Proportion of deep-sequenced mapped reads in an individual by read length. (D) Distribution of participants with deep-sequencing mapped-reads at each genome position. Most participants sequenced to a minimum depth of 30× and minimum read length of 200 bp with a genome coverage of at least 750 nucleotides had mapped reads covering the HIV-1 group-specific antigen (GAG) gene.
Figure 2
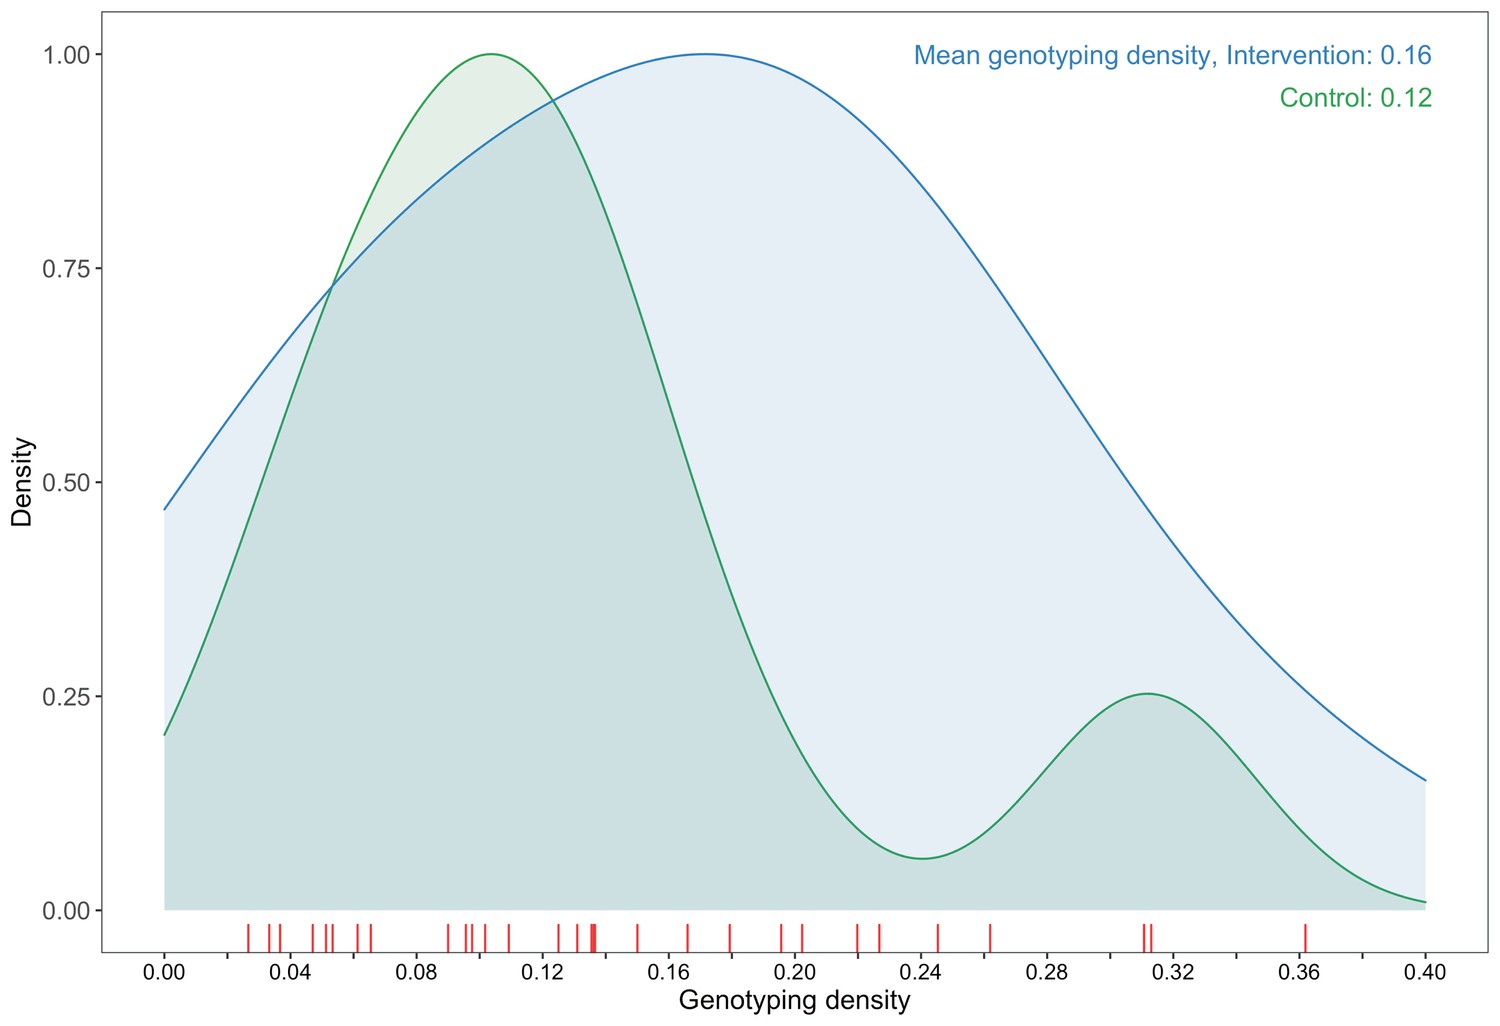
A plot comparing sampling densities of HIV-1 viral genomes in intervention and control communities in the Botswana/Ya Tsie trial.
Intervention communities (blue curve) were sampled more densely than control communities (green curve). Raw data points for the density plots are displayed as a rug-plot (red) on the x-axis. The overall genotyping density across all 30 trial communities was 14% (3832 / 27,446).
Figure 3
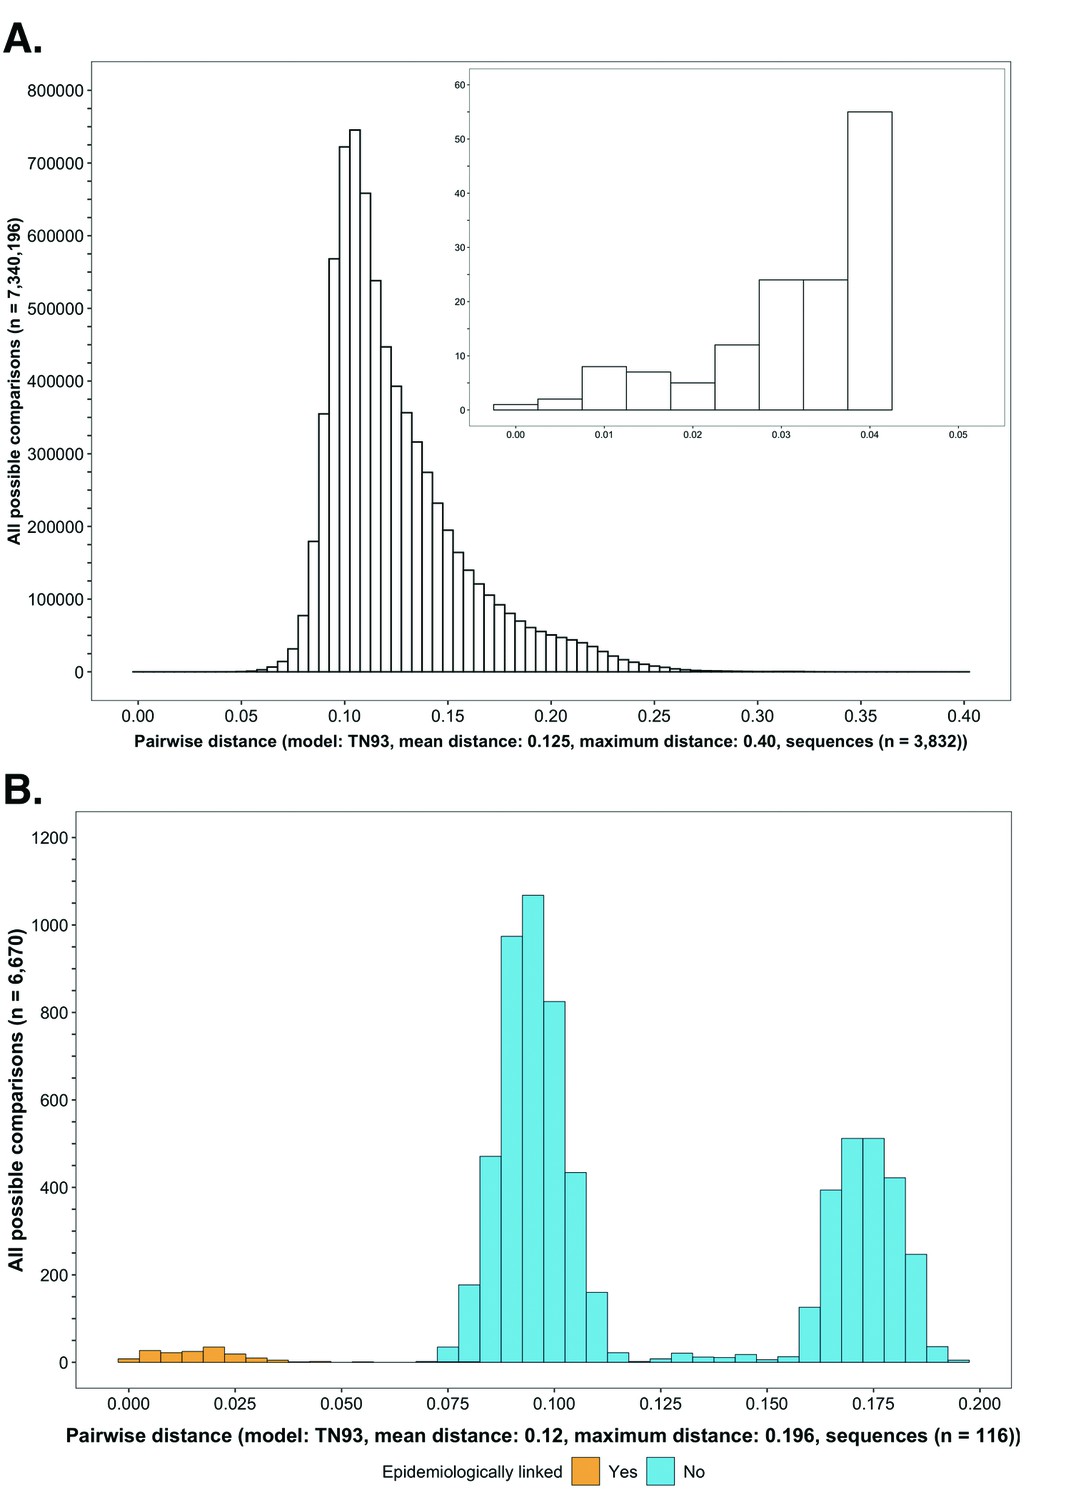
Histograms showing the distribution of genetic distances between HIV-1 viral whole-genome consensus sequences.
(A) A histogram showing the distribution of genetic distances between HIV-1 viral whole-genome consensus sequences of trial participants included in phylogenetic analyses. Out of the 5114 trial participants that consented to viral genotyping 3832 met criteria for inclusion in phylogenetic analyses; these were individuals whose viral genomes had fewer than 30% of the bases missing beyond the first 1000 nucleotides and a minimum genome length of 6300 nucleotides. Tamura-Nei 93 genetic distances were computed between HIV-1 viral whole-genome consensus sequences of all possible pairs (n = 7,340,196) of the 3832 trial participants available for phylogenetic analyses. To improve visibility pairwise genetic distances below 0.05 (5%) nucleotide substitutions per site are also shown in a zoomed-in plot. The mean (± standard deviation) pairwise distance separating sequences was 12.5 ± 3.0%, and the maximum pairwise distance was 40.0% substitutions per site. (B) A histogram showing the distribution of genetic distances between viral whole-genome consensus sequences of epidemiologically linked HIV-1 subtype-C couples in the HIV Prevention Trials Network 052 study. Tamura-Nei 93 genetic distances were computed between viral whole-genome consensus sequences of all possible pairs (n = 6670) of the 116 epidemiologically linked couples with HIV-1 subtype-C infections in the HIV Prevention Trials Network 052 study. Pairwise comparisons between epidemiologically linked sequences (yellow) and ones between epidemiologically unlinked sequences (blue) are highlighted in color. The mean (± standard deviation) pairwise distance separating the sequences was 12.0 ± 4.1%, and the maximum pairwise distance was 19.6% substitutions per site. Genetic distances separating viral sequences of most epidemiology-linked couples were below 5.0% substitutions per site.
Figure 4
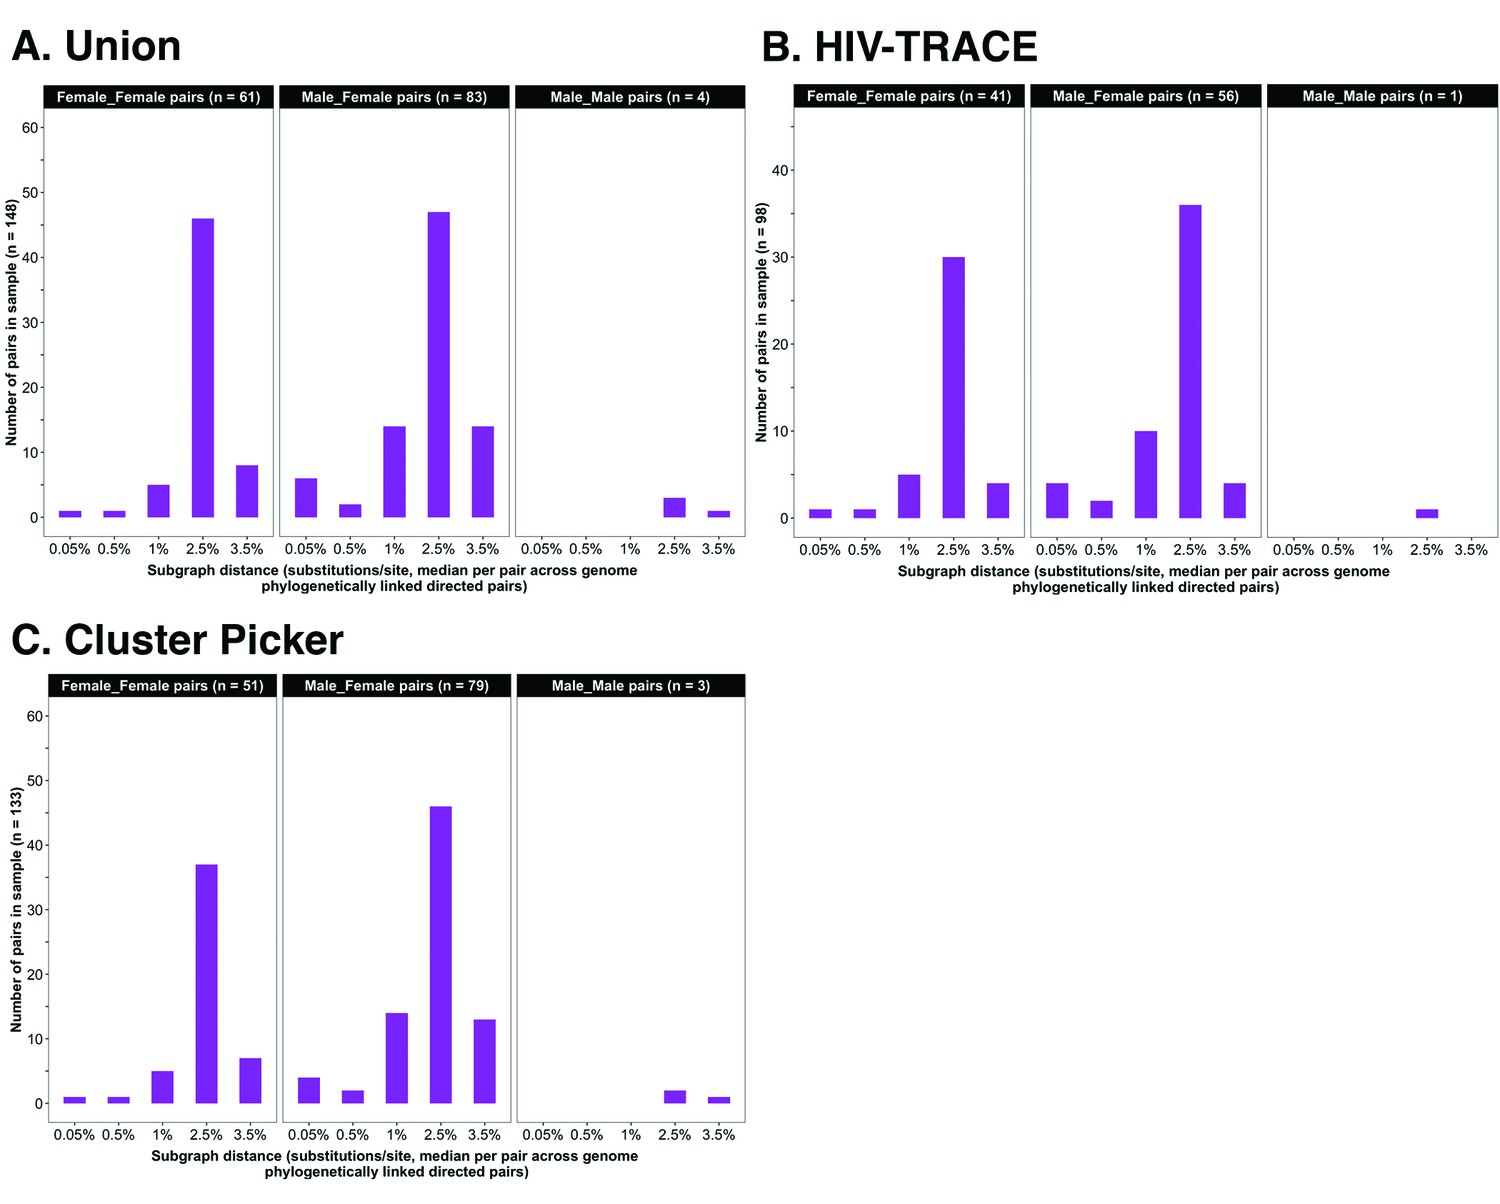
Barplots showing subgraph distance distributions between deep-sequenced HIV-1 viral whole genomes of trial participants in clusters of genetically similar HIV-1 infections.
Within each genetic cluster parsimony-based ancestral host state reconstruction was done with Phyloscanner (Grabowski et al., 2018; Ratmann et al., 2019; Wymant et al., 2018b) to identify probable transmission pairs and resolve the probable order of transmission events. Thereafter, within each identified genetic cluster, the median subgraph distance and most frequent subgraph topology between each pair of individuals were determined across all deep-sequence phylogenies along the genome where the pair had sufficient mapped reads for phylogenetic inference. A subgraph refers to all tips and internal nodes of a phylogeny assigned to an individual through parsimony-based ancestral state reconstruction. Subgraph distances were standardized to the mean rate of evolution for HIV-1 group-specific antigen (GAG) and polymerase (POL) genes to account for variation in mutation rates along the genome. The three panels show median subgraph distance distributions of pairs in the union (A) of genetic clusters detected with HIV-TRACE (B) and Cluster Picker (C) algorithms. Within each panel, phylogenetically linked pairs with an inferred direction of transmission are summarized into same-sex (male-male and female-female) and opposite-sex pairs (male-female). The subgraphs of deep-sequenced HIV-1 viral genomes of most phylogenetically linked directed pairs were separated by a patristic distance below 0.035 (3.5%). Same-sex pairs were presumed to be members of transmission chains with missing intermediates.
Figure 5
A dendogram showing clusters of genetically similar HIV-1 infections in the Botswana/Ya Tsie trial.
Genetic clusters are summarized by randomized-HIV-intervention condition, geographical region, and occurrence within and between trial communities. Clusters were identified from 3832 HIV-1 viral whole-genome consensus sequences as two or more sequences separated by a genetic distance not exceeding 0.045 (4.5%) substitutions per site and a bootstrap support threshold of at least 80%. More genetic clusters occurred within trial communities and geographical regions than between them.
Figure 6
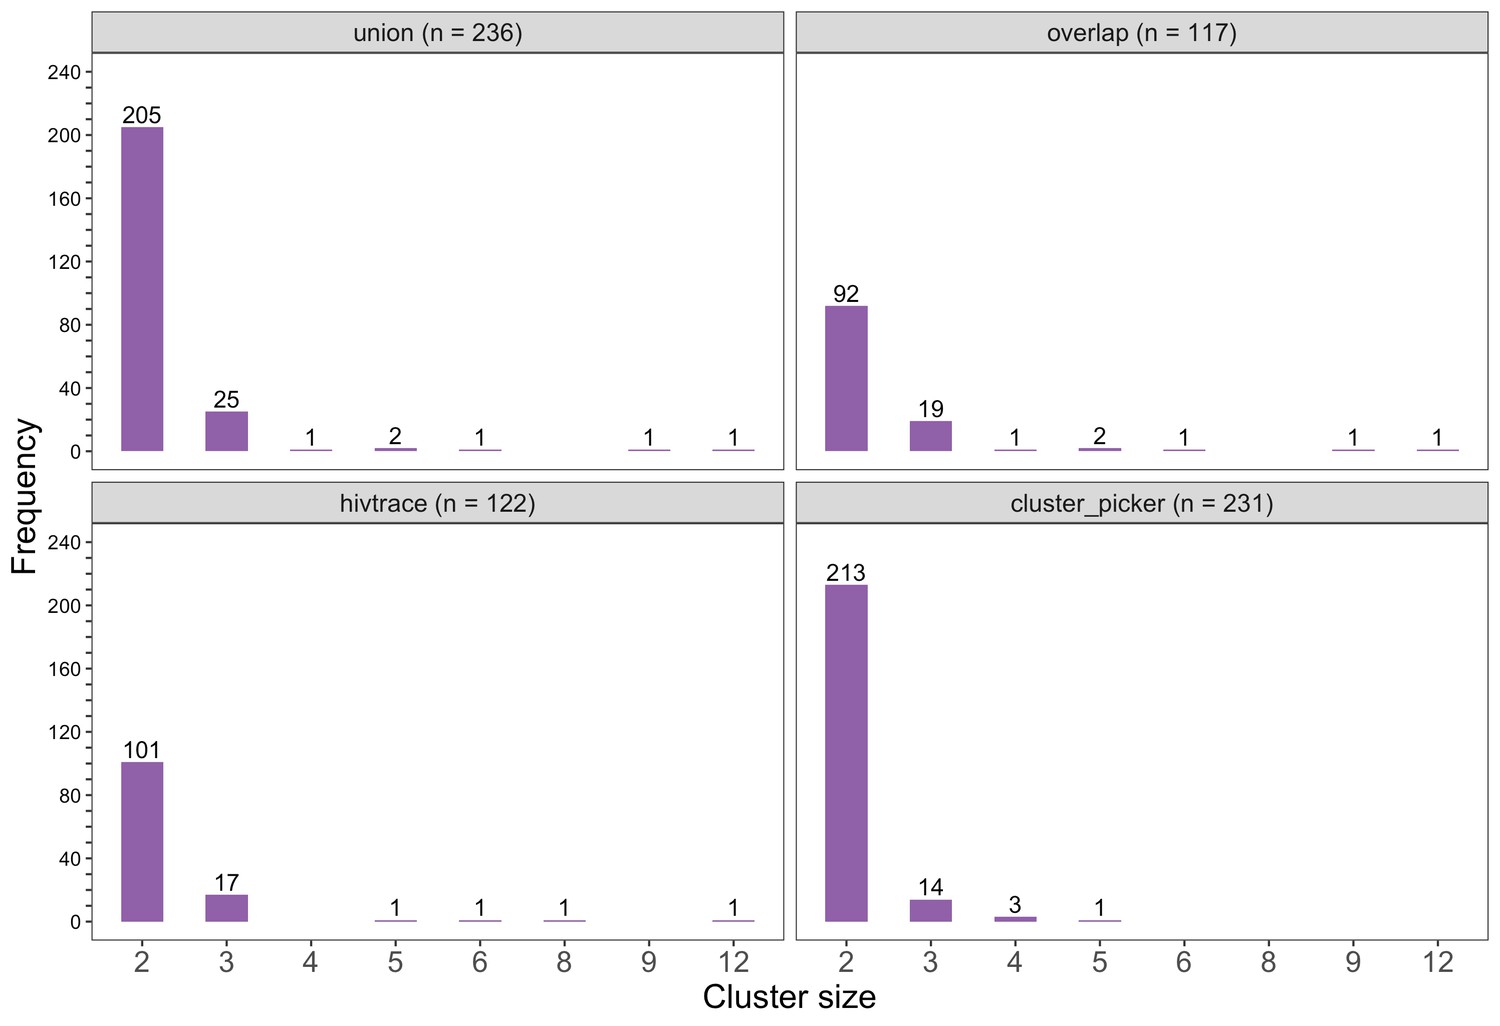
Barplots showing the size distribution of clusters of genetically similar HIV-1 infections in the Botswana/Ya Tsie trial.
The bottom two plots show the size distribution of genetic clusters identified with HIV-TRACE (n = 122) and Cluster Picker algorithms (n = 231), respectively; and the top two plots show the size distribution of the union (n = 236) and overlap (n = 117) of genetic clusters detected with HIV-TRACE and Cluster Picker. Most clusters were small-sized comprising two or three members.
Figure 7
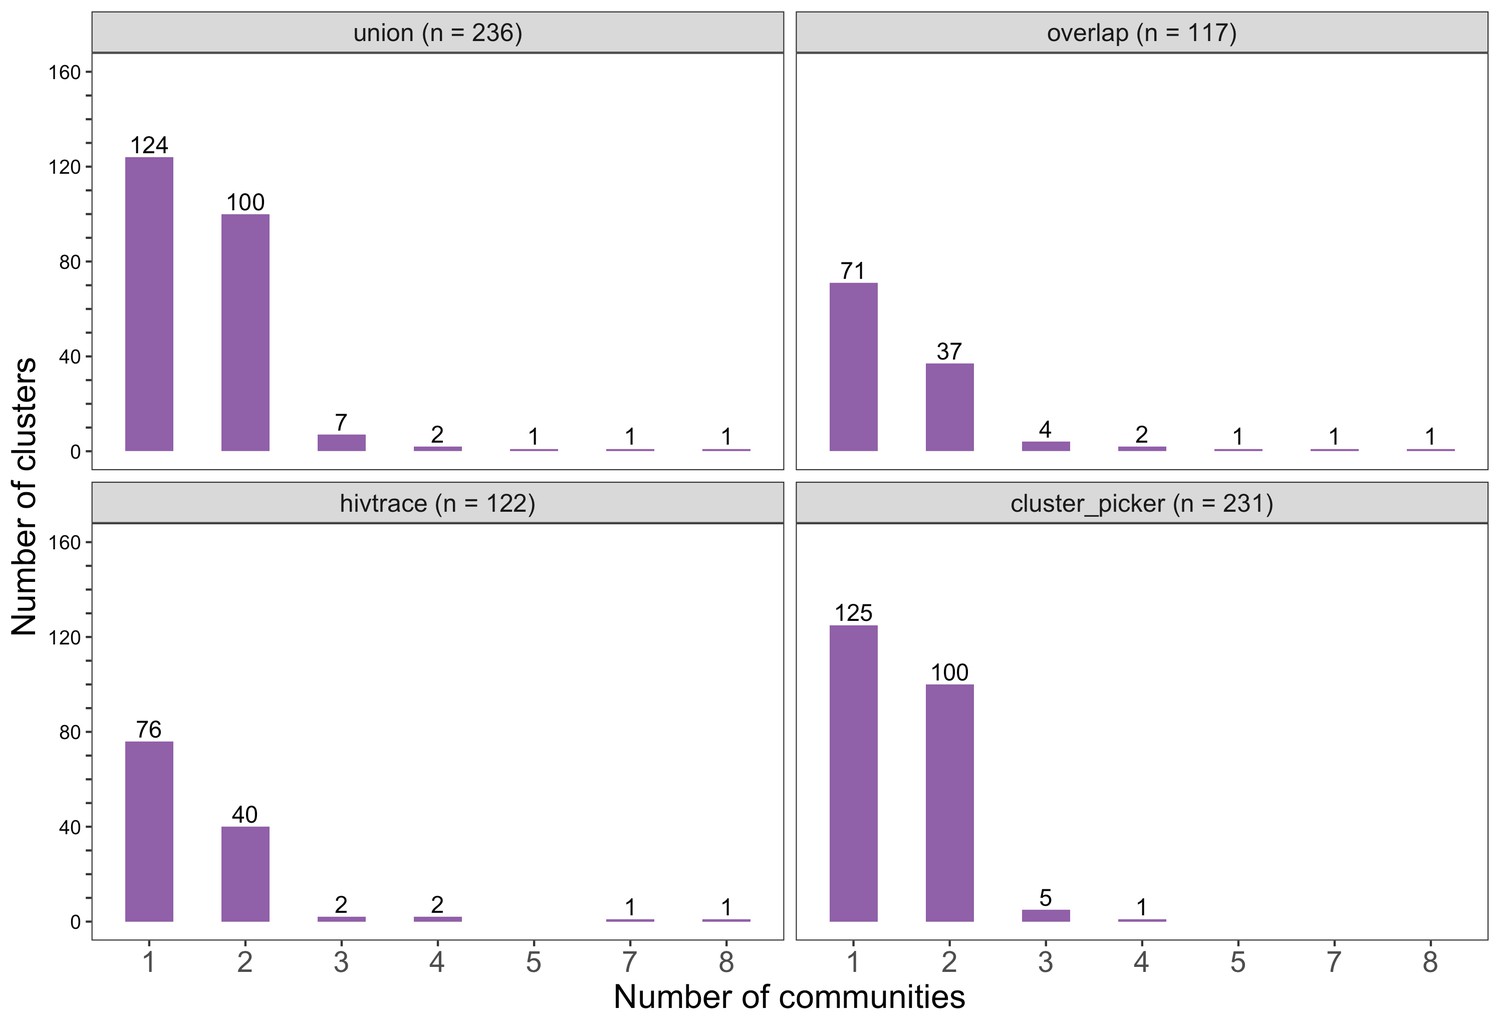
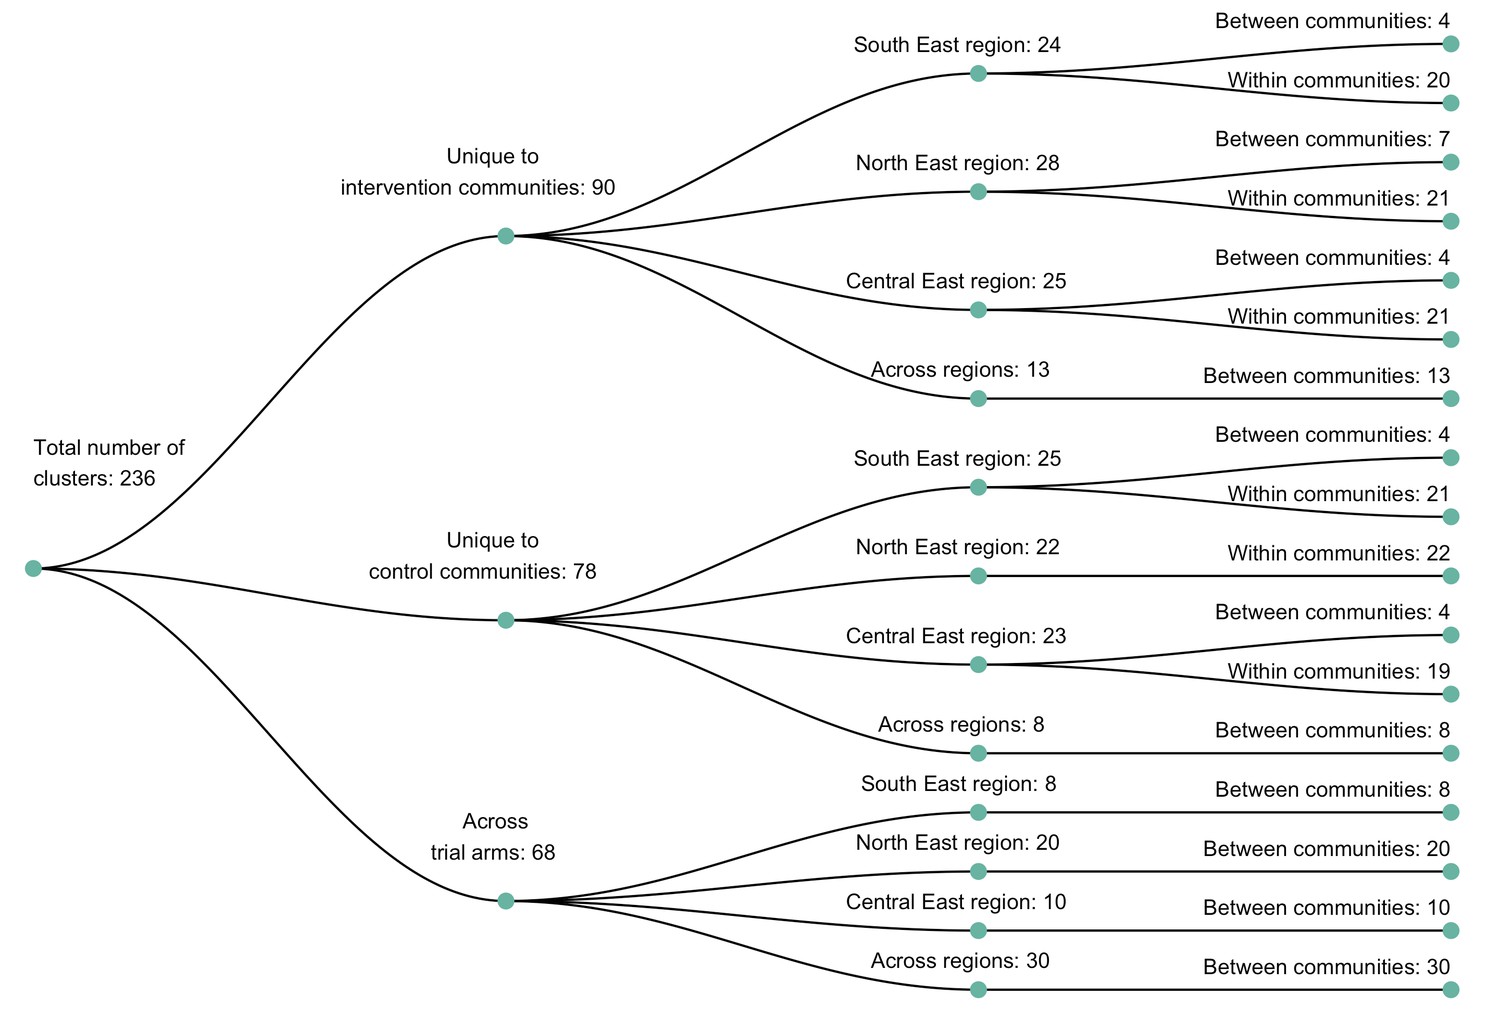
Barplots showing the spread of genetic clusters across trial communities.
The bottom two plots show the number of genetic clusters identified with HIV-TRACE (n = 122) and Cluster Picker algorithms (n = 231), respectively; and the top two plots show the union (n = 236) and overlap (n = 117) of genetic clusters found with HIV-TRACE and Cluster Picker. Most lineages localized to one or two trial communities; with few clusters having members spread out across five or more trial communities.
Figure 8
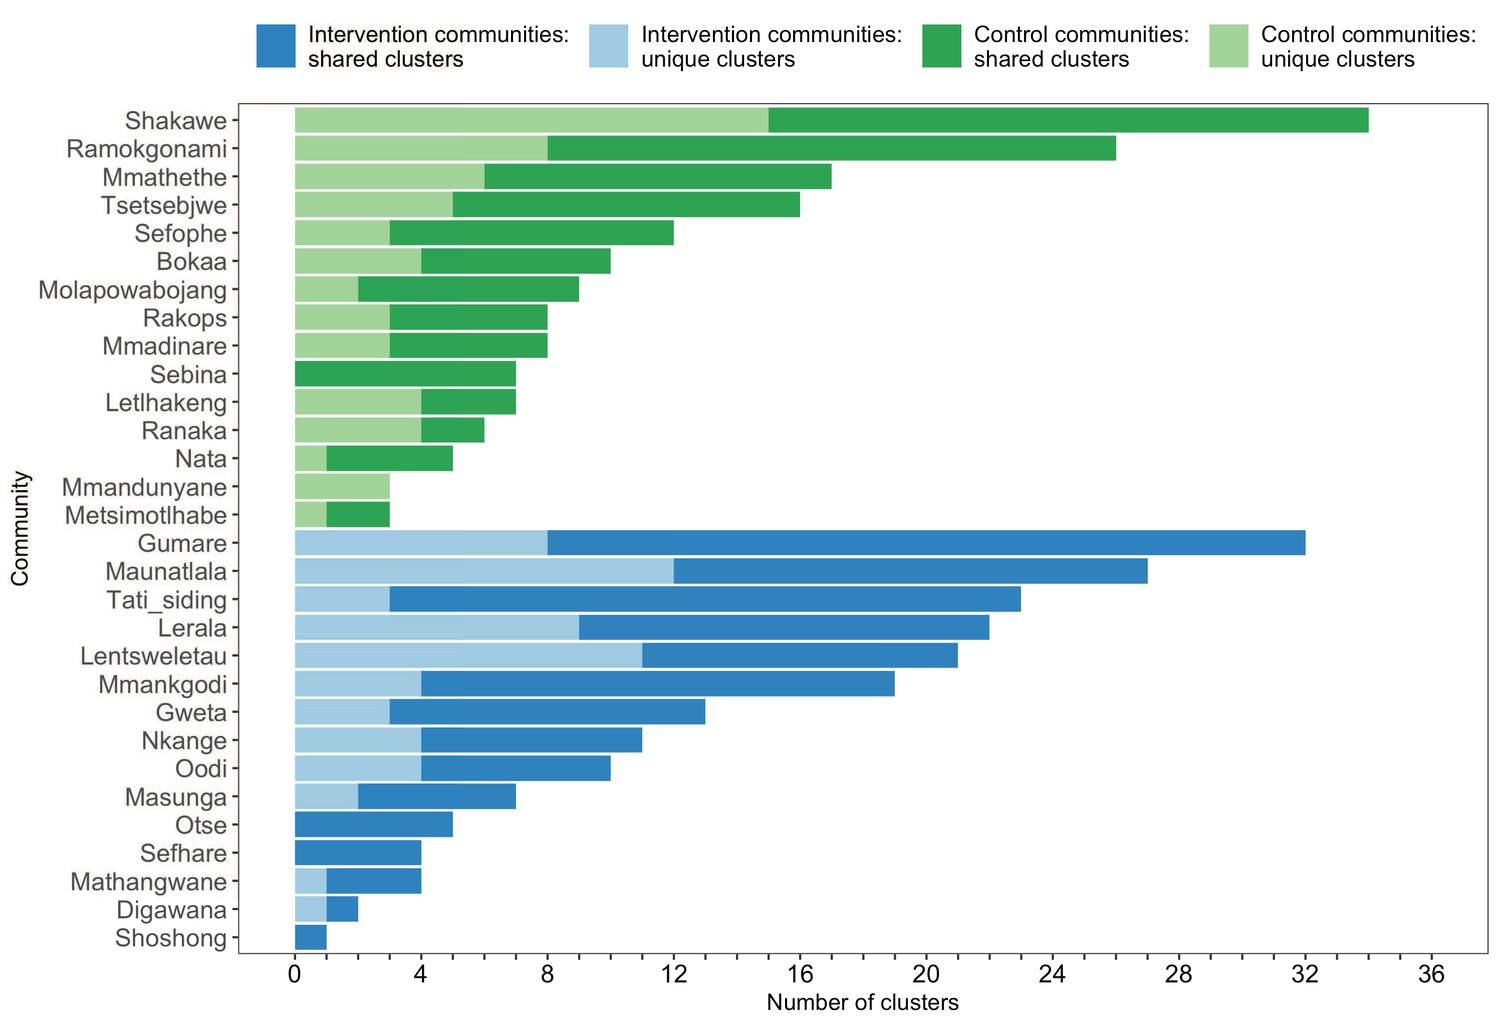
A barplot summarizing clusters of genetically similar HIV-1 infections by trial community.
Bars represent the total number of genetic clusters identified in each trial community partitioned into clusters that are specific to a community (lighter shade) and those that are shared with at least one other trial community (darker shade). Genetic clusters in intervention communities are shown in blue and those in control communities are represented in green. The number of genetic clusters identified among intervention and control communities varied.
Figure 9
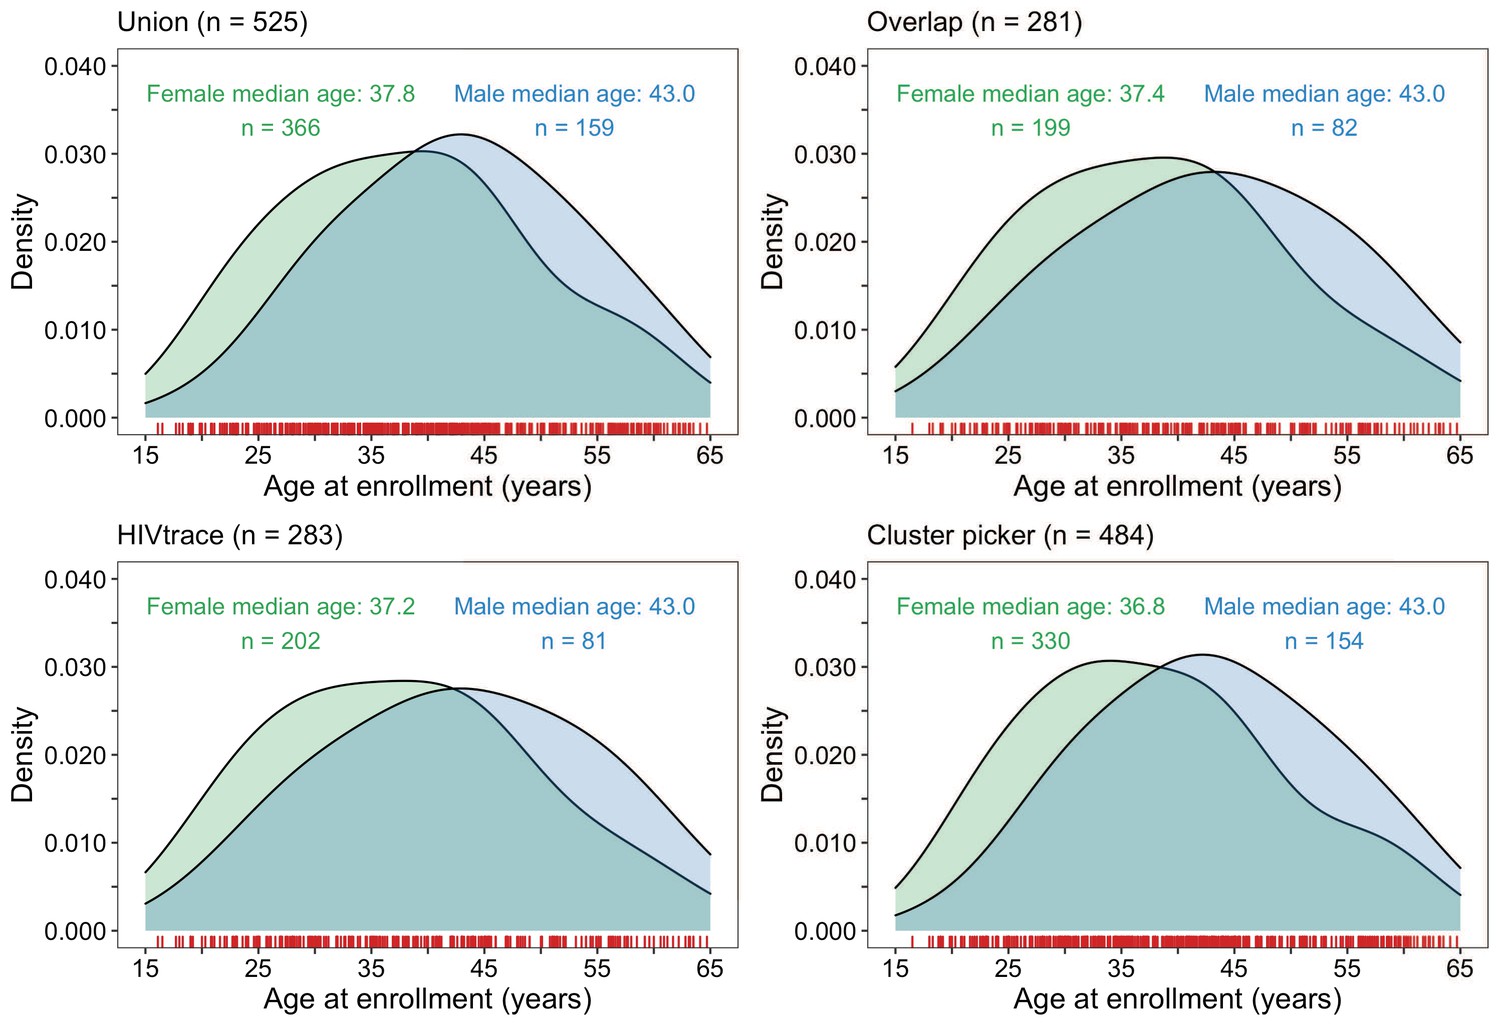
Density plots summarizing trial participants in clusters of genetically similar HIV-1 infections by age and gender.
The top two panels show the age-gender distribution of trial participants whose HIV-1 viral whole-genome consensus sequences were in the union (n = 525) and overlap (n = 281) of genetic clusters identified with HIV-TRACE and Cluster Picker. The bottom two plots show the age-gender distribution of trial participants whose HIV-1 viral whole-genome consensus sequences were in genetic clusters identified with HIV-TRACE (n = 283) and Cluster Picker (n = 484) clustering algorithms. The raw data is shown as a rug plot (red tick marks) on the x-axis. Men and women in genetic clusters had similar ages.
Figure 10
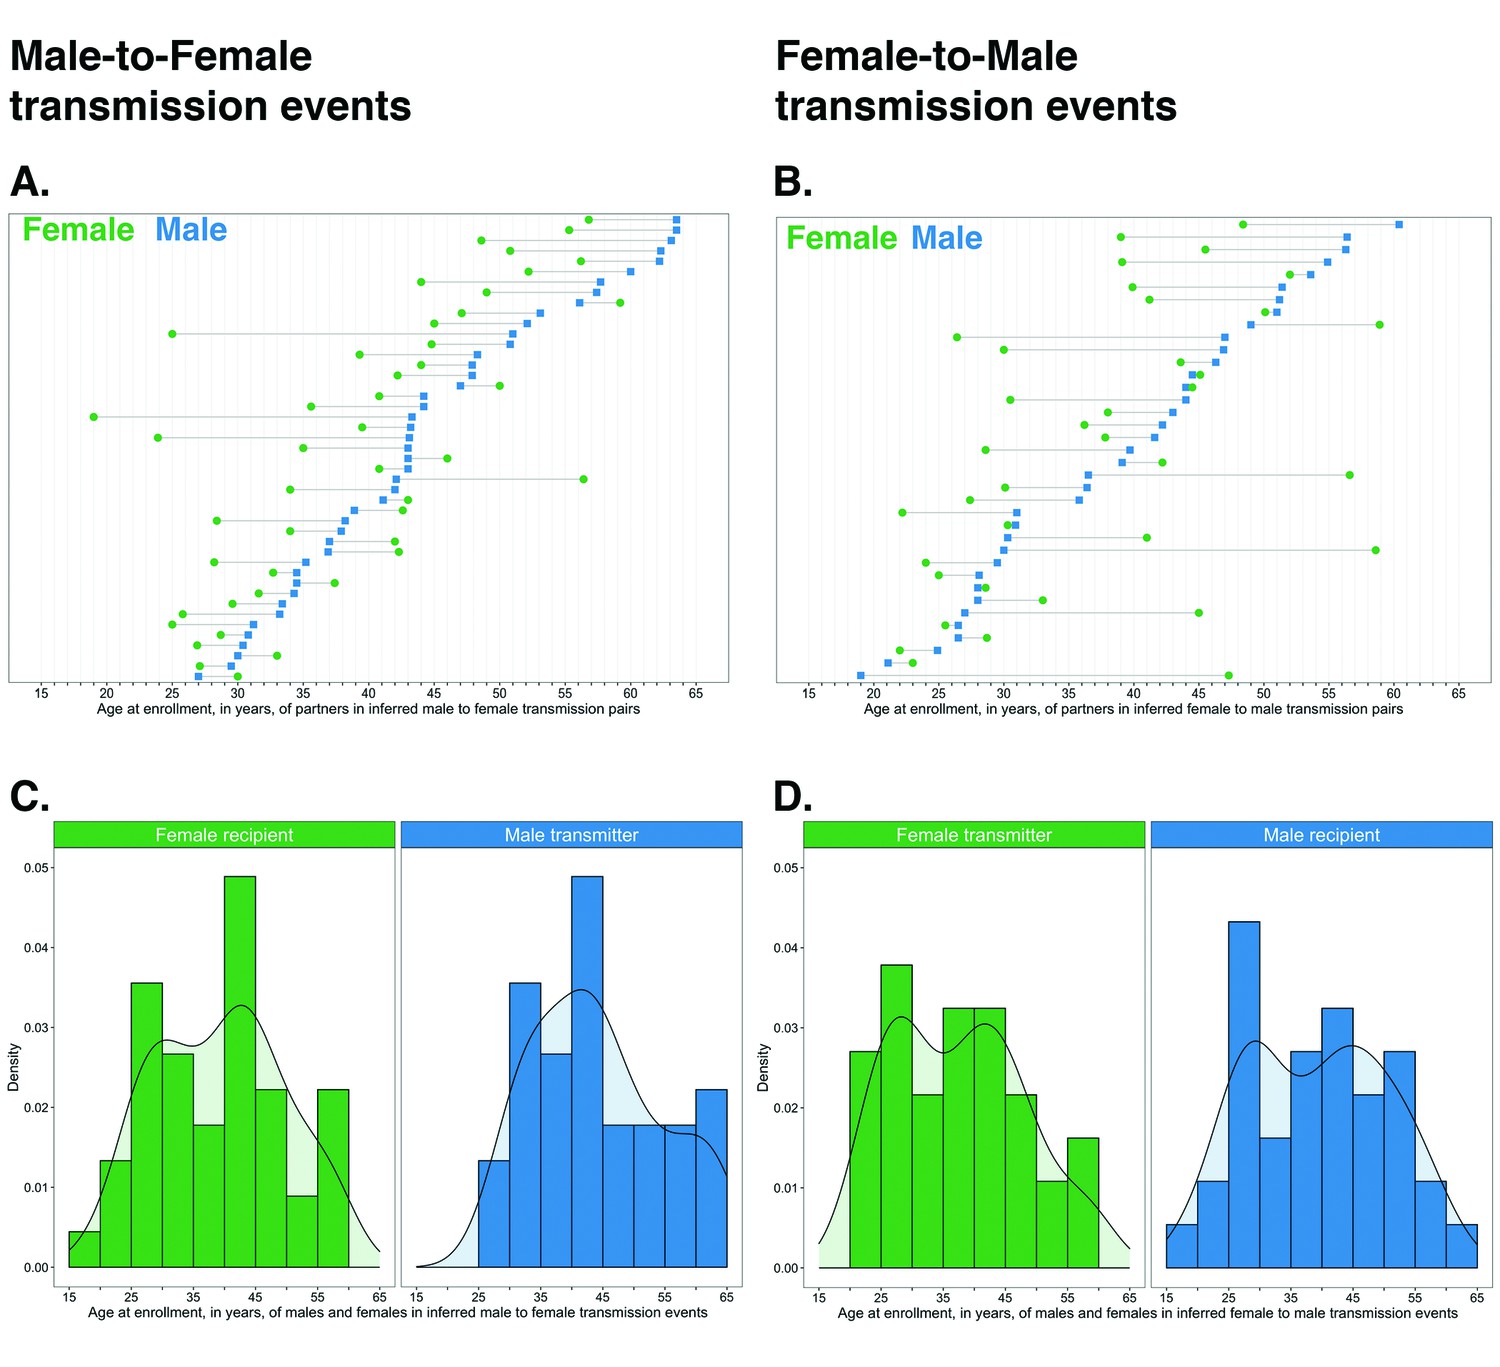
Age distribution of 82 male-female probable transmission pairs sampled in the Botswana/Ya Tsie trial.
Forty-five male-to-female and 37 female-to-male transmission events were identified from the deep-sequenced viral whole genomes of 525 trial participants in clusters of genetically similar HIV-1 infections. Men were typically older than women in both male-to-female and female-to-male transmission events.
Figure 11
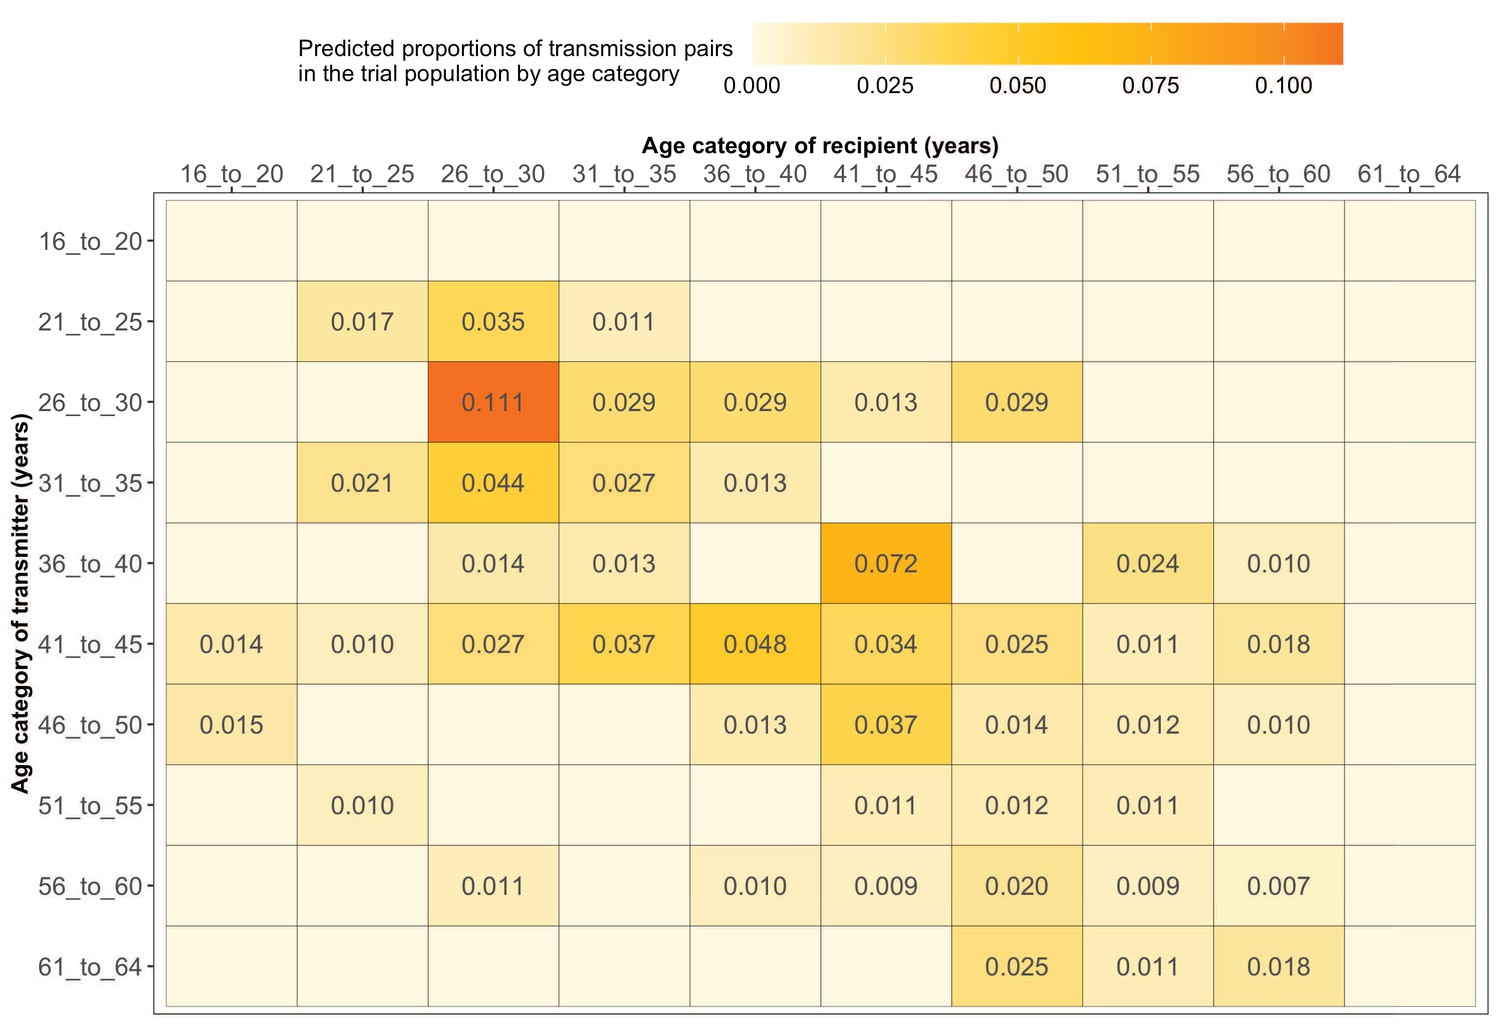
Estimated transmission flows of HIV-1 infection within and between 5-year age groups in the Botswana/Ya Tsie trial population.
Transmission flows of HIV-1 infection in the trial population were estimated from 82 male-female probable transmission pairs identified from the deep-sequenced HIV-1 viral whole genomes of trial participants (n = 525) in clusters (n = 236) of genetically similar HIV-1 infections. Furthermore, transmission flows were adjusted for differential sampling among age groups (see Materials and methods section on adjustment for variable sampling rates across different demographic groups or randomized-HIV-interventions). Most viral transmission events occurred between similarly aged partners.
Figure 12
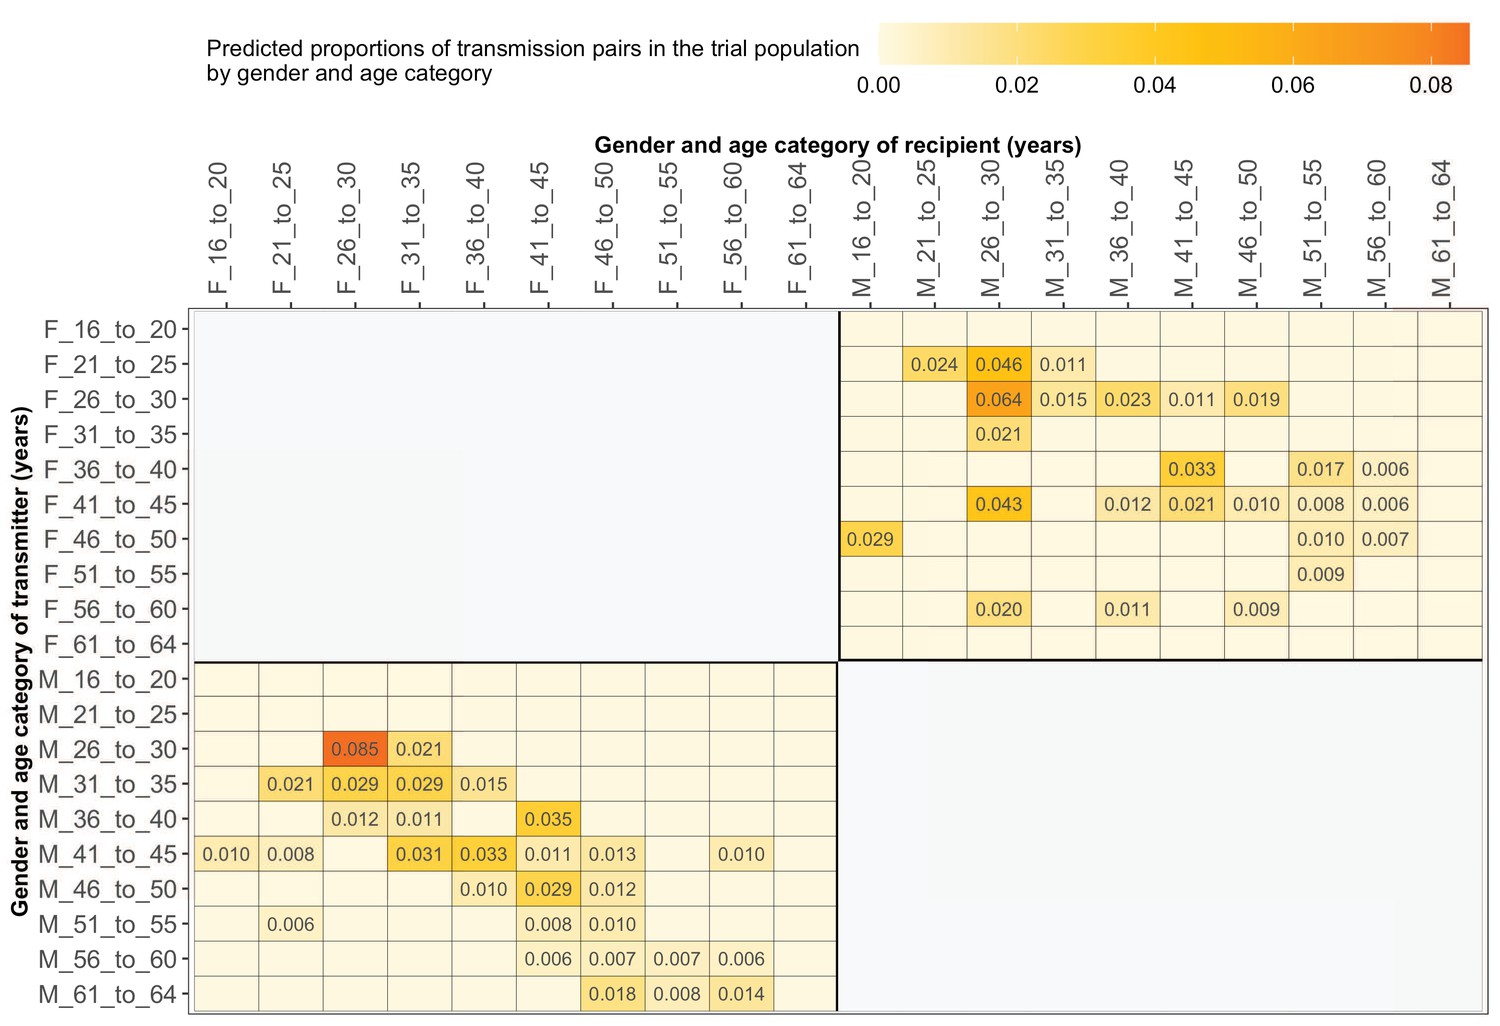
Estimated transmission flows of HIV-1 infection by gender within and between 5-year age groups in the Botswana/Ya Tsie trial population.
Transmission flows were estimated as described in Figure 11. Additionally, transmission flows were adjusted for differential sampling by gender and age group.
Figure 13
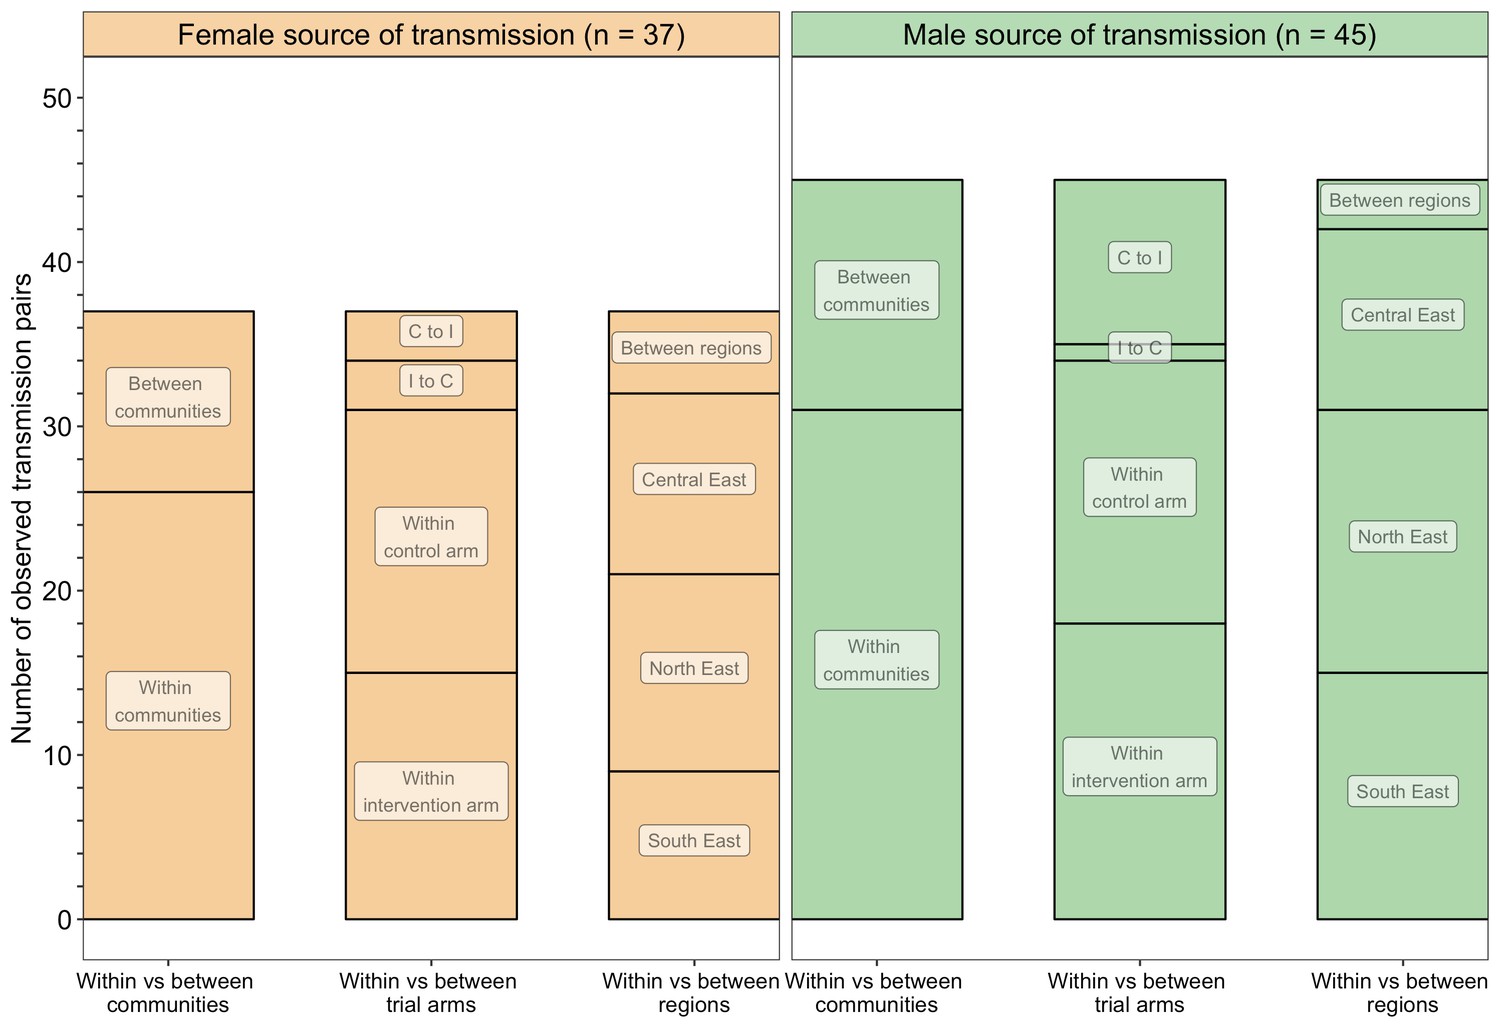
A barplot showing counts of male-female probable transmission pairs sampled in the Botswana/Ya Tsie trial by geographical location.
The 82 probable male-female infector-infectee pairs that were identified from clusters of genetically similar HIV-1 infections (n = 236) in the Botswana/Ya Tsie trial are first summarized into those with a male versus a female source of viral transmission. Male-to-female and female-to-male transmission events are then further partitioned according to whether partners in a transmission pair resided in the same or different trial communities and if those trial communities belonged to the same or different trial arms and geographical regions. C to I denote transmission into an intervention community from a control community and I to C represent transmission into a control community from an intervention community. Male-to-female transmission events are shown in green and female-to-male transmission events are represented in yellow. About 69% (n = 57) of the sampled transmission events in the Botswana/Ya Tsie trial occurred within the same trial community.
Figure 14
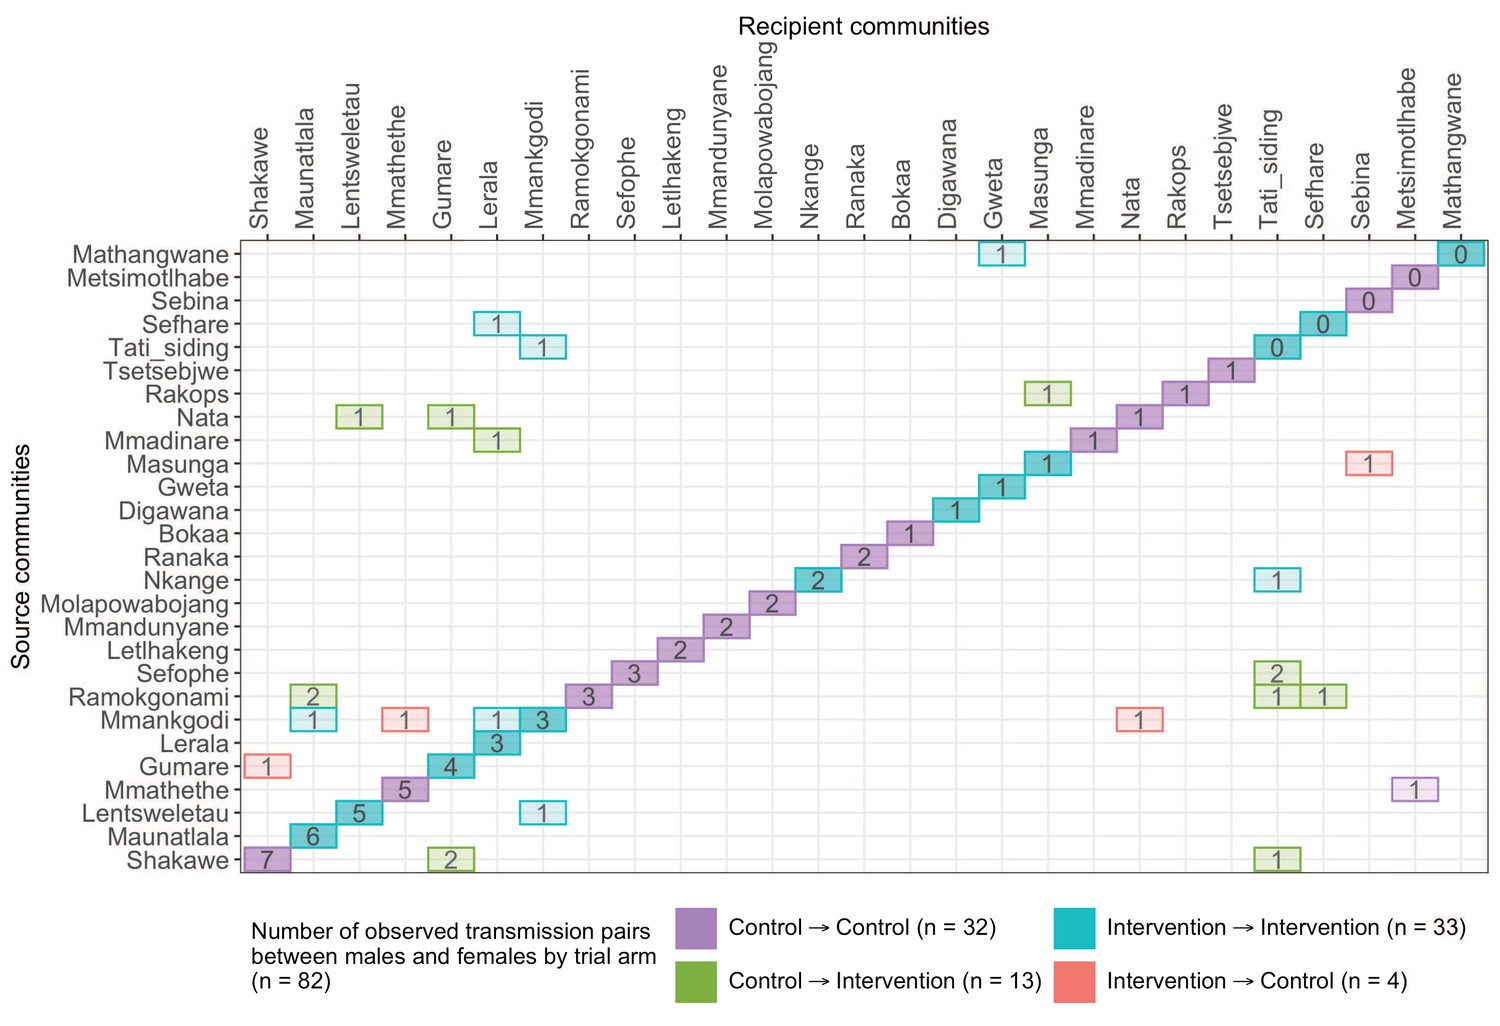
A transmission matrix summarizing sampled transmission events within and between Botswana/Ya Tsie trial communities.
Numbered tiles represent counts of transmission events identified between a pair of trial communities. There were 32 transmission events identified within control communities (magenta), 33 within intervention communities (cyan), 13 from control-to-intervention communities (green), and 4 from intervention-to-control communities (red). Most transmission events were identified within trial communities. The number of sampled transmission events into intervention communities from control communities was higher than the reverse (n=13 vs. 4).
Figure 15
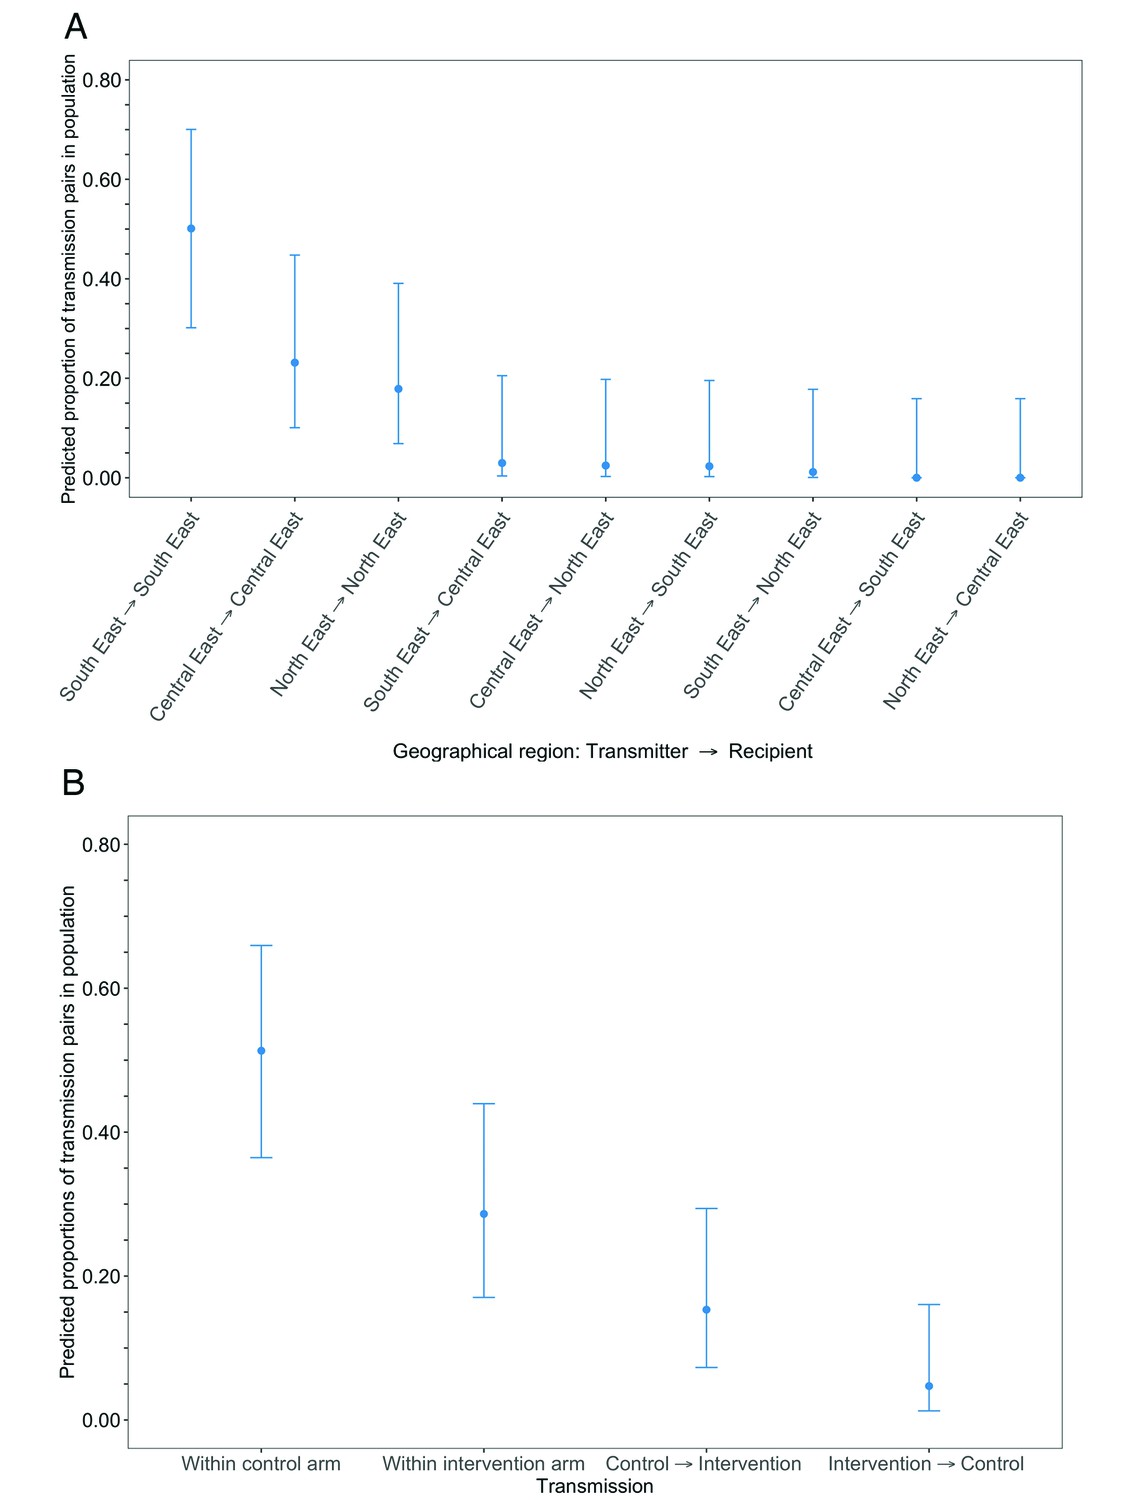
Estimated transmission flows of HIV-1 infection in the Botswana/Ya Tsie trial population within and between geographical regions and trial arms.
Transmission flows were estimated as described in Figure 11. Additionally, transmission flows were adjusted for differential sampling among geographical regions and trial arms respectively. (A) Estimated transmission flows of HIV-1 infection in the Botswana/Ya Tsie trial population within and between geographical regions. Communities in the Botswana/Ya Tsie trial were broadly grouped into three geographical regions in the Central-East, North/North-East, and South-Eastern parts of the country. The flow of HIV-1 transmissions in the trial population was highest in the South-East region (50.1%) compared with the Central-East (23.1%) and North/North-East (17.9%) regions, respectively. (B) Estimated transmission flows of HIV-1 infection within and between intervention communities and control communities in the Botswana/Ya Tsie trial population. Most transmissions of HIV-1 infection occurred within the same trial arm and the flow of viral transmissions into intervention communities from control communities (15.3%) was about three times higher than the reverse (4.7%).
Additional files
-
Supplementary file 1
Supplemental tables 1A to O.
- https://cdn.elifesciences.org/articles/72657/elife-72657-supp1-v2.xlsx
-
Supplementary file 2
Membership and affiliations of the Botswana Combination Prevention Project and PANGEA consortium.
- https://cdn.elifesciences.org/articles/72657/elife-72657-supp2-v2.zip
-
Transparent reporting form
- https://cdn.elifesciences.org/articles/72657/elife-72657-transrepform1-v2.pdf
Download links
A two-part list of links to download the article, or parts of the article, in various formats.
Downloads (link to download the article as PDF)
Open citations (links to open the citations from this article in various online reference manager services)
Cite this article (links to download the citations from this article in formats compatible with various reference manager tools)
Deep-sequence phylogenetics to quantify patterns of HIV transmission in the context of a universal testing and treatment trial – BCPP/Ya Tsie trial
eLife 11:e72657.
https://doi.org/10.7554/eLife.72657


