A molecular mechanism for the generation of ligand-dependent differential outputs by the epidermal growth factor receptor
- Department of Molecular and Cell Biology, University of California, Berkeley, United States
- Institute for Quantitative Biosciences, University of California, Berkeley, United States
- Howard Hughes Medical Institute, University of California, Berkeley, United States
- Frederick National Laboratory for Cancer Research, United States
- University of British Columbia, Canada
- Department of Chemistry, University of California, Berkeley, United States
- Divisions of Molecular Biophysics and Integrated Bioimaging, Lawrence Berkeley National Laboratory, United States
Figures
Figure 1
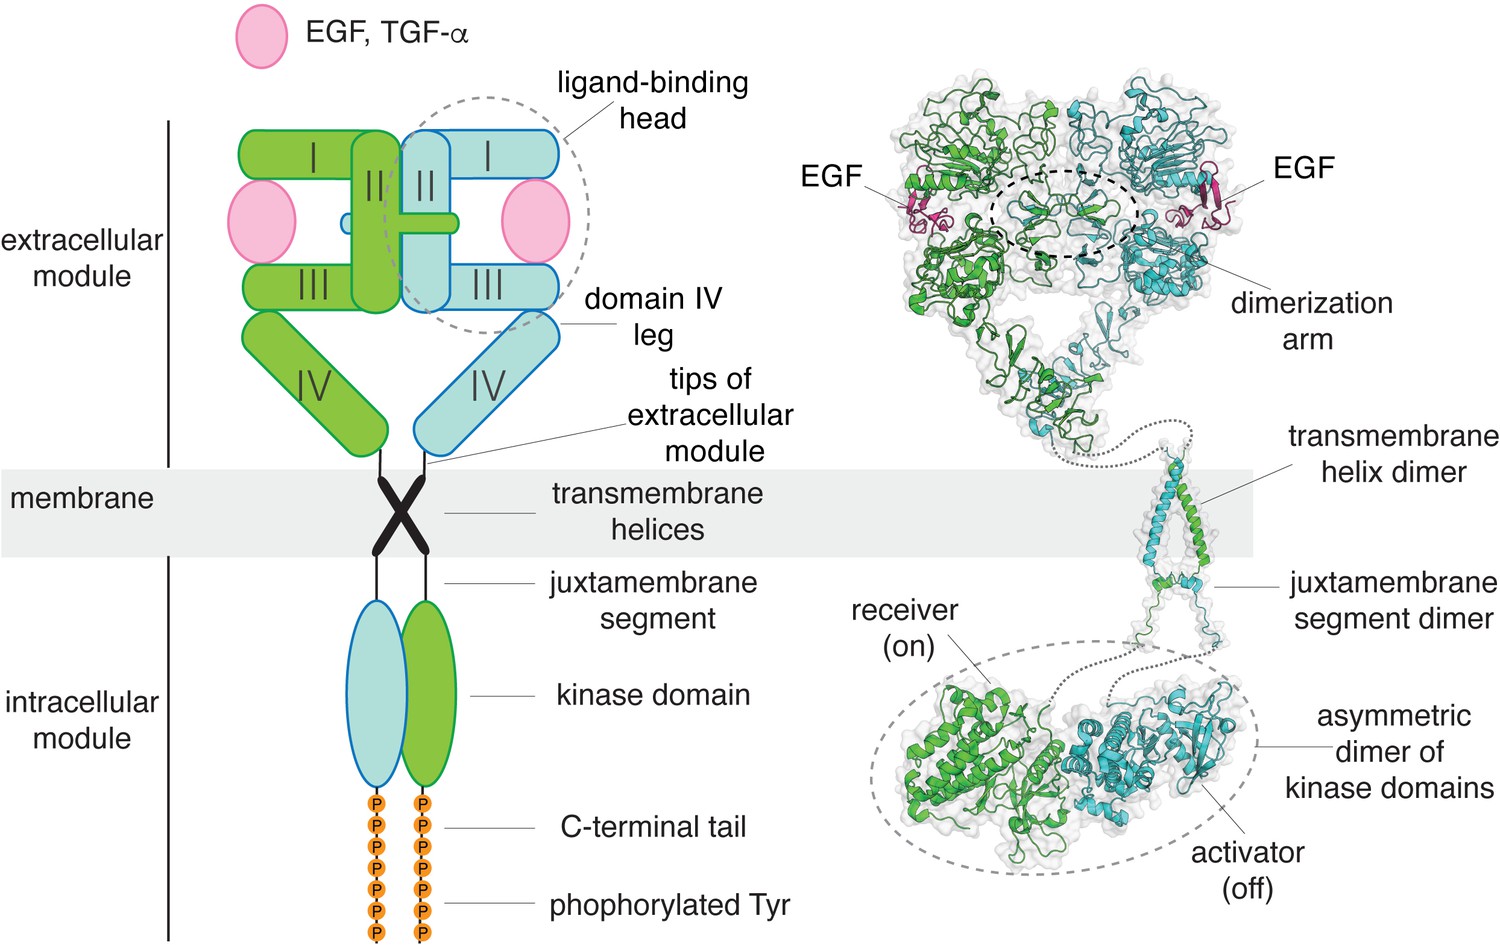
A structural collage of a ligand-bound EGFR dimer.
Left, a schematic diagram of ligand-bound dimeric EGFR. Right, structures of EGFR fragments, determined previously: a dimeric extracellular module bound to EGF (PDB code: 3NJP Lu et al., 2010), a transmembrane helix dimer (PDB code: 2M20 Endres et al., 2013), and an asymmetric dimer of kinase domains (PDB code: 2GS6 Zhang et al., 2006).
Figure 2 with 1 supplement
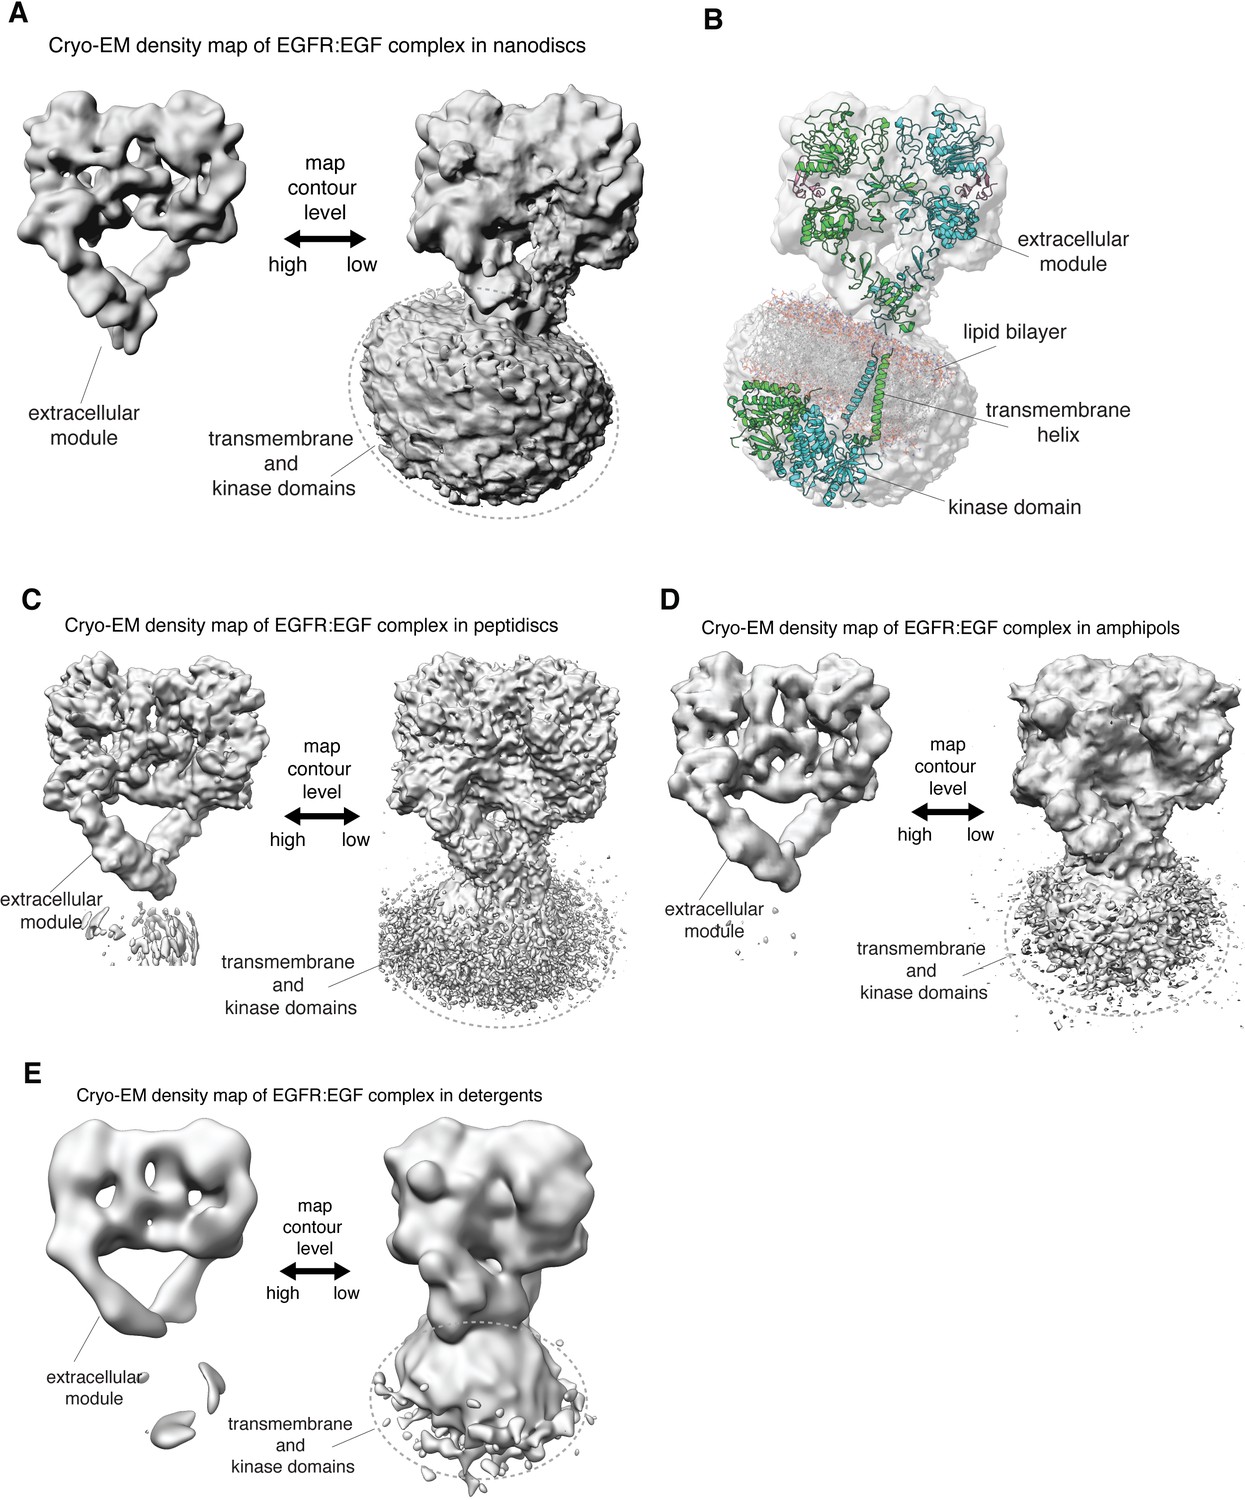
Linkage between the extracellular module and transmembrane helices in full-length human EGFR is not rigid.
(A, C–E) In each panel, the cryo-EM density map for a reconstituted full-length EGFR:EGF complex is shown at two contour levels. Note the lack of EM density for the transmembrane and kinase domains of EGFR at higher contour level (left) in all these complexes. (A) Full-length EGFR:EGF complex reconstituted in nanodiscs. Map shown at two contour levels, high (σ: ~ 5.8) and low (σ:~0.6). (B) Superposition of the cryo-EM map shown in A with a model for full-length EGFR embedded in the lipid bilayer, described previously (Arkhipov et al., 2013). (C) Full-length EGFR:EGF complex reconstituted in peptidiscs. Map shown at two contour levels, high (σ: ~ 5.9) and low (σ:~0.8). (D) Full-length EGFR:EGF complex reconstituted in amphipols. Map shown at two contour levels, high (σ: ~ 12.0) and low (σ:~1.2). (E) Full-length EGFR:EGF complex reconstituted in detergents. Map shown at two contour levels, high (σ: ~ 12.8) and low (σ:~1.0).
Figure 2—figure supplement 1
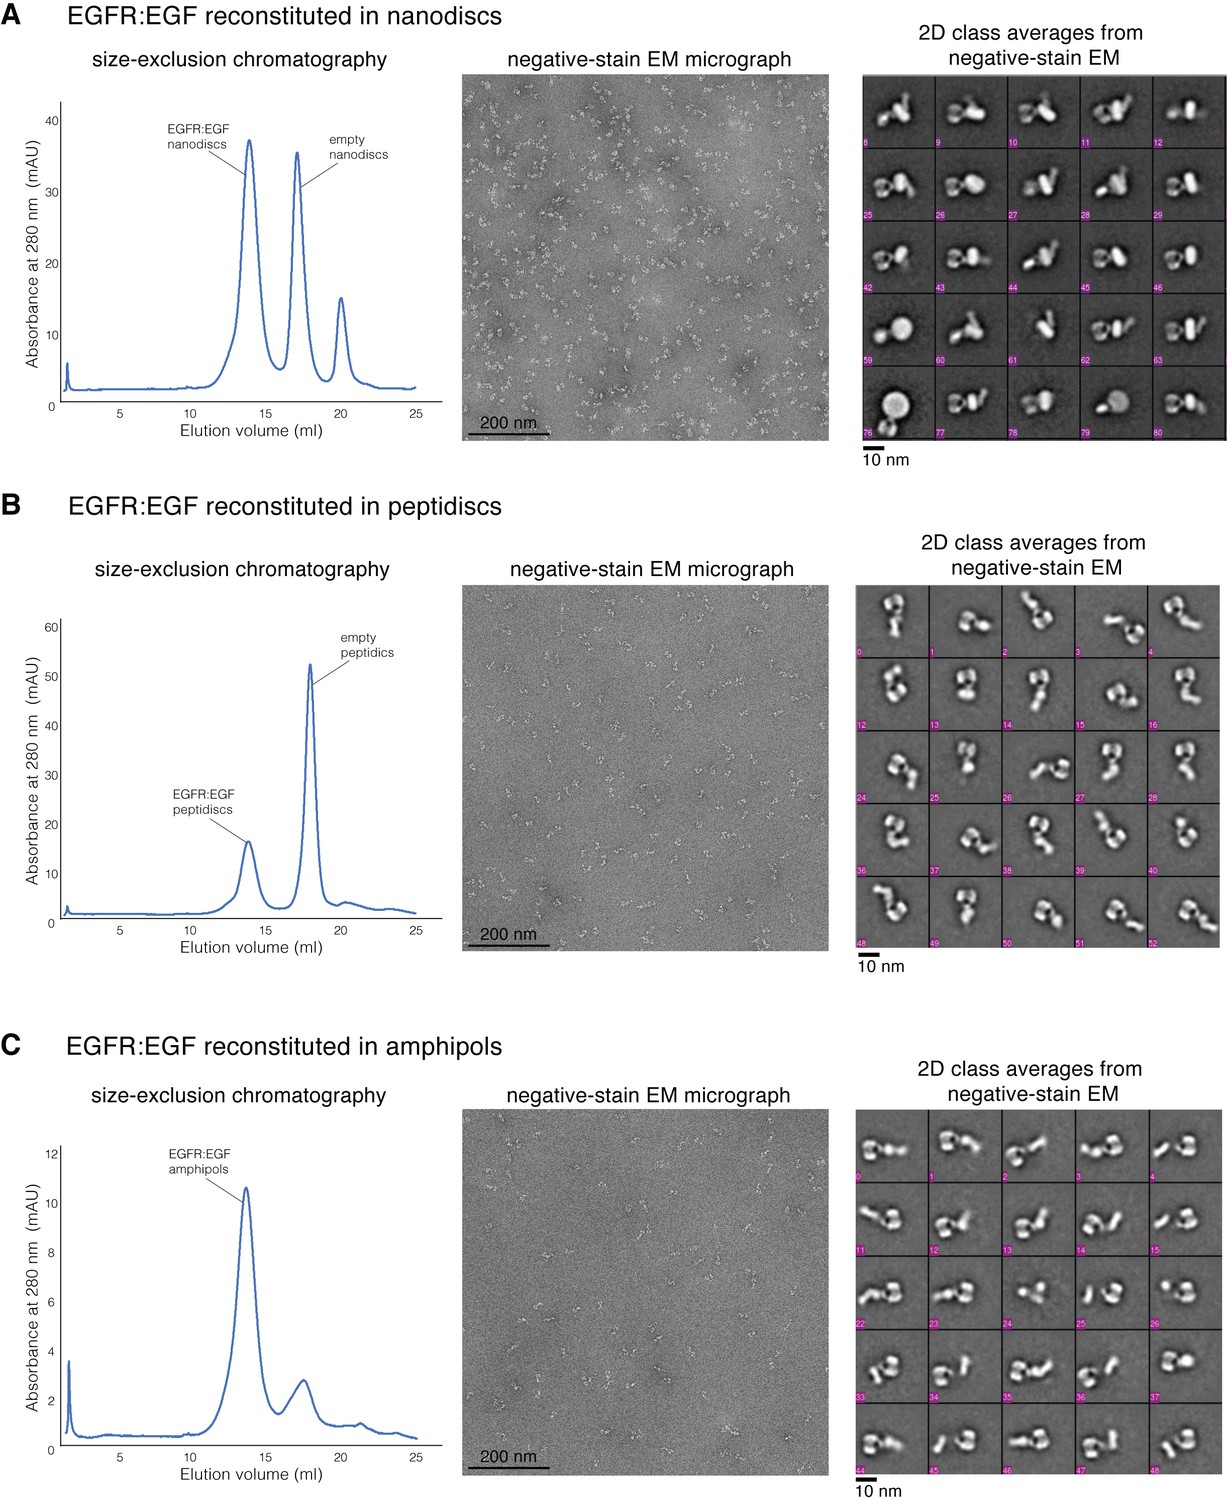
Reconstitution of full-length human EGFR:EGF complex.
(A) Sample preparation of full-length EGFR:EGF reconstituted into nanodiscs. (B) Sample preparation of full-length EGFR:EGF reconstituted into peptidiscs. (C) Sample preparation of full-length EGFR:EGF reconstituted into amphipols. For each sample preparation, a representative profile of size-exclusion chromatography is shown on the left, a representative negative-stain micrograph is shown in the middle, and the representative 2D class averages are shown on the right.
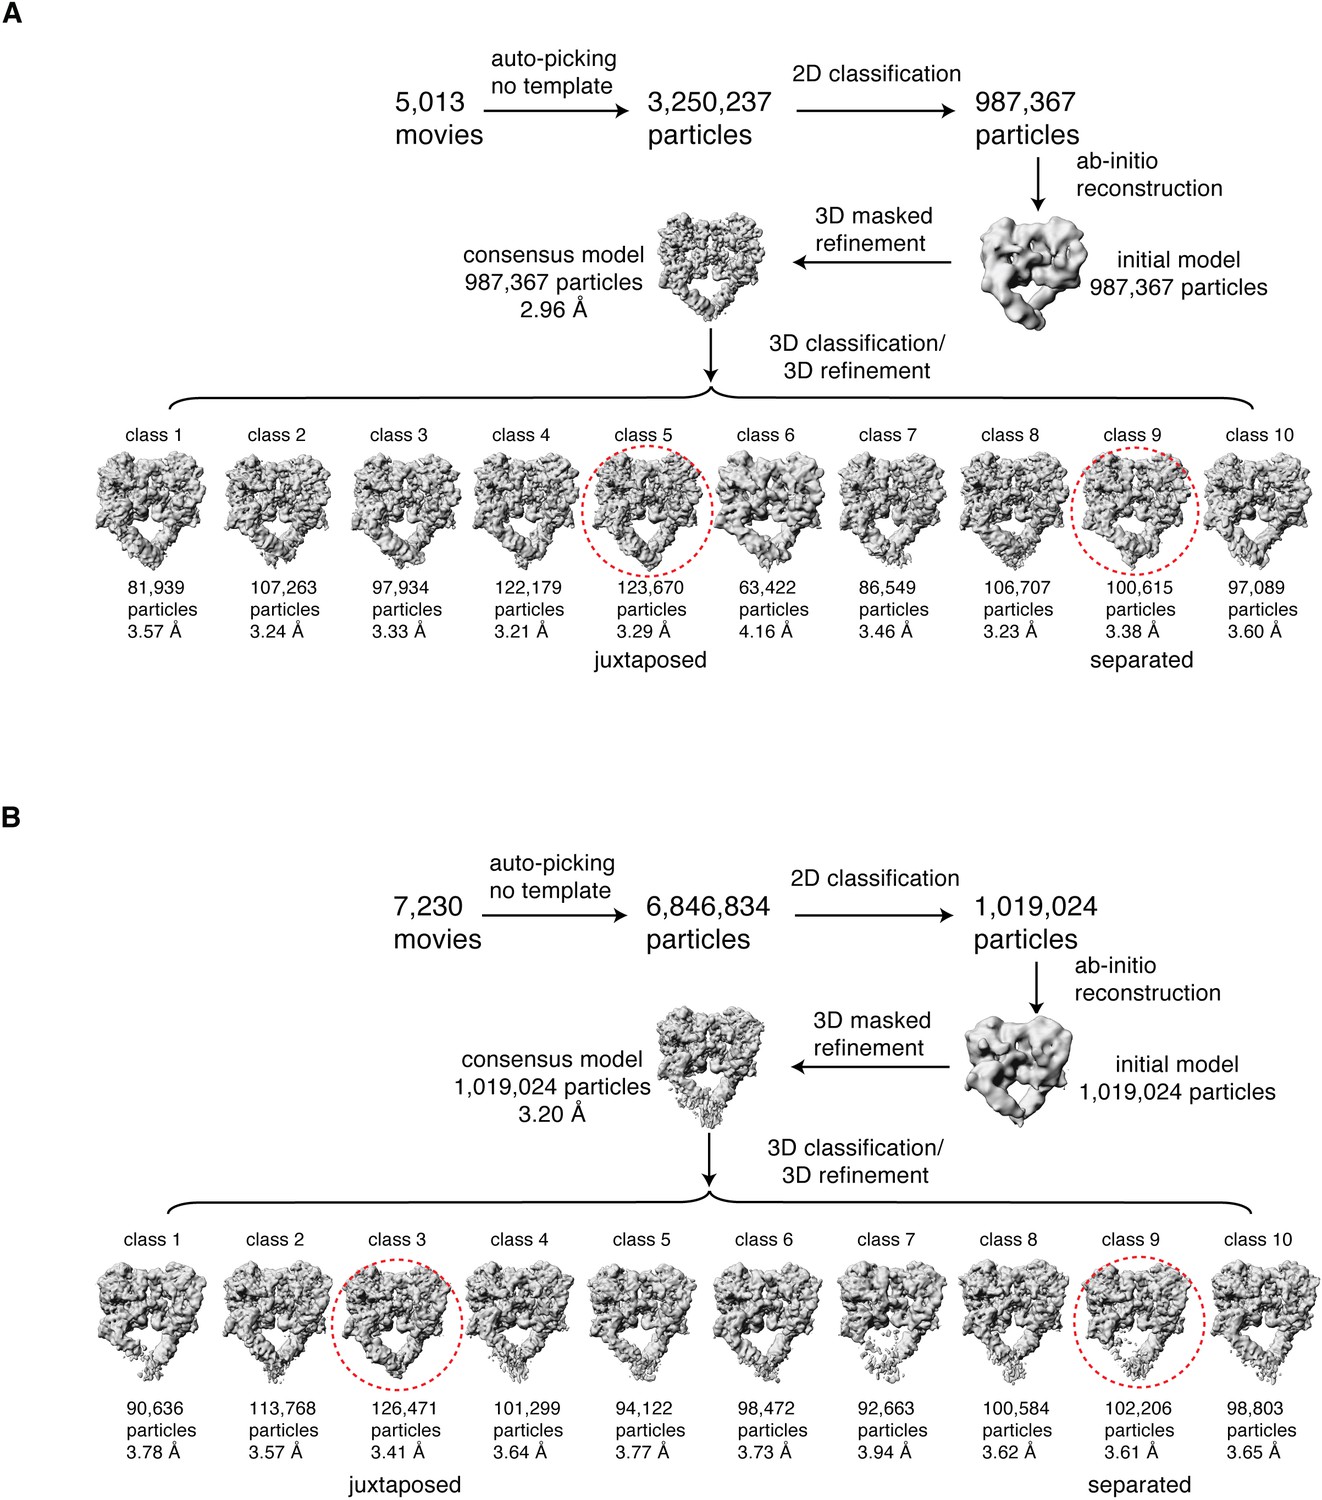
Figure 3 with 6 supplements
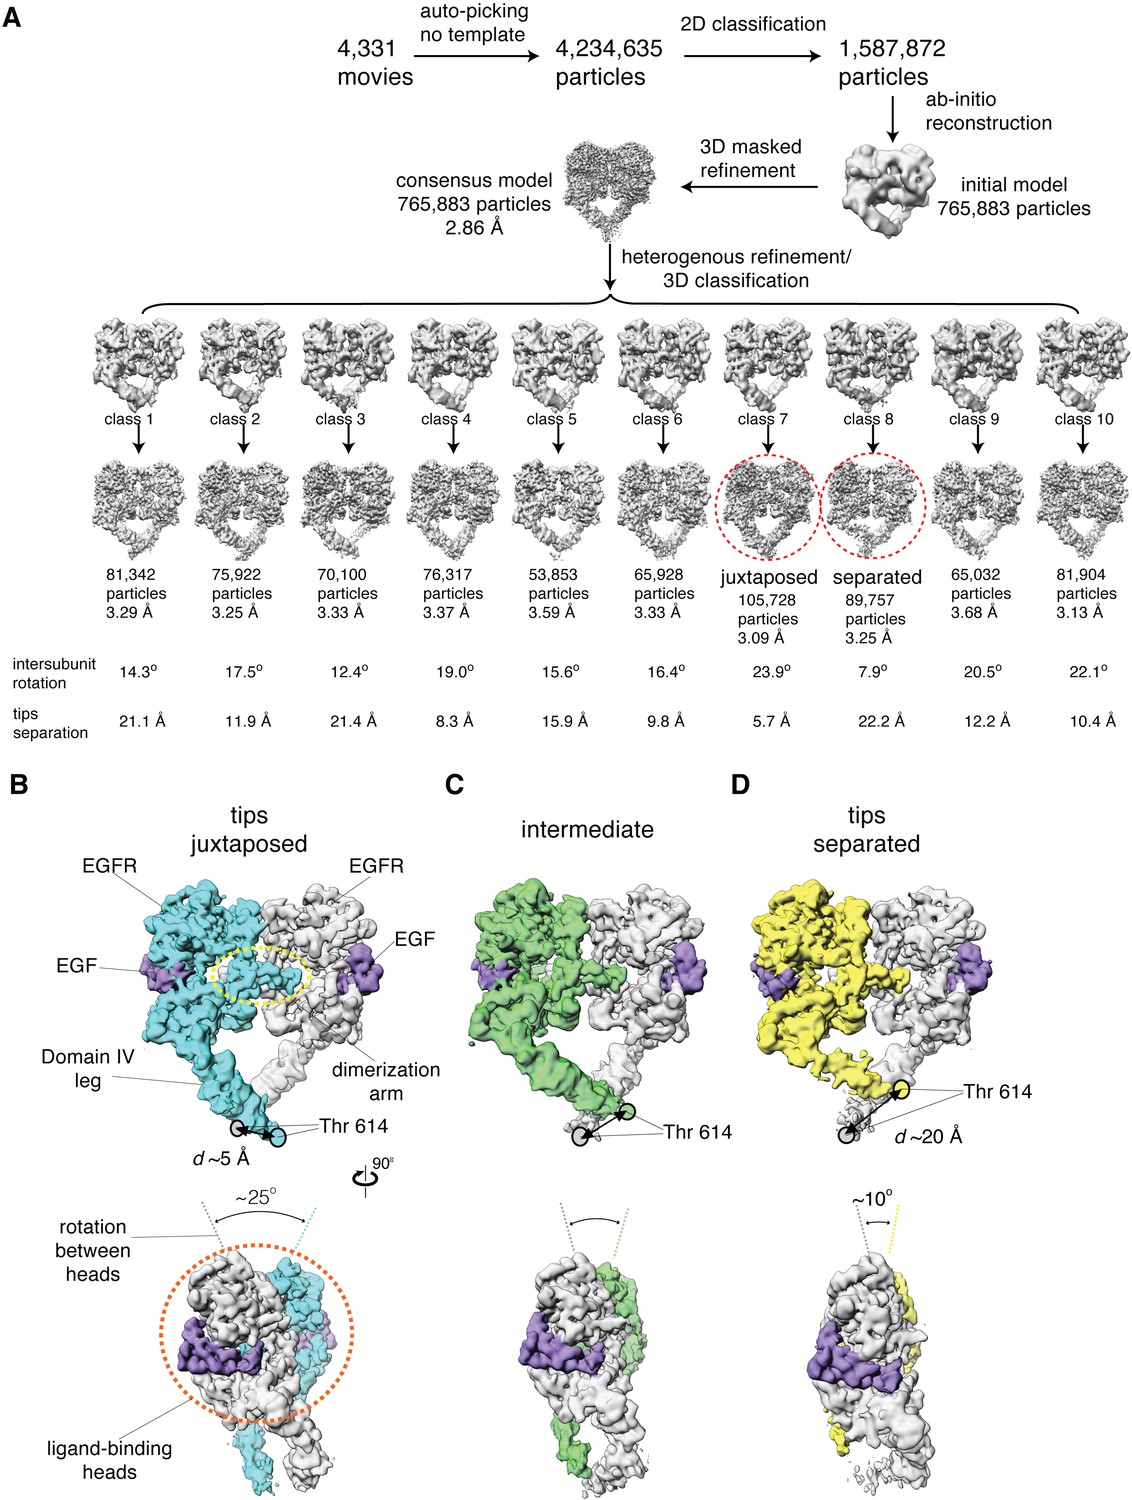
Cryo-EM analysis reveals a range of conformations for the EGF-bound extracellular module.
(A) Summary of the cryo-EM data processing workflow for the full-length EGFR:EGF complex reconstituted in peptidiscs. The two extreme conformations of the ensemble, the juxtaposed and the separated, are highlighted by red dotted circle. The intersubunit rotational angles and the separations between the tips of the extracellular module are summarized below each subclass. See Materials and methods for more details. (B–D) Two orthogonal views of the cryo-EM maps for three representative states of the conformational ensemble of the EGF-bound extracellular module: the tips-juxtaposed conformation (B), an intermediate conformation (C), and the tips-separated conformation (D). These conformations differ from one another in the rotations between the ligand-binding heads, as well as in the distances between the two Thr 614 residues located at the membrane-proximal ends of the Domain IV legs.
-
Figure 3—source data 1
Statistics of cryo-EM data collection and structure determination.
- https://cdn.elifesciences.org/articles/73218/elife-73218-fig3-data1-v2.doc
Figure 3—figure supplement 1
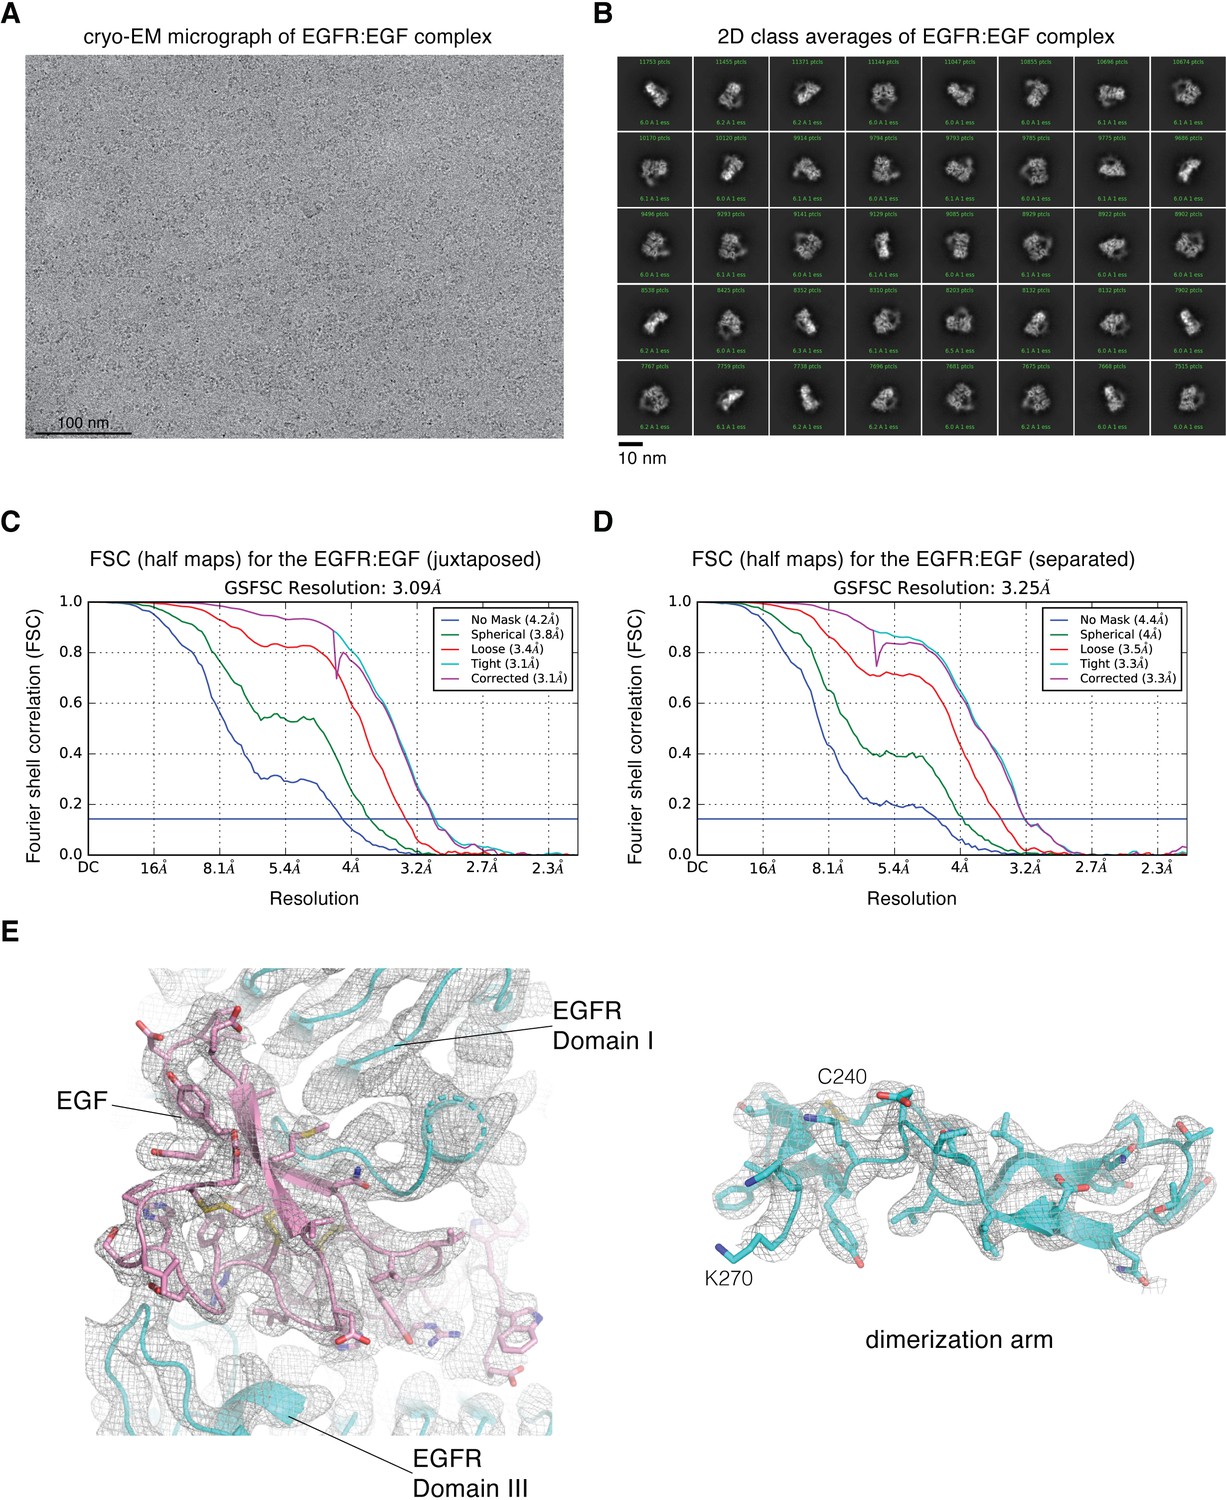
Cryo-EM image processing for focused reconstruction on the extracellular module of full-length EGFR:EGF complex reconstituted in peptidiscs.
(A) Representative cryo-EM micrograph after motion-correction. (B) Representative 2D class averages generated from reference-free 2D classification. (C) Fourier shell correlation (FSC) curves output from cryoSPARC v2 Non-uniform refinement job, for the cryo-EM reconstruction of the juxtaposed conformation of the EGFR:EGF complex reconstituted in peptidiscs. The resolution is estimated at FSC = 0.143. (D) Fourier shell correlation (FSC) curves output from cryoSPARC v2 Non-uniform refinement job, for the cryo-EM reconstruction of the separated conformation of the EGFR:EGF complex reconstituted in peptidiscs. The resolution is estimated at FSC = 0.143. (E) Representative cryo-EM densites for the juxtaposed conformation of the EGFR:EGF complex. The structural model and the cryo-EM density corresponding to one of the EGF-binding site (left) and the dimerization arm (right, Cys 240-Lys 270) are shown.
Figure 3—figure supplement 2
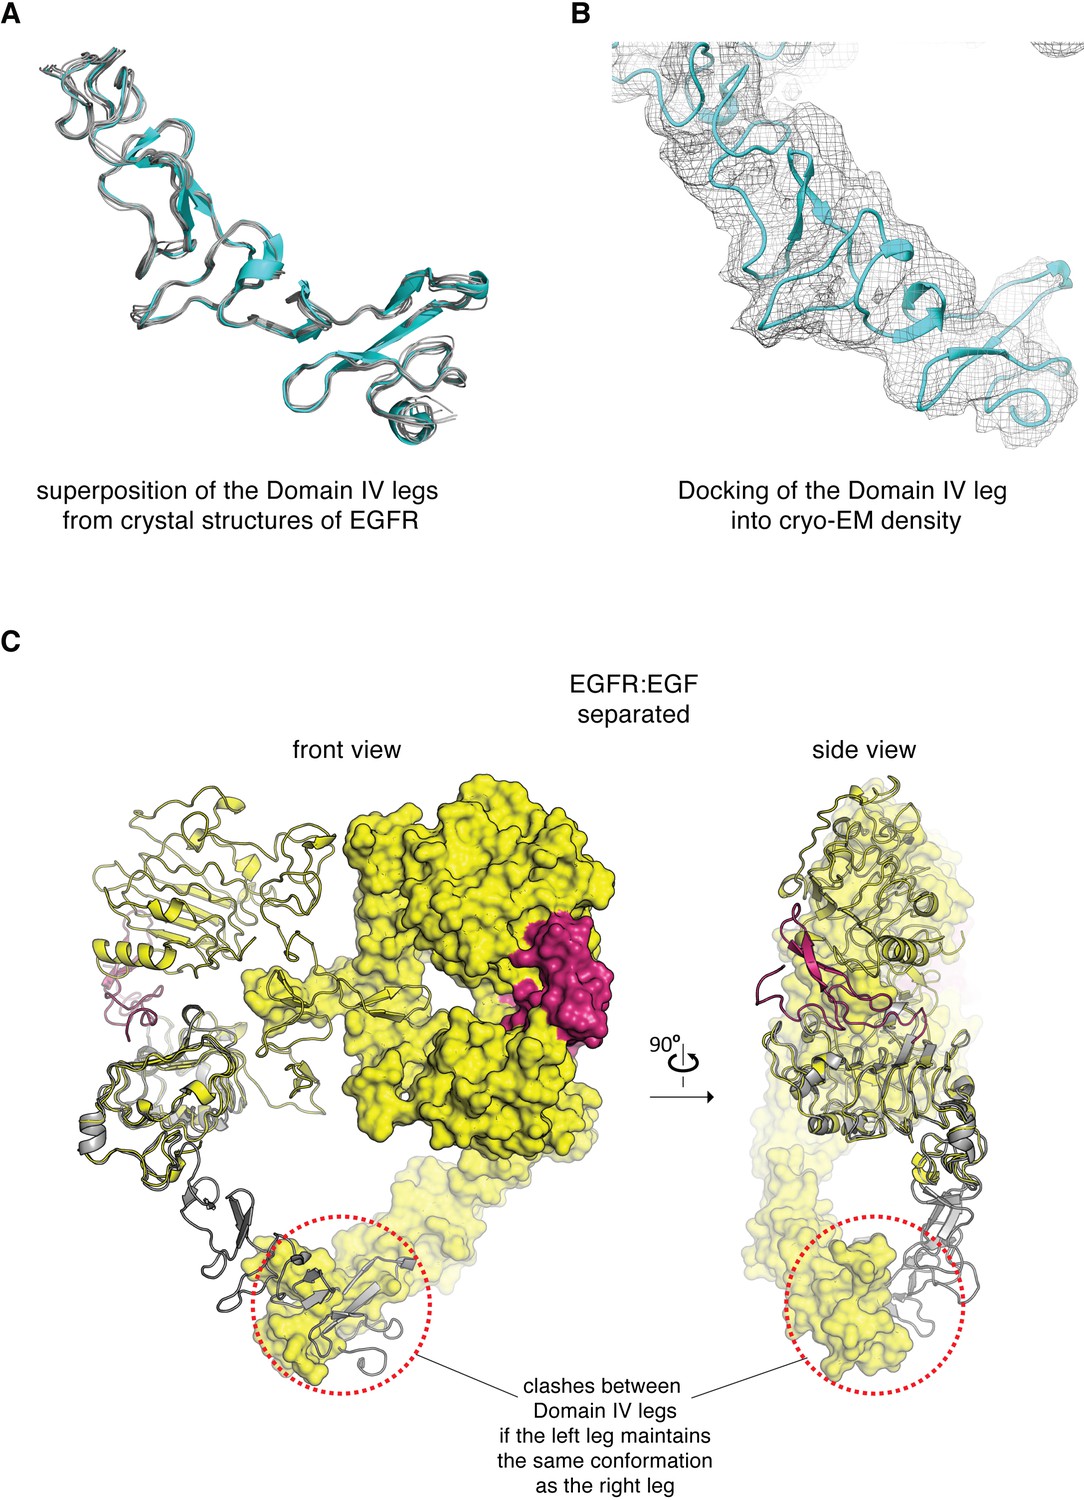
Conformation of the Domain IV leg.
(A) Superposition of the Domain IV leg from the dimeric crystal structure of the isolated EGFR extracellular domains bound to EGF (cyan, PDB code: 3NJP), with the Domain IV legs from seven different crystal structures of monomeric extracellular domains of EGFR (gray, PDB codes: 4UV7, 5XWD, 1NQL, 3QWQ, 1YY9, 6ARU, 4UIP). This comparison shows that the Domain IV leg is a fairly rigid structural component. (B) The Domain IV leg from a crystal structure of the isolated EGFR extracellular domains bound to EGF (PDB code: 3NJP) is fitted into the cryo-EM density corresponding to the flexible leg in the cryo-EM map for the juxtaposed conformation of the EGFR:EGF complex. (C) The extracellular module of the EGFR:EGF complex in separated conformation is shown in two orthogonal views. The Domain IV leg shown on the left-hand subunit (gray) is modeled based on the conformation of Domains III and IV in the right-hand subunit. Maintaining the same conformation in both legs would lead to steric clashes between the two legs (circled by red dotted lines), when the extracellular module of EGFR adopts the separated conformation.
Figure 3—figure supplement 3
Cryo-EM data processing workflow.
Summary of the cryo-EM data processing workflow for the full-length EGFR(L834R):EGF (A) and the full-length EGFR:TGF-α (B) complexes reconstituted in peptidiscs. The two extreme conformations of the ensemble, the juxtaposed and the separated, are highlighted by red dotted circle. See Materials and methods for more details.
Figure 3—video 1
3D variability analysis of the EGFR:EGF complex performed in cryoSPARC v2 (Punjani and Fleet, 2020), shown from the front.
Note the intersubunit rotation between the two heads and the corresponding movement of the Domain IV legs.
Figure 3—video 2
3D variability analysis of the EGFR:EGF complex performed in cryoSPARC v2 (Punjani and Fleet, 2020), shown from the side.
Note the intersubunit rotation between the two heads and the corresponding movement of the Domain IV legs.
Figure 3—video 3
3D variability analysis of the EGFR:EGF complex performed in cryoSPARC v2 (Punjani and Fleet, 2020), shown from the top.
Figure 4
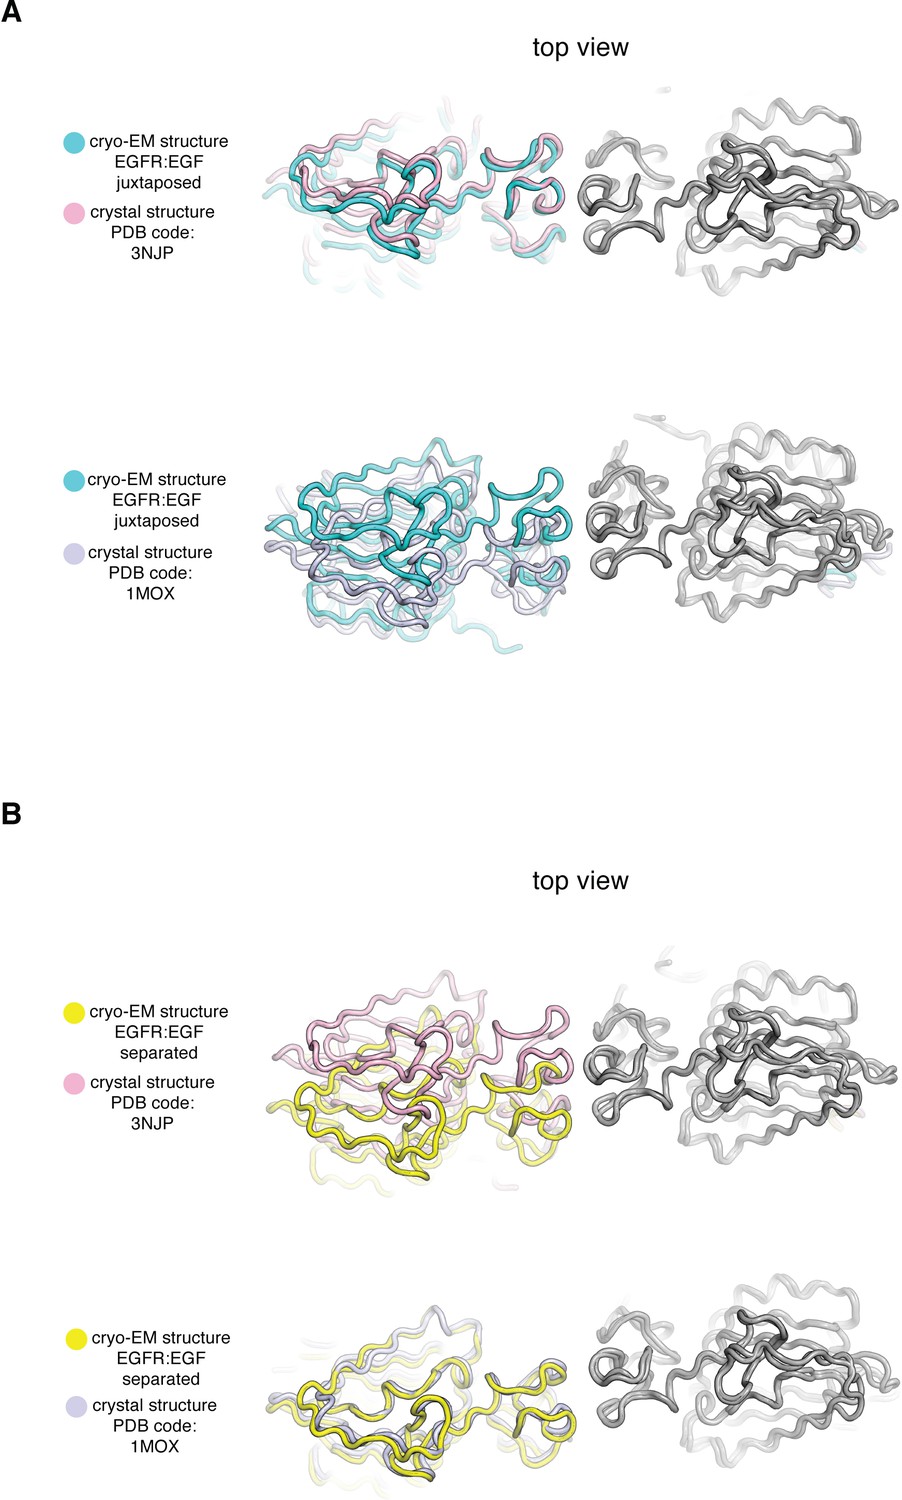
Comparison of Cryo-EM structures of EGFR:EGF complex in two extreme conformations with previous crystal structures of the ligand-binding head of EGFR bound to EGF and TGF-α.
In each panel, a cryo-EM structure of the extracellular module of the full-length EGFR:EGF complex (juxtaposed or separated) is compared to a crystal structure of the ligand-binding head of EGFR bound to EGF or TGF-α. In each comparison, structures are superimposed on the right-hand EGFR subunits (gray). (A) Top, the cryo-EM structure of juxtaposed conformation of EGFR:EGF (cyan) is compared to a crystal structure of the ligand-binding head of EGFR bound to EGF (pink, PDB code: 3NJP). Bottom, the cryo-EM structure of juxtaposed conformation of EGFR:EGF (cyan) is compared to a crystal structure of the ligand-binding head of EGFR bound to TGF-α (light purple, PDB code: 1MOX). Note that the cryo-EM structure of the juxtaposed conformation of the EGFR:EGF complex resembles closely the crystal structure of the ligand-binding head of EGFR bound to EGF (PDB code: 3NJP), but deviates from the crystal structure of the ligand-binding head of EGFR bound to TGF-α (PDB code: 1MOX). (B) Top, the cryo-EM structure of separated conformation of EGFR:EGF (yellow) is compared to a crystal structure of the ligand-binding head of EGFR bound to EGF (pink, PDB code: 3NJP). Bottom, the cryo-EM structure of separated conformation of EGFR:EGF (yellow) is compared to a crystal structure of the ligand-binding head of EGFR bound to TGF-α (light purple, PDB code: 1MOX). Note that the cryo-EM structure of the separated conformation of the EGFR:EGF complex resembles closely the crystal structure of the ligand-binding head of EGFR bound to TGF-α (PDB code: 1MOX), but deviates from the crystal structure of the ligand-binding head of EGFR bound to EGF (PDB code: 3NJP).
Figure 5
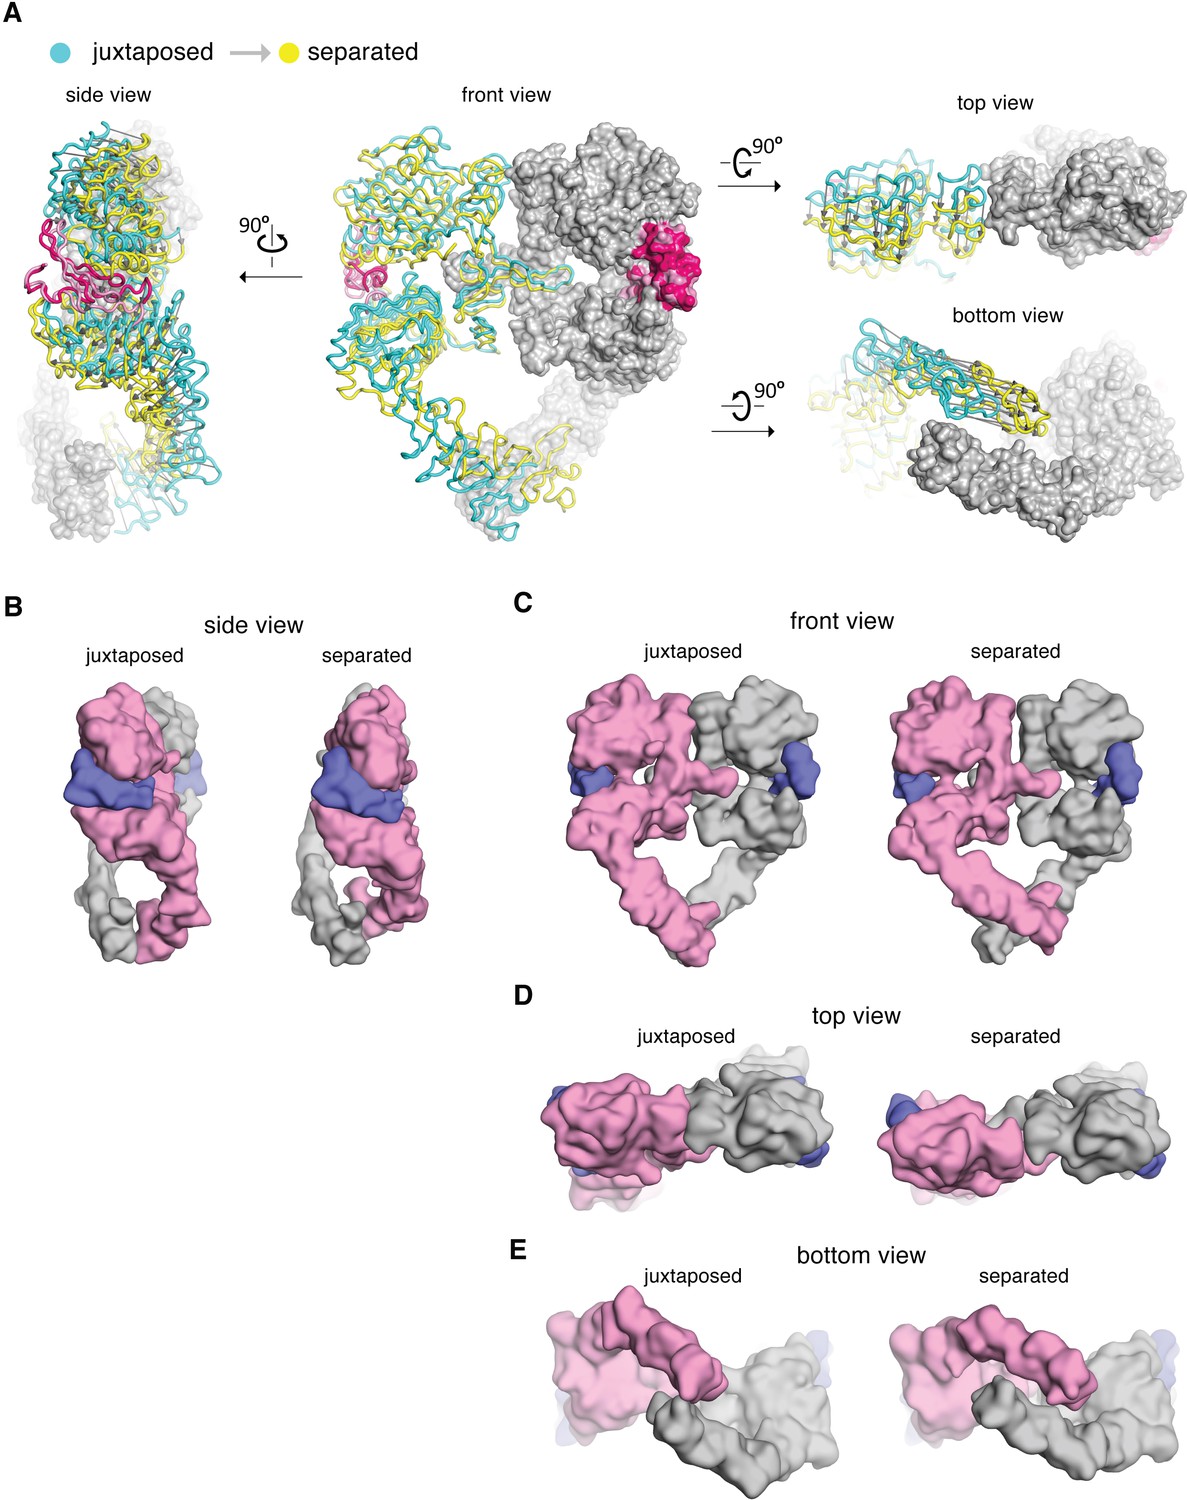
Comparison between the cryo-EM structures of the juxtaposed and the separated conformations of the extracellular module of the EGFR:EGF complex.
(A) The cryo-EM structures representing the juxtaposed conformation (cyan) and the separated conformation (yellow) are superimposed on the right-hand EGFR subunits which have similar Domain IV leg conformations (light gray). A vector (dark gray) is used to indicate the displacement of Cα atoms between the two structures, pointing from the juxtaposed structure to the separated structure. (B–E) Side-by-side comparison between the juxtaposed conformation and the separated conformation of the extracellular module of the EGFR:EGF complex. Molecular surface of the cryo-EM models of the juxtaposed and separated conformations are shown from the side (B), the front (C), the top (D), and the bottom (E). EGF molecules are shown in slate blue. The same EGFR subunit used for superposition in (A) is colored gray and the other EGFR subunit is light pink.
Figure 6

The tips-separated conformation of the extracellular module can couple more readily to the N-terminal dimer of the transmembrane helices.
(A) Models of the transmembrane helices in two configurations based on previous NMR structures. One of the structures in the NMR-based ensemble for the N-terminal dimer configuration (PDB code: 5LV6) is shown in yellow (chain A) and gray (chain B), and the structure for the C-terminal dimer configuration (PDB code: 2M0B) is shown in cyan (chain A) and gray (chain B). Shown in spheres are superimposed Cα atoms of the residue Thr 614, located at the end of the extracellular module, from the 20 structures in the NMR-based ensemble for the N-terminal dimer configuration (left) and for the C-terminal dimer configuration (right), respectively. The black dotted square indicates the linker region that is imposing a constraint on the orientation of the linkers. In the N-terminal dimer configuration of the transmembrane helices (left), the linkers from each subunit are oriented away from one another. In the C-terminal dimer configuration of the transmembrane helices (right), the linkers are oriented toward each other. (B) Enlarged view of the linker located at the junction with the transmembrane helices, zoomed in from the areas highlighted by dotted black square in A, showing well-defined conformations for this region in both NMR structures. (C), Probability distribution of the distances between the Cα atoms of the two Thr 614 residues, sampled every 250 picoseconds over 2.5 μs of MD simulations of the N-terminal dimer configuration (purple) and the C-terminal dimer configuration (cyan) of the transmembrane helices. Initial structures of the transmembrane helices dimers with the linker are shown as cartoons. Residues Thr 614 located at the end of the extracellular module are shown as spheres. Also shown as spheres are residues Ile 619 and Ala 623, located at the junction between the linker and the transmembrane helix, and the interaction between these two residues is maintained over 2.5 μs MD simulations (see E and F). (D) Free-energy change of the system when the distance between the Thr 614 residues from each subunit is driven from 27 Å to 8 Å, when the transmembrane helices are in the N-terminal dimer configuration. Results from three independent umbrella-sampling calculations are shown in green, orange, and purple. The dotted gray line indicates the value of kBT at room temperature, 2.479 kJ/mol. (E and F) Probability distribution of the distances between the Cα atoms of Ile 619 and Ala 623, sampled every 250 picoseconds over 2.5 μs of MD simulations of the N-terminal dimer configuration (E) and the C-terminal dimer configuration of the transmembrane helices (F).
Figure 7
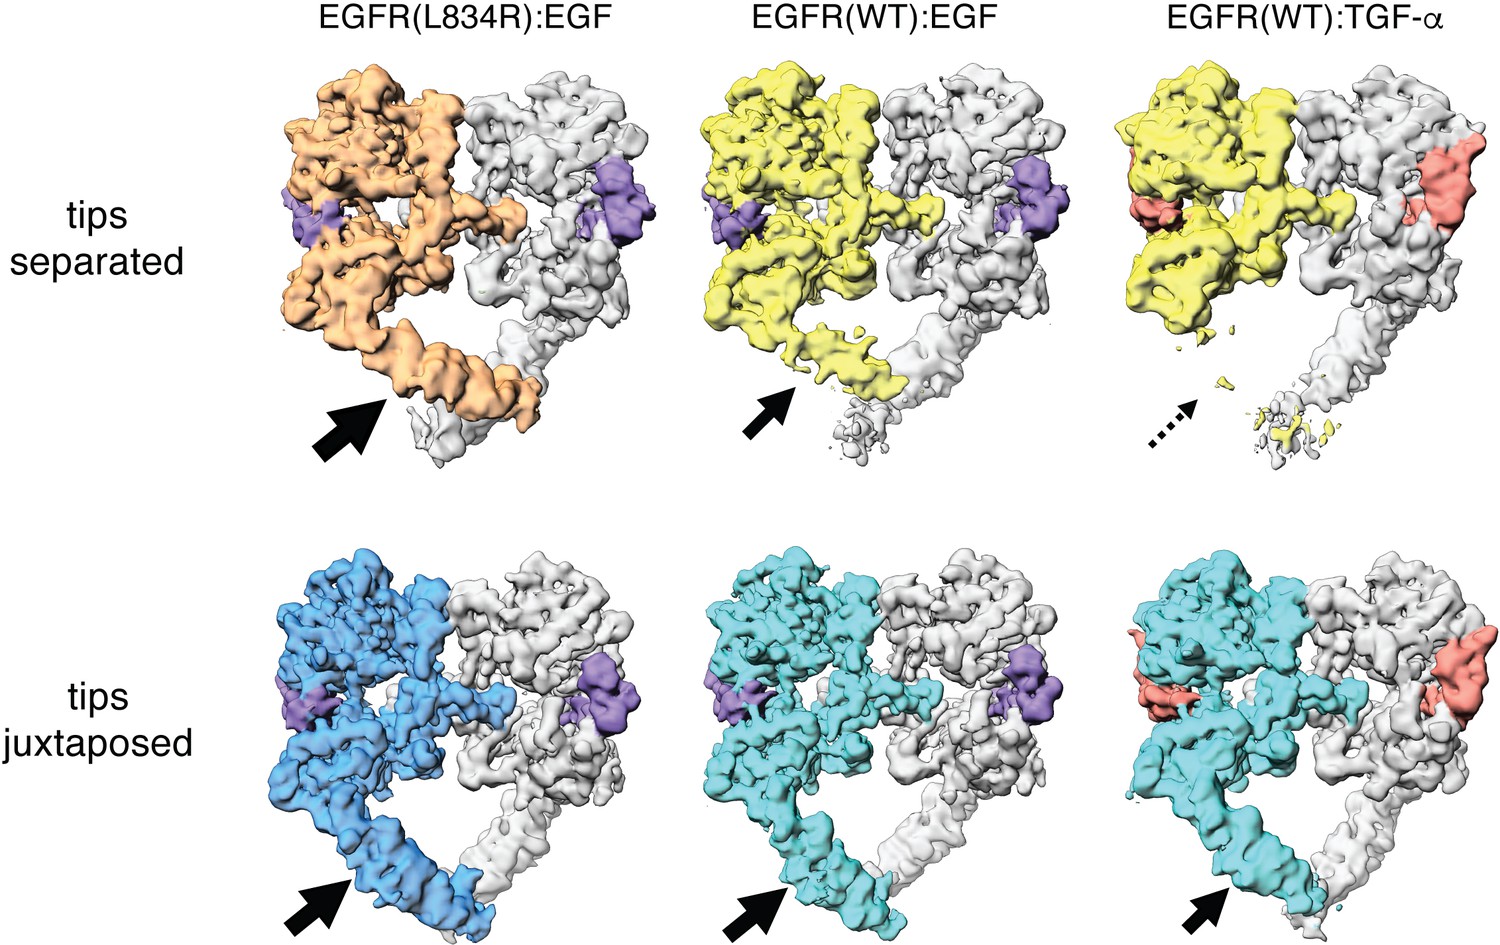
Comparison between Cryo-EM density maps of the tips-separated and the tips-juxtaposed conformations in different EGFR complexes.
Cryo-EM density maps of the tips-separated (upper row) and the tips-juxtaposed (lower row) conformations in three different EGFR complexes are shown: EGFR(L834R) bound to EGF (left), EGFR(WT) bound to EGF (middle), and EGFR(WT) bound to TGF-α (right). The black arrows highlight the difference in stabilities of the flexible Domain IV legs in these complexes.
Figure 8
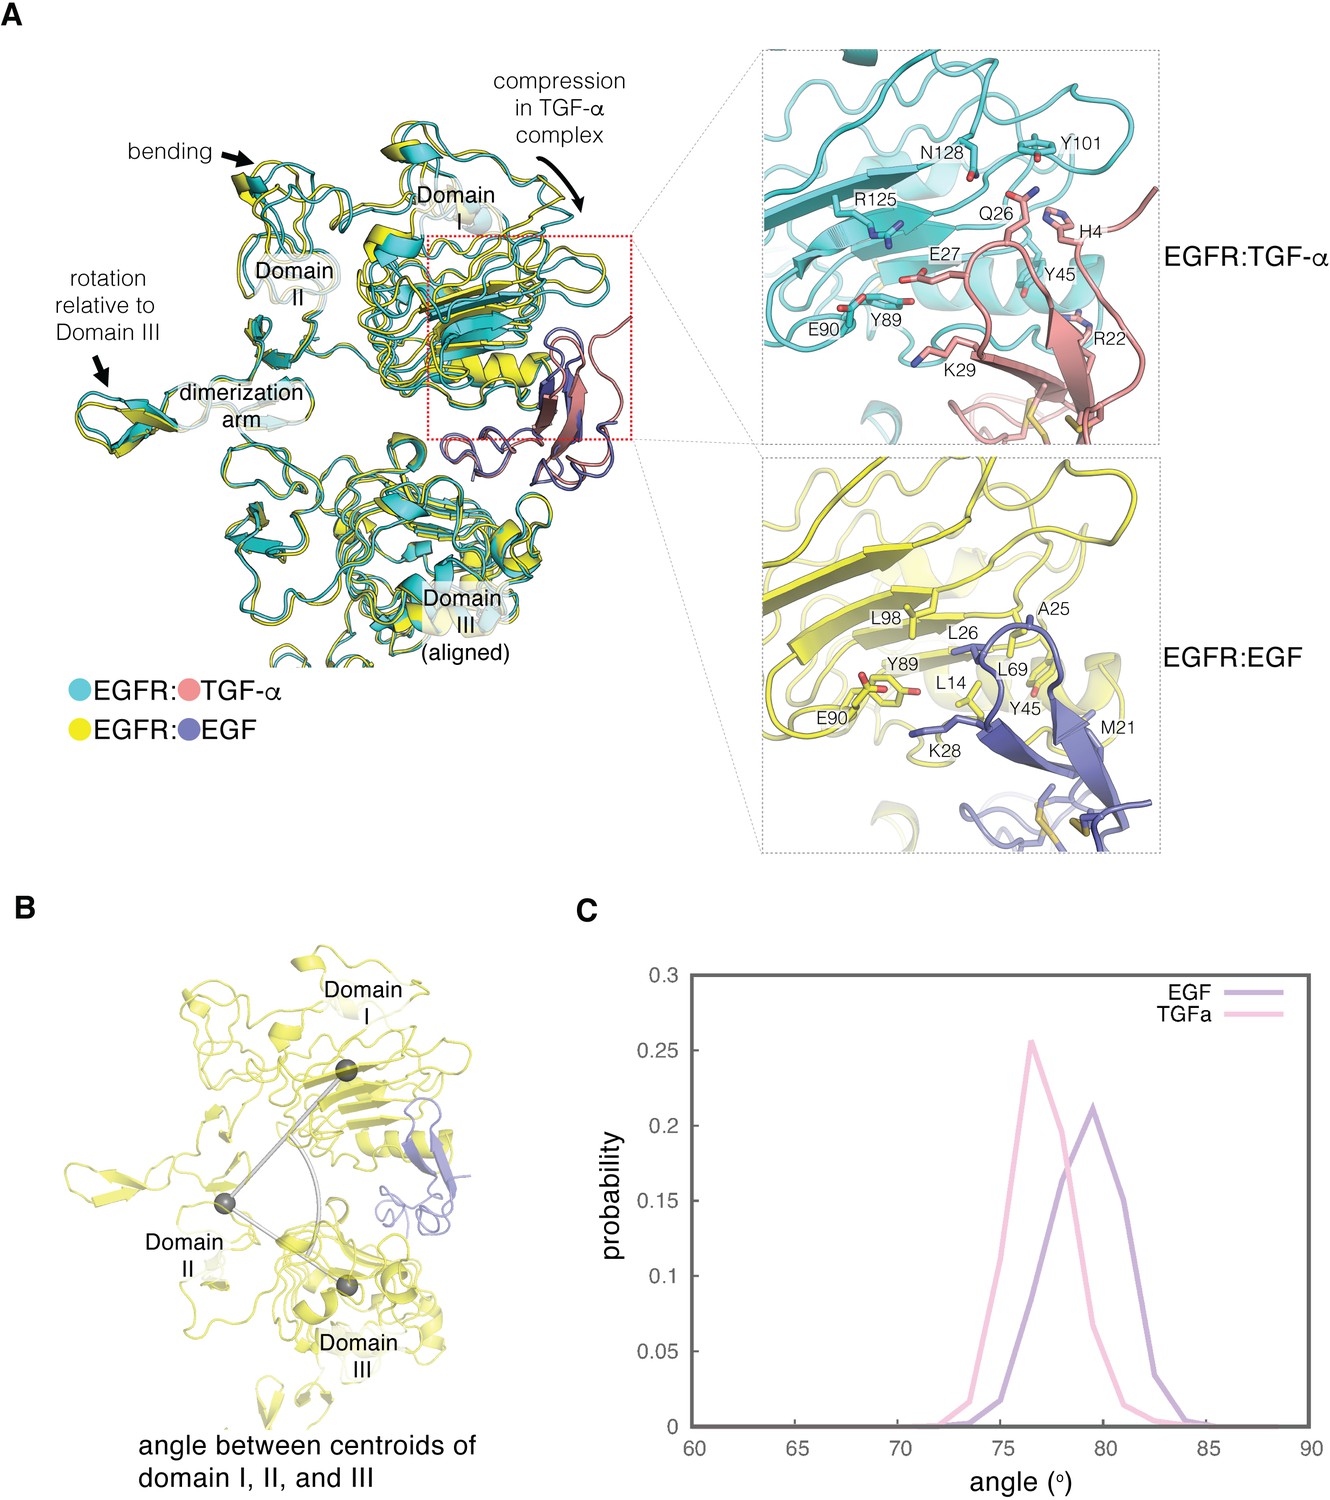
Difference in the ligand-binding heads between EGF- and TGF-α-bound EGFR complexes.
(A) The differences in structure between the separated conformations of the EGF and TGF-α complexes of EGFR are illustrated. Structures corresponding to the separated conformations of the EGFR:EGF complex (yellow:slate) and the EGFR:TGF-α complex (cyan:salmon)are aligned on Domain III of each structure. Enlarged views of the interface between Domain I of EGFR and the ligands are shown on the right. The interface between Domain I of EGFR (cyan) and TGF-α (salmon) features hydrophilic residues that are shown (upper right). The equivalent interface between Domain I of EGFR (yellow) and EGF (slate) is characterized by hydrophobic residues (lower right). (B) The angle between centroids of Domain I (residues 7–200), part of Domain II (residues 260–285), and Domain III (317-470) is used to estimate the degree of closure of the ligand-binding site in a ligand-bound EGFR complex. (C), Probability distribution of the angles defined in B, sampled every nanosecond over ~1.8 μs and ~2.0 μs of MD simulations of the EGFR extracellular module bound to EGF (purple) and TGF-α (pink), respectively.
Figure 9 with 1 supplement

EGF and TGF-α differ in their abilities to stabilize the tips-separated conformation and to generate different levels of EGFR activation.
(A) Destabilization of the flexible Domain IV leg in the separated conformation of the EGFR:TGF-α complex. The EGFR:TGF-α complex (upper left) is colored in cyan:salmon and the EGFR:EGFcomplex (lower left) is colored in yellow:slate. The flexible leg in the EGFR:TGF-α complex (green, red dotted line) is modeled based on the conformation of Domains III and IV in the left-hand subunit of the EGFR:EGF complex (lower left). When viewed from the bottom (right), the two Domain IV legs are accommodated in the EGFR:EGF complex (yellow), but not in the EGFR:TGF-α complex. There are steric clashes between the legs (green and cyan), within the dotted red line. (B) Location of the Trp 492 (purple), shown in the crystal structure of EGFR bound to EGF (cyan, PDB code: 3NJP). (C) Western-blot analysis of Erk phosphorylation in HEK293T cells transiently transfected with wild-type EGFR or EGFR variant, W492G. Anti-phospho-Erk antibody is used to detect phosphorylation of p44 and p42 MAP kinase (Erk1 and Erk2), and anti-FLAG antibody is used to detect the total amount of EGFR in the cell lysate loaded to each lane. (D) Mutations introduced to the linker at the junction between the extracellular module and the transmembrane helices, shown in the NMR structure of the N-terminal dimer configuration of the transmembrane helices (PDB code: 5LV6). (E) Western-blot analysis of Erk phosphorylation in HEK293T cells transiently transfected with two EGFR variants, linker insertion (left) and linker replacement (right). In linker insertion variant, Gly-Gly-Ser-Gly-Gly-Ser-Gly-Gly-Ser is inserted between Pro 617 and Lys 618. In linker replacement variant, the linker (Asn 615-Pro 620) is replaced by Gly-Gly-Ser-Gly-Gly-Ser.
-
Figure 9—source data 1
Original files of the full raw uncropped blots shown in Figure 9, with the relevant bands labeled.
- https://cdn.elifesciences.org/articles/73218/elife-73218-fig9-data1-v2.tif
-
Figure 9—source data 2
Original files of the full raw uncropped blots shown in Figure 9, with the relevant bands labeled.
- https://cdn.elifesciences.org/articles/73218/elife-73218-fig9-data2-v2.tif
-
Figure 9—source data 3
Original files of the full raw uncropped blots shown in Figure 9, with the relevant bands labeled.
- https://cdn.elifesciences.org/articles/73218/elife-73218-fig9-data3-v2.tif
-
Figure 9—source data 4
Original files of the full raw uncropped blots shown in Figure 9, with the relevant bands labeled.
- https://cdn.elifesciences.org/articles/73218/elife-73218-fig9-data4-v2.tif
Figure 9—figure supplement 1
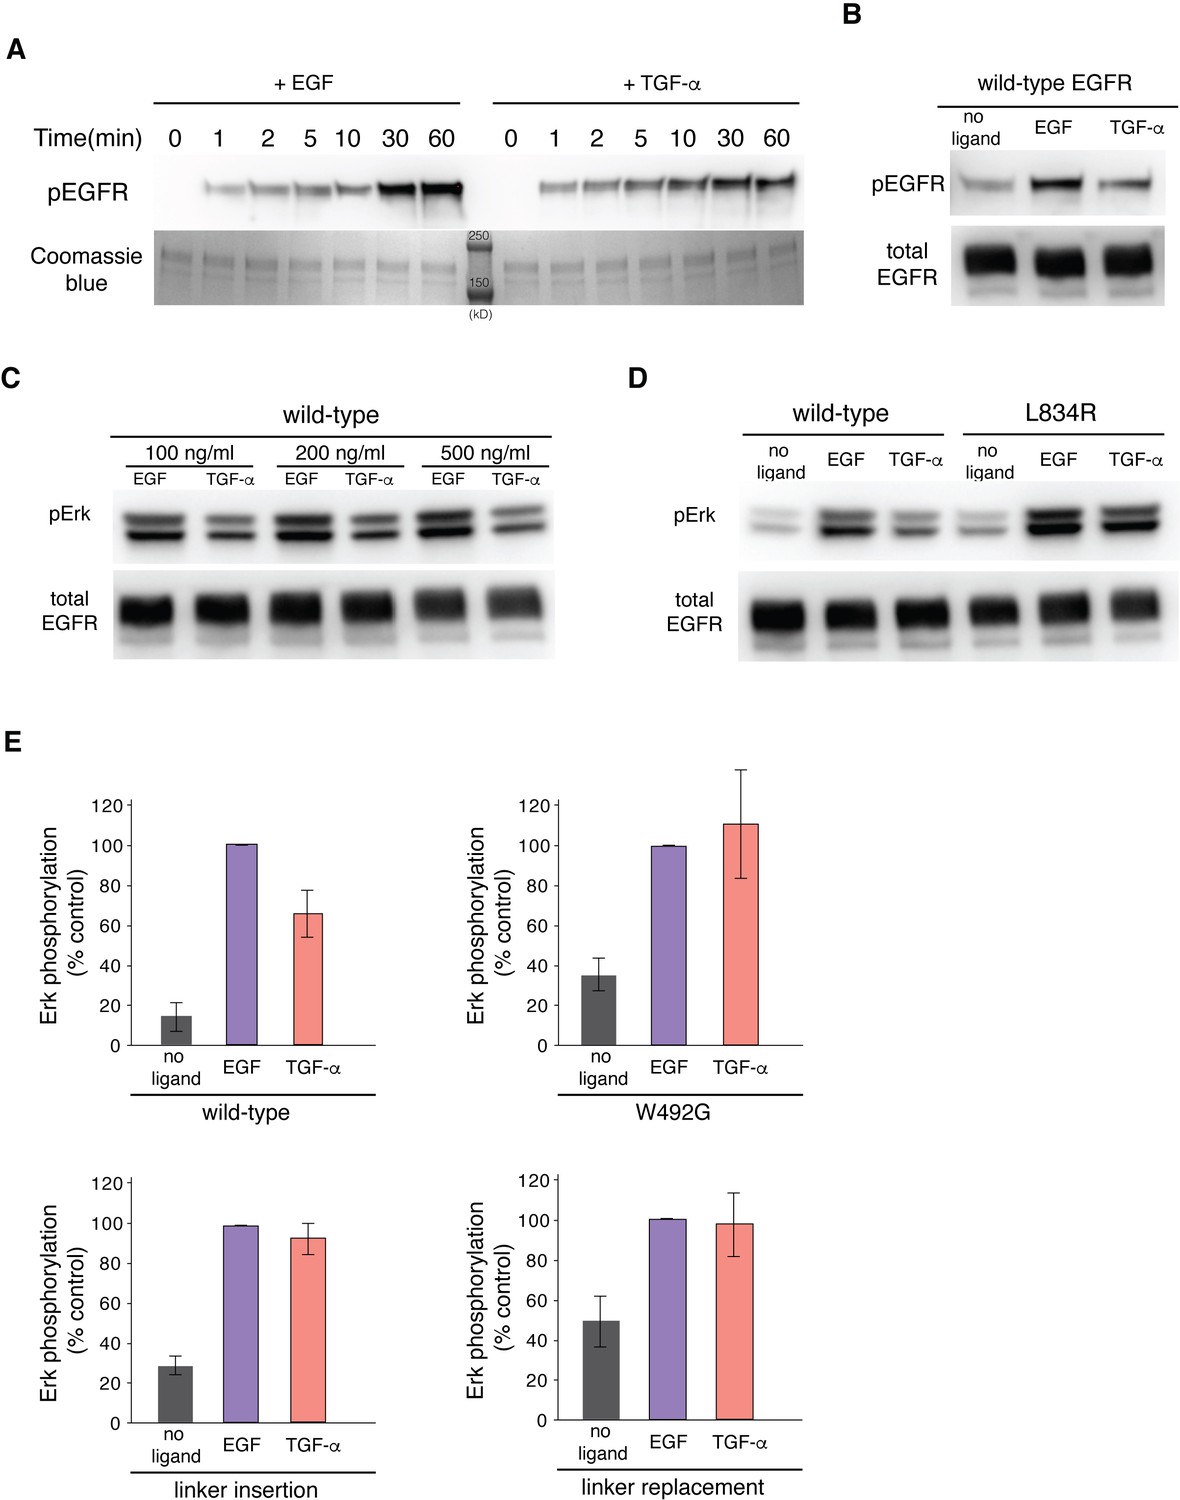
EGF and TGF-α generate different levels of EGFR autophosphorylation and Erk phosphorylation.
(A) Western-blot analysis of EGFR autophosphorylation in purified full-length EGFR protein stimulated by EGF and TGF-α. A pan-phosphotyrosine antibody is used to detect total phosphorylation of the receptor at the indicated time points after the reaction was initiated by addition of ATP. Coomassie brilliant blue staining shows the total amount of EGFR protein loaded to each lane on the gel. Two protein standard bands (250 kD and 150 kD) were shown in the middle lane. (B) Western-blot analysis of EGFR autophosphorylation in HEK293T cells transiently transfected with EGFR. A pan-phosphotyrosine antibody is used to detect total phosphorylation of the receptor in cells that are left unstimulated, stimulated by EGF, and stimulated by TGF-α. An anti-FLAG antibody is used to detect the total amount of EGFR proteins in the cell lysate loaded to each lane. (C) Western-blot analysis of Erk phosphorylation in HEK293T cells transiently transfected with wild-type EGFR stimulated by EGF and TGF-α at indicated concentrations that are higher than the saturating concentration. Anti-phospho-Erk antibody is used to detect phosphorylation of p44 and p42 MAP kinase (Erk1 and Erk2), and anti-FLAG antibody is used to detect the total amount of EGFR in the cell lysate loaded to each lane. (D) Western-blot analysis of Erk phosphorylation in HEK293T cells transiently transfected with wild-type EGFR or EGFR variant, L834R. Anti-phospho-Erk antibody is used to detect phosphorylation of p44 and p42 MAP kinase (Erk1 and Erk2), and anti-FLAG antibody is used to detect the total amount of EGFR in the cell lysate loaded to each lane. (E) Quantifications of western blots of Erk phosphorylation in HEK293T cells transiently transfected with wild-type EGFR or EGFR variants, as shown in Figure 9 (W492G, linker insertion, and linker replacement). Bar graphs representing the relative levels of Erk phosphorylation in cells left unstimulated, stimulated by 100 ng/ml of EGF or TGF-α. For each EGFR variants, the Erk phosphorylation level in cells treated by EGF was used as the reference (100 % control). 3–5 biological replicates were analyzed for each EGFR variants.
-
Figure 9—figure supplement 1—source data 1
Original files of the full raw uncropped blots shown in Figure 9—figure supplement 1, with the relevant bands labeled.
- https://cdn.elifesciences.org/articles/73218/elife-73218-fig9-figsupp1-data1-v2.tif
-
Figure 9—figure supplement 1—source data 2
Original files of the full raw uncropped blots shown in Figure 9—figure supplement 1, with the relevant bands labeled.
- https://cdn.elifesciences.org/articles/73218/elife-73218-fig9-figsupp1-data2-v2.tif
-
Figure 9—figure supplement 1—source data 3
Original files of the full raw uncropped blots shown in Figure 9—figure supplement 1, with the relevant bands labeled.
- https://cdn.elifesciences.org/articles/73218/elife-73218-fig9-figsupp1-data3-v2.tif
-
Figure 9—figure supplement 1—source data 4
Original files of the full raw uncropped blots shown in Figure 9—figure supplement 1, with the relevant bands labeled.
- https://cdn.elifesciences.org/articles/73218/elife-73218-fig9-figsupp1-data4-v2.tif
Figure 10

A mechanism for differential activation of EGFR by EGF and TGF-α.
(A) Schematic representations of the ligand-bound extracellular module of EGFR illustrate the differential modulation of the conformation of the Domain IV legs by TGF-α (left), EGF(middle) and oncogenic L834R mutation (right). Cryo-EM densities for the Domain IV legs in the juxtaposed conformation is similarly defined in all three complexes (EGFR(WT):TGF-α, EGFR(WT):EGF, and EGFR(L834R):EGF). In contrast, density for the Domain IV legs in the separated conformation is poorly defined in the EGFR(WT):TGF-α complex and best defined in the EGFR(L834R):EGF complex. Increased stability of the tips-separated conformation of the extracellular module is correlated with higher level of EGFR activity. (B) Schematic diagrams illustrate two extreme dimeric conformations of the ligands-bound full-length EGFR, representing a lower activity state (left) and a higher activity state (right). It shows how different EGFR ligands and oncogenic mutation could generate different EGFR activity by altering the balance between these dimeric conformations of the full-length EGFR.
Additional files
Download links
A two-part list of links to download the article, or parts of the article, in various formats.
Downloads (link to download the article as PDF)
Open citations (links to open the citations from this article in various online reference manager services)
Cite this article (links to download the citations from this article in formats compatible with various reference manager tools)
A molecular mechanism for the generation of ligand-dependent differential outputs by the epidermal growth factor receptor
eLife 10:e73218.
https://doi.org/10.7554/eLife.73218


