Personalized computational heart models with T1-mapped fibrotic remodeling predict sudden death risk in patients with hypertrophic cardiomyopathy
- Department of Biomedical Engineering, Johns Hopkins University, United States
- Division of Pediatric Cardiology, Johns Hopkins School of Medicine, United States
- Department of Radiology, Johns Hopkins School of Medicine, United States
- Division of Pediatric Cardiology, Nemours/Alfred I. duPont Hospital for Children, United States
- Division of Cardiology, University of California, San Francisco, United States
- Department of Bioengineering, University of Washington, United States
Figures
Figure 1
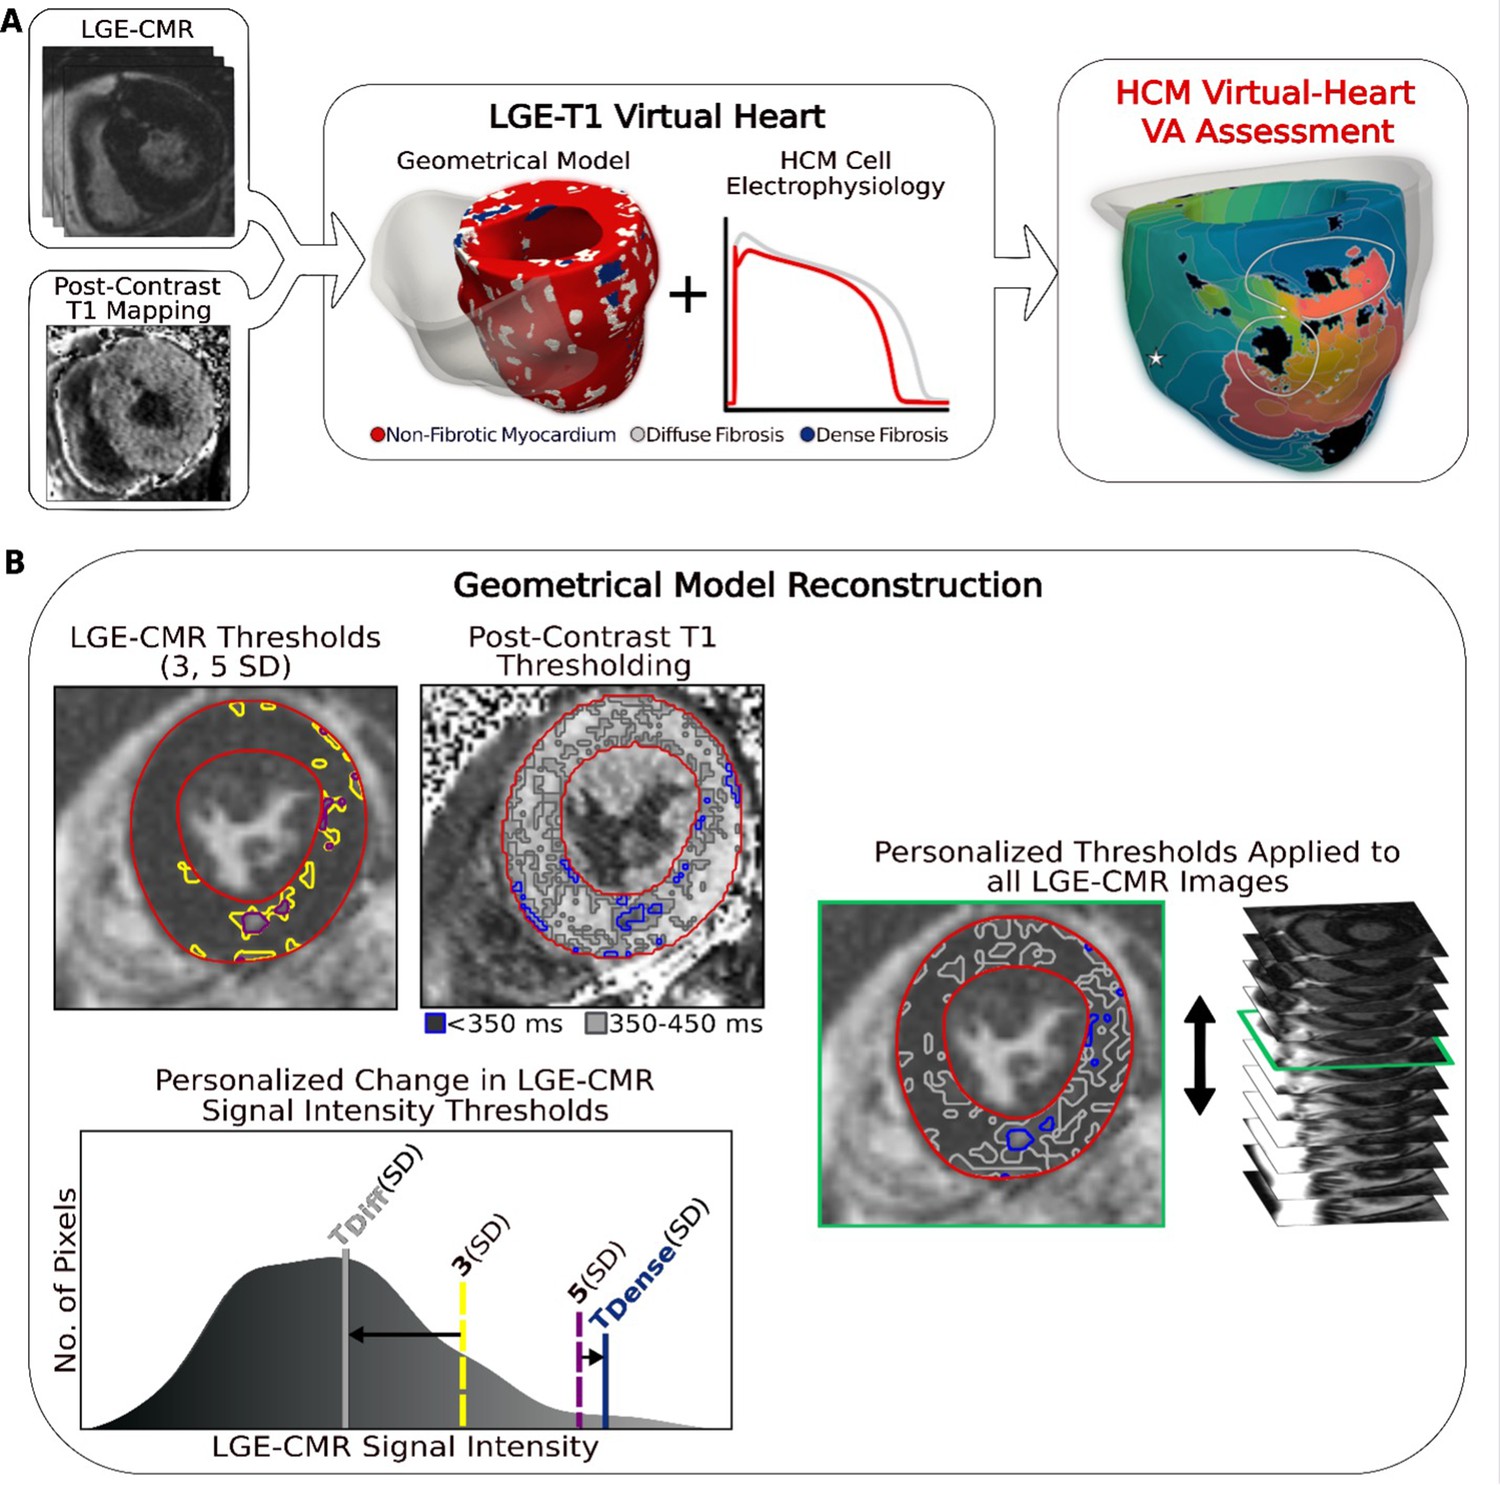
Overview of the approach and geometrical model reconstruction.
(A) Flowchart summarizing the virtual-heart ventricular arrhythmia (VA) risk stratification approach for hypertrophic cardiomyopathy (HCM) patients. A combination of late gadolinium enhancement (LGE)-cardiac magnetic resonance (CMR) and postcontrast T1 mapping is used to construct personalized left ventricular (LV) geometrical models with fibrotic remodeling. Incorporating HCM-specific electrophysiological properties (action potential kinetics, conduction velocity) completes the generation of each personalized LGE-T1 virtual heart, which is then used to assess VA propensity in the substrate via rapid pacing. right ventricle (RV) is shown in transparent gray. Dense fibrosis (scar) is considered nonconductive. (B) Fusing LGE-CMR and postcontrast T1 map information to generate the personalized, geometrical virtual-heart model. Top left: LV segmentation with intermediate and high signal intensity thresholds of 3 (yellow) and 5 standard deviation (SD) (purple), respectively, on short-axis LGE-CMR. Bottom left: mid-ventricular postcontrast T1 map segmentation with relaxation time thresholds of <350 (blue) and 350–450 ms (gray). Right: the thresholds of the LGE-CMR signal intensity were adjusted to new, personalized thresholds, TDiffuse and TDense, based on the T1 map (see text for detail). The new personalized signal intensity thresholds in the matching LGE-CMR slice were then applied to all LGE-CMR short-axis slices.
Figure 2
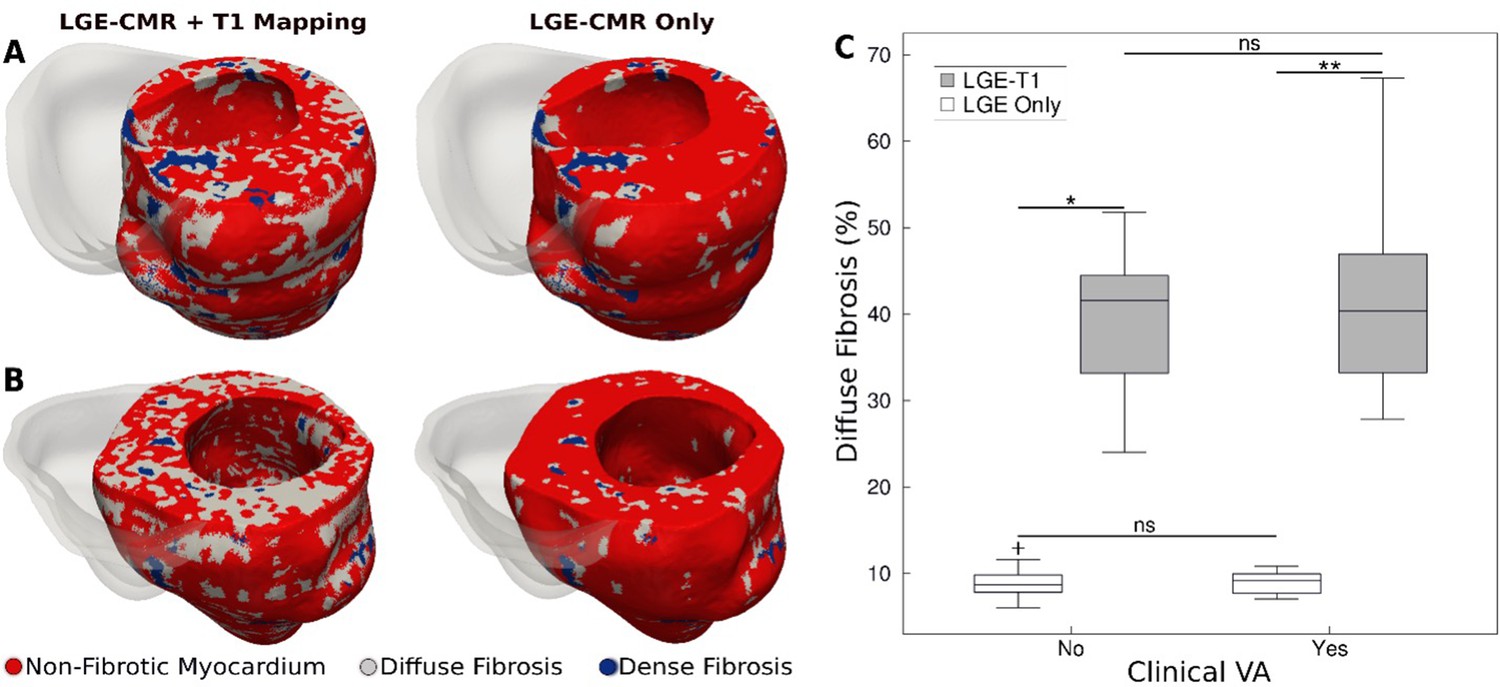
Fibrotic remodeling.
(A,B) Examples of hypertrophic cardiomyopathy (HCM) personalized left ventricular (LV) geometrical models with fibrotic remodeling (right ventricle [RV] shown in transparent gray) reconstructed using late gadolinium enhancement (LGE)-cardiac magnetic resonance (CMR) images with personalized T1-informed fibrosis segmentation thresholds (left) and using LGE-CMR images with one-size-fits-all fibrosis segmentation thresholds of 3 and 5 standard deviation [SD] (right). There is significantly more diffuse fibrosis in the T1-adjusted models. (A) Heart model from an HCM patient without clinical ventricular arrhythmia (VA). (B) Heart model from an HCM patient with clinical VA. (C) Boxplot of the amount of diffuse fibrosis in LGE-T1 and LGE-only HCM geometrical models without clinical VA (LGE-T1: N = 13, interquartile range [IQR] = 12.54; LGE only: N = 13, IQR = 2.41; *p < 0.0001) and with clinical VA (LGE-T1: N = 13, IQR = 14.44; LGE only: N = 13, IQR = 2.46; **p < 0.0001). The '+' denotes an outlier.
-
Figure 2—source data 1
Spreadsheet including source data underlying Figure 2.
- https://cdn.elifesciences.org/articles/73325/elife-73325-fig2-data1-v1.xlsx
Figure 3
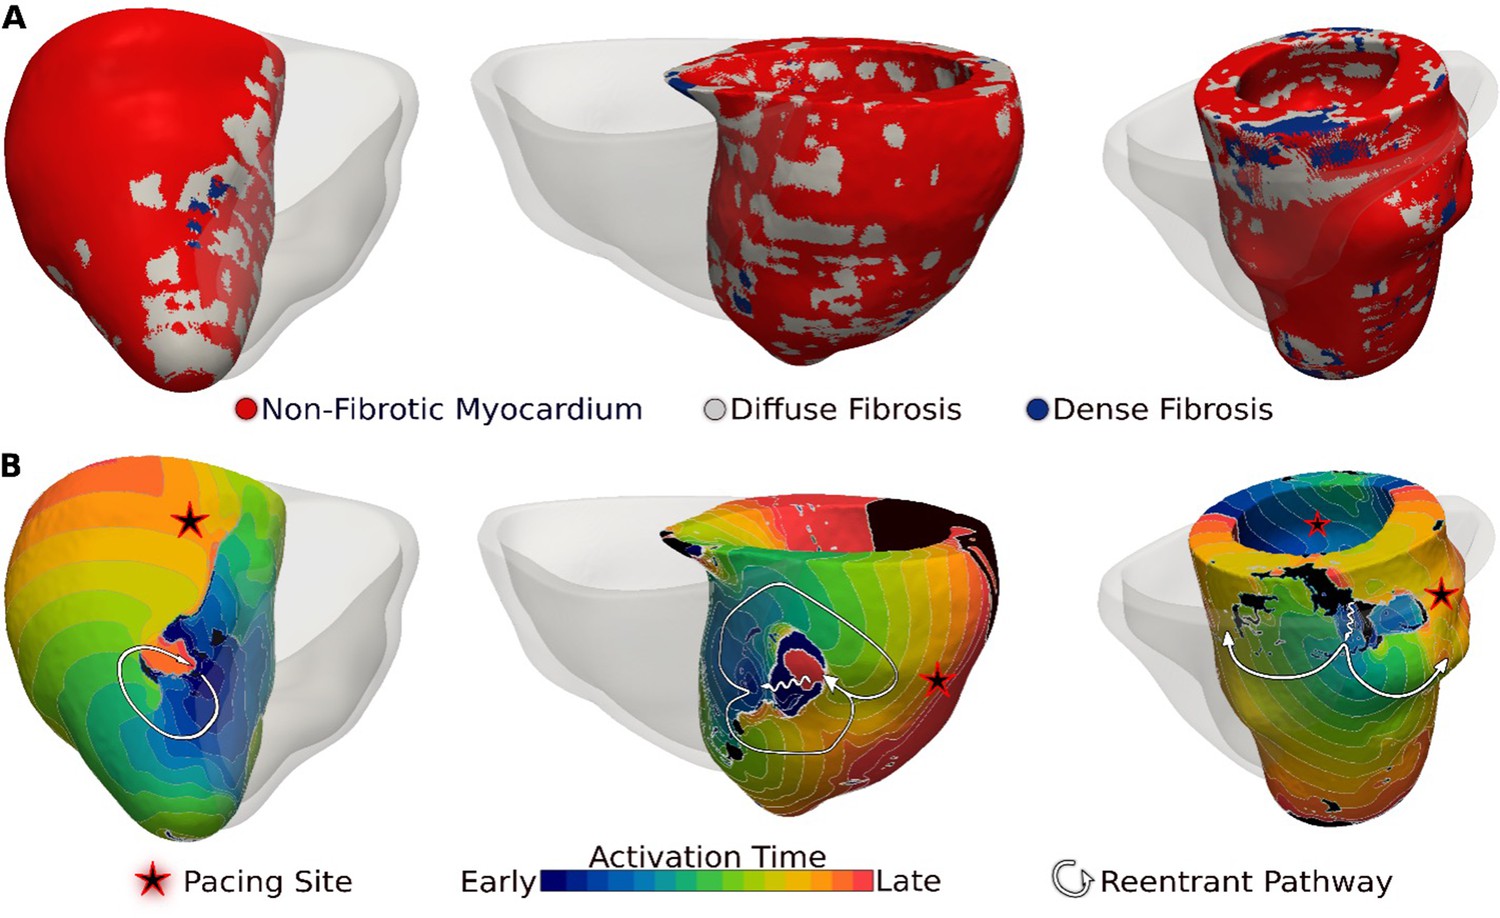
Ventricular arrhythmias (VAs) induced in three late gadolinium enhancement (LGE)-T1 virtual hearts from patients with known clinical VAs.
(A) Reconstructed patient-specific geometrical models. (B) Activation patterns of the reentry induced from the pacing site(s) marked with star. Black regions did not activate during the timeframe shown.
Figure 4
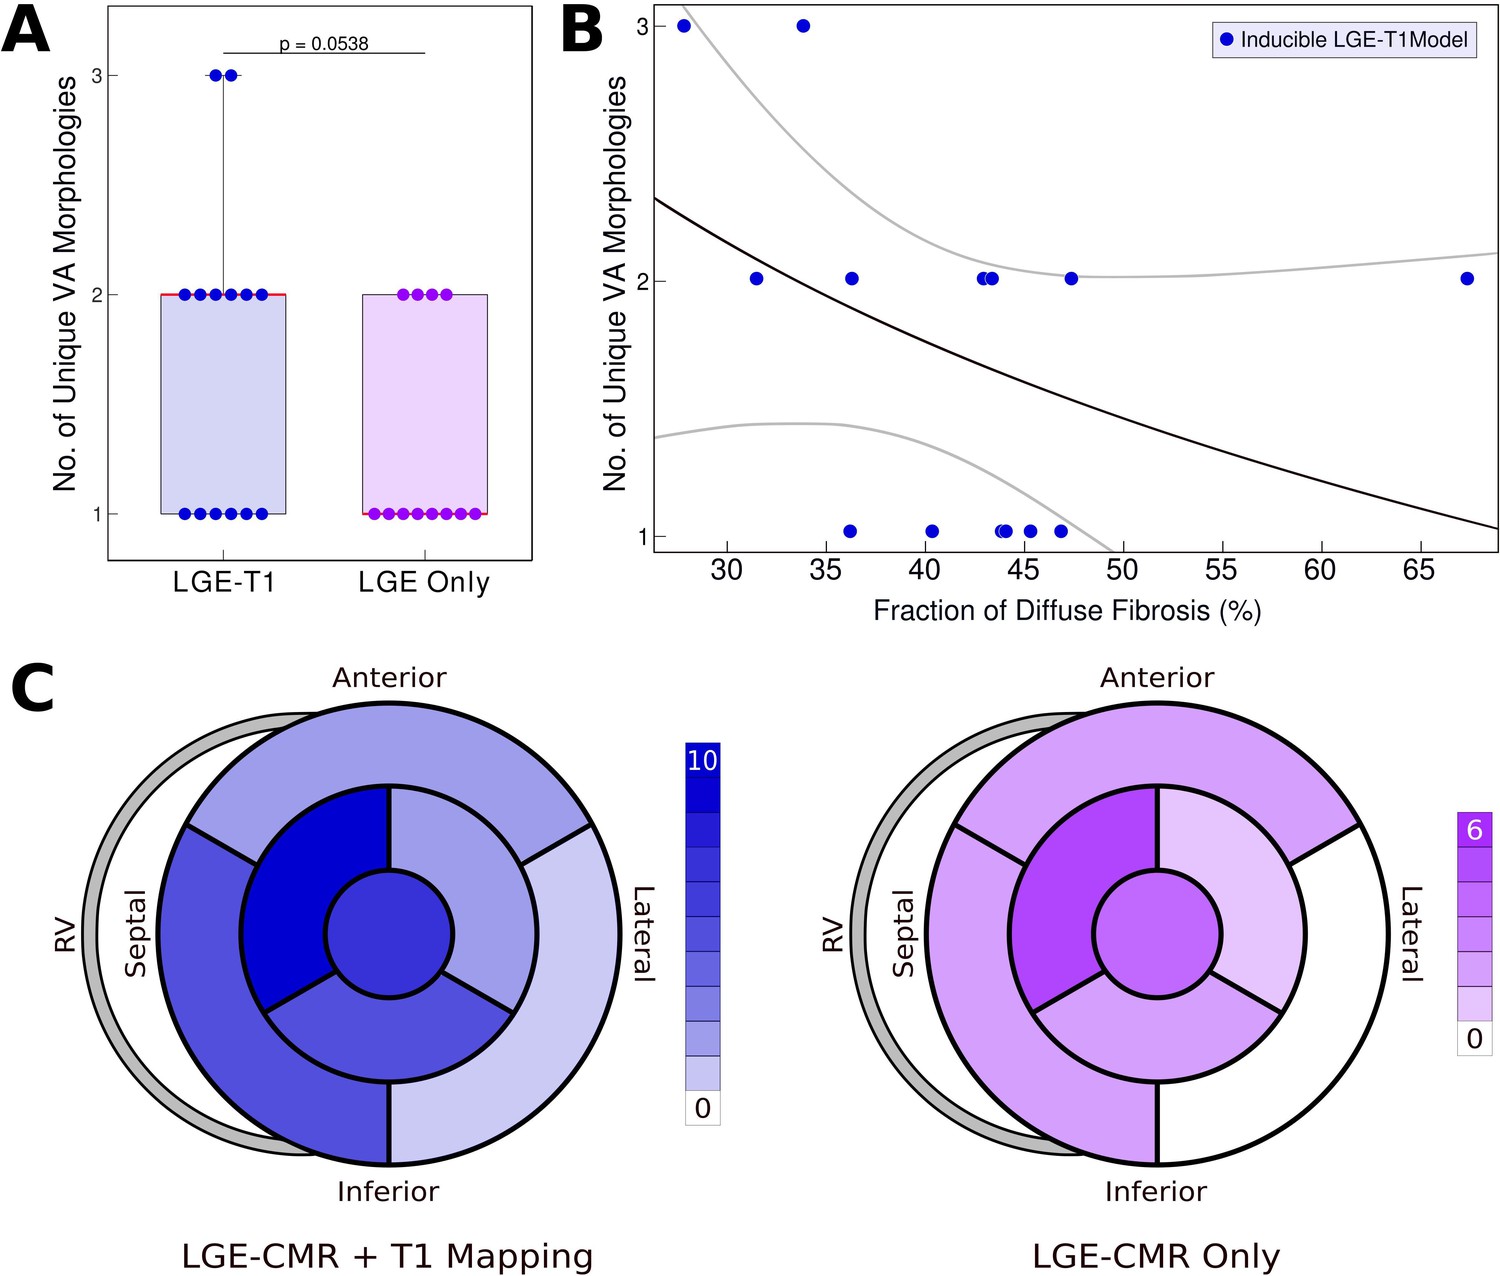
Relationship between T1-based diffuse fibrosis and ventricular arrhythmia (VA) inducibility in late gadolinium enhancement (LGE)-T1 and LGE-only personalized virtual-heart models of hypertrophic cardiomyopathy (HCM) patients.
(A) Comparison of the number of unique VA morphologies between inducible LGE-T1 and LGE-only models for all VA-inducing pacing sites (LGE-T1: N = 14, interquartile range [IQR] = 1; LGE only: N = 12, IQR = 0.75; p = 0.0538, confidence interval [CI]: [1.25, 1.75]). (B) Correlation between amount of T1-based diffuse fibrosis and the number of unique VA morphologies induced in LGE-T1 models using logistic regression (R = 0.40, p = 0.157). (C) The distribution of the pacing sites that induced VAs in LGE-T1 and LGE-only models.
-
Figure 4—source data 1
Spreadsheet including source data underlying Figure 4.
- https://cdn.elifesciences.org/articles/73325/elife-73325-fig4-data1-v1.xlsx
Figure 5
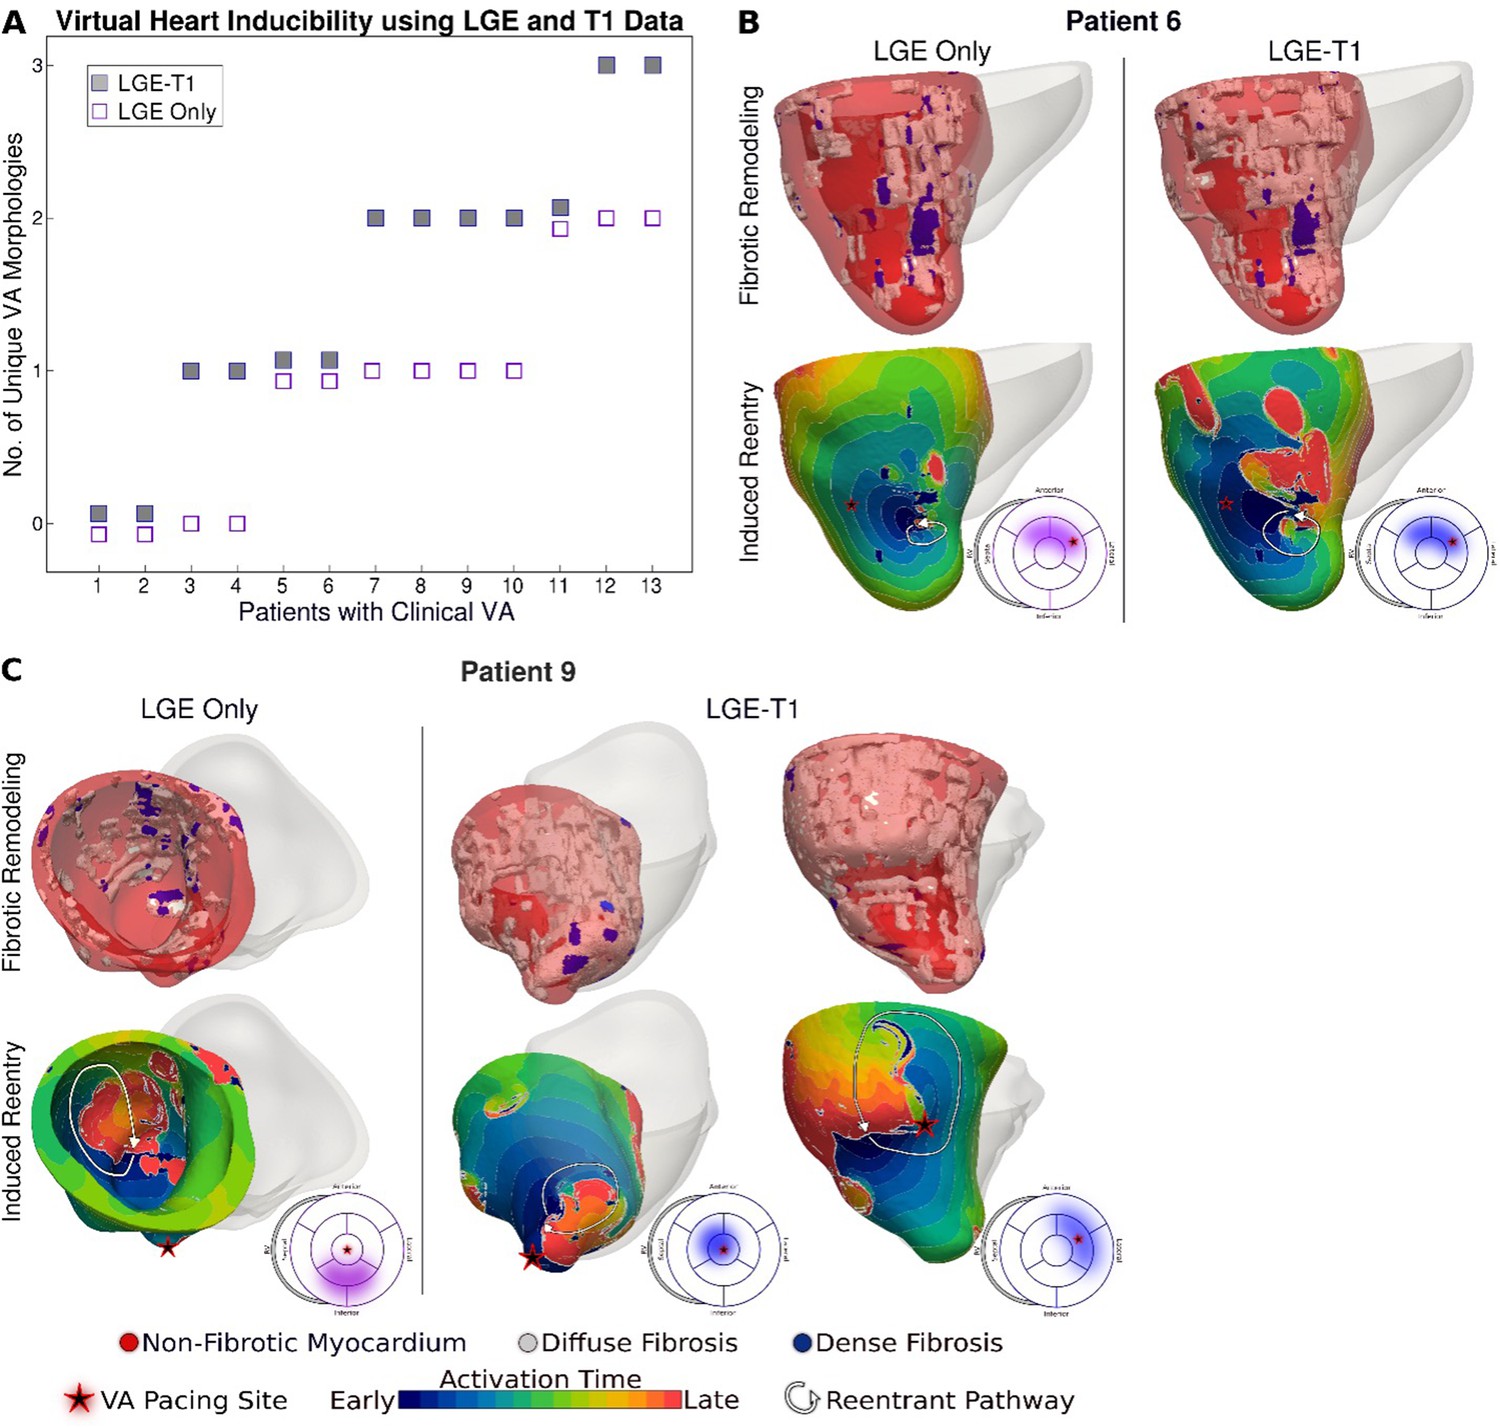
Comparison of arrhythmogenesis in hypertrophic cardiomyopathy (HCM) models of patients with clinical ventricular arrhythmias (VAs).
(A) Plot of the number of unique VA morphologies for patients with clinical VA using late gadolinium enhancement (LGE)-T1 and LGE-only models. (B, C) Comparison of VAs in corresponding LGE-T1 and LGE-only models. Pacing site(s) are marked with stars. Bullseye plots show the pacing site location (star) and the location of the reentrant pathway in LGE-T1 (blue) and LGE-only (purple) models.
-
Figure 5—source data 1
Spreadsheet including source data underlying Figure 5.
- https://cdn.elifesciences.org/articles/73325/elife-73325-fig5-data1-v1.xlsx
Tables
Table 1
Patient characteristics (N = 26).
| Clinical characteristic | Patients without VA, n = 13 | Patients with VA, n = 13 | p value |
|---|---|---|---|
| Male | 12 (92) | 9 (69) | 0.08 |
| Age at CMR, years | 49.7 [19–76] | 49.8 [22–78] | 0.98 |
| NYHA III/IV | 4 (31) | 4 (31) | – |
| Myectomy | 1 (8) | 1 (8) | – |
| ASA | 1 (8) | 2 (15) | 0.34 |
| Amiodarone | 0 (0) | 1 (8) | 0.34 |
| Persistent AF | 3 (23) | 4 (31) | 0.34 |
| LA diameter, mm | 43.8 ± 6.3 | 38.3 ± 12.7 | 0.26 |
| Max LVOTG, mm Hg | 57.8 [4–154] | 50.8 [8–160] | 0.72 |
| MWT, mm | 20.5 ± 5.0 | 19.6 ± 5.6 | 0.65 |
| FS, % | 38.0 ± 10.2 | 40.3 ± 10.8 | 0.40 |
| FHSCD | 3 (23) | 4 (31) | 0.34 |
| Unexplained syncope | 3 (23) | 3 (23) | – |
Table 2
Left ventricular (LV) wall thickness in hypertrophic cardiomyopathy (HCM) patients with and without clinical ventricular arrhythmia (VA).
| Patients without VA, n = 13 | Patients with VA, n = 13 | p value | |
|---|---|---|---|
| Wall thickness (mean ± standard deviation [SD]) | |||
| Septum, mm | 11.3 ± 8.4 | 13.1 ± 9.2 | 0.61 |
| Anterior, mm | 11.3 ± 7.4 | 10.7 ± 7.3 | 0.84 |
| Posterior, mm | 11.1 ± 7.2 | 11.3 ± 7.3 | 0.94 |
| Apex, mm | 7.9 ± 5.3 | 7.2 ± 4.8 | 0.73 |
-
p values were calculated using Student’s t-test (p ≤ 0.05 considered statistically significant).
Table 3
Predictive capability of hypertrophic cardiomyopathy (HCM) virtual-heart technology.
| Sensitivity | Specificity | PPV | NPV | Accuracy | |
|---|---|---|---|---|---|
| ACCF/AHA risk model | 46.2 | 46.2 | 46.2 | 46.2 | 46.2 |
| ESC risk model | 53.9 | 38.5 | 46.7 | 45.5 | 46.2 |
| Virtual-heart technology: LGE-T1 | 84.6 | 76.9 | 78.8 | 83.3 | 80.1 |
| Virtual-heart technology: LGE only | 69.2 | 76.9 | 75.0 | 71.4 | 73.1 |
-
ACCF = American College of Cardiology Foundation, AHA = American Heart Association, ESC = European Society of Cardiology, LGE = late gadolinium enhancement.
Additional files
Download links
A two-part list of links to download the article, or parts of the article, in various formats.
Downloads (link to download the article as PDF)
Open citations (links to open the citations from this article in various online reference manager services)
Cite this article (links to download the citations from this article in formats compatible with various reference manager tools)
Personalized computational heart models with T1-mapped fibrotic remodeling predict sudden death risk in patients with hypertrophic cardiomyopathy
eLife 11:e73325.
https://doi.org/10.7554/eLife.73325


