Polyunsaturated fatty acids inhibit a pentameric ligand-gated ion channel through one of two binding sites
- Department of Anesthesiology, Washington University in St. Louis, United States
- Department of Developmental Biology, Washington University in St. Louis, United States
- Center for the Computational and Integrative Biology, Rutgers University, United States
- Department of Physics, Rutgers University, United States
- Department of Psychiatry, Washington University in St. Louis, United States
- Taylor Institute for Innovative Psychiatric Research, Washington University in St. Louis, United States
Figures
Figure 1 with 1 supplement
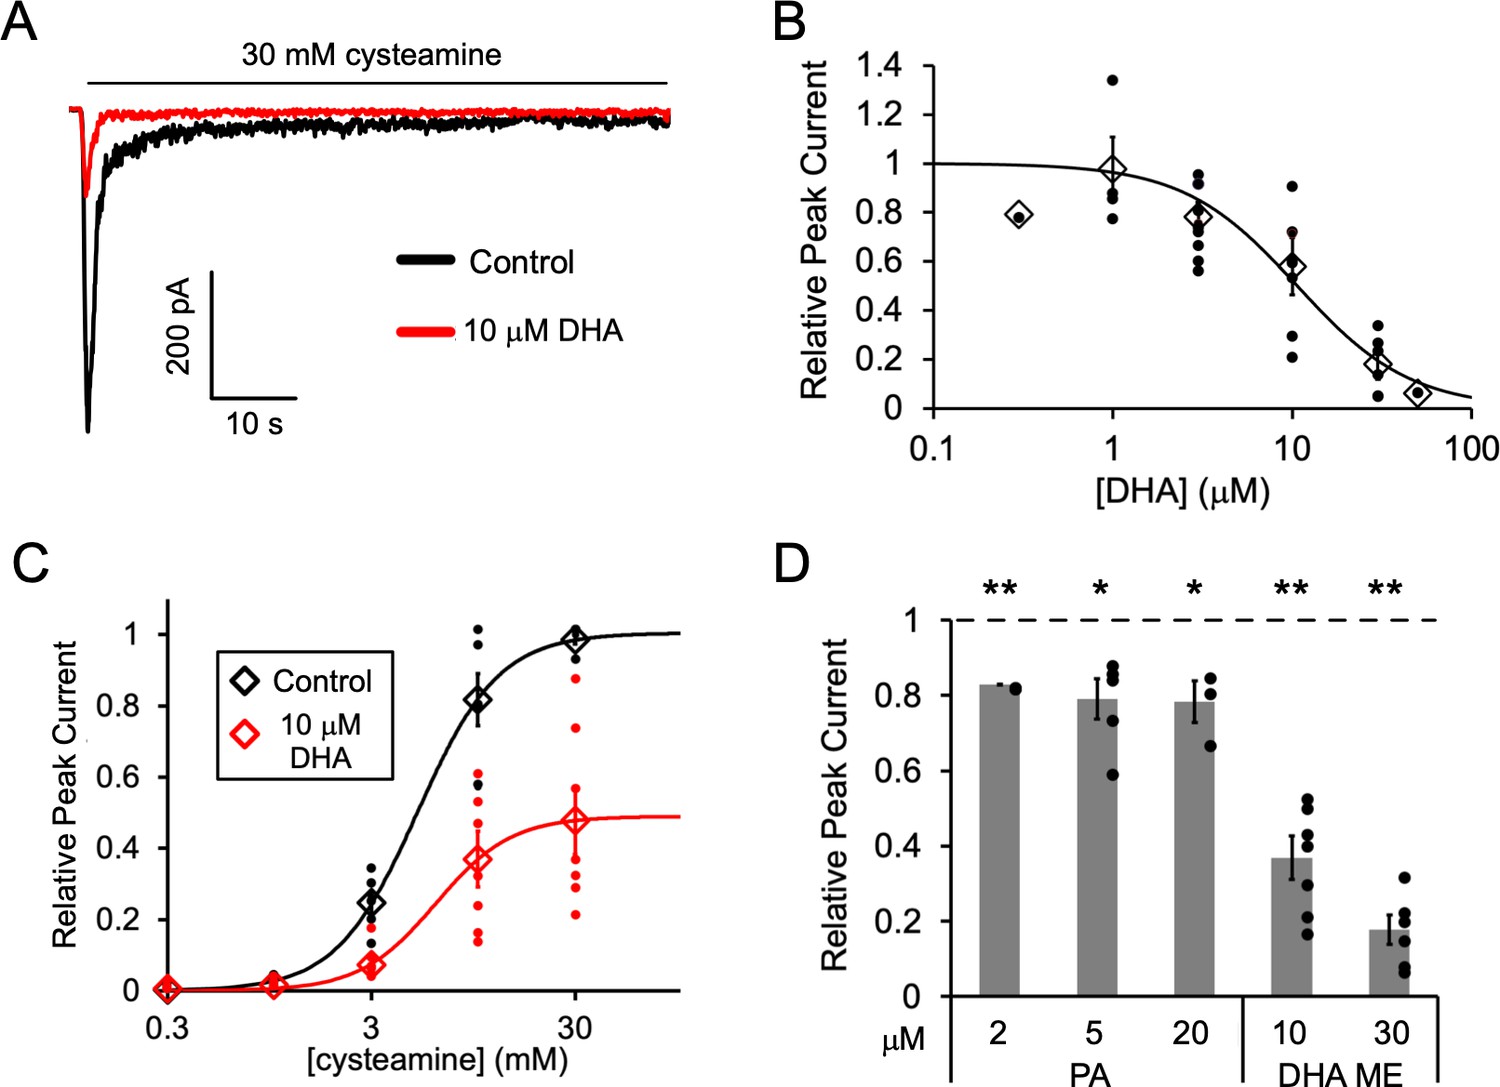
Fatty acid inhibition of ELIC.
(A) Sample currents from excised patch-clamp (–60 mV) of WT ELIC in 2:1:1 POPC:POPE:POPG giant liposomes. Current responses are to 30 mM cysteamine before and after 3 min pre-application 10 μM DHA. (B) Peak current responses to 30 mM cysteamine normalized to control (absence of DHA) as a function of DHA concentration (n = 4–8, 0.3, and 50 μM n = 1,± SEM). The data are fit to a sigmoidal function yielding an IC50 of 10.6 μM. (C) Peak current responses normalized to maximum response as a function of cysteamine concentration in the absence or presence of 10 μM DHA (n = 7,± SEM, control EC50 = 5.5 ± 0.7 mM, 10 μM DHA EC50 = 6.2 ± 0.6 mM). (D) Peak current responses to 30 mM cysteamine with 3 min pre-application of PA (palmitic acid) and DHA ME (DHA methyl ester) normalized to control (no lipid) (n = 4–6,± SEM). Statistical analysis of each sample was performed using a one-sample T-test against the control value of one (* p < 0.05, ** p < 0.01).
Figure 1—figure supplement 1
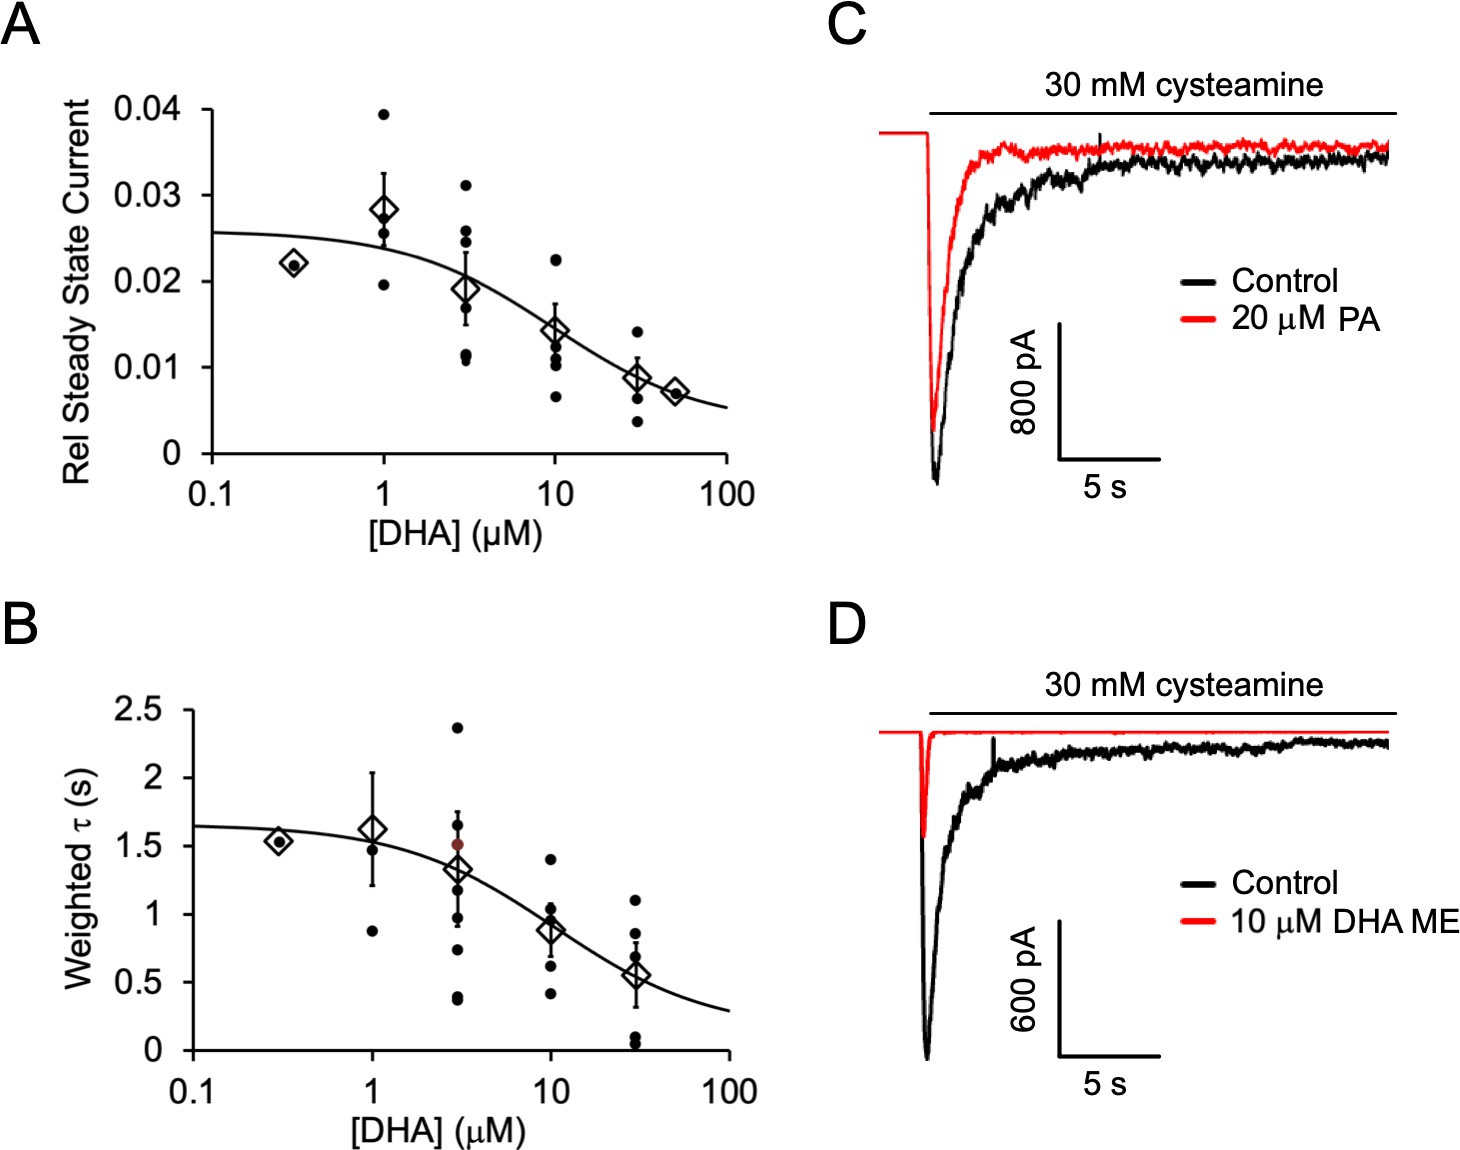
Inhibition of ELIC by DHA, PA and DHA ME.
(A) Steady state current (60 s after exposure to 30 mM cysteamine) with varying concentrations of DHA normalized to peak current in the absence of DHA. The data are fit to a sigmoidal function yielding an IC50 of 9.8 μM (n = 4–8, 0.3 and 50 μM n = 1,± SEM). (B) Weighted time constant (τ) of current decay for responses to 30 mM cysteamine at varying concentrations of DHA (IC50 = 10.5 μM) (n = 4–8, 0.3 μM n = 1,± SEM). (C) Sample currents from excised patch-clamp (–60 mV) of WT ELIC in 2:1:1 POPC:POPE:POPG giant liposomes. Current responses are to 30 mM cysteamine before and after 3 min pre-application of 20 μM palmitic acid (PA). (D) Same as (C) showing currents before and after 3 min pre-application of 10 μM DHA methyl ester (DHA ME).
Figure 2 with 2 supplements
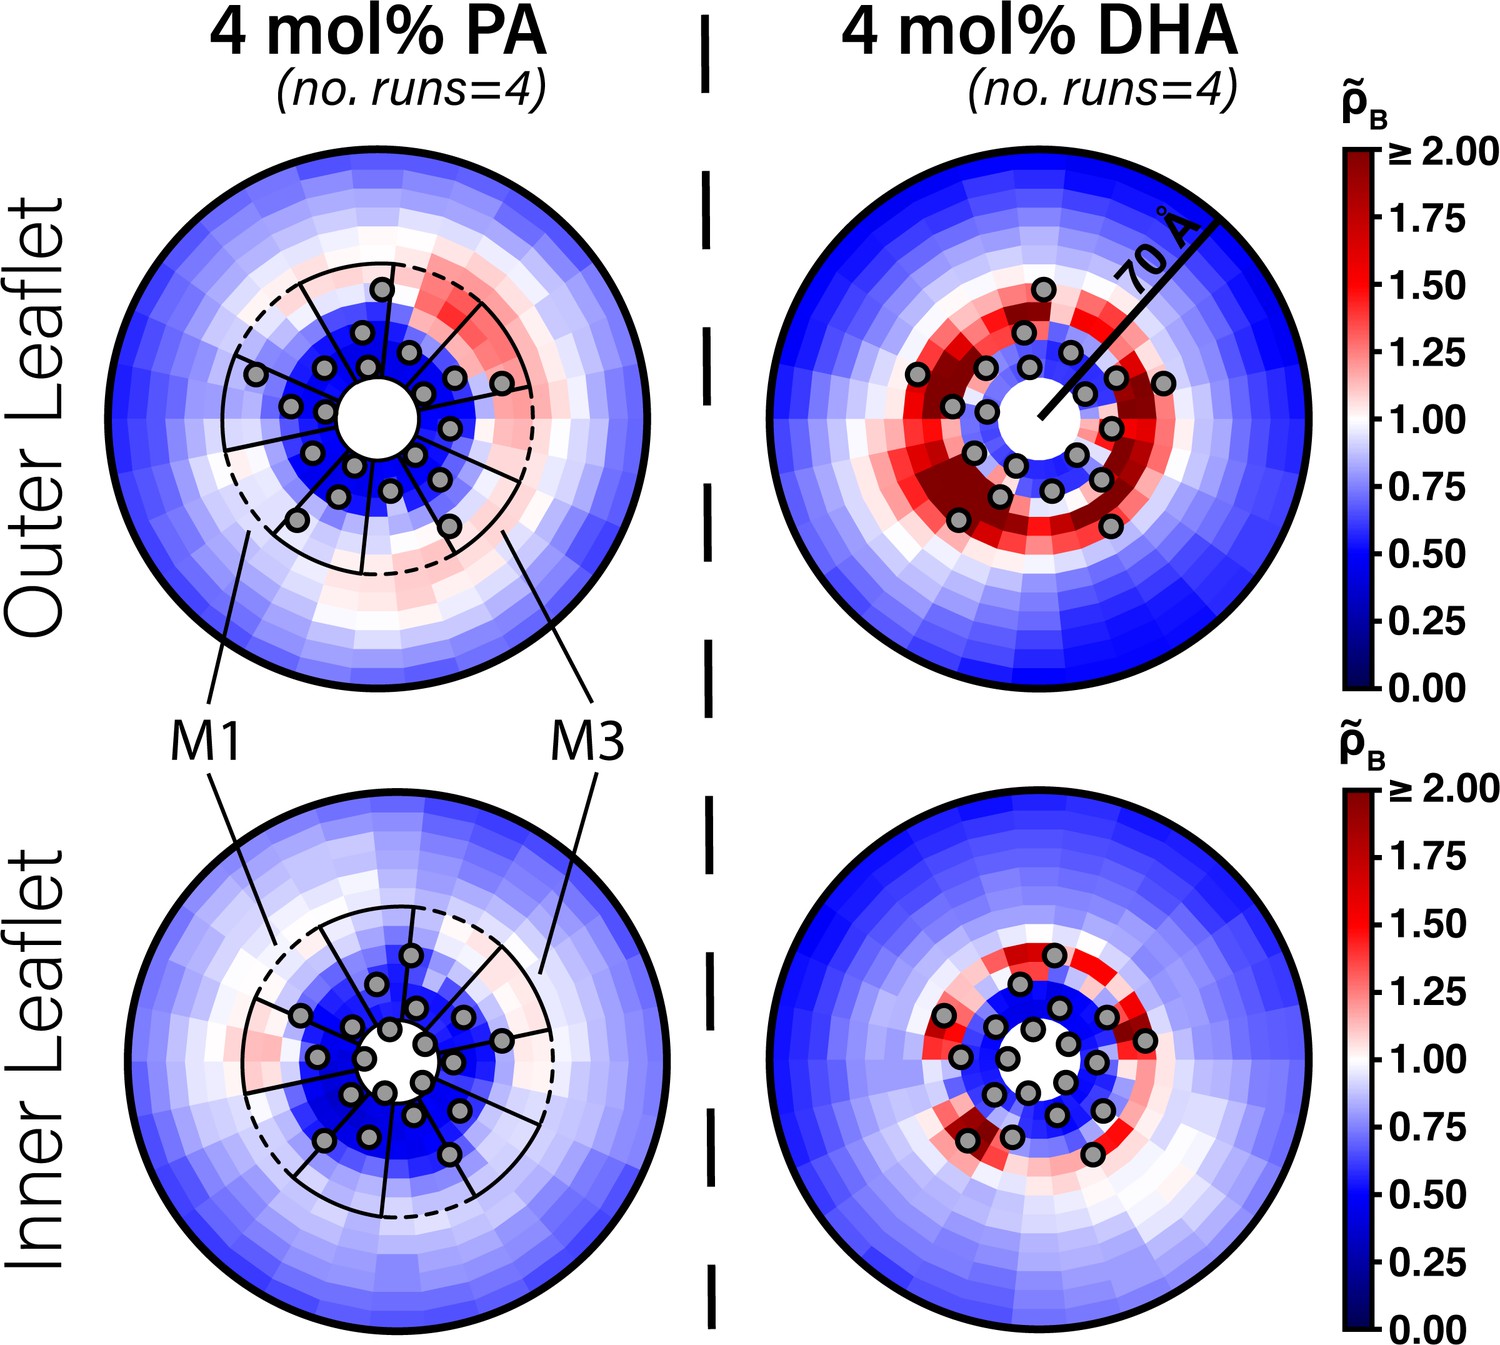
Enrichment of PA and DHA in ELIC.
Two-dimensional enrichment plots for the 4 mol% PA (left column) and 4 mol% DHA (right column) simulation conditions are shown for fatty acid species within 70 Å of the ELIC pore. Separate enrichment for the outer (top row) and inner (bottom row) leaflet are plotted with the color bar at right demonstrating relative enrichment values compared to bulk membrane. > 1.0 indicates enrichment over bulk membrane and < 1.0 indicates relative depletion compared to bulk membrane (Equation 4). Data presented in this figure represent the average across four simulation runs. The gray circles in each plot represent the location of the transmembrane helices relative to the ELIC pore. The dashed black outline sectors demonstrate the boundaries of the M1 site as used for density affinity threshold calculations, whereas the solid black outline sectors demonstrate the boundaries of the M3 site.
Figure 2—figure supplement 1
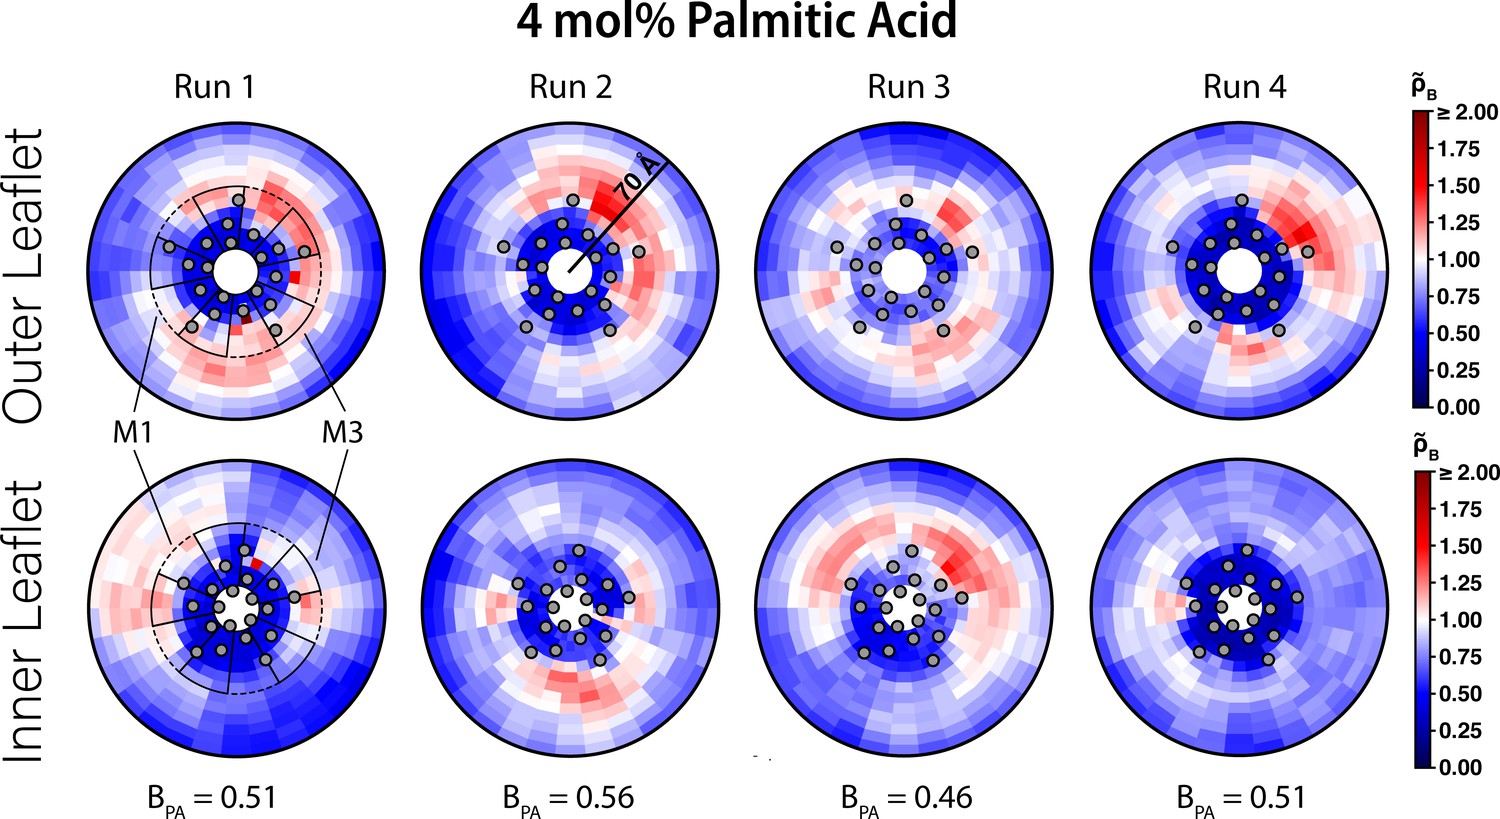
Interaction of PA with ELIC.
Two-dimensional enrichment plots for the four individual 4 mol% PA simulations showing enrichment in the outer (top row) and inner (bottom row) leaflets within 70 Å of the ELIC pore. The boundary lipid metric, B (Equation 2) , is given for each individual CGMD simulation run underneath the two-dimensional enrichment plot with the average (± SEM) across all four runs being 0.51 ± 0.04. The gray circles in each plot represent the location of the transmembrane helices relative to the ELIC pore. The dashed black outline sectors demonstrate the boundaries of the M1 site as used for density affinity threshold calculations, whereas the solid black outline sectors demonstrate the boundaries of the M3 site. The color bar for relative enrichment and depletion is placed at the right side of the figure.
Figure 2—figure supplement 2
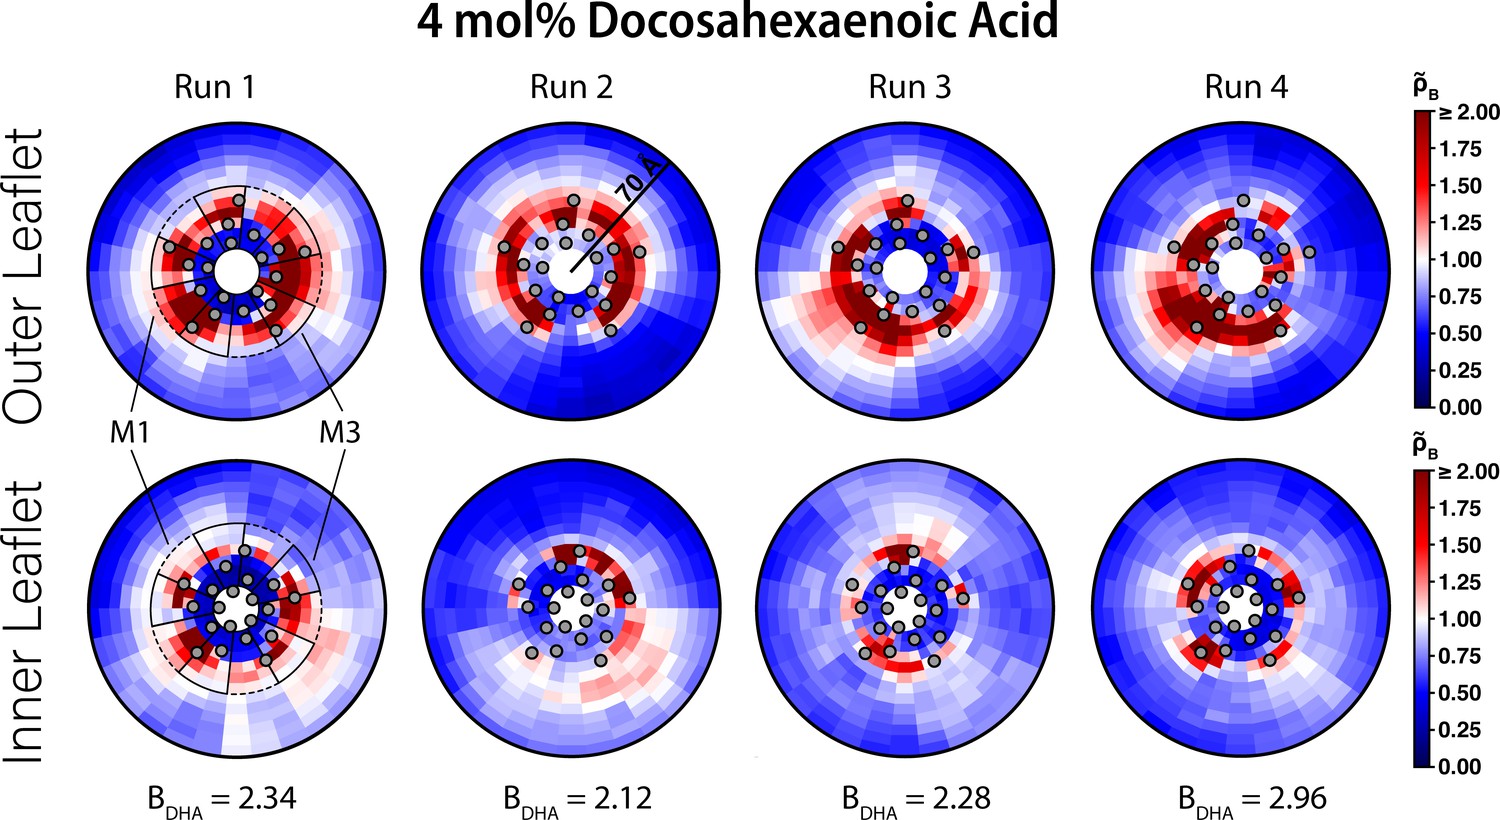
Interaction of DHA with ELIC.
Two-dimensional enrichment plots for the four individual 4 mol% DHA simulations showing enrichment in the outer (top row) and inner (bottom row) leaflets within 70 Å of the ELIC pore. The boundary lipid metric, B (Equation 2), is given for each individual CGMD simulation run underneath the two-dimensional enrichment plot with the average (± SEM) across all four runs being 2.43 ± 0.16. The gray circles in each plot represent the location of the transmembrane helices relative to the ELIC pore. The dashed black outline sectors demonstrate the boundaries of the M1 site as used for density affinity threshold calculations, whereas the solid black outline sectors demonstrate the boundaries of the M3 site. The color bar for relative enrichment and depletion is at the right side of the figure.
Figure 3 with 1 supplement
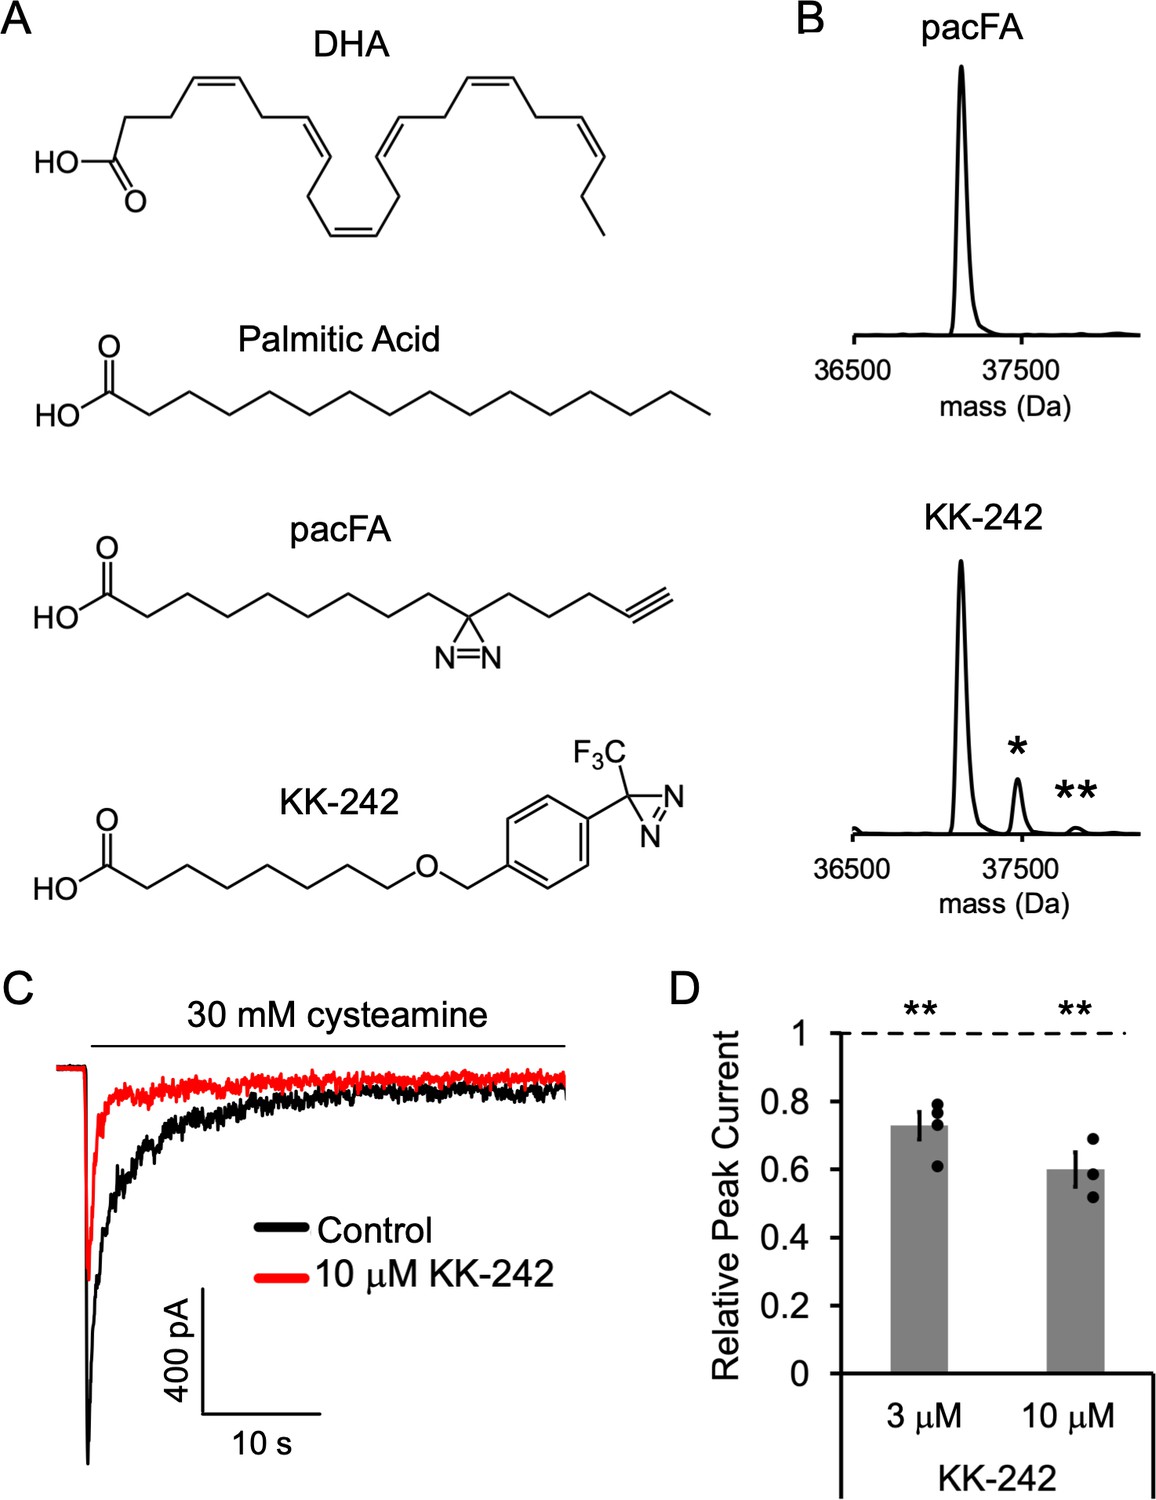
Fatty acid reagent photolabeling and inhibition of ELIC.
(A) Chemical structures of DHA, PA, pacFA, and KK-242. (B) Deconvoluted intact protein mass spectra of WT ELIC photolabeled with 100 μM pacFA and 100 μM KK-242. In both spectra, the highest intensity peak corresponds to the WT ELIC subunit, and in the KK-242 spectrum, the peaks labeled * and ** indicate an ELIC subunit with 1 and 2 KK-242 adducts, respectively. (C) Sample currents from excised patch-clamp (–60 mV) of WT ELIC in 2:1:1 POPC:POPE:POPG giant liposomes. Current responses are to 30 mM cysteamine before and after 3 min pre-application of 10 μM KK-242. (D) Peak current responses to 30 mM cysteamine normalized to control (absence of KK-242) as a function of KK-242 concentration (n = 4,± SEM). Statistical analysis of each sample was performed using a one-sample T-test against the control value of one (** p < 0.01).
Figure 3—figure supplement 1
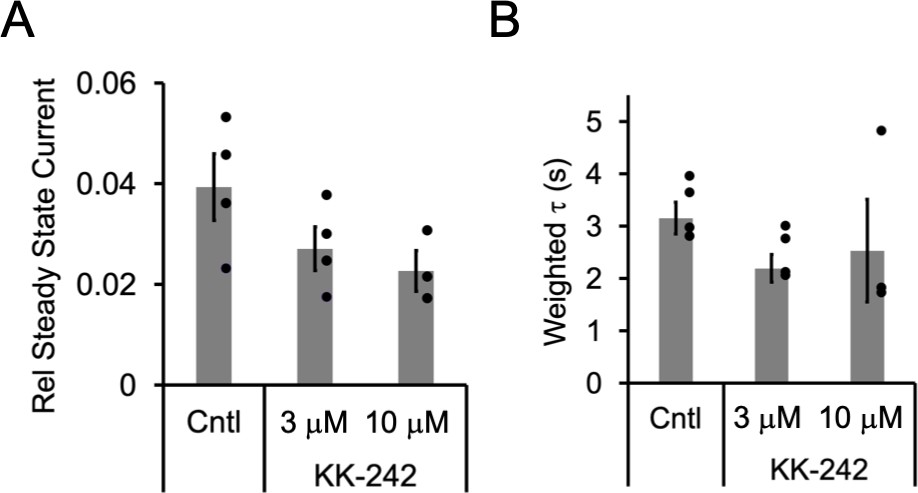
KK-242 inhibition of ELIC.
(A) Steady state current (60 s after exposure to 30 mM cysteamine) in the absence or presence of KK-242 (3 and 10 μM) normalized to peak current in the absence of KK-242 (n = 4,± SEM). Conditions were compared using a one-way ANOVA and posthoc Tukey test. No significant differences were identified between conditions. (B) Weighted time constant (τ) of current decay for responses to 30 mM cysteamine in the absence or presence of KK-242 (3 and 10 μM) (n = 4,± SEM). Conditions were compared using a one-way ANOVA and posthoc Tukey test. There were no significant differences between conditions.
Figure 4 with 6 supplements
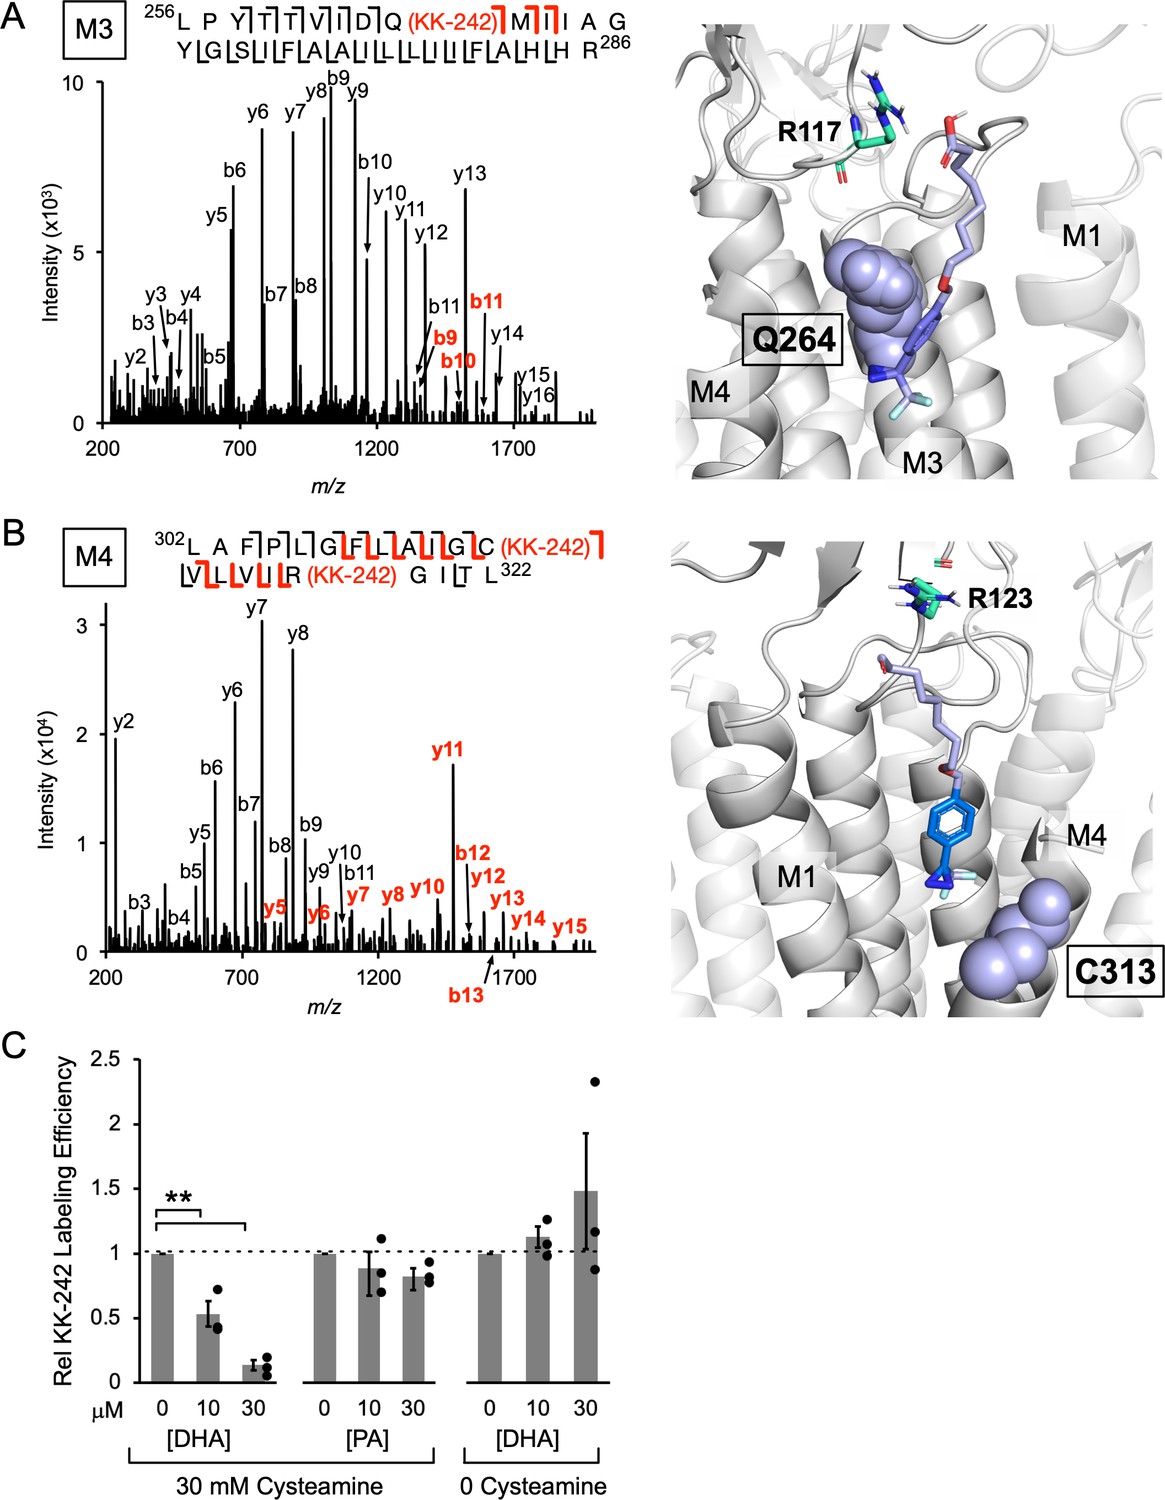
KK-242 photolabels two DHA binding sites in the outer TMD of ELIC.
(A) Left: Fragmentation spectrum (MS2) of a M3 peptide photolabeled with KK-242 (Figure 4—source data 1). Red b-ions contain the KK-242 adduct mass, while black b- and y-ions do not. The photolabeled residue, Q264, is indicated with KK-242 in parenthesis. Right: ELIC structure showing a KK-242 binding pose from docking with the diazirine adjacent to Q264 (purple sphere). Also shown is R117 (green cyan stick). (B) Left: MS2 spectrum of a M4 peptide photolabeled with KK-242 (Figure 4—source data 1). The fragment ions indicate labeling at C313 and R318. Right: ELIC structure showing a KK-242 binding pose from docking with the diazirine adjacent to C313 (purple sphere). Also shown is R123 (green cyan stick). (C) Apparent labeling efficiencies of M4 by 10 μM KK-242 in the presence of 10 and 30 μM DHA and PA. For DHA, apparent labeling efficiencies were evaluated in the presence and absence of cysteamine. Apparent labeling efficiencies in the presence of DHA or PA were normalized to control within each replicate (n = 3,± SEM). Statistical analysis was performed on the unnormalized data (Figure 4—source data 2) using a linear mixed effects model (Figure 4—figure supplement 5). In the presence of 30 mM cysteamine, the effect of DHA on KK-242 labeling efficiency was statistically significant (p = 0.016). See Figure 4—source data 3 for the full description and results of the analysis.
-
Figure 4—source data 1
Source data for Figure 4A and B.
- https://cdn.elifesciences.org/articles/74306/elife-74306-fig4-data1-v3.xlsx
-
Figure 4—source data 2
Source data for Figure 4.
- https://cdn.elifesciences.org/articles/74306/elife-74306-fig4-data2-v3.xlsx
-
Figure 4—source data 3
Source data for Figure 4.
- https://cdn.elifesciences.org/articles/74306/elife-74306-fig4-data3-v3.docx
Figure 4—figure supplement 1
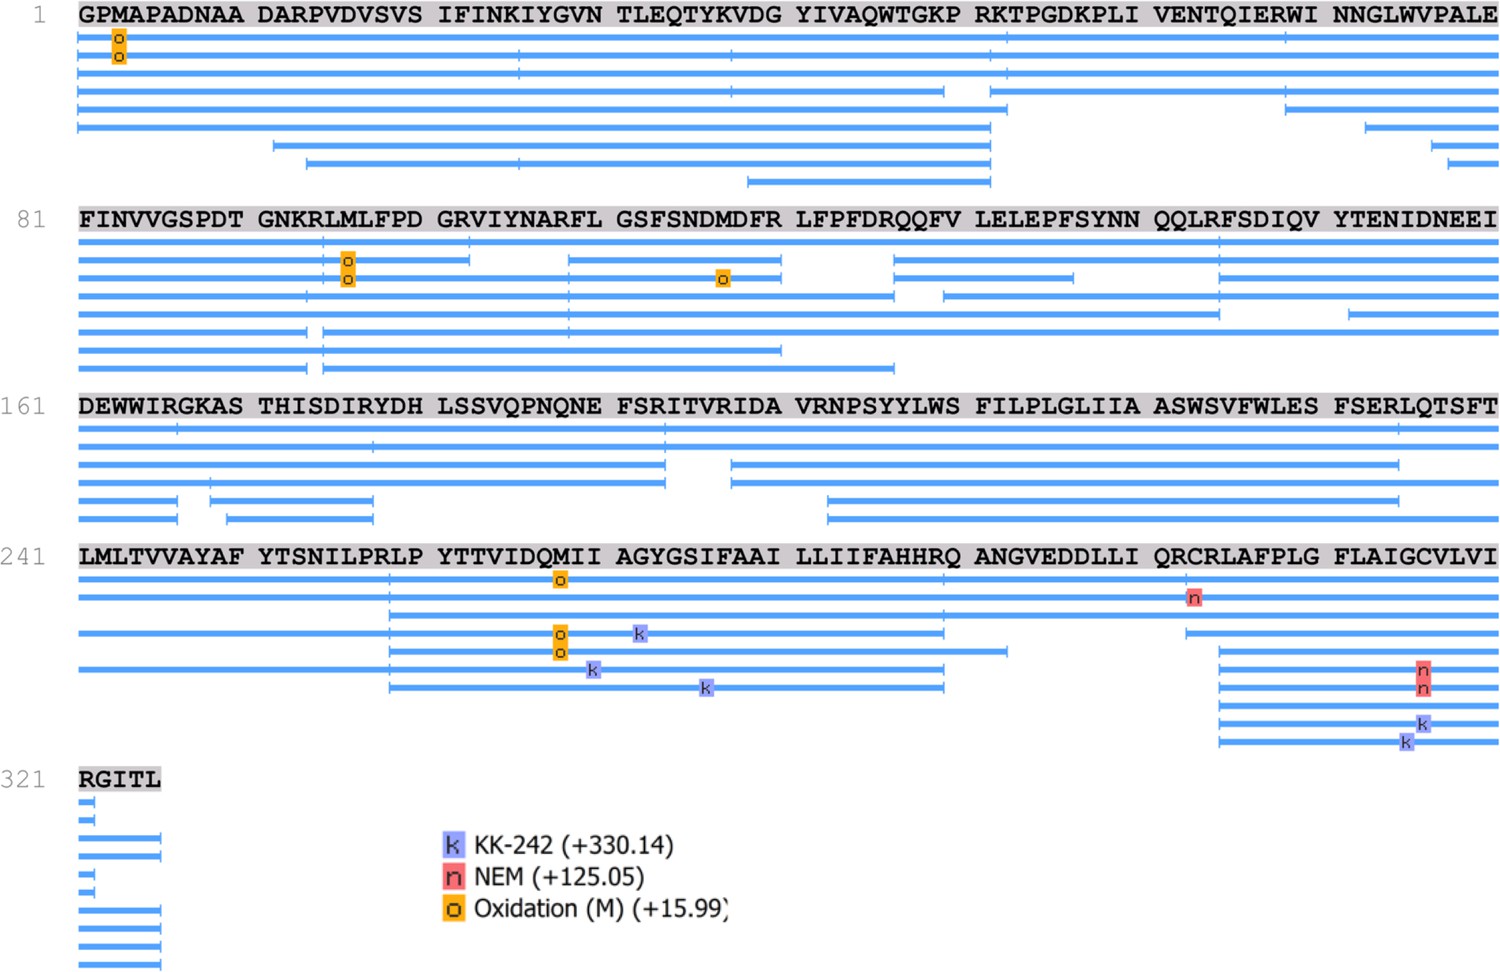
Peptide coverage of ELIC from LC-MS/MS analysis.
Peptide coverage map from a PEAKS search of the tryptic middle-down LC-MS/MS data from ELIC photolabeled with 100 μM KK-242. Modifications used in the search include KK-242 (k), methionine oxidation (o), and cysteine alkylation with NEM (n). Peptide sequence coverage was 100%. The precursor mass accuracy was set at 20 ppm. KK-242 was identified in M3 and M4 peptides. The assigned residue modified by KK-242 in these peptides is not reliable due to the relatively low stringency set for fragment ion identification (0.1 Da accuracy). Manual analysis of these MS2 spectra confirmed the location of KK-242 when requiring a fragment ion mass accuracy of <10 ppm.
Figure 4—figure supplement 2
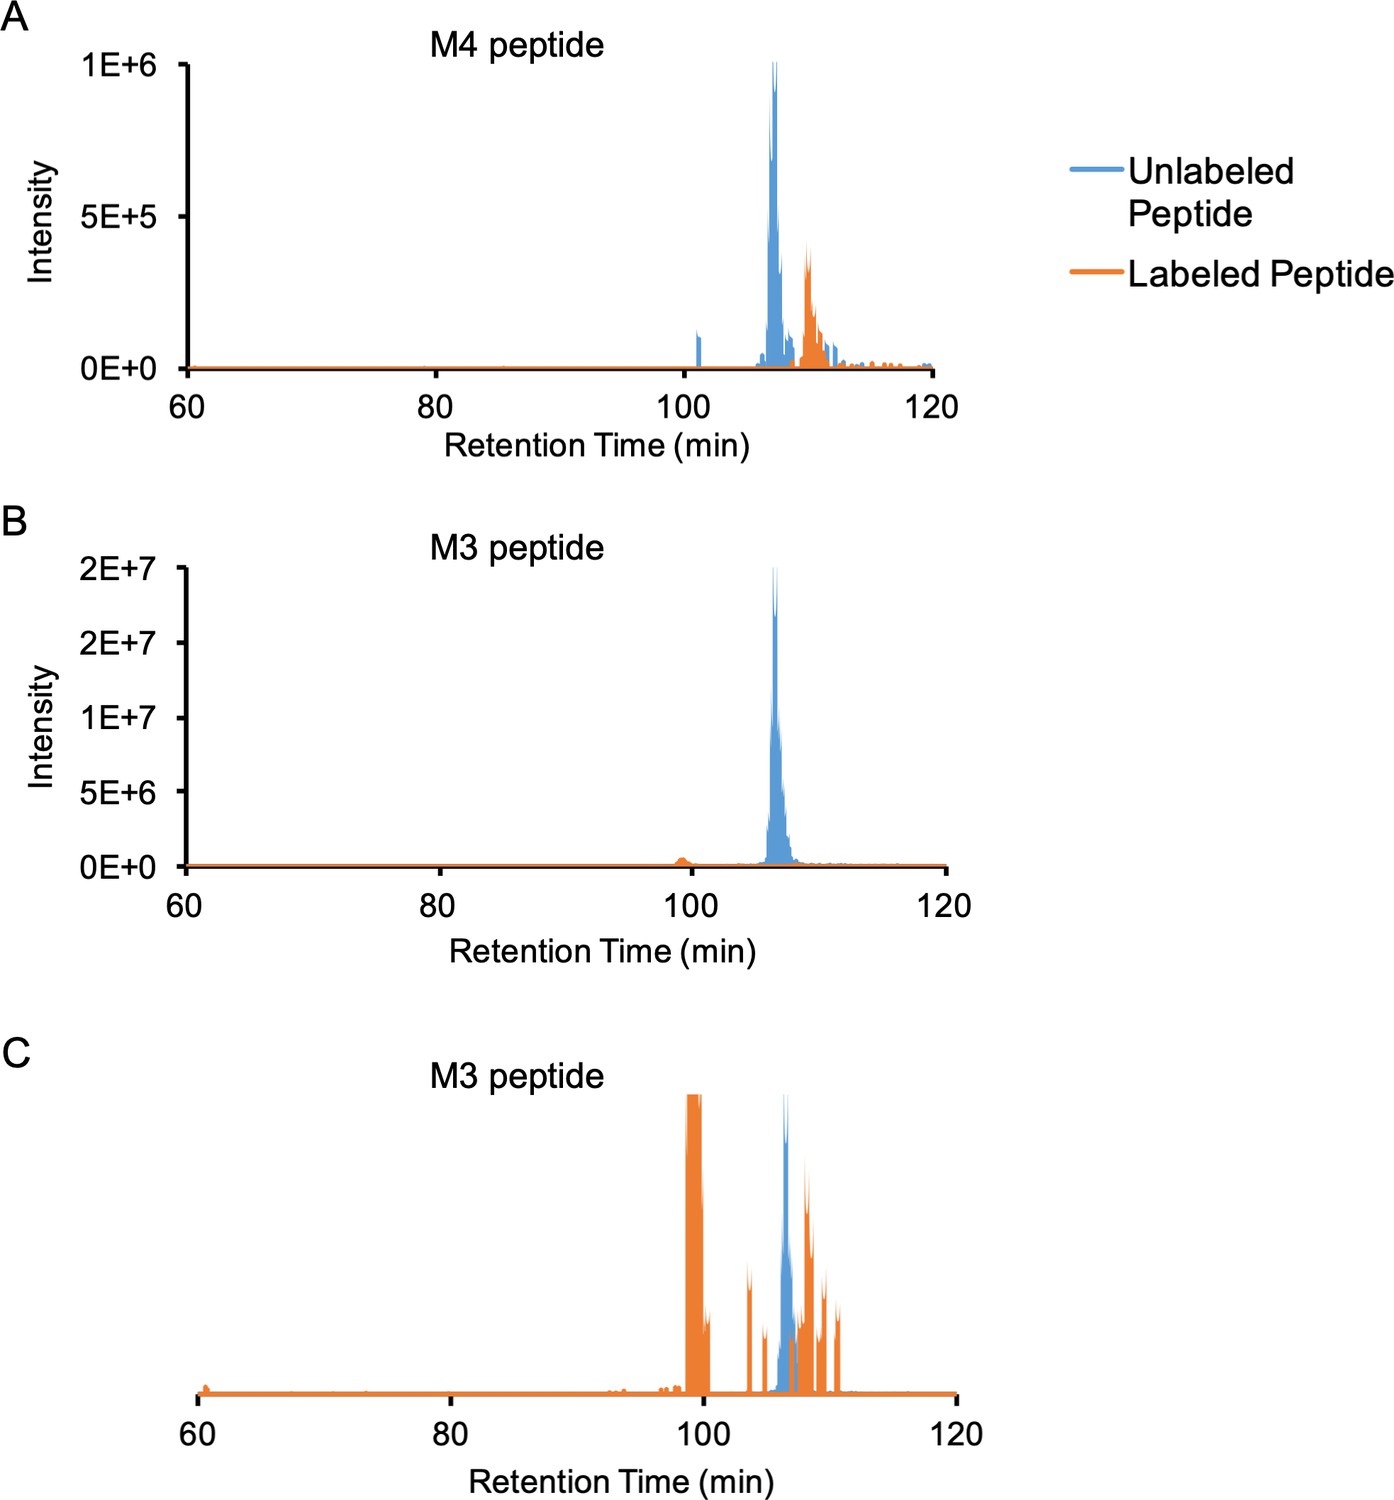
Extracted ion chromatograms of M4 and M3 unlabeled and labeled peptides.
(A) Unlabeled (736.76–736.77 m/z) and labeled (839.48–839.50 m/z) extracted ion chromatograms of the M4 peptide (monoisotopic mass of labeled peptide = 939.491 m/z, z = 3 + ). The labeled peptide elutes ~ 3 min after the unlabeled peptide, and the estimated labeling efficiency is ~32%. (B) Unlabeled (865.23–865.24 m/z) and labeled (947.76–947.77 m/z) extracted ion chromatograms of the M3 peptide (monoisotopic mass of labeled peptide = 947.768 m/z, z = 4 + ). The estimated labeling efficiency is ~2.8%. (C) Same as (B) but with the labeled peptide ion chromatogram scaled up by 100 x for better visualization: the labeled peptide elutes ~ 1.7 min after the unlabeled peptide. The peak at 100 min retention time comes from a different peptide with the same m/z but different charge state.
Figure 4—figure supplement 3
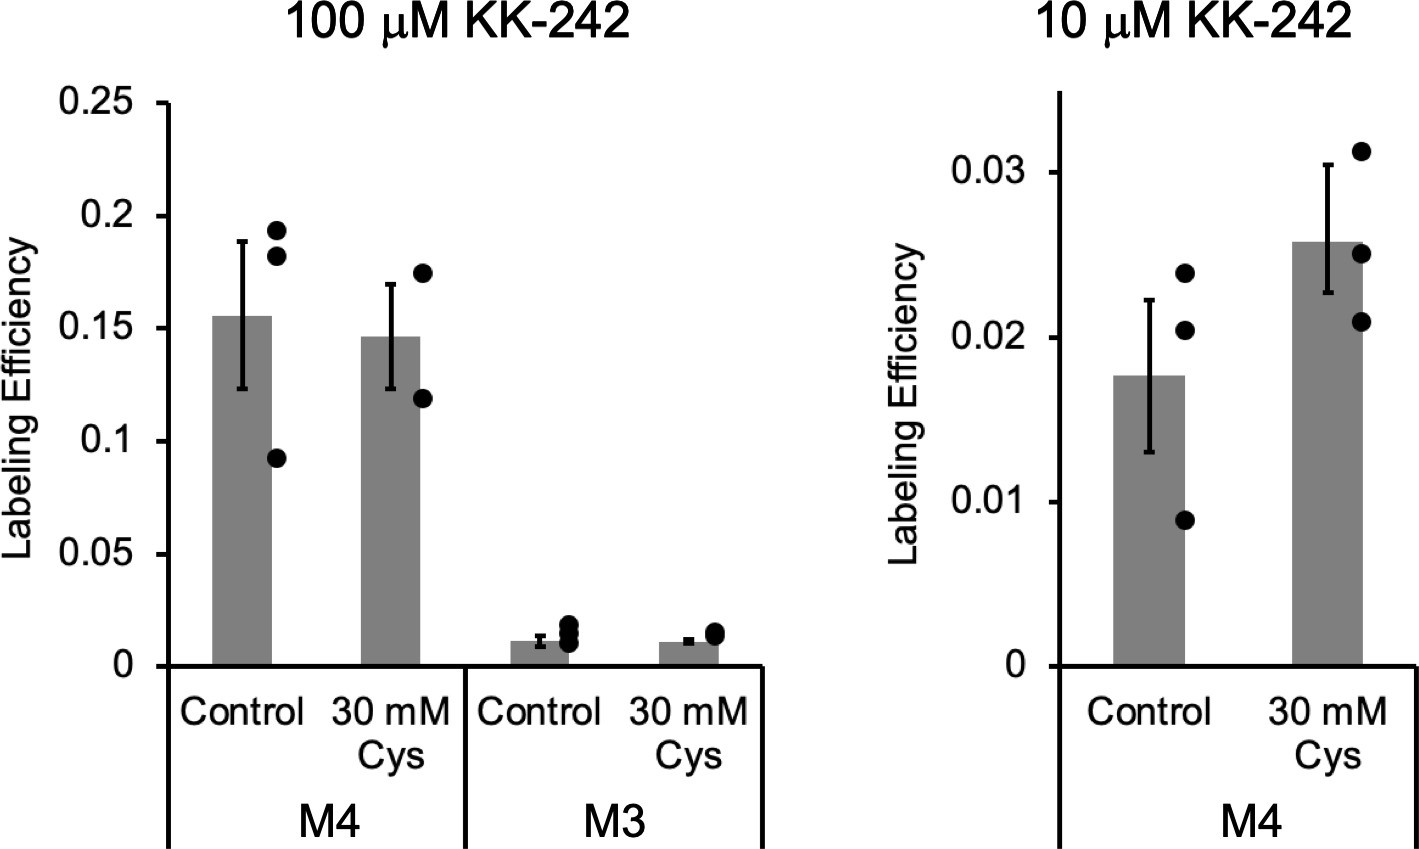
Apparent labeling efficiencies of M4 and M3 by KK-242.
Apparent labeling efficiencies determined from middle-down tryptic LC-MS/MS analysis of M4 and M3 peptides in ELIC. ELIC was photolabeled with 100 μM (left) or 10 μM (right) KK-242 in the absence or presence of 30 mM cysteamine. Apparent labeling efficiencies are reported as mean ± SEM (n = 3, n = 2 for 100 μM KK-242 +30 mM cysteamine). Control and 30 mM cysteamine samples were compared using an unpaired T-test. There was no significant difference between these conditions.
Figure 4—figure supplement 4
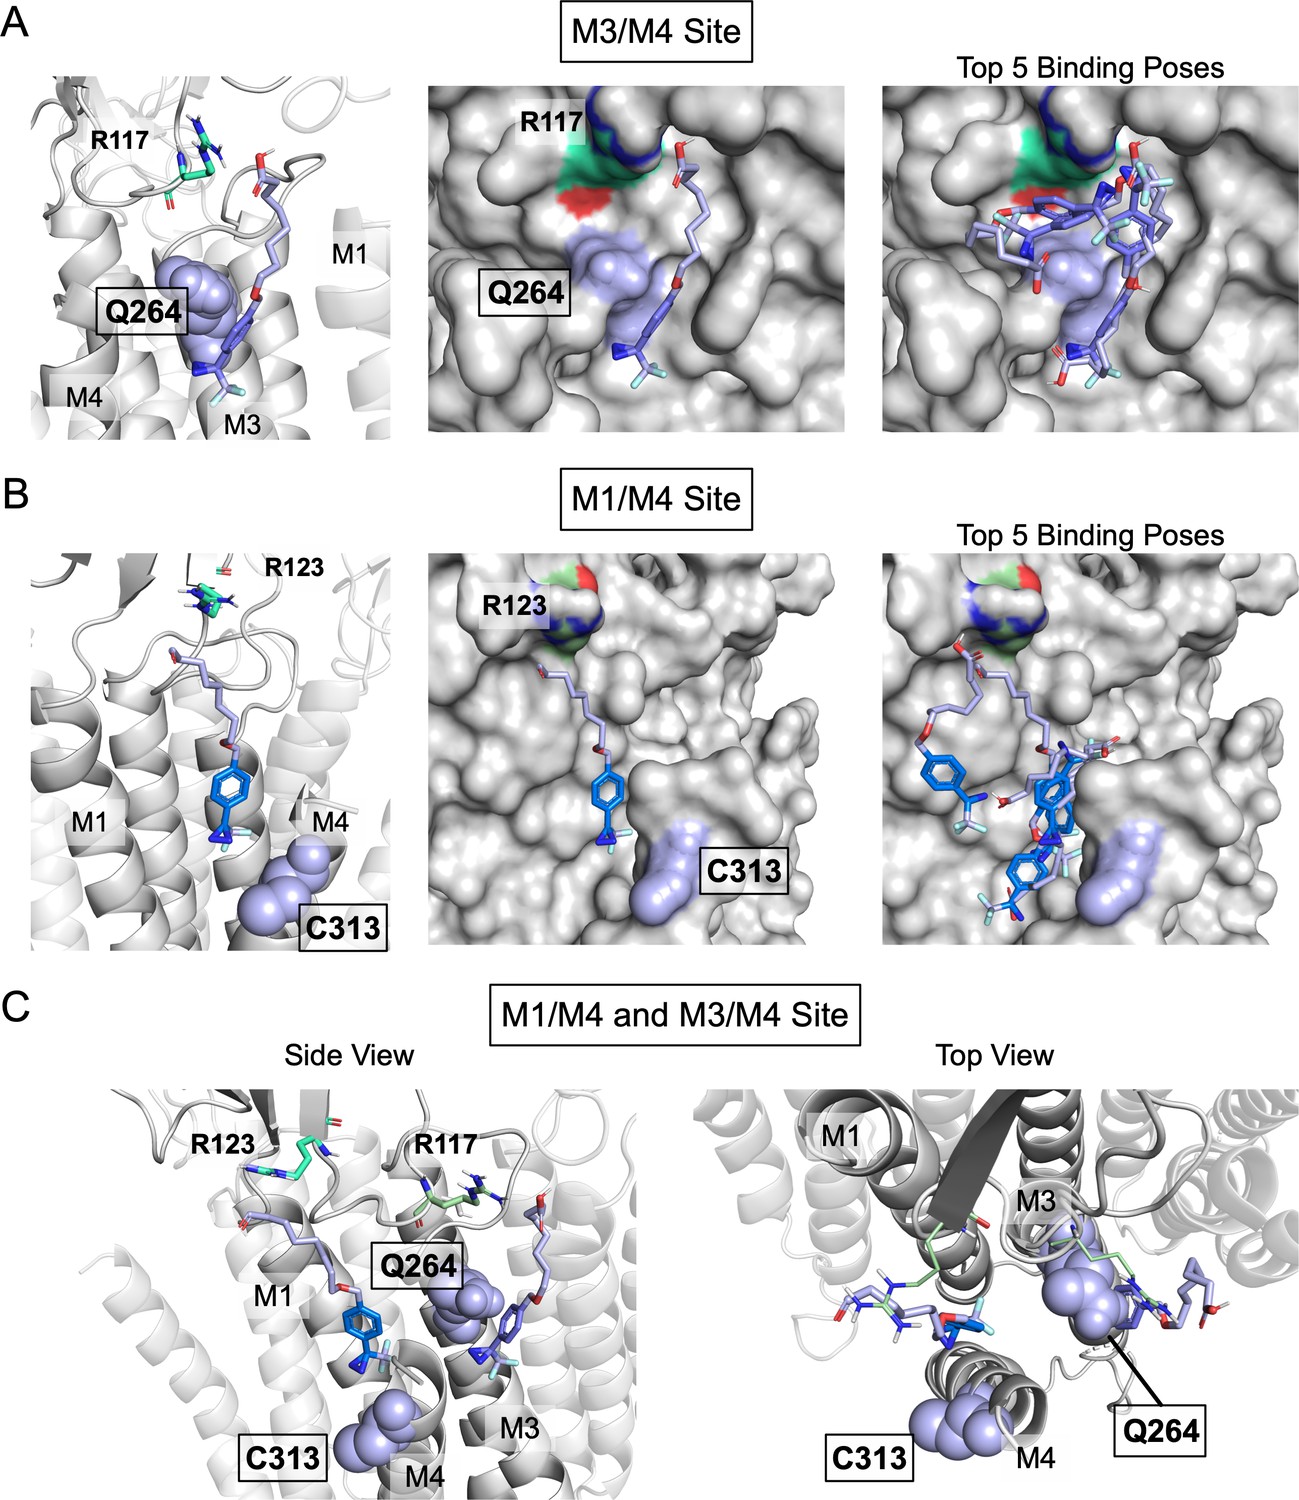
Molecular representations of KK-242 docked to two sites in ELIC.
(A) Left and center images show cartoon and surface representations, respectively, of the M3/M4 site in ELIC with a representative binding pose of KK-242 taken from the third most abundant cluster (shown in Figure 4A). This is the only cluster where KK-242 is oriented perpendicular to the membrane with the carboxylate headgroup approximately at the membrane interface. Right image shows surface representation of the M3/M4 site with representative poses taken from the top five most abundant clusters of docked poses. In all images, R117 is shown in green cyan and Q264 in purple. (B) Left and center images show cartoon and surface representations, respectively, of the M1/M4 site in ELIC with a presentative binding pose of KK-242 taken from the second most abundant cluster (shown in Figure 4B). Right image shows surface representation of the M1/M4 site with representative poses taken from the top five most abundant clusters of docked poses. In all images, R123 is shown in green cyan and C313 in purple. (C) Side and top views of the M3/M4 and M1/M4 sites in ELIC showing KK-242 poses in both sites taken from Figure 4A and B. R117 and R123 are shown in green cyan and the photolabeled residues, Q264 and C313, in purple. The docked poses suggest that KK-242 photolabels Q264 and C313 from two distinct sites on either side of M4.
Figure 4—figure supplement 5
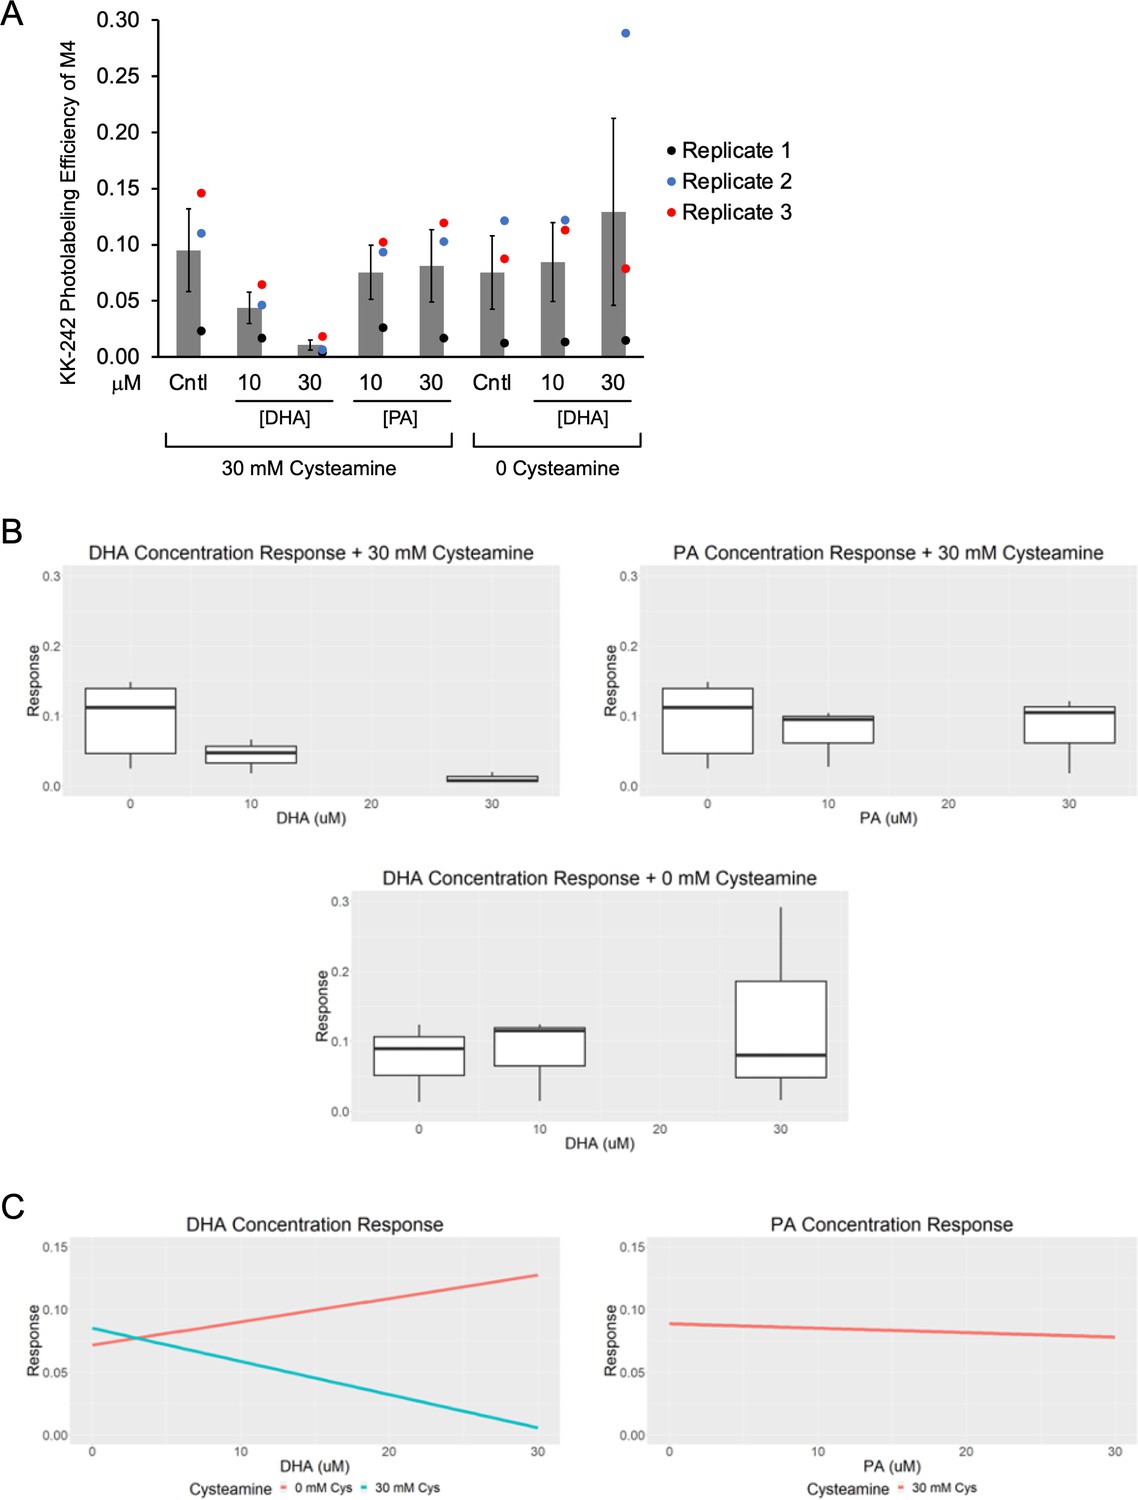
KK-242 photolabeling competition data with DHA and PA.
(A) Apparent labeling efficiencies of M4 by 10 μM KK-242 in the presence of 10 and 30 μM DHA and PA, with or without 30 mM cysteamine. These are the unnormalized data from Figure 4C from three replicates (± SEM). The MS intensities can be found in Figure 4—source data 2. (B) The data were analyzed using a linear mixed effects model where DHA, PA and cysteamine were set as fixed effects (Figure 4—source data 3) and variation between replicates was set as a random effect. Shown are box and whisker plots of the effect (“response”) of DHA and PA on the labeling efficiency of KK-242 in the presence of cysteamine, and DHA in the absence of cysteamine. (C) Shown are linear plots of the ‘response’ for DHA+ cysteamine, PA+ cysteamine, and DHA without cysteamine, taken from the mixed effects model. The estimate, confidence intervals (CI) and p-values for each effect are provided in Figure 4—source data 3. In the presence of 30 mM cysteamine, the effect of DHA on KK-242 labeling efficiency was statistically significant (estimate = –0.0047, confidence interval = –0.0083 to –0.0010, p = 0.016). In contrast, the effect of PA in the presence of cysteamine and the effect of DHA in the absence of cysteamine were not statistically significant.
Figure 4—figure supplement 6

DHA inhibition of ELIC in the presence of PA.
ELIC peak current responses to 30 mM cysteamine normalized to control (absence of DHA) as a function of DHA concentration. Black shows data in the presence of 2 μM PA (n = 4–6,± SEM). The peak current responses in the presence of 2 μM PA were also normalized to control (i.e. responses obtained from the same patch in the absence of DHA). Gray shows data from Figure 1B.
Figure 5 with 3 supplements
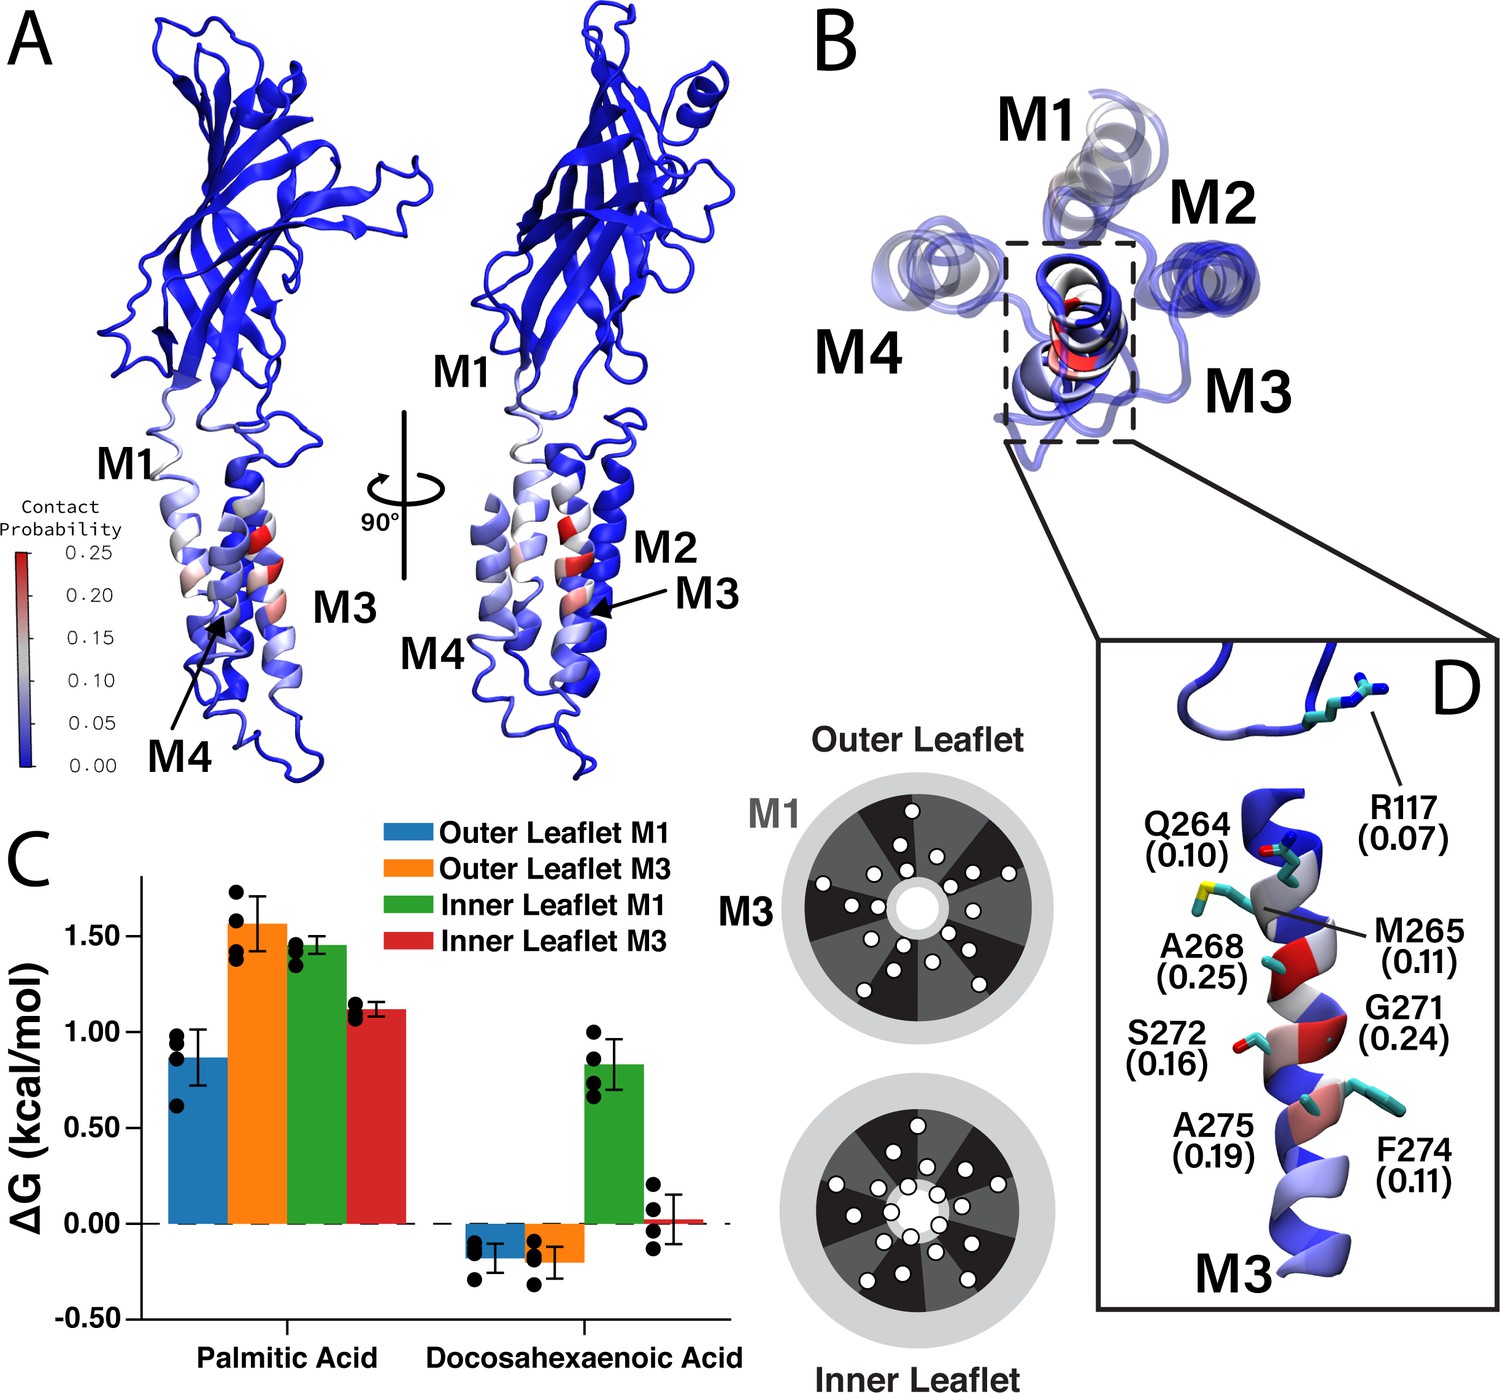
Favorable DHA binding sites from coarse-grained molecular dynamics.
(A) An ELIC monomer is colored according to contact probabilities. The color bar to the left shows the contact probabilities values associated with the residue coloring. The same data is presented in (B) showing just the TMD as seen from the extracellular side. The M3 helix is shown in solid color, while M1, M2, and M4 are shown as transparent to highlight the DHA binding groove between M3 and M4. (C) Density threshold affinities for PA and DHA are shown (left) for the M1 and M3 sites in both the inner and outer leaflet (n = 4,± SEM). To the right is a cartoon representation of the boundaries for the M1 (dark gray) and M3 (black) sites with the helices (white circles) representing the transmembrane domain. Each set of four same-colored helices represents one ELIC monomer. (D) The β6- β7 loop and M3 are colored according to contact probability. Residues in this binding site with the highest contact probabilities are highlighted by stick representation and the associated contact probabilities are shown.
Figure 5—figure supplement 1
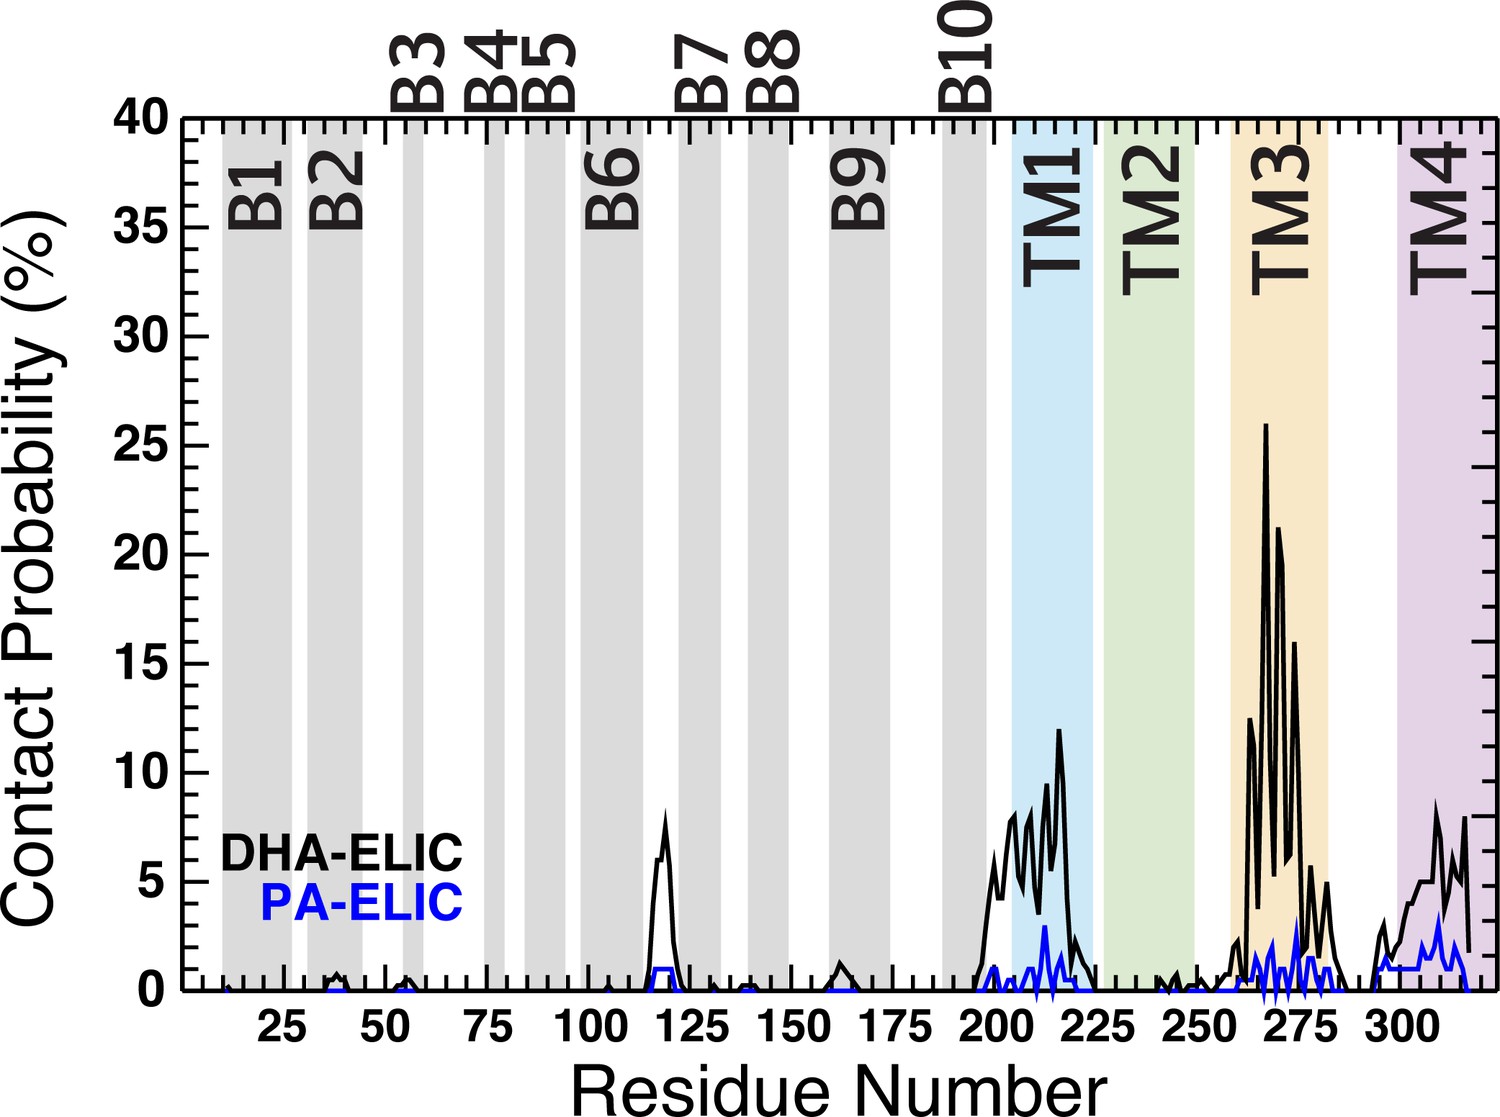
Contact probability for PA (blue trace) and DHA (black trace) as a function of residue number.
The residue numbers making up the ECD β -sheets (β1- β10) are shown as gray fill in the background of the plot. The residue numbers comprising the TMD α-helices are shown as colored fill in the background of the plot (M1, blue; M2, green; M3, yellow; M4, purple). The contact probability represents an average across all five subunits for four simulation runs under each condition.
Figure 5—figure supplement 2
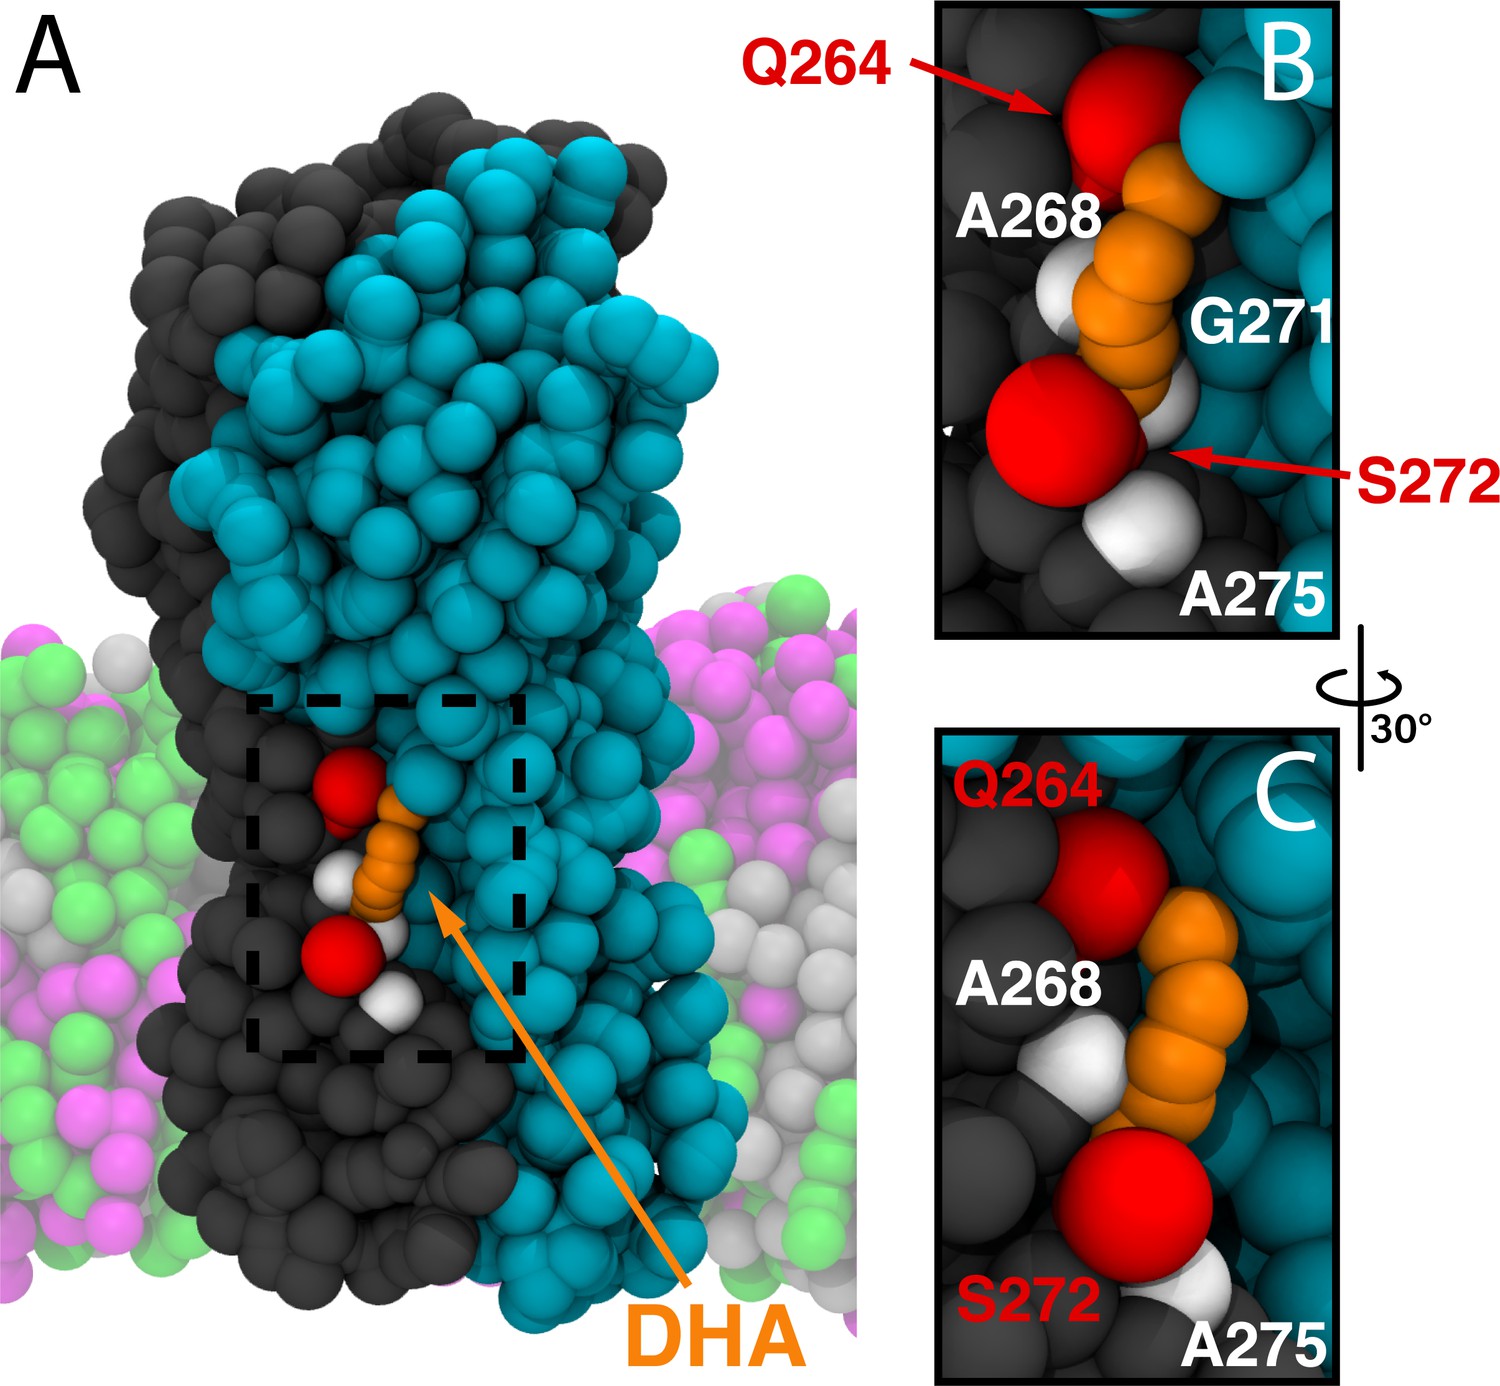
Representative binding mode of DHA in the M3/M4 site.
(A) Representative molecular image of DHA bound to ELIC from the CGMD simulations. Two complimentary ELIC monomers are shown in different colors (gray and teal) with the bound DHA shown as orange beads. Residues with high contact probability are shown as spheres with polar residues (Q264, S272) shown in red and apolar residues (A268, G271, A275) shown in white. In the coarse-grained membrane (translucent), POPC is pink, POPE is light gray, and POPG is green. The images in (B) and (C) focus on the dashed box in (A).
Figure 5—figure supplement 3
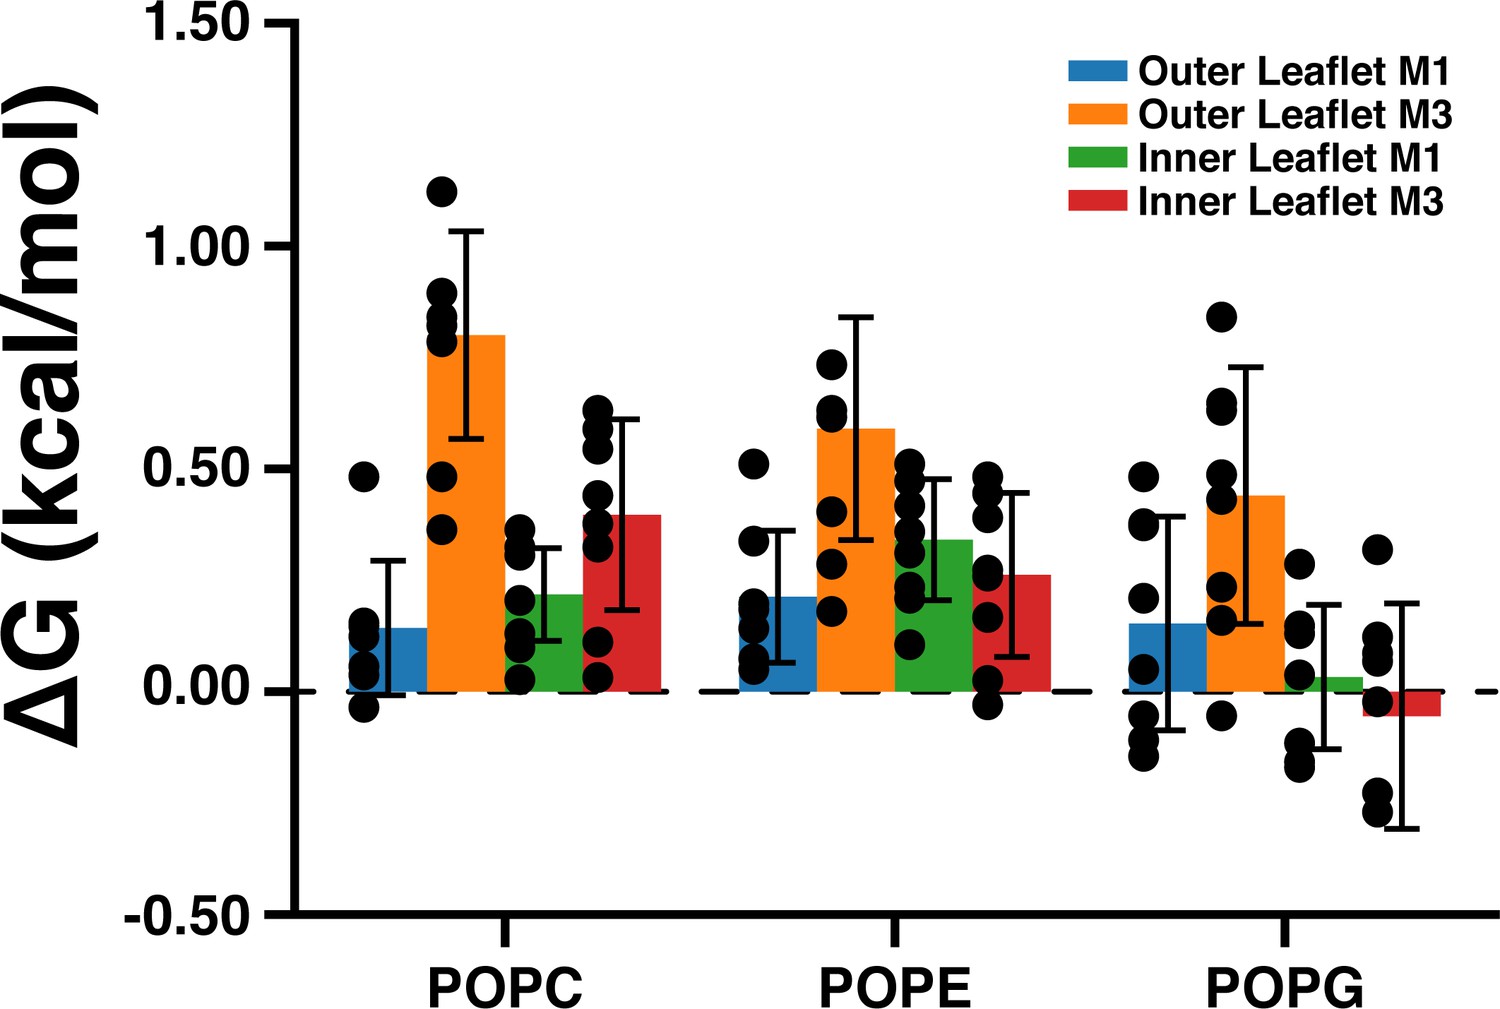
Density threshold affinities of POPC, POPE, and POPG in the M1 and M3 sites from the CGMD simulations.
This data represents an average across all five subunits and eight simulation runs (± SEM).
Figure 6 with 5 supplements

hMTS modification of R117C/C300S/C313S inhibits ELIC agonist response.
(A) Top left: Structure of ELIC showing photolabeled residues (Q264 and C313), and arginines at the outer (R117, R123) and inner (R286, R299, R301) interfacial regions of the TMD. Right: Deconvoluted intact protein mass spectra of the indicated arginine to cysteine mutants on a C300S/C313S background. Mass spectra are shown prior to hMTS modification (control) and after 1 h incubation with hMTS. The peak in all control spectra corresponds to the mass of unmodified ELIC mutant (37,048 Da), and a + 257.5 Da shift indicates modification with one hMTS (marked by asterisk). (B) Left: Sample currents of control (C300S/C313S), R117C (C300S/C313S/R117C), and R117C-M (C300S/C313S/R117C modified with hMTS) from 2:1:1 POPC:POPE:POPG giant liposomes. Right: Average peak current from control, R117C, R117C-M, R117C-M treated with 2 mM DTT, and R123C-M in response to 30 mM cysteamine (n = 12–26,± SEM,). All conditions were compared using a one-way ANOVA and posthoc Tukey test (** p < 0.01). An unpaired T-test was also performed between R117C-M and R117C-M DTT (p < 0.01).
Figure 6—figure supplement 1
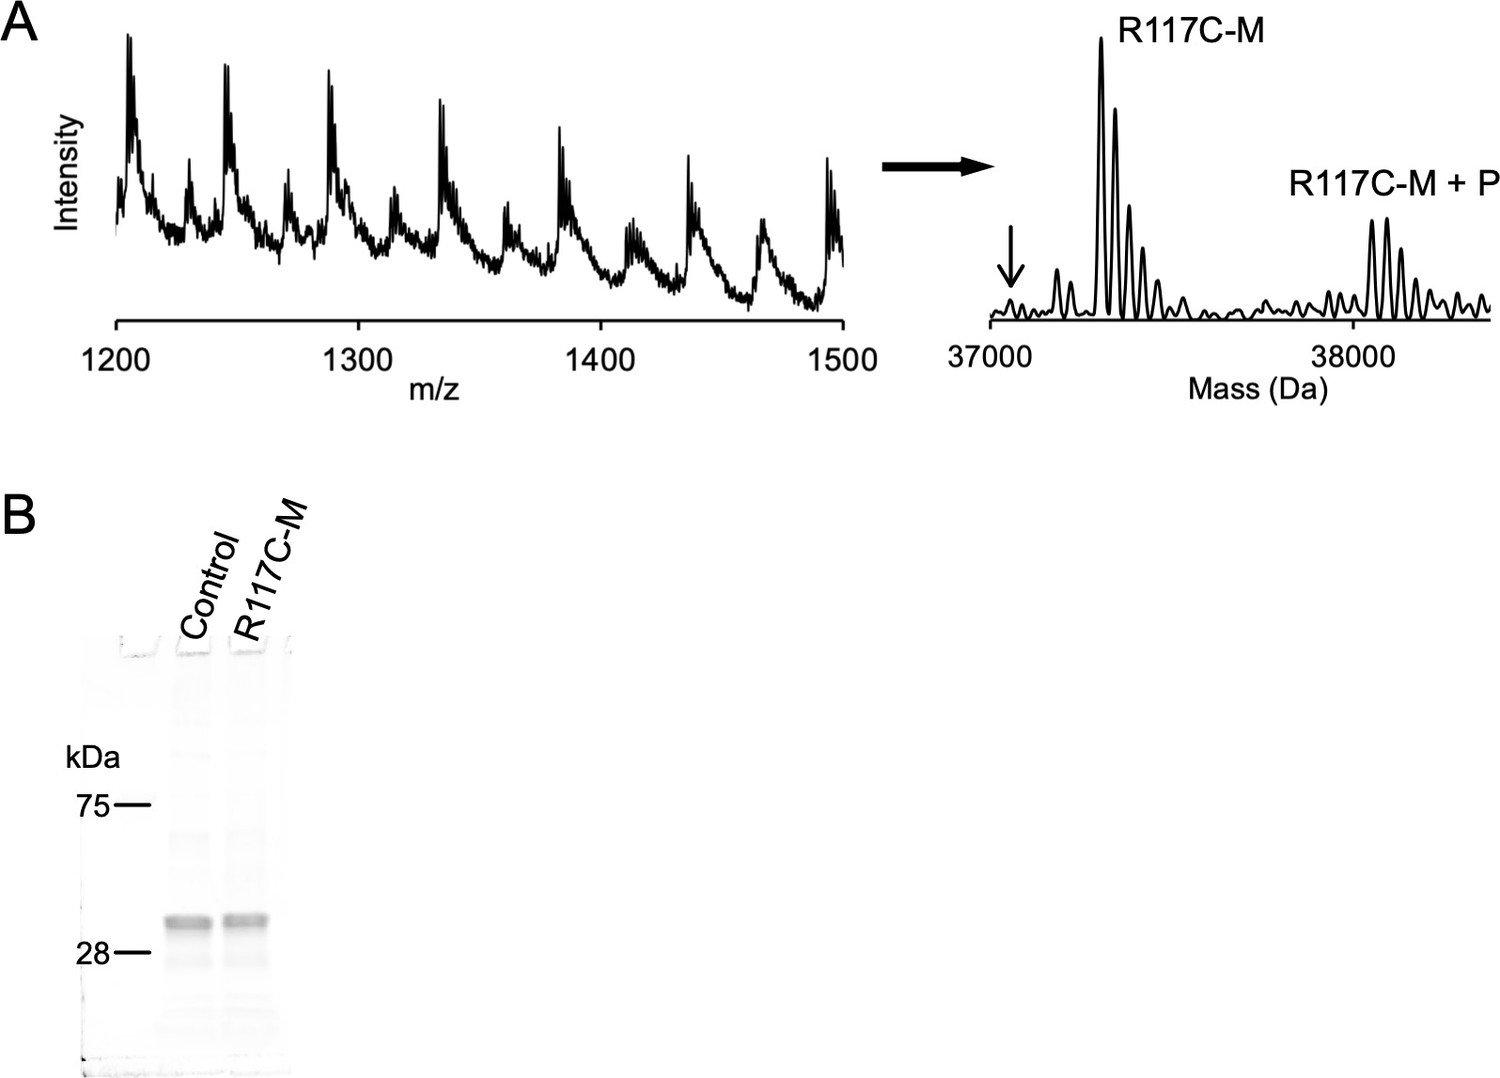
hMTS modification of R117C/C300S/C313S.
(A) Left: Full intact protein mass spectrum of R117C-M. Right: Deconvoluted mass spectrum of R117C-M with curved baseline subtraction to eliminate noise. The peaks labeled R117C-M correspond to the hMTS modified R117C/C300S/C313S subunit (37,305 Da) with 4–5 unknown small molecule adducts ( + 37–39 Da). The peaks labeled R117C-M+ P are shifted by +746 Da corresponding to R117C-M with a bound POPG phospholipid. Arrow indicates the mass of unlabeled R117C/C300S/C313S (37,058 Da). (B) SDS-PAGE showing the ELIC protein subunit (~37 kDa) extracted from control (C300S/C313S) and R117C-M proteoliposomes.
Figure 6—figure supplement 2
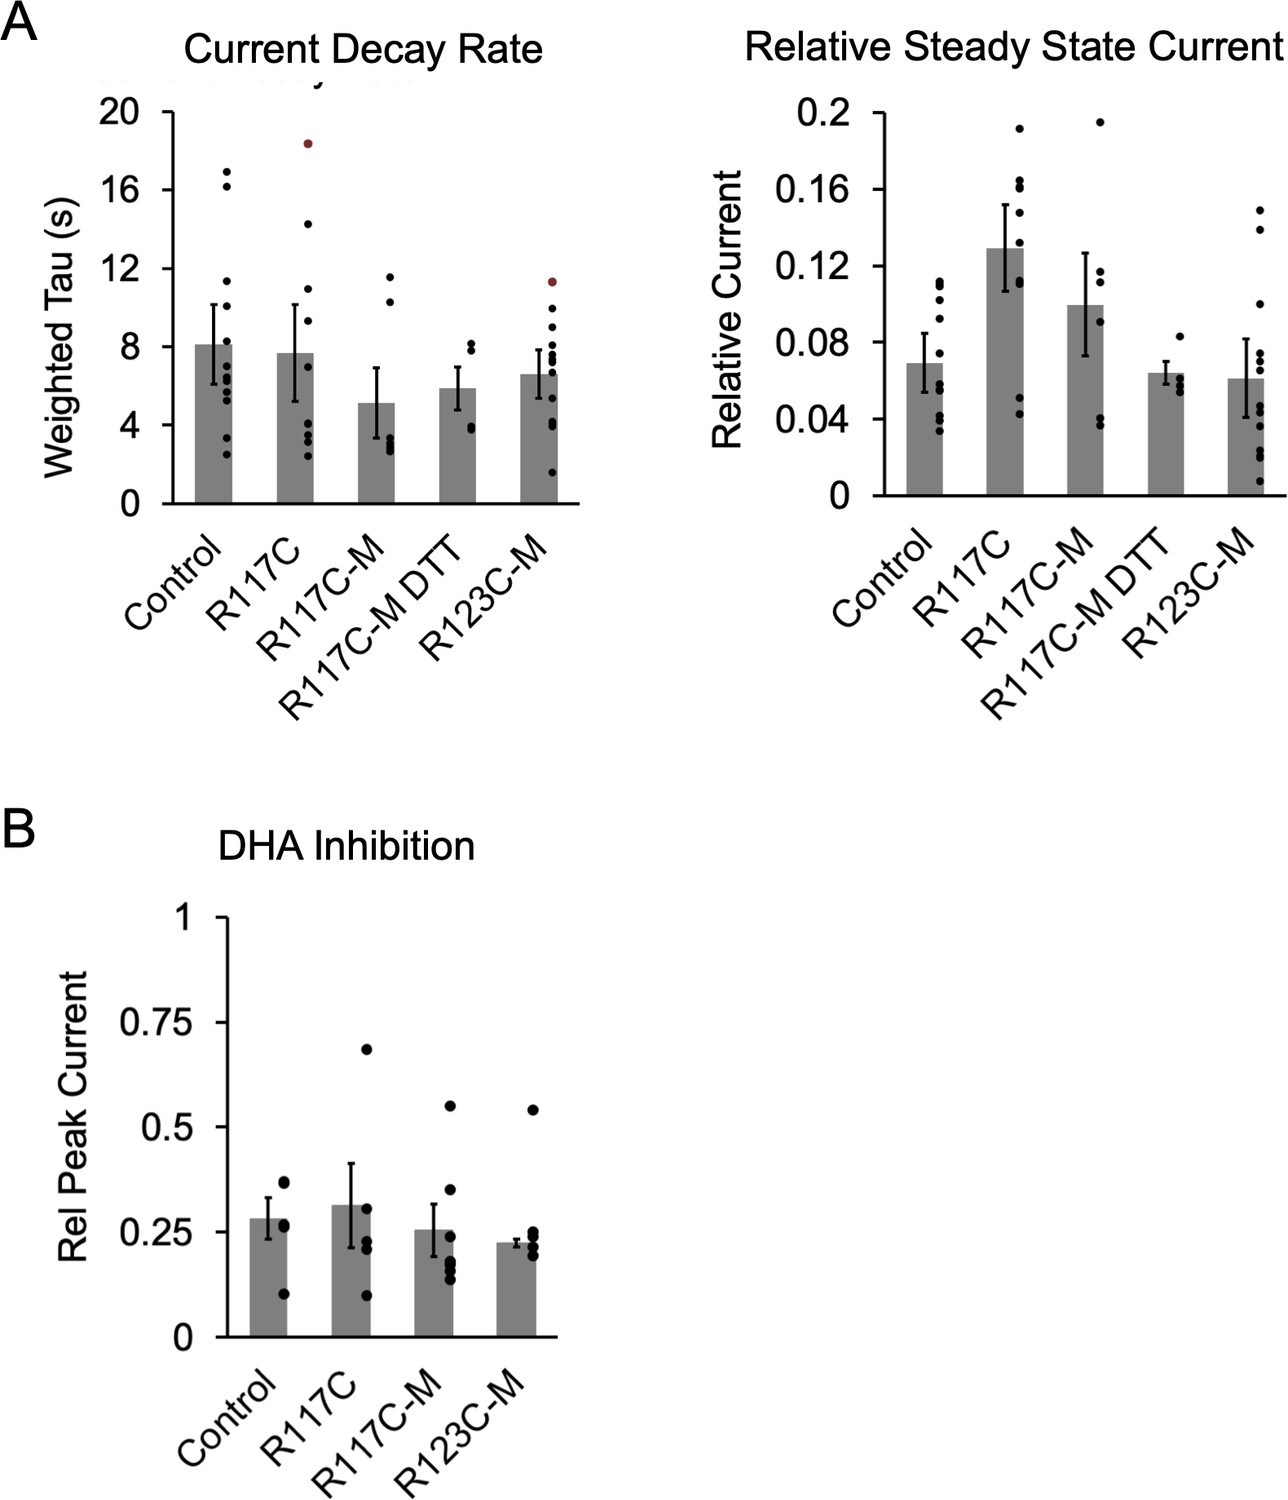
Functional properties of ELIC cysteine mutants (hMTS modified or unmodified).
(A) From the current responses to 30 mM cysteamine from Figure 6B, graphs show the weighted tau of current decay and steady state current normalized to peak (n = 5–13,± SEM). R117C is R117C/C300S/C313S. (B) Magnitude of DHA inhibition quantified as peak current after 3 min pre-application with 30 μM DHA normalized to peak current in the absence of DHA (n = 5–9,± SEM). Conditions were compared using a one-way ANOVA and posthoc Tukey test. There were no significant differences between conditions.
Figure 6—figure supplement 3
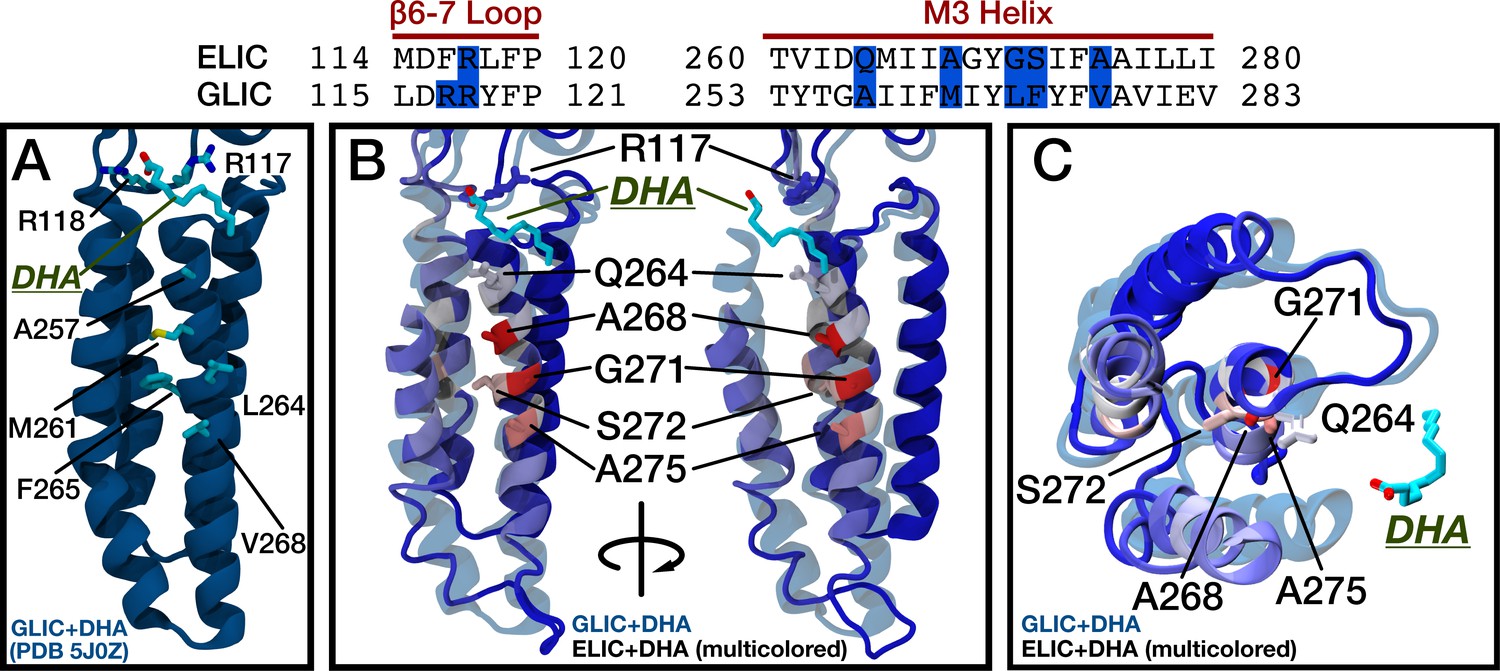
Comparison of DHA binding in ELIC and GLIC.
(Top) Sequence alignment for ELIC and GLIC highlighting in blue the residues with high DHA contact probability in the β6-β7 loop and M3 of ELIC and the corresponding residues in GLIC. The residues in blue are shown in the images below. (A) Structure of GLIC with bound DHA (5J0Z). Side chains are shown for residues equivalent to the high DHA contact probability residues in ELIC. (B) Two side views showing GLIC with bound DHA (5J0Z, transparent blue) aligned to ELIC (multi-colored) with residues colored by the contact probability from Figure 5A. Residues with the highest contact probability are shown as side chains and labeled. (C) Top view showing the TMD of GLIC with bound DHA (5J0Z, transparent blue) aligned to ELIC as in (B).
Figure 6—figure supplement 4

Simulated agonist responses demonstrating the effect of stabilizing an inhibitor (I)-bound pre-active state (AFI).
(A) Model used for simulating agonist responses replicated from Gielen and Corringer (Gielen and Corringer, 2018) with adjustments made to the rate constants to approximate ELIC responses. R = resting, F = flipped (pre-active), O = open, D = desensitized. States with I represent inhibitor-bound states (e.g. DHA). kon = 4,400 M–1s–1, koff = 80 s–1, f+ = 50 s–1, f- = 5000 s–1,β = 10,000 s–1, α = 100 s–1, d+ = 0.7 s–1, d- = 0.01 s–1, k’on = 10,000 M–1s–1, k’off = 0.1 s–1. To reproduce the effect of DHA inhibition of ELIC responses, rate constants leaving AFI were decreased by 105-fold. (B) Simulated currents were generated by applying 30 mM agonist and pre-applying inhibitor. (C) Simulation shows the probability of occupying the inhibitor-bound pre-active state (AFI) with 30 mM agonist, and high (1 mM) and low (0.1 μM) concentrations of inhibitor. High concentrations of inhibitor drive the channel entirely into the AFI state at steady state. (D) From the simulated responses, graphs show decrease in peak response, increase in the rate of current decay, and decrease in steady state current with increasing concentration of inhibitor. The inhibitor leads to a small left-shift in the agonist dose response curve (EC50 = 2.1 mM for [I] = 1e-7 M, EC50 = 1.8 mM for [I] = 1e-5 M).
Figure 6—figure supplement 5
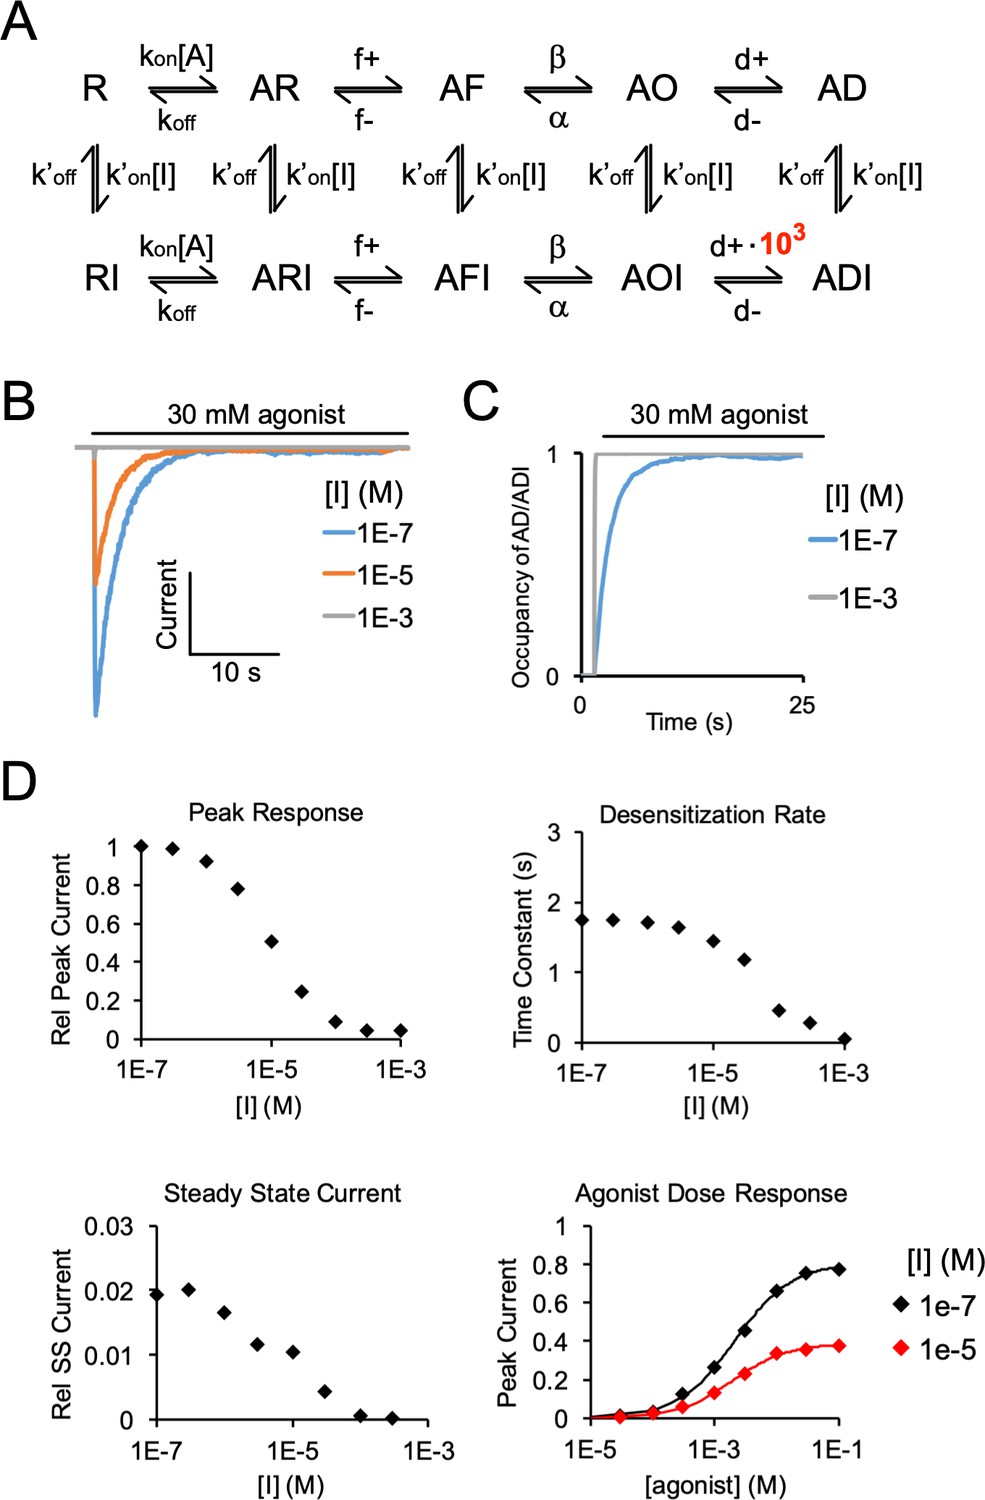
Simulated agonist responses demonstrating the effect of stabilizing an inhibitor (I)-bound desensitized state (ADI).
(A) Same model and rate constants as Figure 6—figure supplement 4, except to reproduce the effect of DHA inhibition of ELIC responses, the rate (d+) entering ADI (inhibitor-bound desensitized state) was increased by 103-fold. (B) Simulated currents were generated by applying 30 mM agonist and pre-applying inhibitor. (C) Simulation shows the probability of occupying the inhibitor-bound desensitized state (ADI) with 30 mM agonist, and high and low concentrations of inhibitor. High concentrations of inhibitor drive the channel entirely into the ADI state at steady state. (D) Simulated responses show inhibition of peak response, increase in the rate of current decay, and lower steady state current with increasing concentration of inhibitor. The inhibitor leads to a small left-shift in the agonist dose response curve (EC50 = 2.1 mM for [I] = 1e-7 M, EC50 = 1.9 mM for [I] = 1e-5 M).
Scheme 1
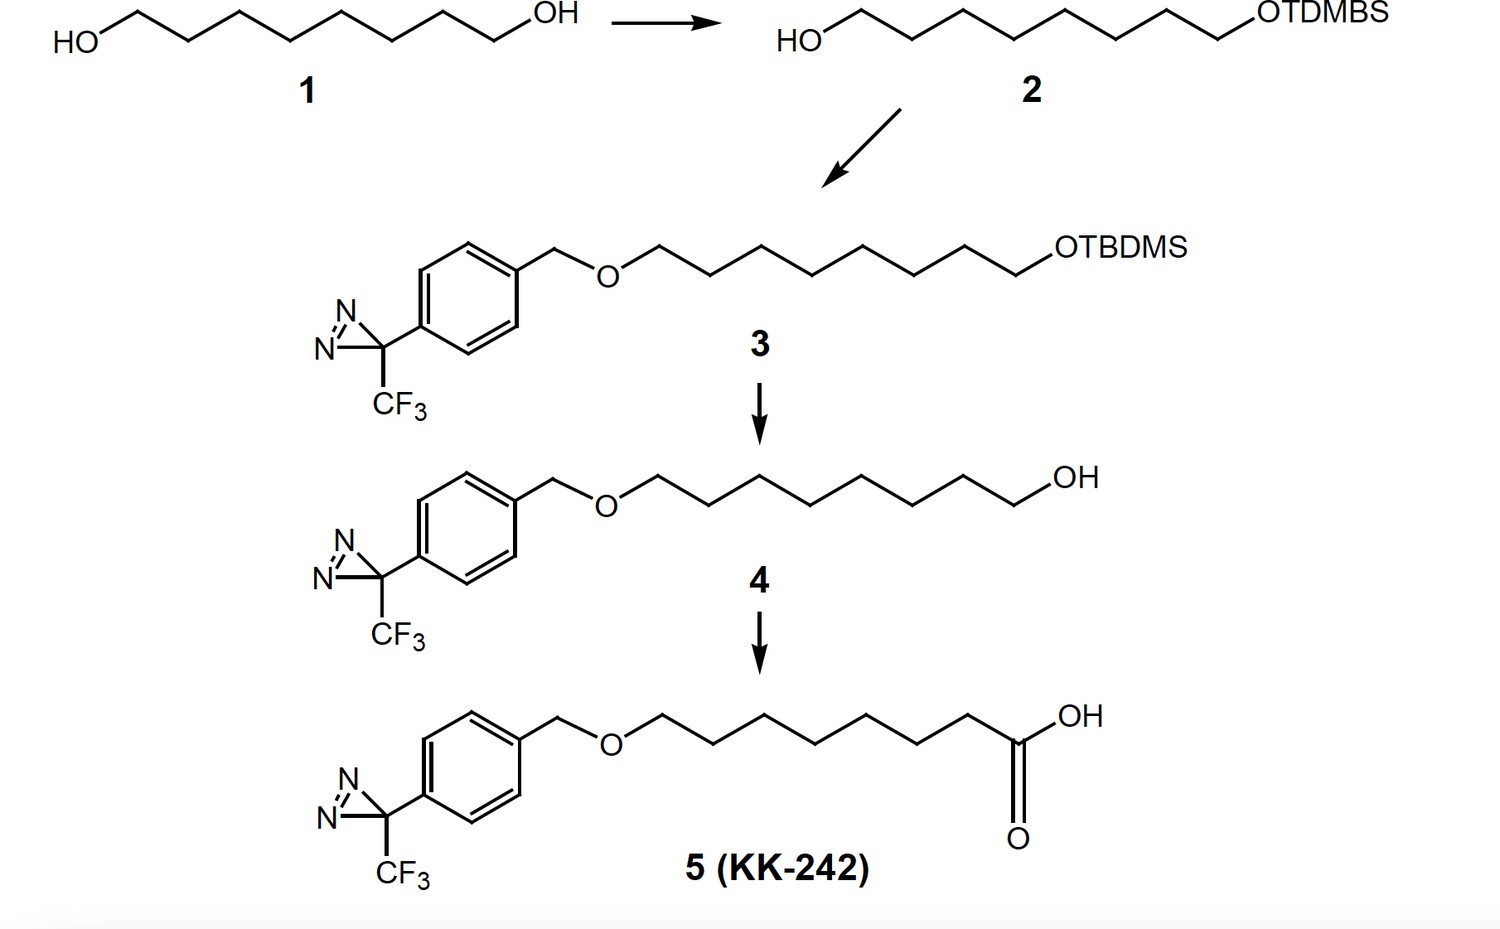
Synthesis of KK-242.
Tables
Key resources table
| Reagent type (species) or resource | Designation | Source or reference | Identifiers | Additional information |
|---|---|---|---|---|
| Strain, strain background (Escherichia coli) | BL21(DE3) C43 | Lucigen | Catalogue # 60446–1 | electrocompetent cells |
| Recombinant DNA reagent | Pet26-MBP-ELIC | Addgene | #39,239 | ELIC plasmid |
| Commercial assay or kit | QuikChange XL | Agilent Technologies | Catalogue # 200,516 | Site-Directed Mutagenesis Kit |
| Chemical compound, drug | cis-4,7,10,13,16,19-Docosahexaenoic acid | Millipore Sigma | D2534 | polyunsaturated fatty acid |
| Chemical compound, drug | Cysteamine | Millipore Sigma | M9768 | ELIC agonist |
| Chemical compound, drug | Hexadecyl methanethiosulfonate | Santa Cruz Biotechnology | sc-215144 | Alkyl-MTS reagent |
| Peptide, recombinant protein | Trypsin from porcine pancreas | Millipore Sigma | T6567 | |
| Other | PLRP-S | Agilent | PL1114-9999 | Reverse-phase column |
| Software, algorithm | XCalibur2.2 | Thermo Scientific | MS analysis | |
| Software, algorithm | PEAKS X+ (10.5) | Bioinformatics Solutions Inc | MS analysis | |
| Software, algorithm | pClamp10.4 | Molecular Devices | RRID:SCR_011323 | Patch-clamp software |
| Software, algorithm | R | https://www.r-project.org/ | Statistical computing |
Additional files
Download links
A two-part list of links to download the article, or parts of the article, in various formats.
Downloads (link to download the article as PDF)
Open citations (links to open the citations from this article in various online reference manager services)
Cite this article (links to download the citations from this article in formats compatible with various reference manager tools)
Polyunsaturated fatty acids inhibit a pentameric ligand-gated ion channel through one of two binding sites
eLife 11:e74306.
https://doi.org/10.7554/eLife.74306


