Non-rapid eye movement sleep and wake neurophysiology in schizophrenia
- Department of Psychiatry, Brigham and Women's Hospital, Harvard Medical School, United States
- The Affiliated Wuxi Mental Health Center of Nanjing Medical University, China
- Stanley Center for Psychiatric Research, Broad Institute of MIT and Harvard, United States
- Department of Psychiatry, McLean Hospital, Harvard Medical School, United States
- Department of Psychiatry, Massachusetts General Hospital, Harvard Medical School, United States
- Bio-X Institutes, Shanghai Jiao Tong University, China
- Huilong Guan Hospital, Beijing University, China
- Analytic and Translational Genetics Unit, Massachusetts General Hospital, Harvard Medical School, United States
- Beth Israel Deaconess Medical Center, United States
- Department of Psychiatry, Harvard Medical School, United States
Figures
Figure 1 with 1 supplement
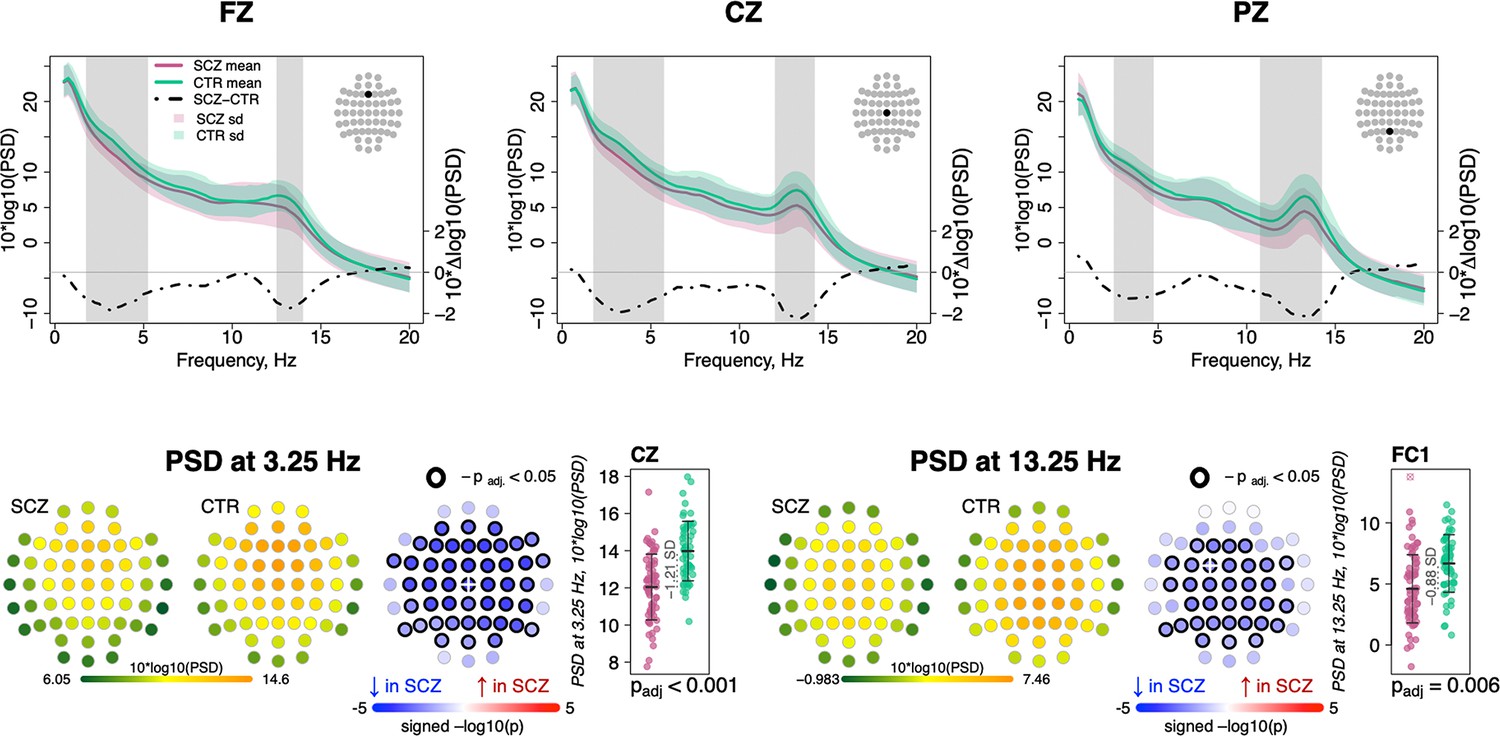
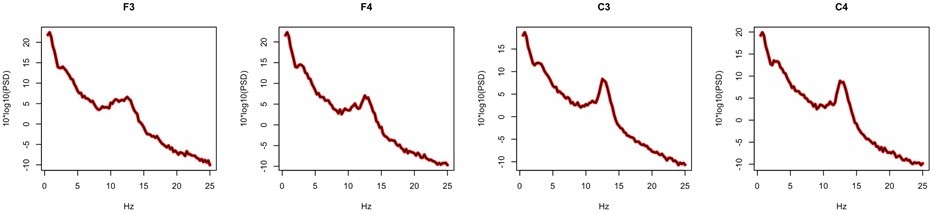
Decreased power in 2–6 Hz and spindle frequencies in schizophrenia (SCZ) during N2 sleep.
The top row illustrates spectral power for frequencies from 0.5 to 20 Hz at Fz, Cz, and Pz channels averaged for SCZ (purple) and CTR (green) groups. Dotted black line illustrates the difference (SCZ-CTR) in averaged spectral power (10×Δlog10(PSD)) and frequency ranges marked with vertical gray bars illustrate frequency bins that showed significant group differences (p < 0.01, unadjusted). The plots in the bottom row illustrate power spectral density (PSD) averaged within groups and spatial distribution of group differences across channels. Channels with p-values adjusted for multiple comparisons (padj) < 0.05 are encircled with black line. The color of each channel corresponds to the signed −log10 adjusted p-value indicating the direction of group differences (blue corresponds to reduction, and red corresponds to increase in SCZ). Two scatterplots show individual spectral power for SCZ and CTR groups for channels with the largest effect sizes for the two indicated frequencies (marked with a white cross on the topoplots).
Figure 1—figure supplement 1
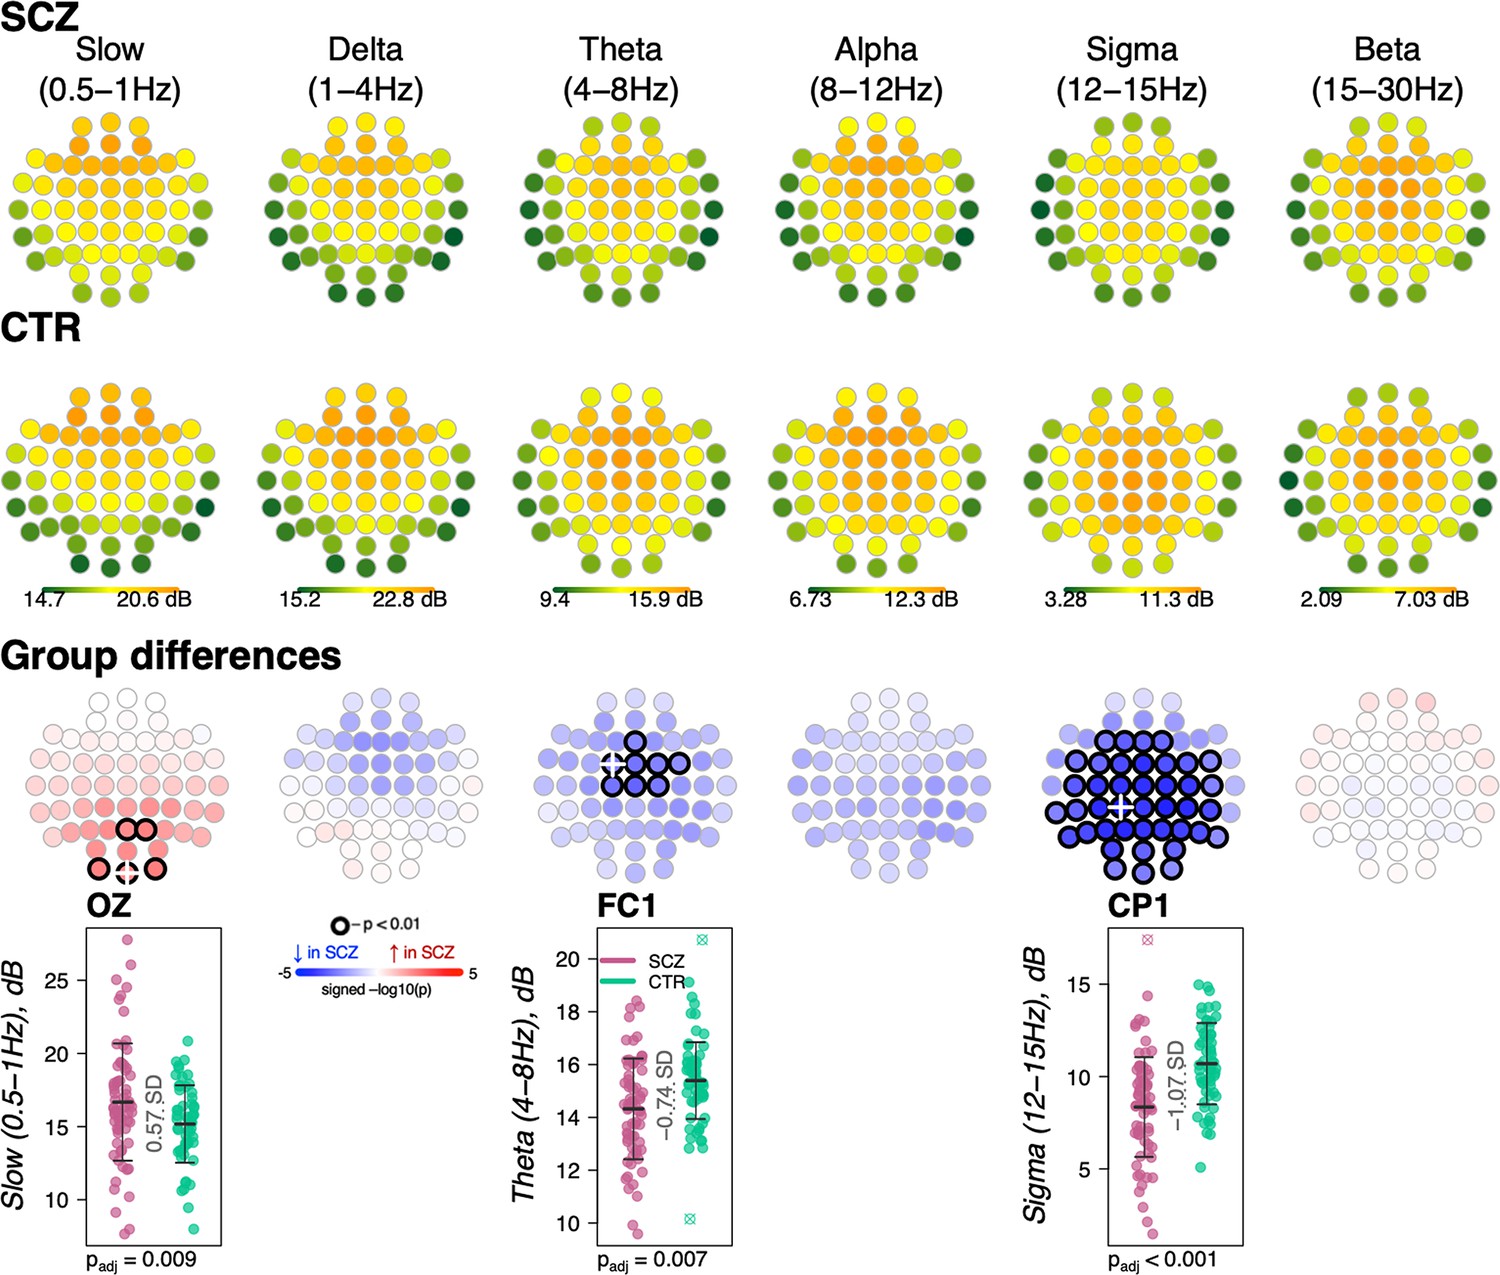
Topographical distribution of group differences in spectral power with respect to classic frequency bands.
Topoplots display spectral power averaged across classic frequency bands averaged across schizophrenia (SCZ) (first row) and CTR (second row) and group differences (third row). Channels with unadjusted p-values below the significance threshold (p < 0.01) are encircled with black line. The color of each channel corresponds to the signed −log10 p-value indicating the direction of group differences (blue corresponds to reduction, and red corresponds to increase in SCZ). Two scatterplots show individual spectral power for SCZ and CTR groups for channels with the largest effect sizes for the two indicated frequencies (marked with a white cross on the topoplots).
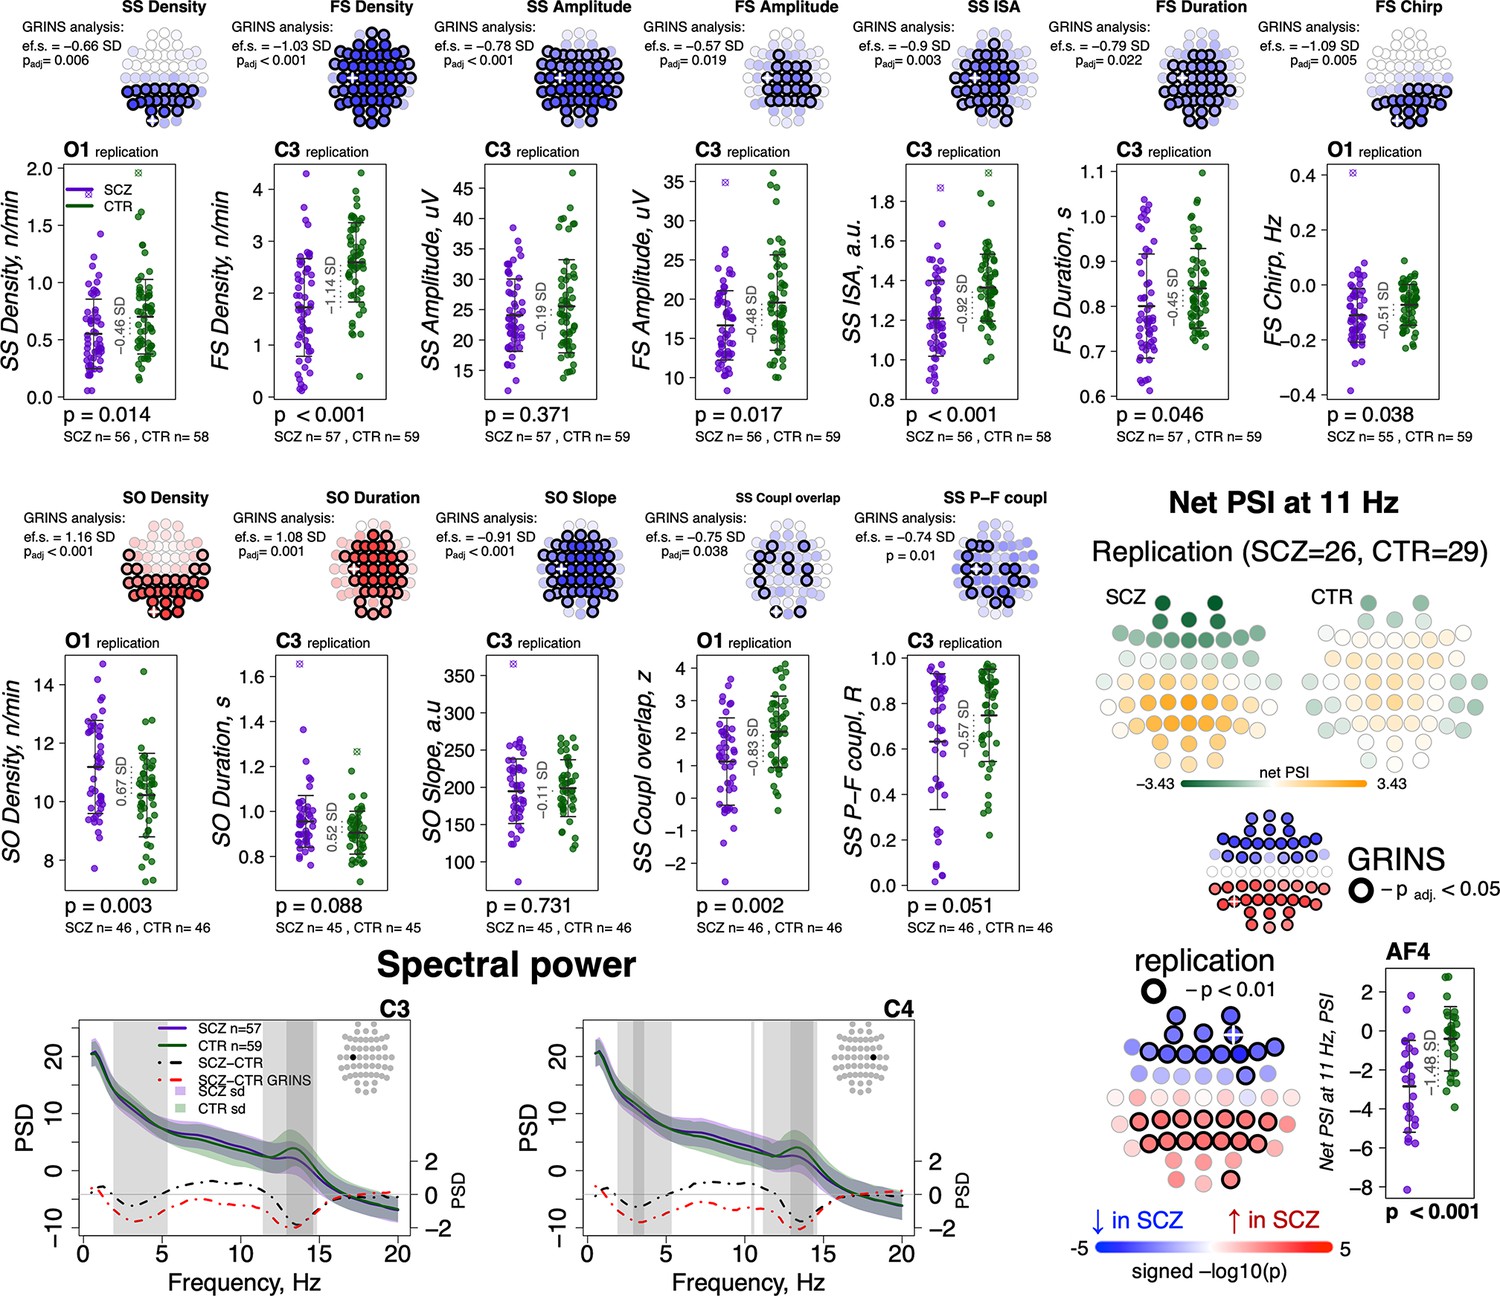
Figure 2 with 3 supplements
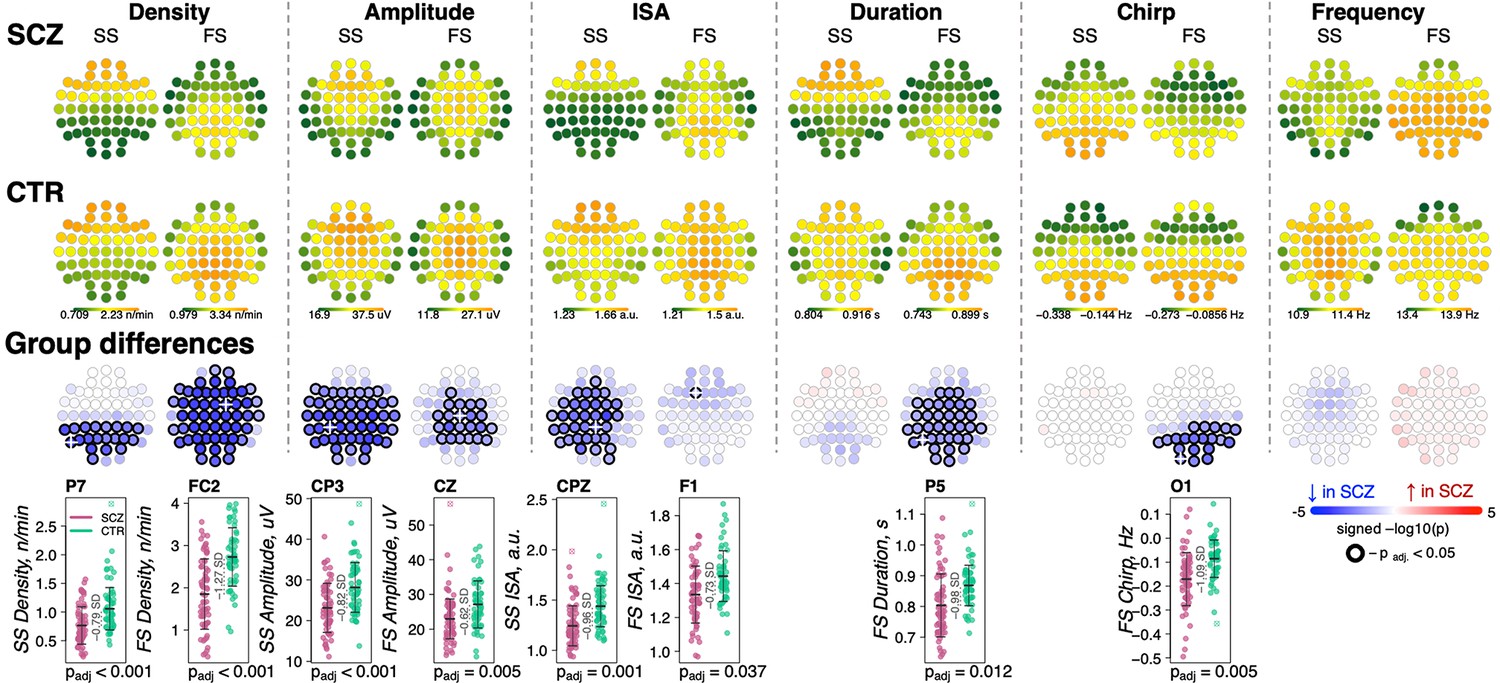
Reduced density of slow (SS) and fast spindles (FS) during N2 sleep in schizophrenia (SCZ) patients observed together with alterations in spindle morphology.
The top two rows show topographical distribution in density, amplitude, integrated spindle activity (ISA), duration, chirp, and frequency of SS and FS averaged across SCZ (first row) and CTR (second row) groups. The third row of topographical plots illustrates group differences in these metrics. Each circle represents an EEG channel. EEG channels with adjusted p-values (multiple comparisons) < 0.05 are encircled in black and the color of each channel corresponds to the signed −log10 adjusted p-value indicating the direction of group differences (blue corresponds to reduction, and red corresponds to increase in SCZ). The bottom row illustrates distributions of spindle parameters in SCZ and CTR groups in the channel with the largest effect size of group differences (marked with a white cross on the topoplot).
Figure 2—figure supplement 1
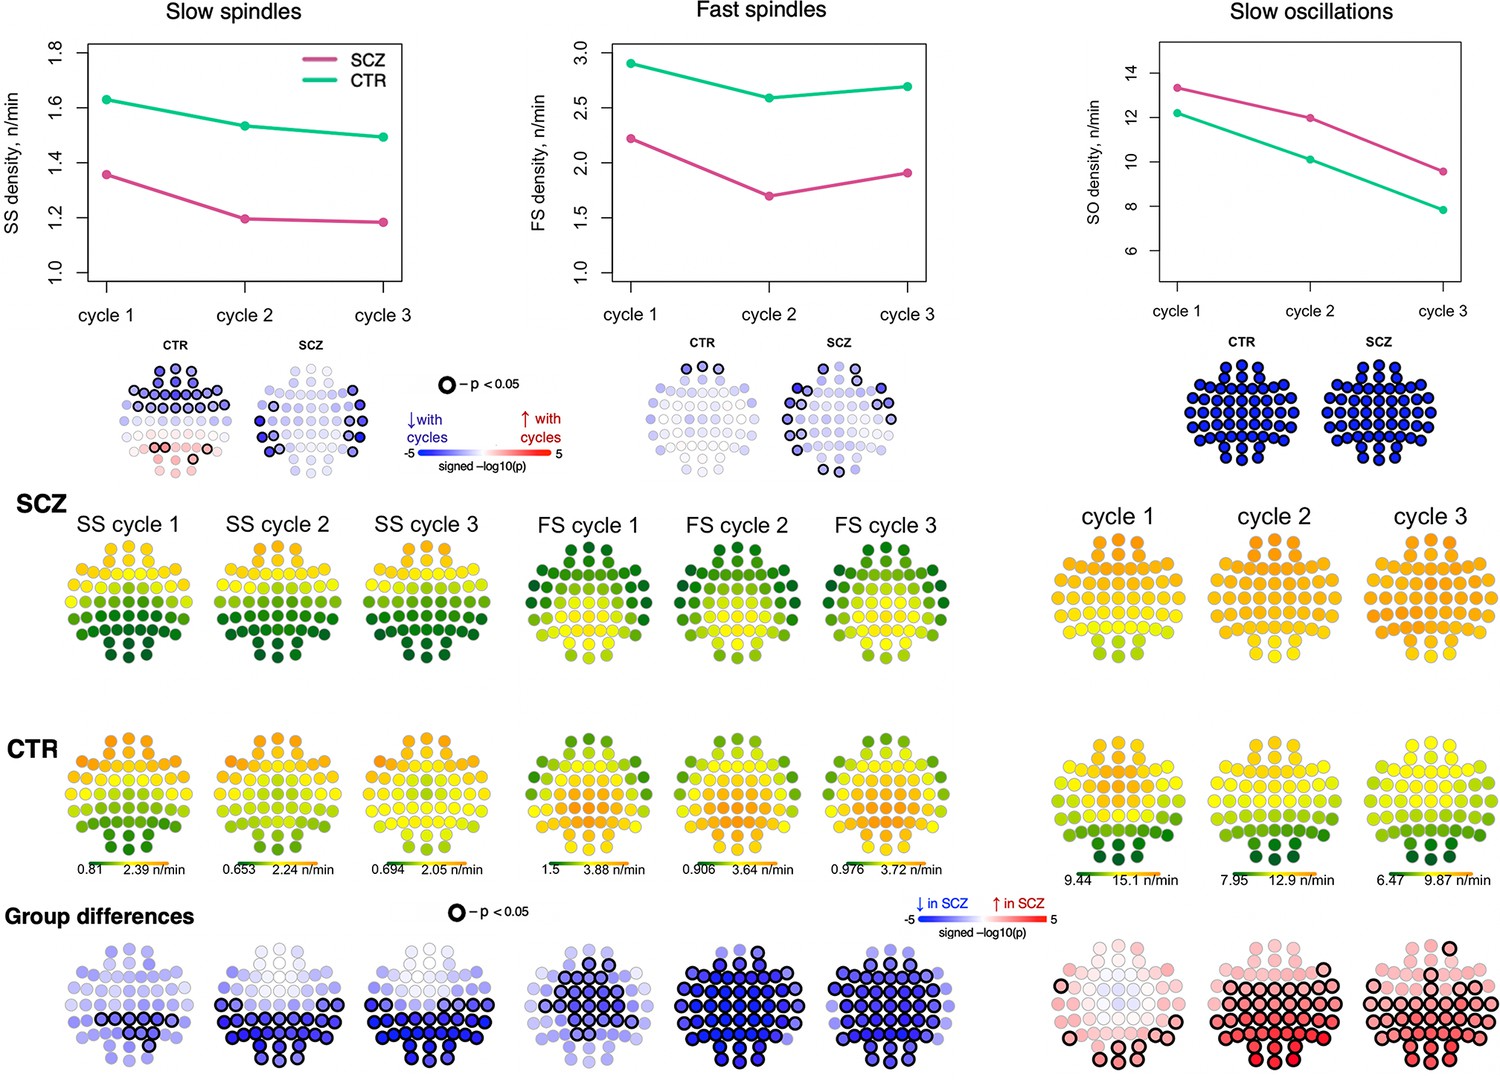
Spindle and slow oscillation dynamics across the night.
The top plots illustrate the average density of slow spindles (SS), fast spindles (FS), and slow oscillations (SOs) per cycle (the N2 periods of that cycle) across all channels separately for schizophrenia (SCZ) and CTR groups. The topoplots directly below those plots illustrate whether there was a significant association between the density and the cycles separately in SCZ and CTR groups. The topoplots in the three rows from the bottom illustrate topographical distribution of SS, FS and SO density separately for SCZ and CTR and group differences across the first three cycles.
Figure 2—figure supplement 2
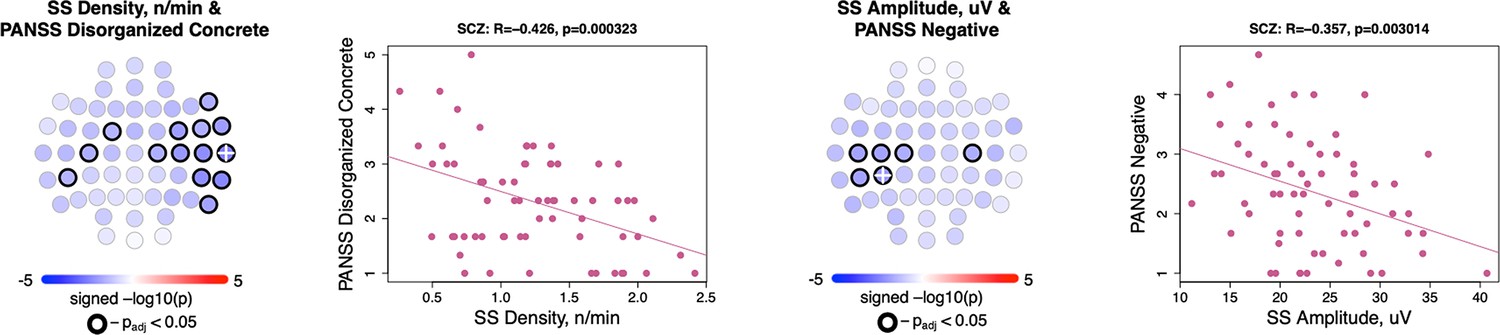
Associations between slow spindle density/amplitude and positive and negative syndrome scale (PANSS) scores.
Topoplots illustrate the significance of associations between slow spindle (SS) density and PANSS disorganized-concrete score (left); also, SS amplitude and PANSS negative score (right). The scatterplots to the right of each topoplot illustrate SS density/amplitude as a function of PANSS score at electroencephalogram (EEG) channel where association was the most significant (white cross mark on the topoplot). The title of each scatterplot also provides Pearson’s correlation coefficient together with the p-value for this channel.
Figure 2—figure supplement 3
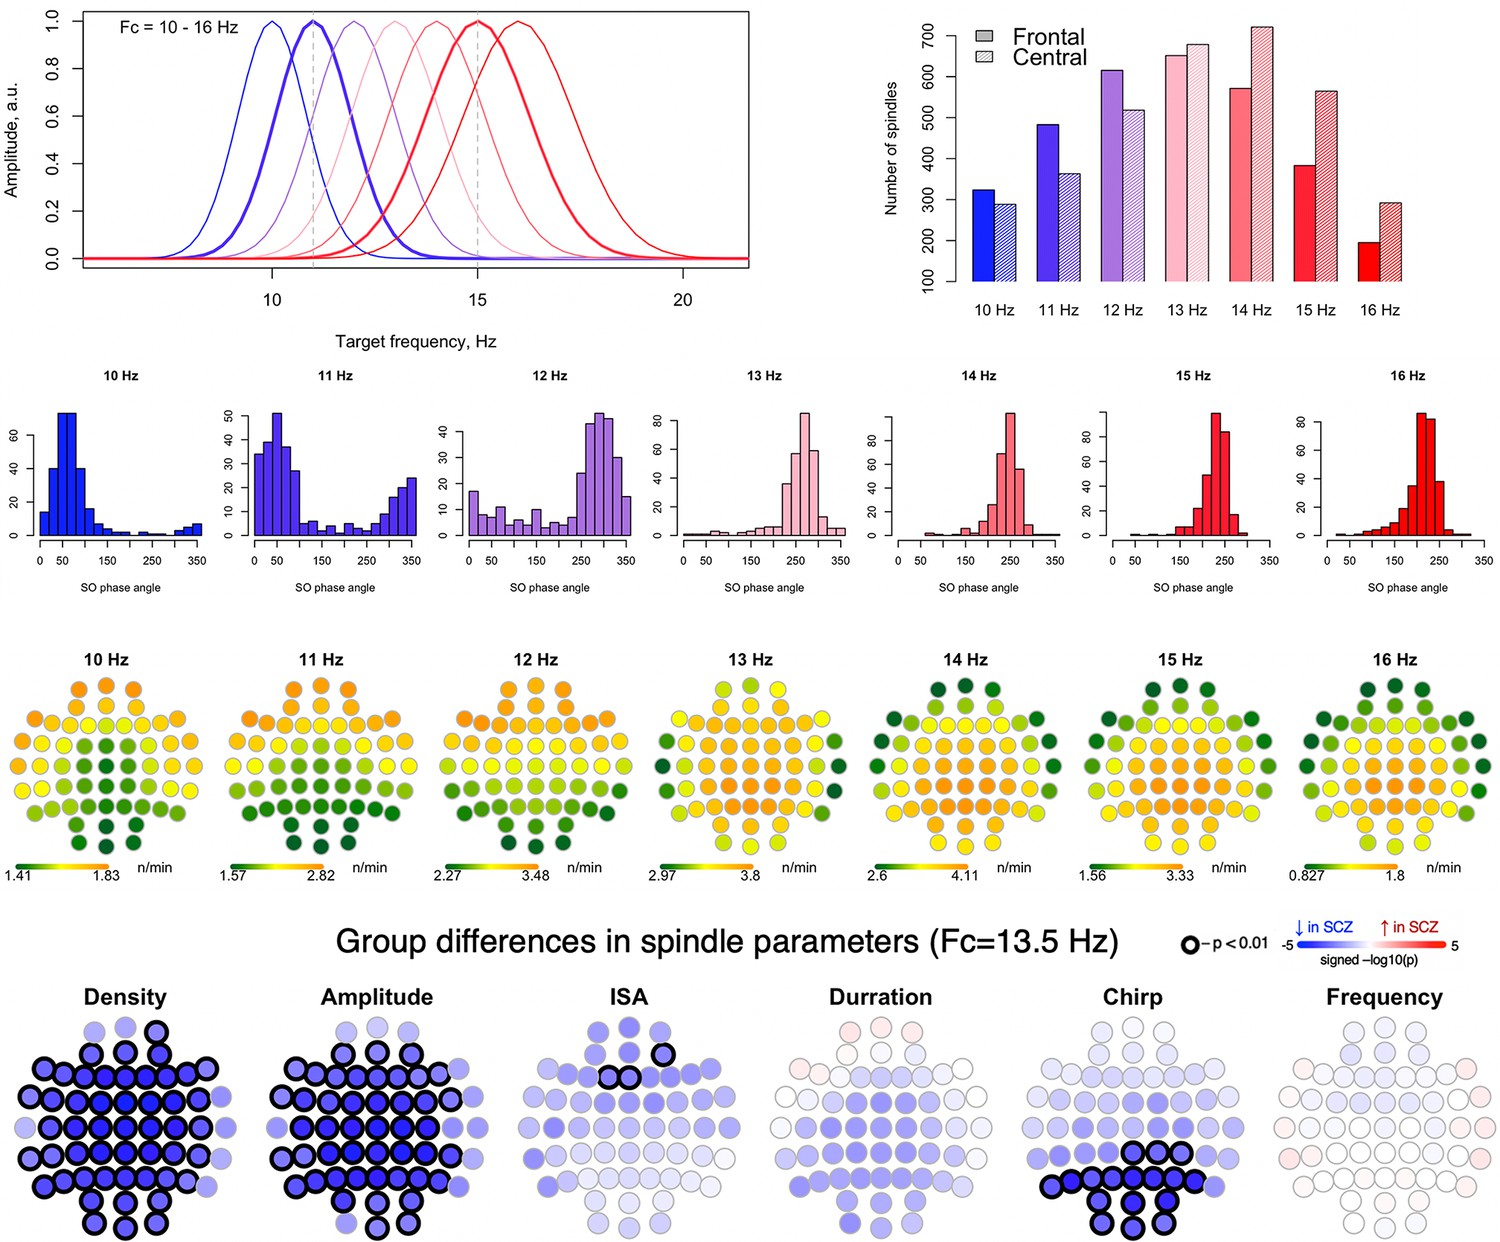
Spindles with different target frequencies.
The top left plot represents spindle frequencies distribution for all spindles detected using targeted wavelet center frequencies from 10 to 16 Hz. The bar plot on the top right illustrates the average spindle count in CTR group over frontal (AF3, AF4, AFZ, F1, F2, F3, F4, F5, F6, F7, F8, FPZ, FT7, FT8, FZ, FP1, FP2) and central (C1, C2, C3, C4, C5, C6, CP1, CP2, CP3, CP4, CP5, CP6, CPZ, CZ") channels for spindles detected using center frequencies from 10 to 15 Hz. The histograms in the second row display the slow oscillation (SO) angle where spindle peaks are detected in CTR group. The topoplots in the third row illustrate topographical distribution of spindle density averaged across CTR participants between schizophrenia (SCZ) and CTR for spindles detected using center frequencies from 10 to 16 Hz. The fourth row displays the group differences in spindle parameters for spindles detected using a common center frequency Fc = 13.5 Hz.
Figure 3 with 1 supplement
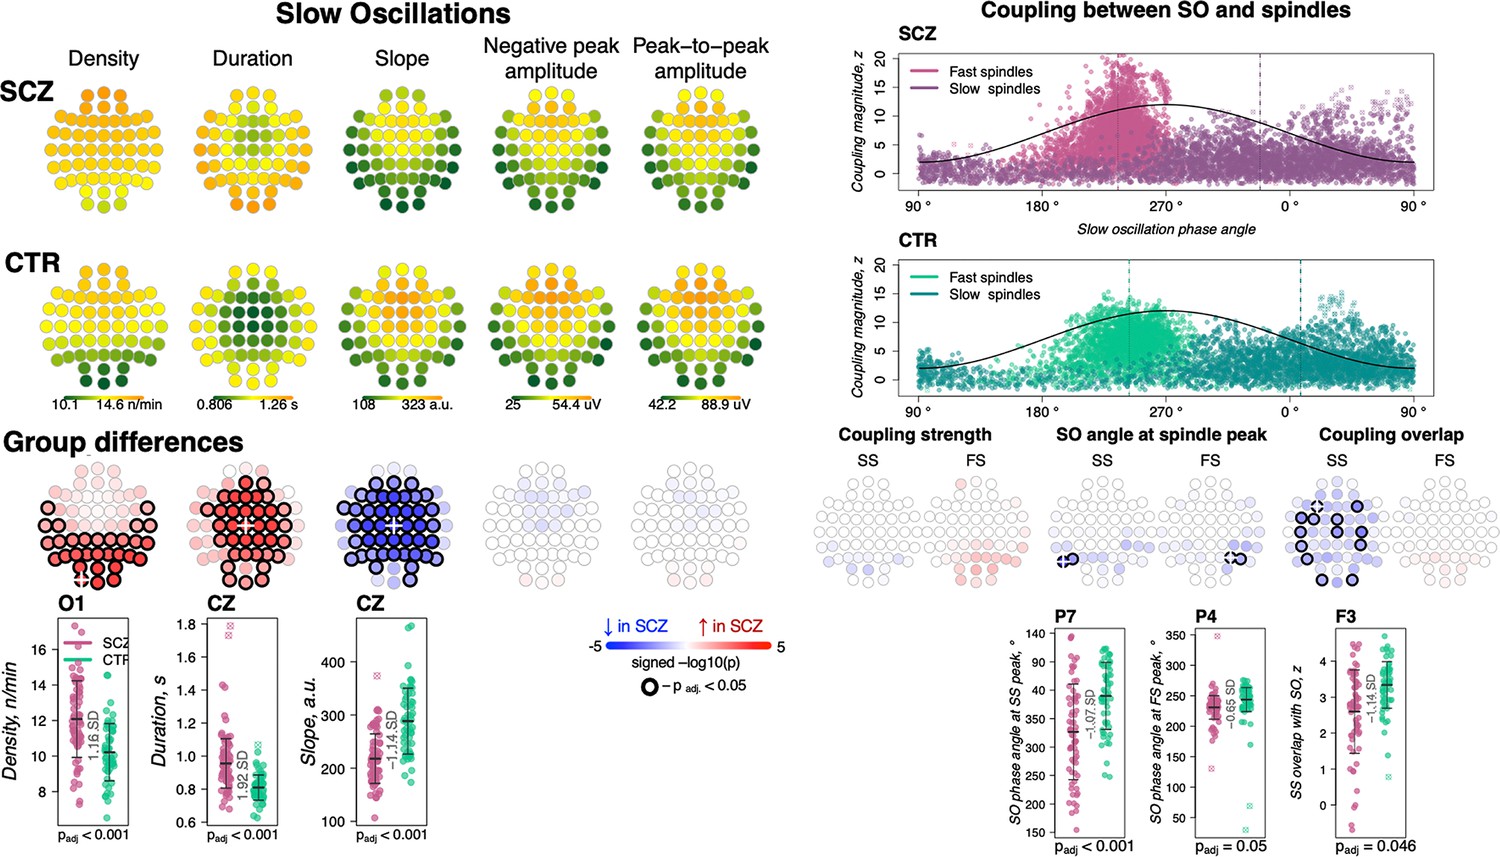
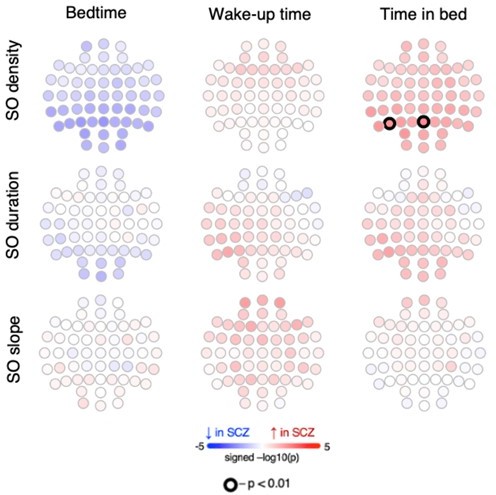
Altered slow oscillations (SOs) and their coupling with spindles in schizophrenia (SCZ).
Left: Rows represent the topographical distribution of different SO parameters averaged across SCZ (first row) and CTR (second row) groups. Right: Coupling between SO and spindles in SCZ and CTR groups. Each point represents coupling magnitude and average SO phase of a spindle peak at a given channel in each participant. Mean SO angle of coupling for slow and fast spindles is shown as a vertical line of the corresponding color. The black line illustrates SO waveform at corresponding phase angles. Topoplots in the third row illustrate significance and direction of group differences across electroencephalogram (EEG) channels in SO parameters and its coupling with spindles. EEG channels with significant group differences (padj < 0.05) are encircled in black and the color of each channel represent the signed −log10 adjusted p-value indicating decrease (shades of blue) or increase (shades of red) in the tested EEG parameter in SCZ compared to CTR. Individual data at channels with the largest effect sizes of group differences are provided in the bottom row of scatter plots for the altered EEG parameters in SCZ (the exemplary channel is marked with a white cross on the topoplot above).
Figure 3—figure supplement 1
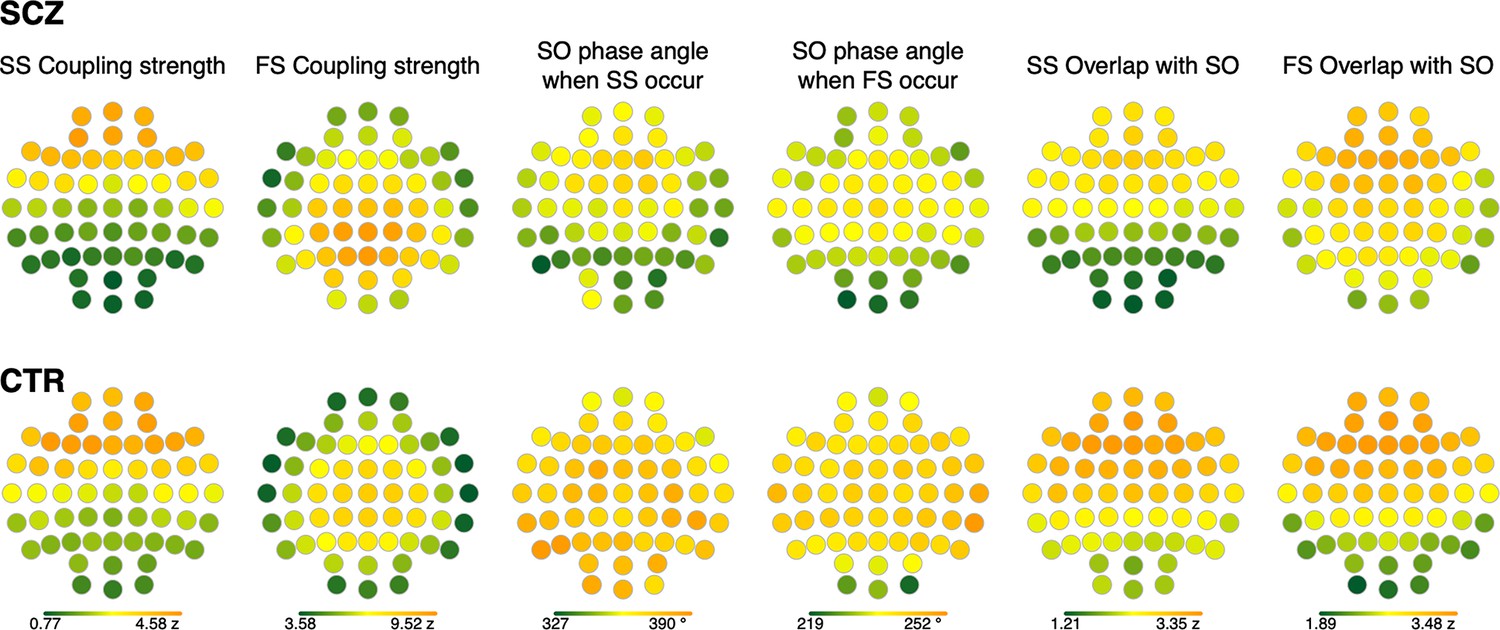
Topographical distribution of coupling characteristics averaged across schizophrenia (SCZ) and CTR groups.
Topographical distributions of coupling parameters between slow spindles (SS) or fast spindles (FS) and slow oscillations (SO) averaged across SCZ (first row) and CTR (second row).
Figure 4 with 1 supplement
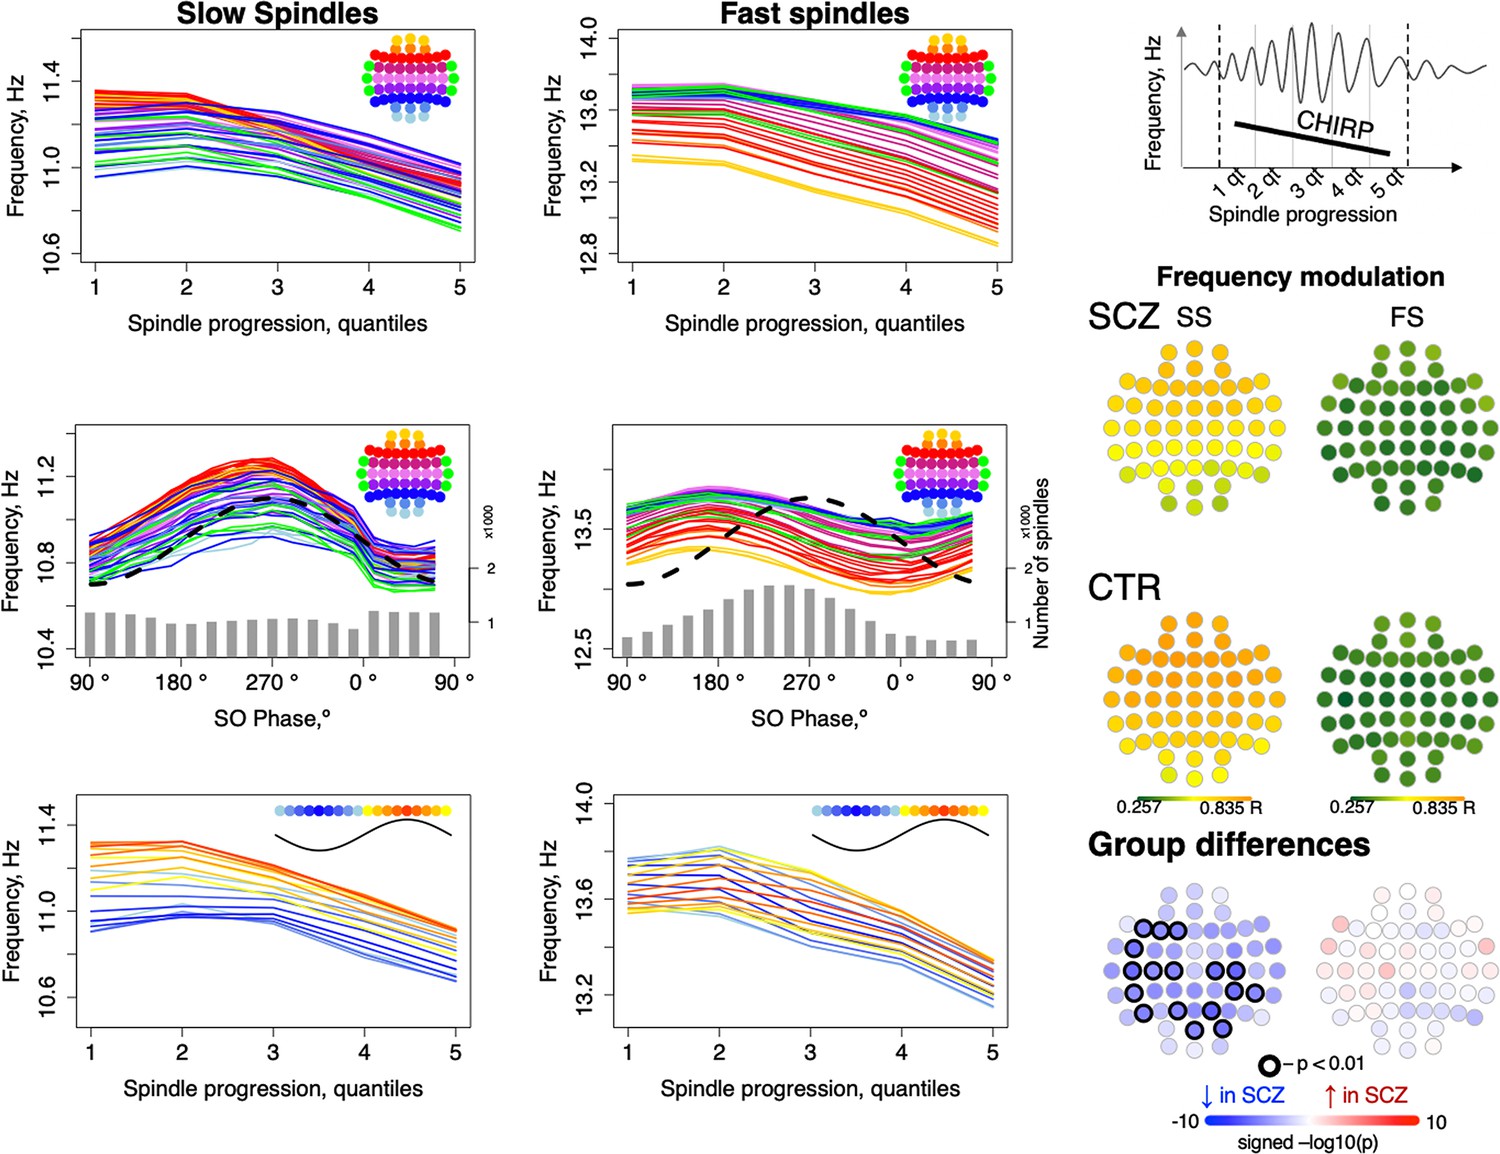
Intra-spindle frequency deceleration (chirp) is associated with slow oscillation (SO) phase differently for slow and fast spindles and such phase-frequency modulation is attenuated in schizophrenia (SCZ).
Top: frequency changes across slow and fast spindle as spindles progress in five quintiles across all channels (averaged across all participants). Middle: intra-spindle frequency dependency on SO phase across all channels (lines) and total number of spindles detected in all channels and individuals at a given SO phase bin (gray bars). Bottom: spindle frequency as a function of both spindle progression (y axis) and SO phase (color of the curve; each curve represents frequency of spindles averaged across all channels for each 20-degree phase bin; blue curves illustrate frequency of spindles occurring close to the negative peak and red curves illustrate spindles next to the positive peak of SOs). The topoplots on the right illustrate topographical distribution of phase/frequency modulation averaged within SCZ and CTR groups separately for slow and fast spindles. Phase/frequency was estimated as linear-circular correlation between instantaneous frequency of individual spindle and phase of co-occurring SO. Topoplots in bottom right illustrate group differences in phase/frequency modulation. Channels with uncorrected p-values < 0.01 are encircled in black, and the color of each channel represents the signed −log10 p-value indicating decreased (shades of blue) or increased (shades of red) coupling in the SCZ group.
Figure 4—figure supplement 1
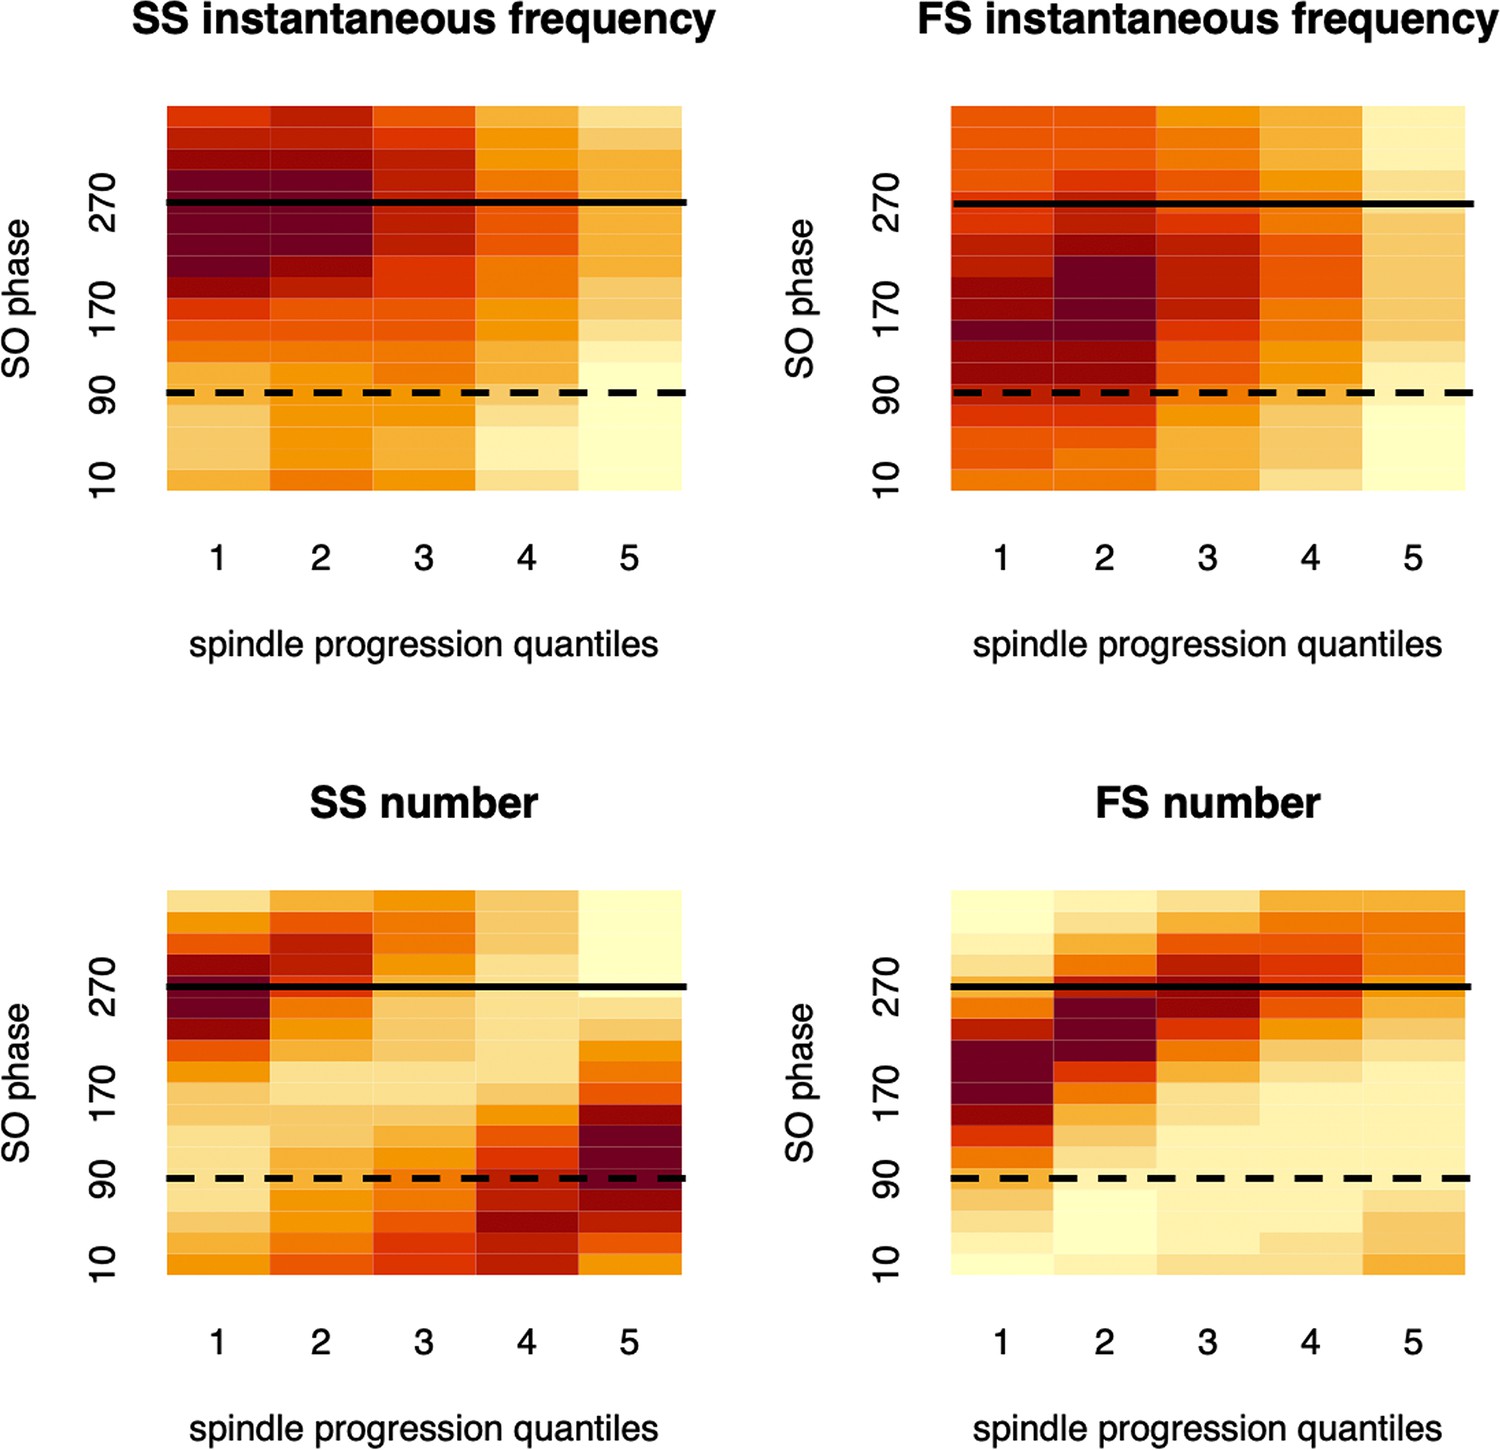
Instantaneous frequency and its coupling with slow oscillation (SO) phase.
Top two plots illustrate how slow spindle (SS) or fast spindle (FS) instantaneous frequency changes with respect to SO phase (vertical axis) and spindle progression (horizontal axis), averaged across all participants. The bottom plots similarly demonstrate how SS/FS count changes with respect to SO phase (i.e. reflecting conventional SO-spindle temporal coupling). The dashed horizontal black line (90 degrees) indicates the SO negative peak; the solid line (270 degrees) indicates SO positive peak.
Figure 5
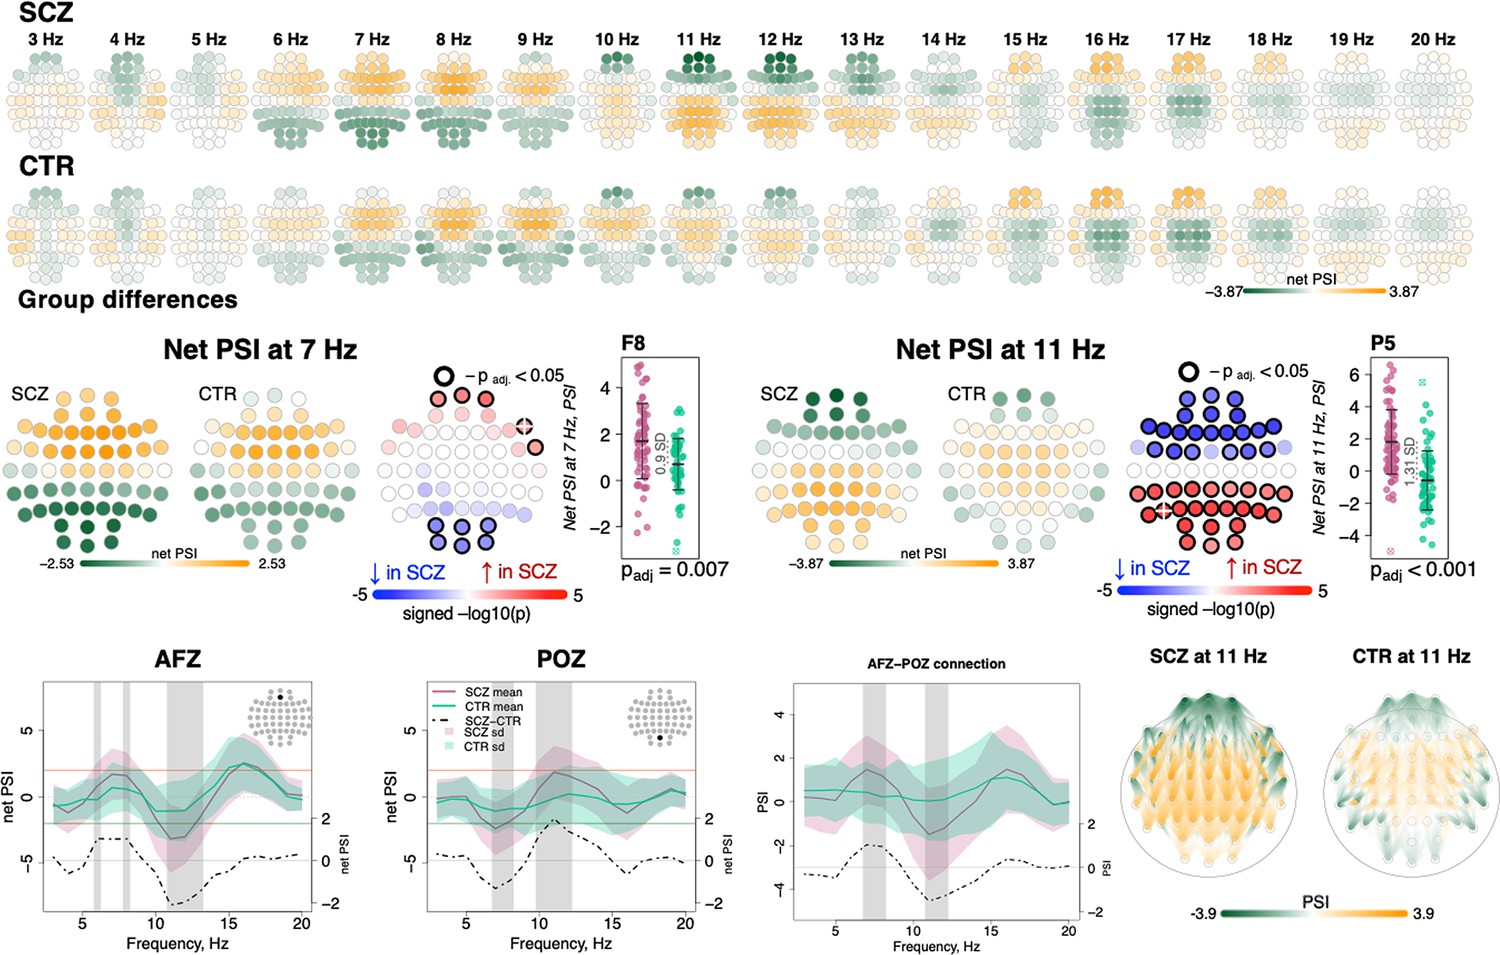
Directionality of information flow and hyperconnectivity in schizophrenia (SCZ).
The top two rows illustrate net phase slope index (PSI) values across channels for each center frequency from 3 to 20 Hz averaged in SCZ and CTR groups. The topoplots in the middle row provide illustration of topographical distribution of net PSI values and group differences at 7 and 11 Hz (frequency bins where largest effect sizes of group differences in net PSI were observed). Channels with significant group differences (padj < 0.05) are encircled with black line and the color of channels represents signed −log10 p-value with shades of blue indicating decrease in SCZ and shades of red indicating increase in SCZ. Three plots from the left in the bottom row illustrate averaged net PSI and group differences (shadow regions where unadjusted p-values < 0.01) for AFz and POz and pairwise PSI values between AFz and POz. The topoplots on the right illustrate PSI connectivity at 11 Hz averaged for SCZ and CTR groups between channel pairs with uncorrected p-values < 0.001.
Figure 6
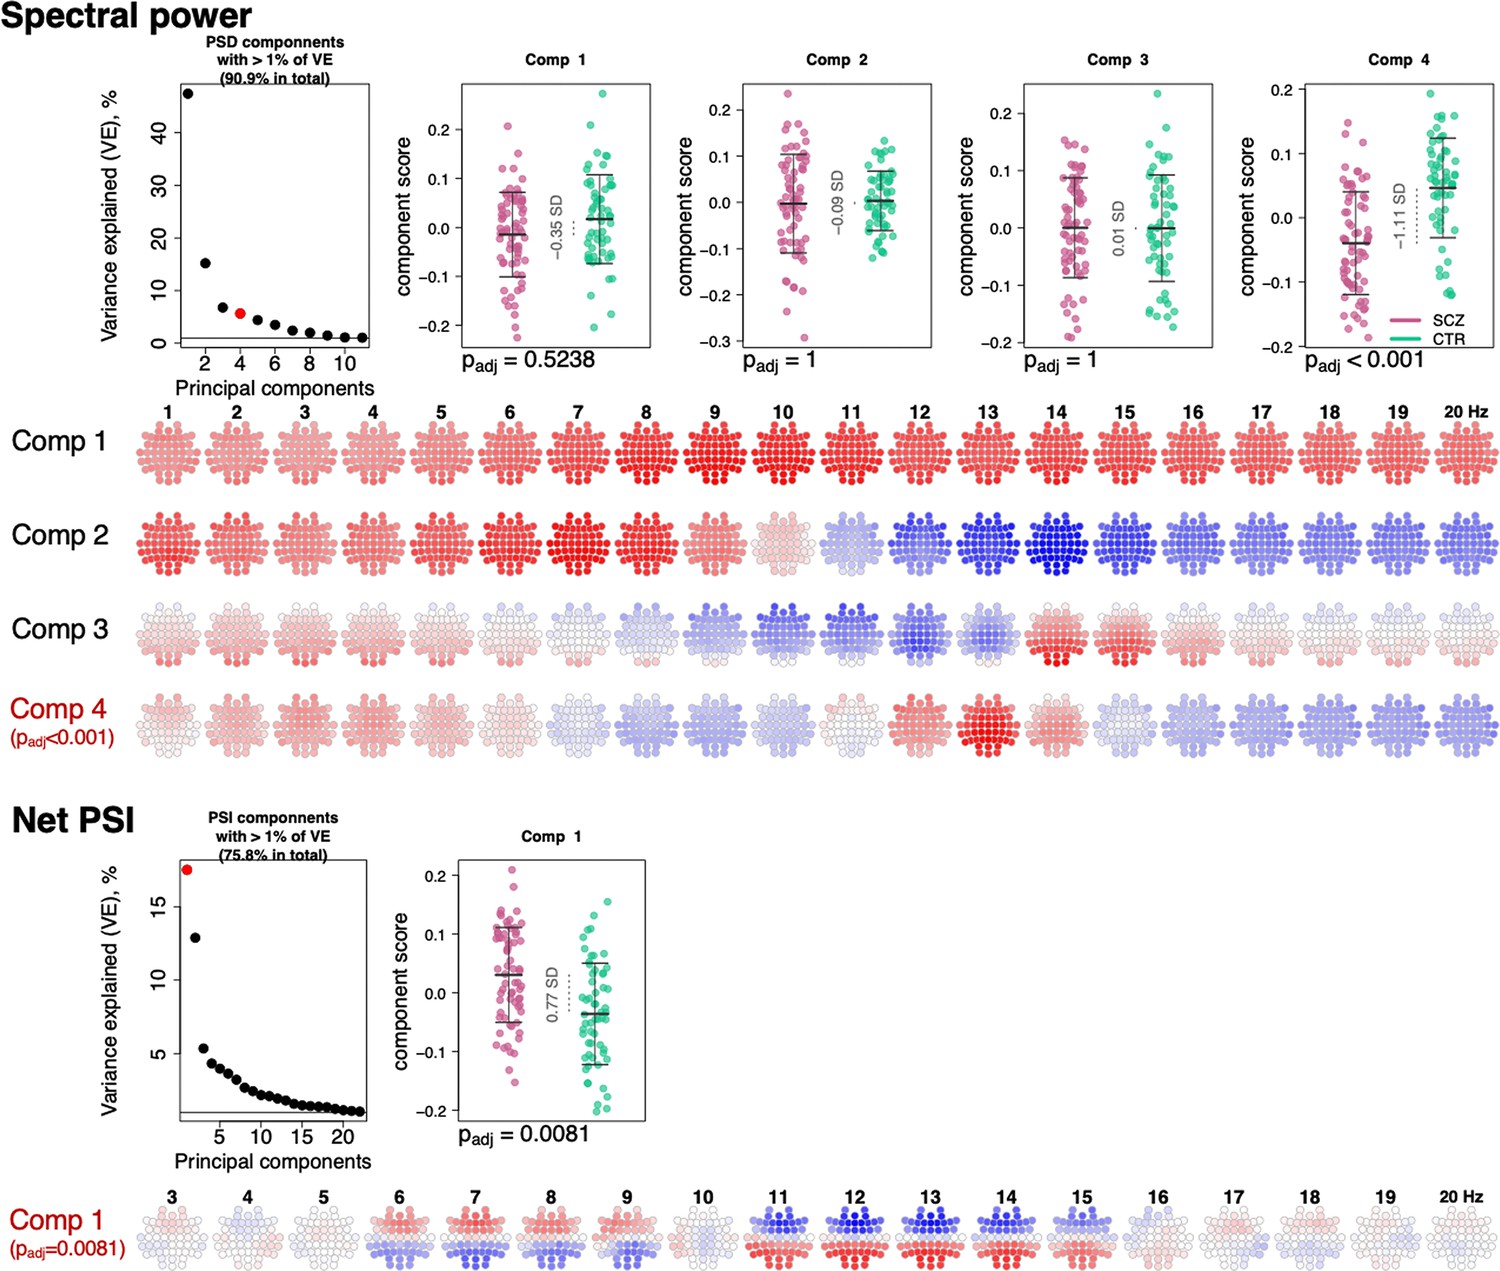
Power spectral density (PSD) and net phase slope index (PSI) components recapitulate alterations in spectral power and net PSI.
The top left plot illustrates variance explained by the first 11 PSD components (thresholded at 1% variance explained). Red color highlights the component that expressed significant association with schizophrenia (SCZ) (padj < 0.05 Bonferroni adjusted for 11 comparisons). Scatterplots to the right illustrate each component’s score in SCZ and CTR groups. Four rows of topoplots on the bottom represent each component’s loadings across channels and frequencies. The first component of PSI is presented in a similar fashion.
Figure 7

Joint model analysis across electroencephalogram (EEG) metrics that were altered in schizophrenia (SCZ).
The matrix on the left illustrates p-values of the joint model analysis. A joint logistic regression model with formula logit(DISORDER) ~ EEG metric1 at CH1 + EEG metric2 at CH1 + EEG metric2 at CH2 + sex + age + error was fitted for each EEG metric, where CH1 is the channel with the largest effect size for EEG metric1 and CH2 is the channel with the largest effect size for EEG metric2. EEG metric1 is specified by rows, EEG metric2 by columns. The relative size and color in each cell indicate −log10 unadjusted p-value in EEG metric1 at the CH1 after EEG metric2 at CH1 and CH2 was added as a covariate to the logistic regression. p-Values of EEG metric1 where group differences were not significant (p > 0.05) after covariates were added are provided in corresponding cells. Diagonal cells contain the original (i.e. not adjusted by metric2) p-values for metric1. Two bar plots on the right illustrate absolute effects sizes (top) or number of significant (padj < 0.05) channels among the tested metrics (the bar plot on the bottom right does not include power spectral density [PSD] and phase slope index [PSI] because these were based on principal spectral components (PSCs) and the number of channels could not be directly estimated).
Figure 8
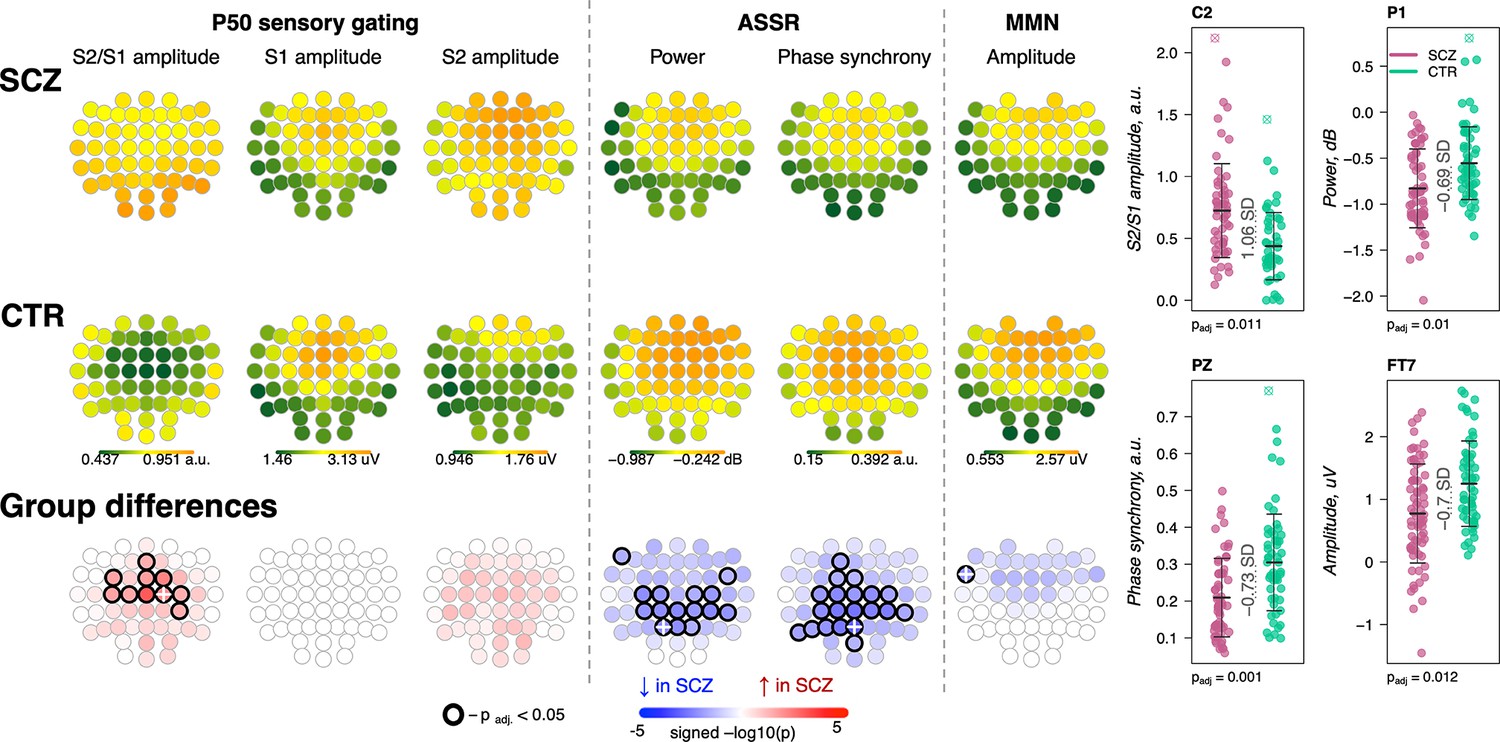
Awake auditory processing abnormalities in schizophrenia (SCZ): diminished mismatch negativity (MMN) amplitude, increased P50 ratio between S2 and S1 during sensory gating and reduced power and phase synchrony of auditory steady-state response (ASSR).
The top two rows’ topoplots represent the topographical distribution in P50 S2/S1 ratio, as well as the P50 amplitudes elicited by stimulus S1 and stimulus S2; ASSR power and ASSR phase synchrony; MMN amplitude averaged across patients with SCZ (the first row) and controls (the second row). The topoplots in the third row illustrate significance and direction of group differences across electroencephalogram (EEG) channels. Four scatterplots on the top right display distributions of each metric with significant group differences at an exemplary channel with the largest effect size (marked with a white cross on the topoplots illustrating group differences).
Figure 9 with 1 supplement
Most sleep microarchitecture alterations were replicated in an independent dataset.
Top row – topoplots recapitulate the findings in spindle parameters observed during the original analysis in the GRINS cohort; channels marked with a white cross were tested in the replication cohort. p-Values and effect sizes from the between-group comparison of the GRINS sample is to the left of the topoplots. The scatterplots below illustrate the corresponding group differences in the replication datasets. Middle two rows – similar plots for slow oscillation (SO) and coupling parameters. Two graphs in the bottom row show averaged spectral power across groups (schizophrenia [SCZ] in purple, CTR in dark green, shadow of the same color represents standard deviation) for 0.5–20 Hz. The dotted lines illustrate difference in spectral power between the groups (SCZ-CTR) in the replication sample (black) and GRINS (dark red). Lighter shaded areas represent frequency bins where group differences were significant in GRINS (p < 0.01) and darker shaded areas mark frequency bins where group differences were observed in the replication sample (p < 0.05). Topoplots displayed in the bottom right corner illustrate averaged net phase slope index (PSI) values and group differences (uncorrected p < 0.01) in the replication sample with high-density electroencephalogram (EEG).
Figure 9—figure supplement 1
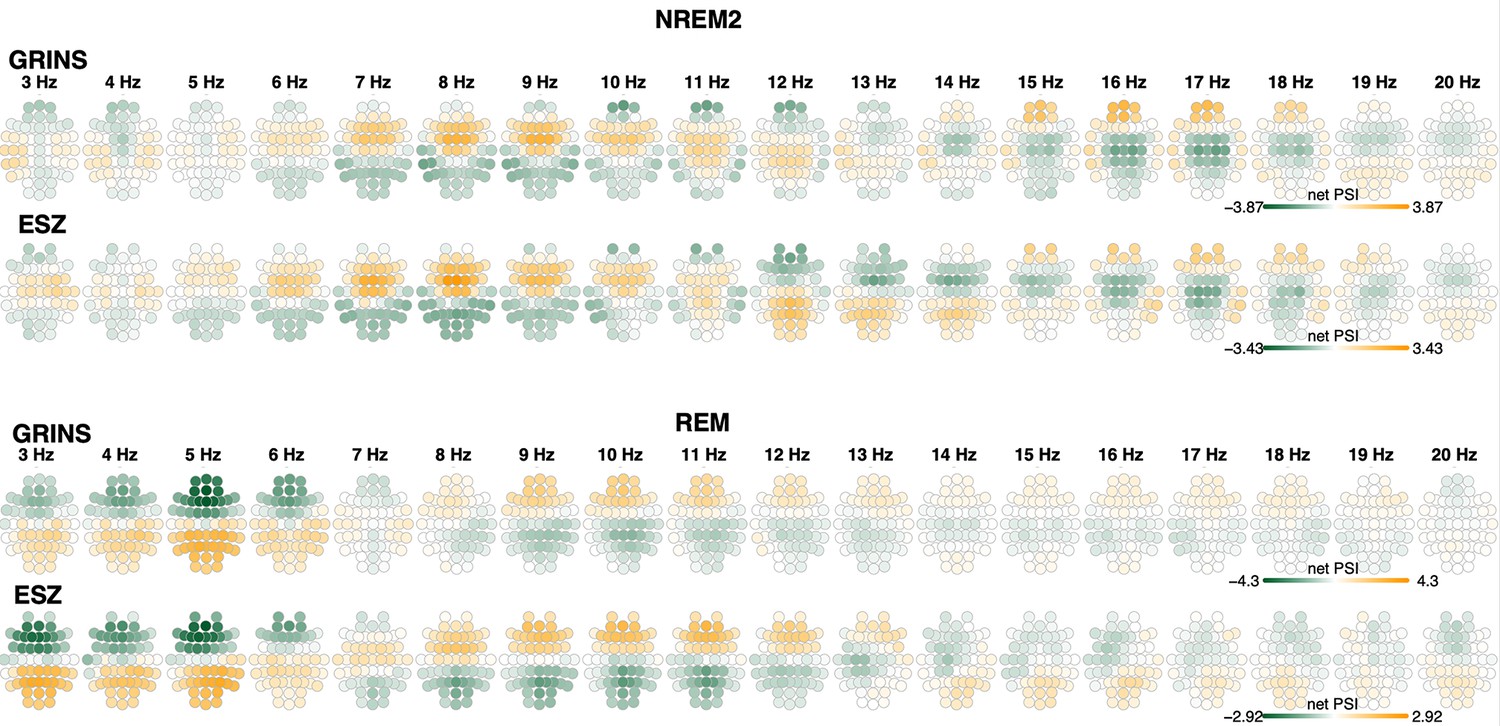
Net phase slope index (PSI) during N2 and REM in control subjects in GRINS and ESZ sample.
Top two rows illustrate net PSI values during N2 for each frequency bin (center frequency varied from 3 to 20 Hz), with values averaged over the GRINS CTR group and the ESZ CTR group. For contrast, the bottom two rows illustrate the equivalent net PSI metrics during REM.
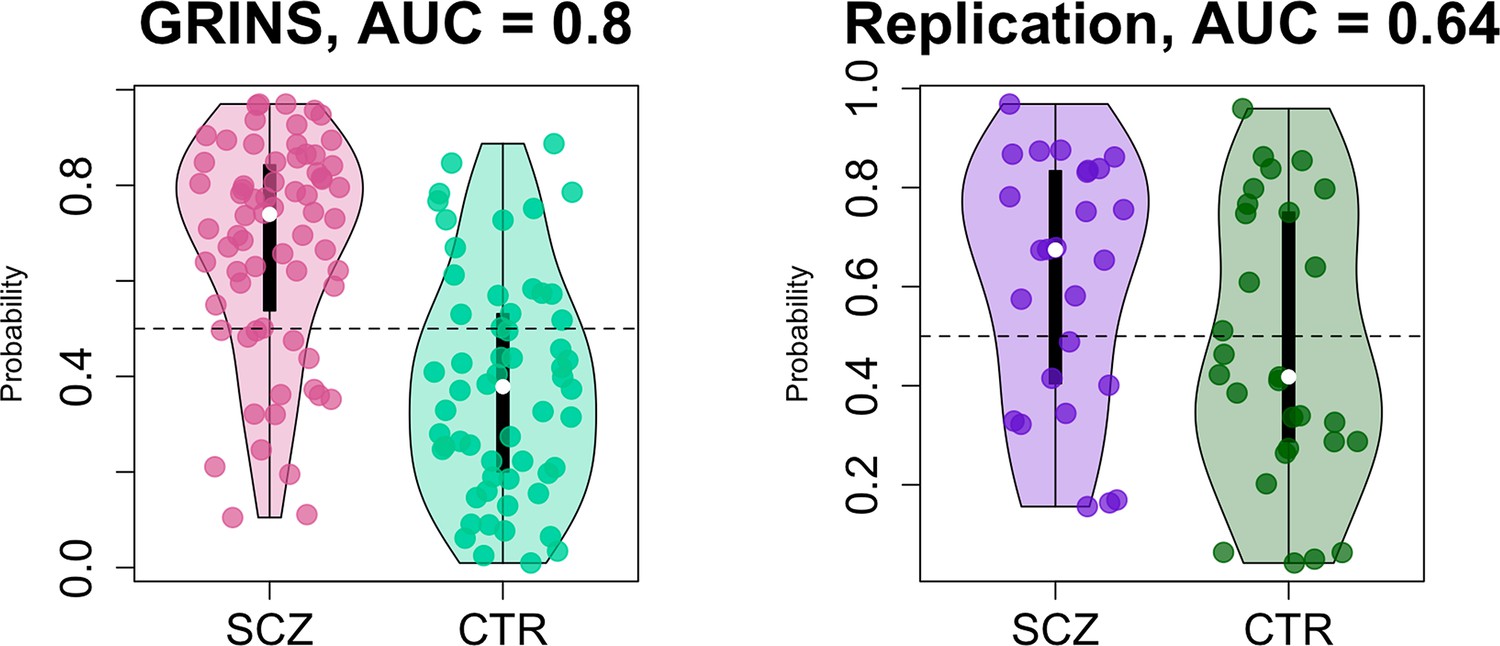
Figure 10 with 1 supplement
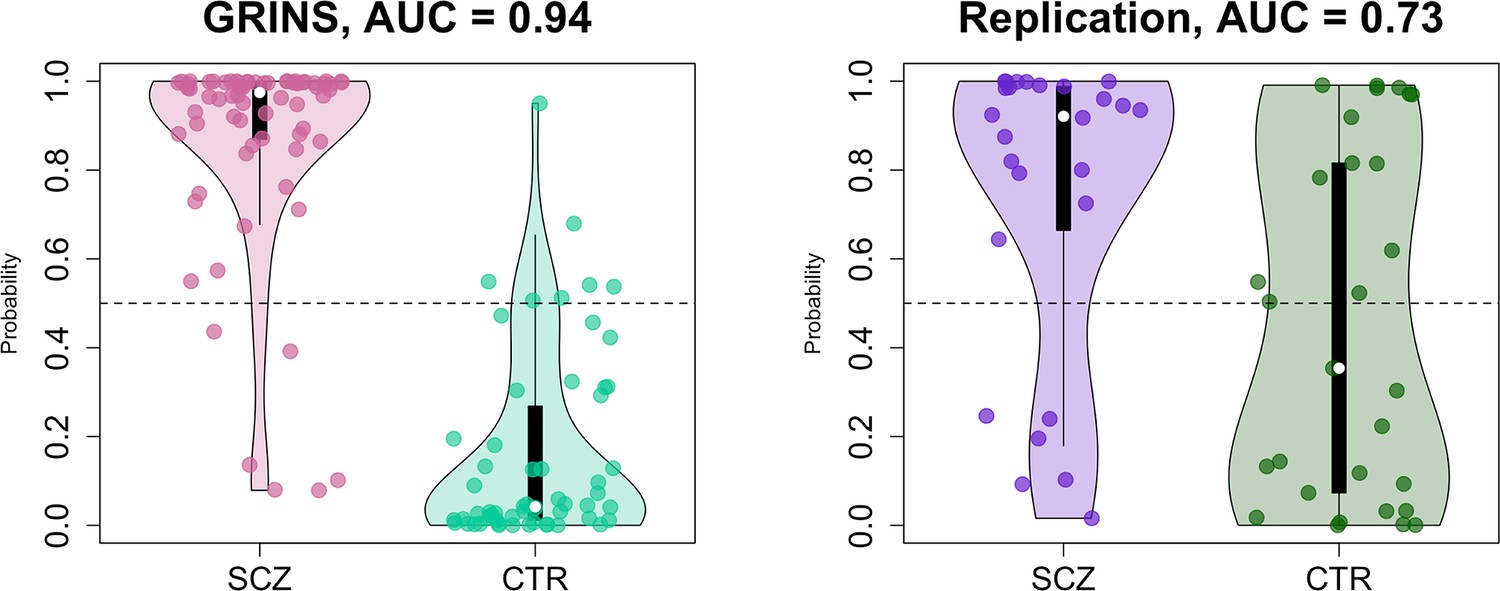
Predicting case/control status based on the sleep electroencephalogram (EEG): model building in GRINS and evaluation in an independent target sample.
Two violin plots on the left illustrate the logistic regression probabilities for case/control labels for GRINS (training sample, left) and ESZ (independent target sample, right) using principal components based on spindle, slow oscillation (SO), spectral power and connectivity metrics. AUC – area under the ROC curve.
Figure 10—figure supplement 1
Schizophrenia (SCZ)/CTR prediction based on slow spindle (SS) density at P7 and fast spindle (FS) density at FC2.
Two violin plots the logistic regression probabilities for case/control labels for GRINS (training sample, left) and ESZ (independent target sample, right) using SS density at P7 and FS density at FC2 – channels with the largest effect sizes of group differences. AUC – area under the ROC curve.
Author response image 1

Author response image 2
Author response image 3
Tables
Table 1
Sample description.
| Sample characteristics | SCZ | CTR | |
|---|---|---|---|
| Sample size | 72 | 58 | |
| Sex, females (%) | 25 (19%) | 22 (17%) | |
| Age, years | 35 ± 7* | 32 ± 6.3 | |
| Maternal education, individuals with higher than middle school education (%) | 30 (23%) | 14 (11%) | |
| Paternal education, individuals with higher than middle school education (%) | 31 (24%) | 22 (17%) | |
| Positive scale | 15 ± 5.8 (mild) | ||
| PANSS | Negative scale | 16 ± 5.7 (mild) | |
| General scale | 33 ± 9 (mild) | ||
| Duration of SCZ, years | 11 ± 6.9 | ||
| CPZ equivalent antipsychotic dose, mg | 395 ± 222.9 | ||
| Sleep macrostructure parameters | |||
| Total time in bed, min (TIB) | 532 ± 55.7 ‡ | 467 ± 44.5 | |
| Total sleep time, min (TST) | 378 ± 95.1 | 382 ± 63.1 | |
| Sleep latency, min | 50 ± 40.1 ‡ | 24 ± 27.3 | |
| Wake after sleep onset, min | 65 ± 44.1 | 49 ± 34.4 | |
| Sleep efficiency (TST/TIB) | 73 ± 14.1† | 82 ± 10.9 | |
| Sleep efficiency (TST/sleep onset-sleep offset period) | 85 ± 10.7 | 88 ± 8.8 | |
| Duration N1, min (%) | 42 ± 26.2 (11%) | 32 ± 17.3 (9%) | |
| Duration N2, min (%) | 186 ± 69.8 (50%*) | 204 ± 48.2 (53%) | |
| Duration N3, min (%) | 76 ± 49.8 (21%) | 80 ± 31 (21%) | |
| Duration REM, min (%) | 66 ± 37.6 (17%) | 65 ± 25.1 (17%) | |
| REM latency after sleep onset, min | 121 ± 55.2 | 115 ± 59 | |
| Number of cycles | 4 ± 1.4 | 4 ± 0.7 | |
| Cycle length, min | 99 ± 28.3 | 104 ± 21.9 | |
-
*
p<0.05.
-
†
p<0.01.
-
‡
p<0.001.
Additional files
-
Transparent reporting form
- https://cdn.elifesciences.org/articles/76211/elife-76211-transrepform1-v1.docx
-
Supplementary file 1
Group differences in EEG parameters between SCZ and CTR.
- https://cdn.elifesciences.org/articles/76211/elife-76211-supp1-v1.docx
-
Supplementary file 2
Prescribed medications and their associations with EEG metrics within the SCZ sample.
- https://cdn.elifesciences.org/articles/76211/elife-76211-supp2-v1.docx
-
Supplementary file 3
Significance of group differences between SCZ and CTR adjusted for medication.
- https://cdn.elifesciences.org/articles/76211/elife-76211-supp3-v1.docx
-
Supplementary file 4
Association between clinical variables and EEG metrics in the SCZ sample.
- https://cdn.elifesciences.org/articles/76211/elife-76211-supp4-v1.docx
-
Supplementary file 5
Demographic characteristics of the independent samples.
- https://cdn.elifesciences.org/articles/76211/elife-76211-supp5-v1.docx
-
Supplementary file 6
Replication analysis for spindle, slow oscillation and coupling metrics.
- https://cdn.elifesciences.org/articles/76211/elife-76211-supp6-v1.docx
Download links
A two-part list of links to download the article, or parts of the article, in various formats.
Downloads (link to download the article as PDF)
Open citations (links to open the citations from this article in various online reference manager services)
Cite this article (links to download the citations from this article in formats compatible with various reference manager tools)
Non-rapid eye movement sleep and wake neurophysiology in schizophrenia
eLife 11:e76211.
https://doi.org/10.7554/eLife.76211


