Unrestrained growth of correctly oriented microtubules instructs axonal microtubule orientation
- Department of Physiology, Development and Neuroscience, University of Cambridge, United Kingdom
- DeepMirror, United Kingdom
- Institute of Biomedical and Oral Research, and the Fritz Haber Center for Molecular Dynamics, Hebrew University of Jerusalem, Israel
- Institute for Medical Physics, Friedrich-Alexander-Universität Erlangen-Nürnberg, Germany
- Max-Planck-Zentrum für Physik und Medizin, Germany
Figures
Figure 1 with 1 supplement
Axonal microtubule (MT) orientation increases over time and MT growth is enhanced at axon tips.
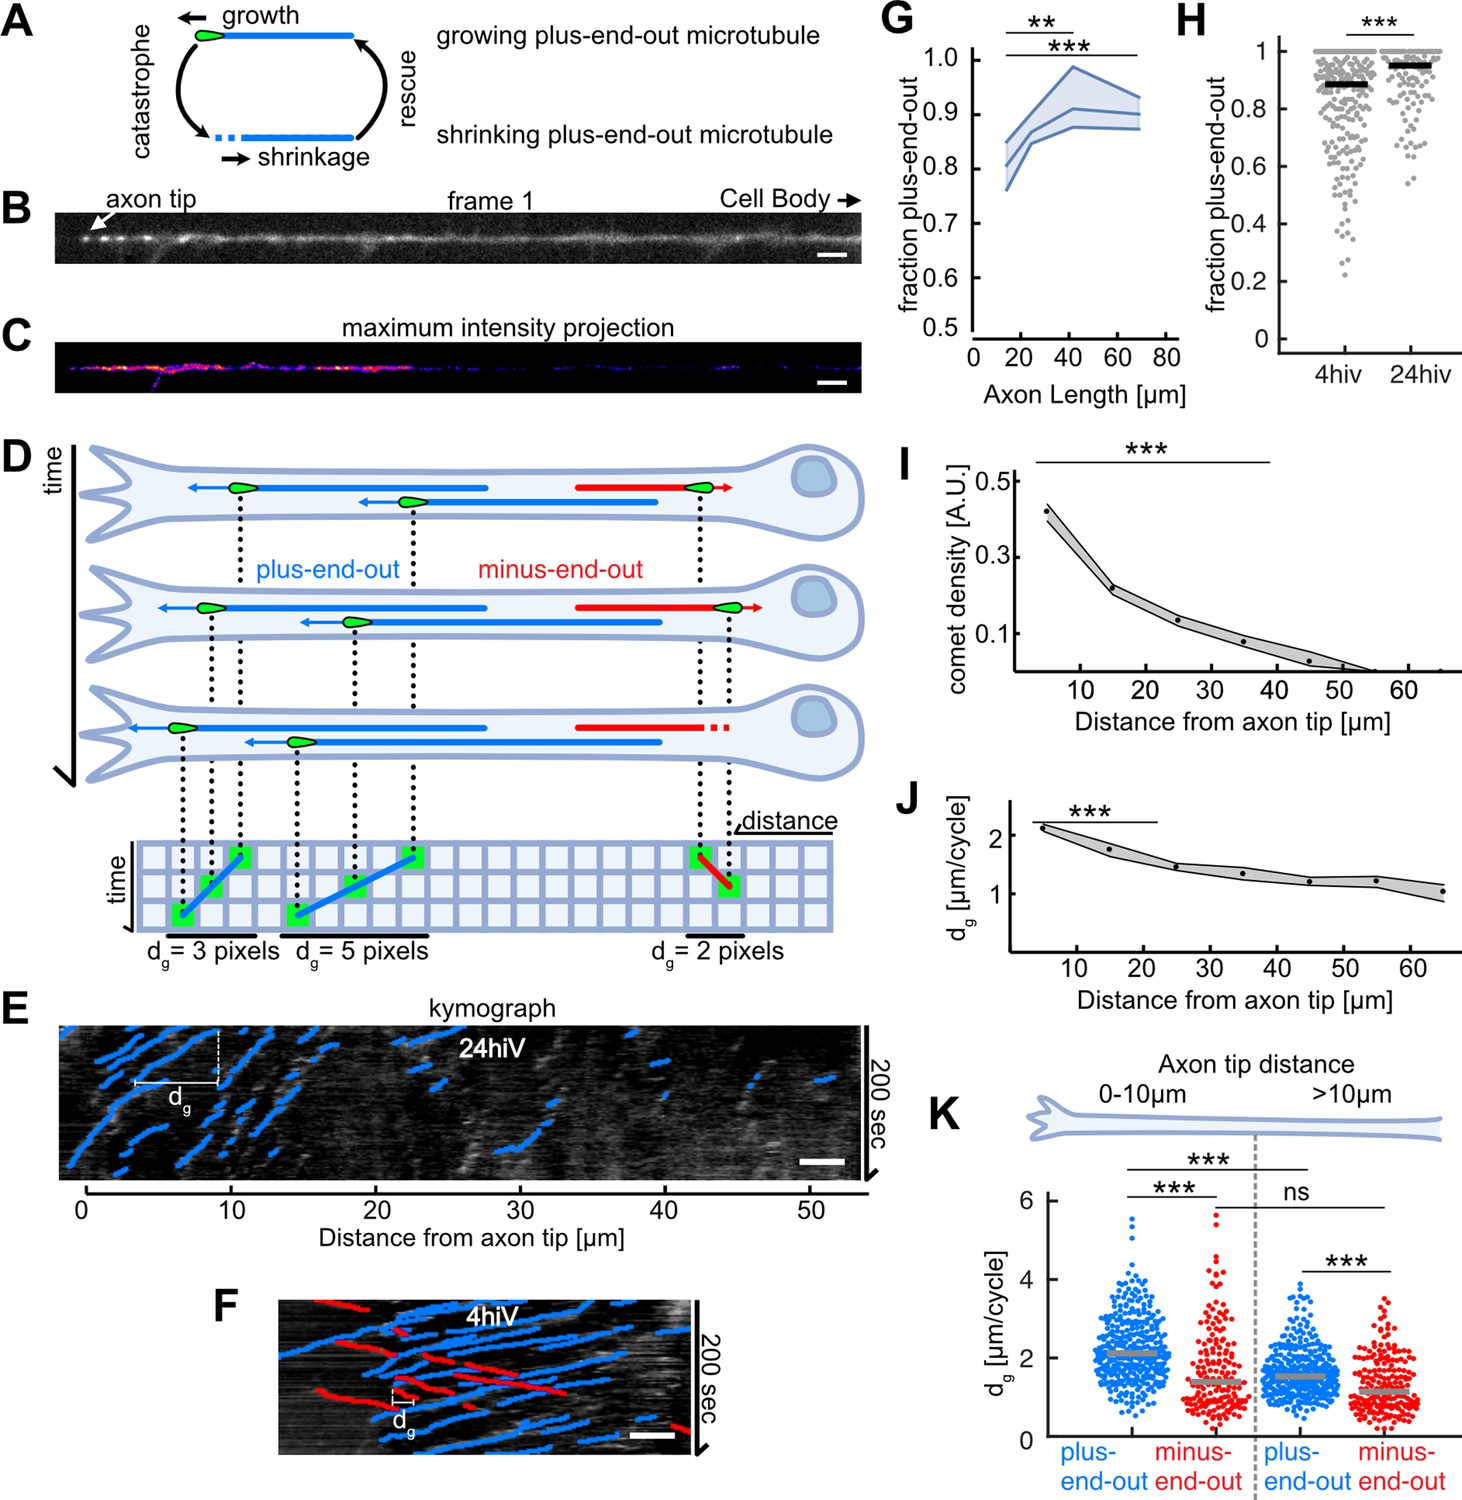
(A) Schematic depicting the MT growth and shrinkage cycle. MTs grow until they undergo a catastrophe, which initiates MT shrinkage, and they start growing again after a rescue event. During growth (but not during shrinkage), EB1 localizes to MT tips. (B) First frame of a live cell imaging movie of axonal EB1-GFP dynamics. Bright dots represent individual EB1-GFP puncta, which label growing MT plus-ends. (C) Maximum intensity projection of a 200-s-long movie depicting EB1-GFP dynamics in a Drosophila melanogaster axon. EB1-GFP density is increased towards the tip. (D) Schematic showing how EB1-GFP live imaging movies were visualized and analysed using kymographs. The growing tips of plus-end-out MTs (blue) and minus-end-out MTs (red) were fluorescently labelled with EB1-GFP (green tear drop shaped ‘comets’). The same axon is shown at three different time points; MTs grow at their plus-end, where EB1-GFP is located. The axonal intensity profiles of all time points are plotted underneath each other, resulting in a space-time grid called ‘kymograph’. Connecting puncta between consecutive kymograph lines with blue/red lines yields the overall displacement dg for individual MT growth events. Note that the red minus-end-out MT stops growing in the second frame and shrinks in the third frame (E) Kymograph of an axon 24 hr post plating showing EB1-GFP dynamics analysed with KymoButler (Jakobs et al., 2019). Lines with a positive slope (blue, left to right upwards) are MTs growing with their plus-end towards the axon tip, lines with a negative slope (red, left to right downwards) are MTs growing away from the tip. Horizontal bars indicate the growth lengths (dg) for individual MT growth cycles. (F) Kymographs of axonal processes expressing EB1-GFP analysed with KymoButler 4 hr post plating (G) MT orientation as a function of axon length. Longer axons exhibit a more pronounced plus-end-out MT orientation (p<10–5, Kruskal-Wallis test, **p<0.01, ***p<0.001 for pairwise comparisons, Dunn-Sidak post hoc test). (H) MT orientation at 4 and 24 hiv (hours in vitro). MT orientation increased with time (p<10–4, Wilcoxon rank sum test). (I) EB1-GFP comet density as a function of the distance from the axon tip. Most MT polymerization occurred near the advancing axon tip. (N Axons = 353, 20 biological replicates from 20 different experiment days, p<10–20, Kruskal-Wallis test, p<10–7 for pairwise comparisons between bins 1–2, 3, and 4, Dunn-Sidak post hoc test). Shown are median±95% confidence interval. (J) Added length per MT growth cycle dg as a function of distance from the axon tip. MTs grew longer in the vicinity of the axon tip (p<10–20, Kruskal-Wallis test, p<10–7 for pairwise comparisons of either bin 1 or 2 with any other bin, Dunn-Sidak post hoc test). (K) dg for plus-end-out (blue) and minus-end-out (red) MTs grouped for growth in the distalmost 10 µm of the axon tip, and further away than 10 µm from the axon tip. Each dot represents the average of one axon in the respective region, grey lines indicate median values. With dg 2.11 [2.04, 2.16] µm/cycle (bootstrapped median [95% confidence interval]), plus-end-out MTs near the axon tip grew significantly longer than minus-end-out MTs (dg = 1.39 [1.27, 1.50] µm/cycle) and MTs located further away from the tip (dg = 1.53 [1.47, 1.59] µm/cycle, plus-end-out, dg = 1.16 [1.03, 1.33] µm/cycle, minus-end-out) (N=346 (plus-end-out close to tip), 343 (plus-end-out away from tip), 177 (minus-end-out close to tip), 194 (minus-end-out away from tip) axons), 20 biological replicates; p<10–30, Kruskal-Wallis test followed by Dunn-Sidak post hoc test; ***p<10–4. Scale bars: 3 µm.
Figure 1—figure supplement 1
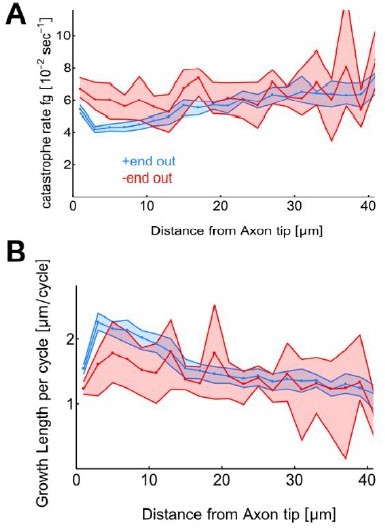
EB1 dynamics as a function of the distance from the axon tip.
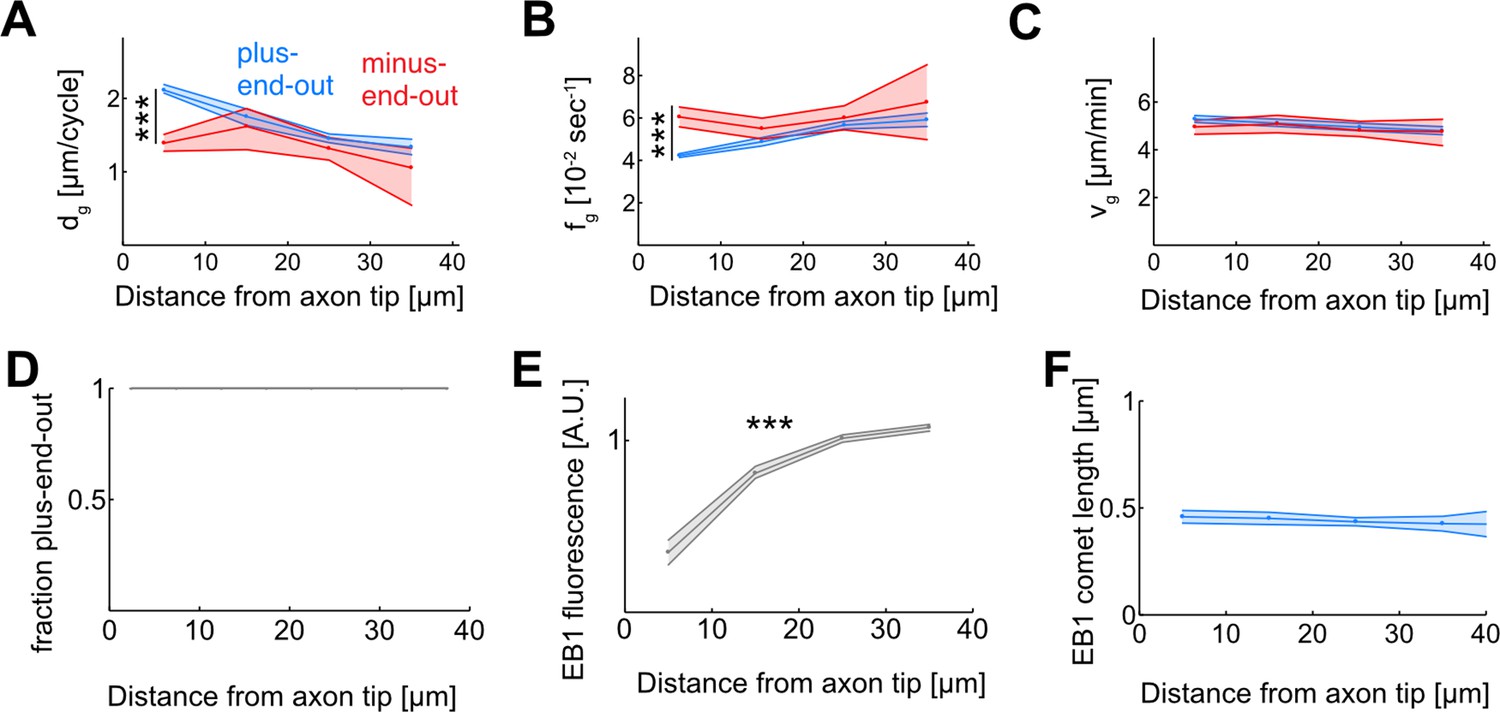
(A–C) Microtubule (MT) growth. (A) Added MT length per growth cycle, dg, (B) Catastrophe frequency, fg = 1/tg, and (C) growth velocity, vg, for plus-end-out (blue) and minus-end-out (red) MTs. While MT growth velocities are largely independent of MT orientation and localization along the axon (p<0.003; Kruskal-Wallis test, only bins 1 and 4 of plus-end-out growth velocities are significantly different) (C), plus-end-out MTs near the axon tip undergo catastrophes less frequently than minus-end-out MTs and MTs further away from the tip (p<10–37; Kruskal-Wallis test) (B). The resulting longer growth times tg lead to enhanced growth of these MTs in each growth cycle (p<10–37; Kruskal-Wallis test) (A). (D) Median MT orientation as a function of distance from the axon tip. Lines represent 30–70% quantiles (all 1). No changes are observed along the axon. (E) Median EB1-GFP fluorescence intensity normalized by median fluorescence as a function of distance from the axon tip. EB1 fluorescence decreases towards the axon tip. Lines represent median±95% confidence interval. All bins are significantly different and median fluorescence increases away from the axon tip (p<10–100; Kruskal-Wallis test, ***: p<0.001). (F) Median EB1 comet length as a function of the distance from the axon tip (p=0.25; Kruskal-Wallis test) ***: p<0.001. EB1 comets have similar lengths along the axon.
Figure 2
Microtubule (MT) length depends on added length per growth cycle.
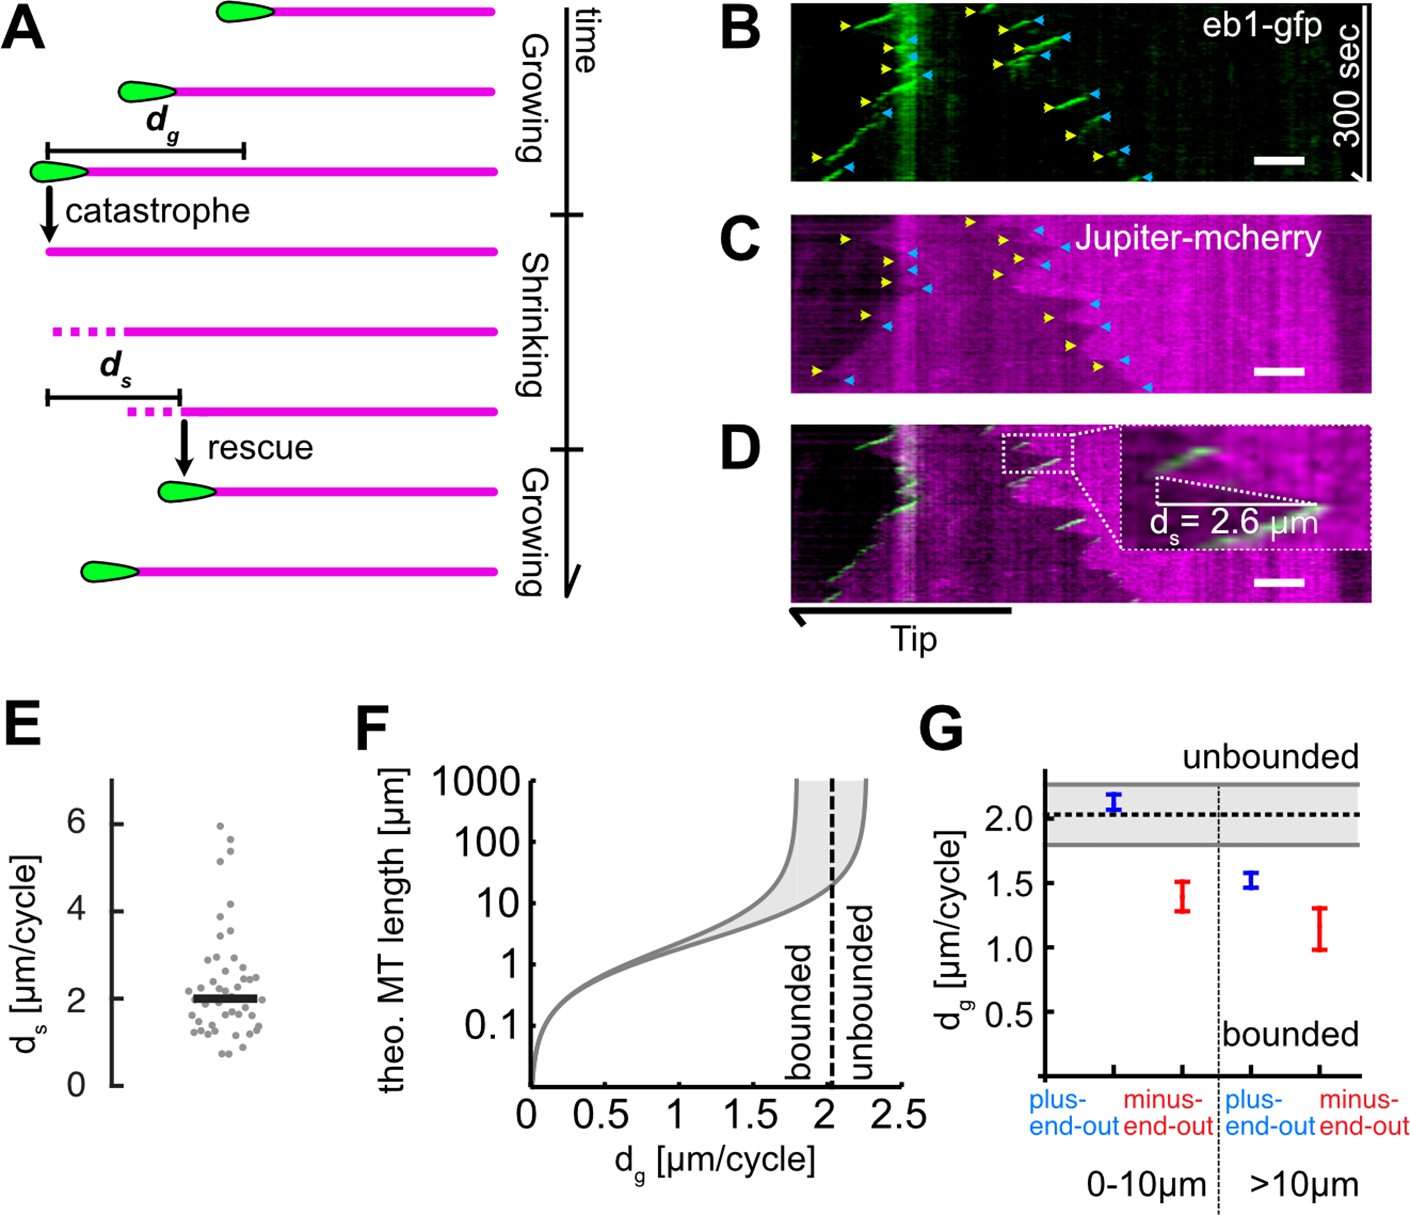
(A) Schematic highlighting the assumptions of our two-state master equation model. MTs were assumed to occupy either a growing or shrinking state. During a growth cycle, the average MT length increases by dg, during a shrinkage cycle, the MT length decreases by ds. Additionally, MTs were able to stochastically switch between the two states as shown in Figure 1A. (B–D) Kymographs from a Drosophila melanogaster axon that expressed (B) EB1-GFP (green) and (C) Jupiter-mCherry, a tubulin label (magenta). Individual MT shrinkage events, visible as (C) fluorescent edges and (D) dashed white lines in the kymograph, yielded MT shrinkage lengths per cycle ds. Yellow and blue arrow heads in (B) and (C) indicate start and end points of an individual shrinkage event, respectively, and the inset in (D) highlights an individual shrinkage event. Scale bars: 3 µm. (E) Average ds values for N=47 axons (3 biological replicates; median: 2.03 [1.80, 2.26] µm) (bootstrapped median [95% confidence]). (F) Plot of the estimated overall MT length lMT as a function of dg. The two solid black curves indicate the lower and upper bounds of the average MT lengths for a given dg with ds = 1.80 or 2.26 µm. One can separate two regimes, ‘unbounded’ and ‘bounded’ growth, separated by the dashed grey line. (G) Plot of dg as a function of MT orientation and localization showing median and 95% confidence intervals. Plus-end-out MTs close to the tip were considerably more likely to exhibit unbounded growth than plus-end-out MTs further away from the tip and minus-end-out MTs.
Figure 3
Decreasing microtubule (MT) growth leads to decreased axonal MT orientation.
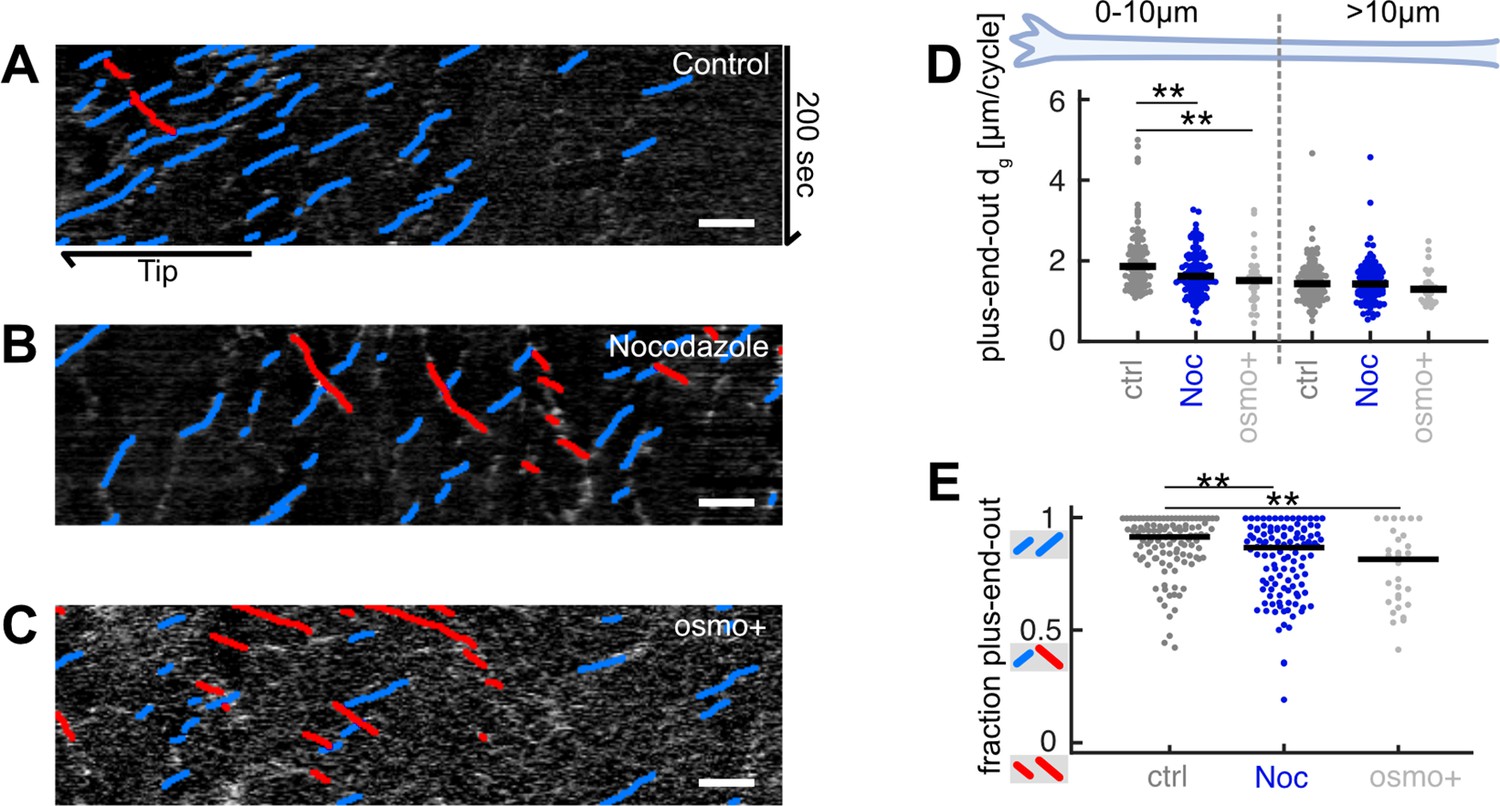
(A–C) Representative kymographs analysed with KymoButler (Jakobs et al., 2019) from axonal processes treated with (A) 0.025% DMSO (control) for 8 hr, (B) 5 µM nocodazole for 8 hr, (C) medium with increased osmolarity (‘osmo+’) for 22 hr. Growth of plus-end-out MTs is shown as blue lines, minus-end MTs are red. Scale bars = 3 µm. (D) Added MT lengths per growth cycle dg of plus-end-out MTs at the distalmost 10 µm from the axon tip and further away for control (N=107 axons from 5 biological replicates), nocodazole-treated axons (N=116 axons from 3 biological replicates), and axons cultured in osmo+medium (N=30, 2 biological replicates). At the axon tip, MT lengths increased significantly less per growth cycle in axons treated with nocodazole or osmo+media than controls (p<10–4, Kruskal-Wallis test, **p<0.01 for pairwise comparisons, Dunn-Sidak post hoc test). (E) The fraction of plus-end-out MTs in the different groups. MT orientation was calculated by counting all MTs that grew away from the cell body (blue lines in kymographs) and dividing them by all growing MTs (blue and red) along the whole axons. This way, a kymograph with only blue lines gives a value of 1 while an equal number of blue and red lines yield a value of 0.5. MTs in axons treated with nocodazole or osmo+media were significantly less uniformly oriented than those in the control group, that is, they contained a larger fraction of MTs pointing with their plus-ends toward the cell body (red lines in (A–C)) (p<10–4, Kruskal-Wallis test, **p<10–2 for pairwise comparisons, Dunn-Sidak post hoc test).
Figure 4 with 7 supplements

Abrogation of p150 function decreases microtubule (MT) growth and axonal MT orientation.
(A–B) Tubulin (top) and normalized p150 (bottom) immunostaining of cultured Drosophila melanogaster larvae axonal processes of (A) controls and (B) neurons expressing elav-gal4 UAS-driven p150-RNAi. Large p150 puncta were found clustered around the axon tip (arrow) in controls (A) but not in p150-RNAi axons (B). Scale bars = 2 µm (C) Normalized p150 fluorescence intensity as a function of distance from the axon tip for wild-type axons (N=83, 2 biological replicates) and p150-RNAi axons (N=111, 2 biological replicates). Lines represent median±95% confidence intervals for wild-type (grey) and p150-RNAi (magenta). p150 fluorescence intensities changed along the axon (p<10–70; Kruskal-Wallis test). In wild-type axons, p150 was enriched at the axon tip (*p<0.05 between bin 1 and bin 3 or 4; pairwise comparisons with Dunn-Sidak post hoc test), but not in p150-RNAi expressing axons (p>0.05 for all pairwise comparisons). Overall, p150 expression levels were diminished in p150-RNAi axons compared to wild-type (***p<10–7 for any pairwise comparison between conditions). (D–F) KymoButler output for kymographs of EB1-GFP expressed in (D) a wild-type axon, (E) an axon expressing p150-RNAi, and (F) an axon in a p1501/+ mutant background. Scale bars = 3 µm. Blue/red lines represent MTs with plus/minus-end-out orientation, respectively. (G) Plus-end-out MT added length per growth cycle dg for wild-type (N=85, 9 biological replicates), p150-RNAi (N=34, 3 biological replicates), and p1501/+ (N=83, 6 biological replicates). At the axon tip, MT growth lengths were significantly decreased in both p150-RNAi and p1501 conditions compared to controls (p<10–9, Kruskal-Wallis test, ***p<0.001, *p<0.05, Dunn-Sidak post hoc test). (H) MT orientation along the whole axon for wild-type, p150-RNAi, and p1501/+. MTs were less uniformly oriented in both p150-RNAi and p1501 axons (p<10–9, Kruskal-Wallis test, ***p<10–5 for pairwise comparisons with Dunn-Sidak post hoc test). Overall, axonal MT orientation was decreased after chemical, physical, and genetic perturbations of MT growth.
Figure 4—figure supplement 1
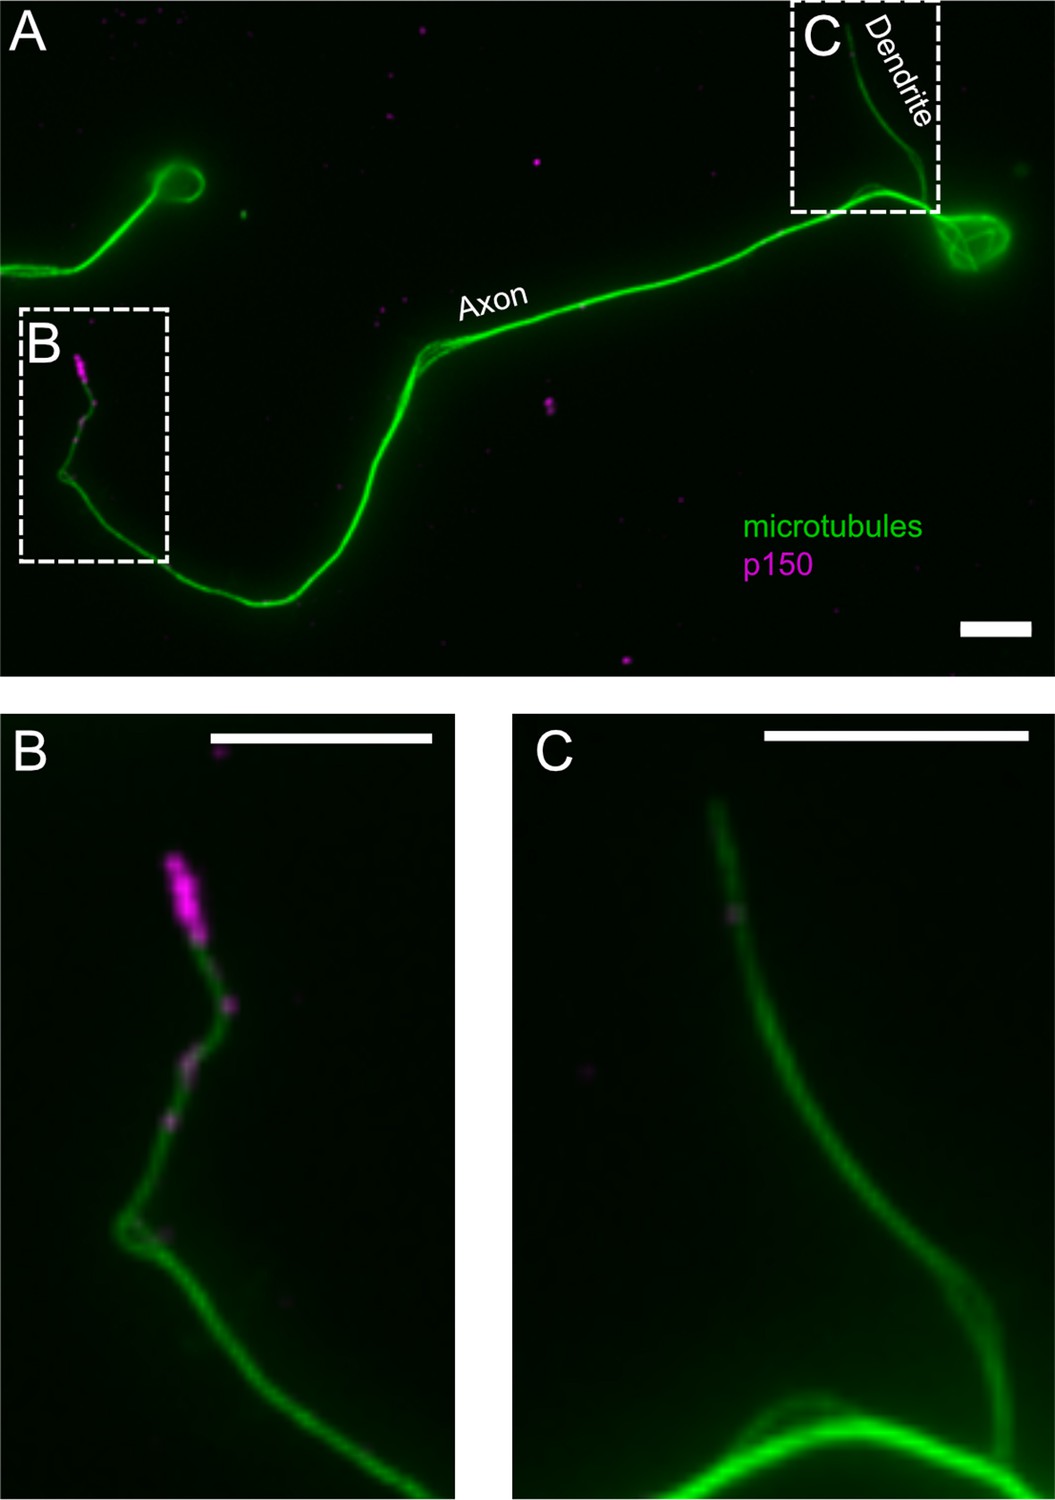
Normalized p150 immunostaining in axonal and dendritic processes.
(A) Representative fluorescence image of a neuron stained for tubulin (green) and normalized p150 (magenta). (B and C) Enlarged images of (B) the axonal tip and (C) the dendritic tip found in the regions defined by the dashed regions in (A). The dendritic process exhibits comparably low levels of p150 if compared to the axonal tip. Scale bars = 5 µm.
Figure 4—figure supplement 2
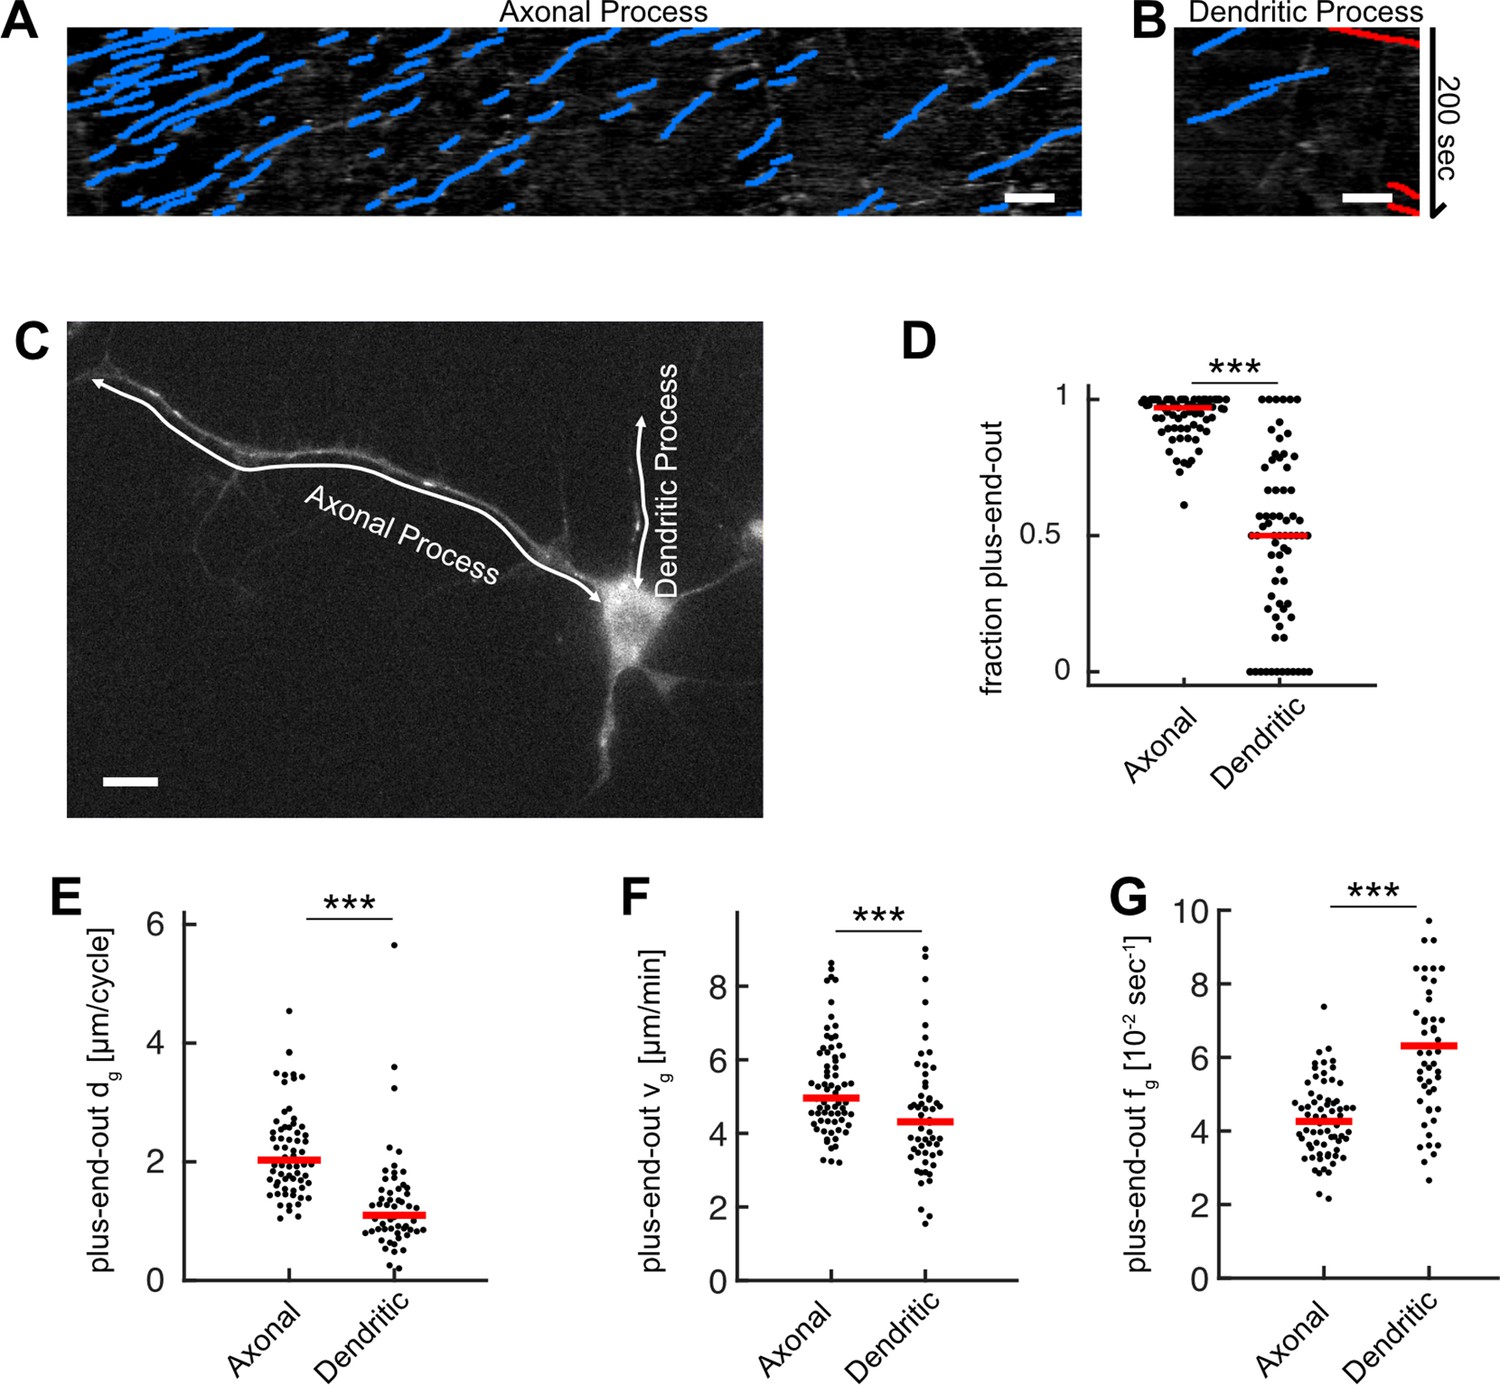
Microtubule (MT) growth and orientation is decreased in dendritic processes.
(A, B) Kymographs for (A) the axonal and (B) the dendritic process shown in (C). (C) Drosophila melanogaster larva neuron expressing EB1-GFP with an axonal and several dendritic processes. White arrows represent the stationary paths for the kymographs shown in (A–B). (D) MT orientation, that is, the fraction of plus-end-out MTs, for axonal and dendritic processes. Most MTs in axonal but not in dendritic processes have their plus-ends oriented away from the cell body (N=69, 20 biological replicates; p<10–15, Wilcoxon rank sum test). (E) Growth length per cycle dg for plus-end-out MTs at the distalmost 10 µm of the axonal or dendritic tips. Black dots: averages for one cell; only cells possessing at least one axonal and one dendritic process (one randomized dendritic process was selected per neuron) were analysed. MTs in axonal processes grew longer than those in dendritic processes (p<10–8, Wilcoxon rank sum test). (F) MT growth velocities vg in the distalmost 10 µm of the axonal or dendritic tips (p<10–8, Wilcoxon rank sum test). (G) MT catastrophe frequencies fg in the distalmost 10 µm of the axonal or dendritic tips. Catastrophe frequencies are increased in dendritic processes compared to axonal ones (p<10–8, Wilcoxon rank sum test). Scale bars: 3 µm.
Figure 4—figure supplement 3
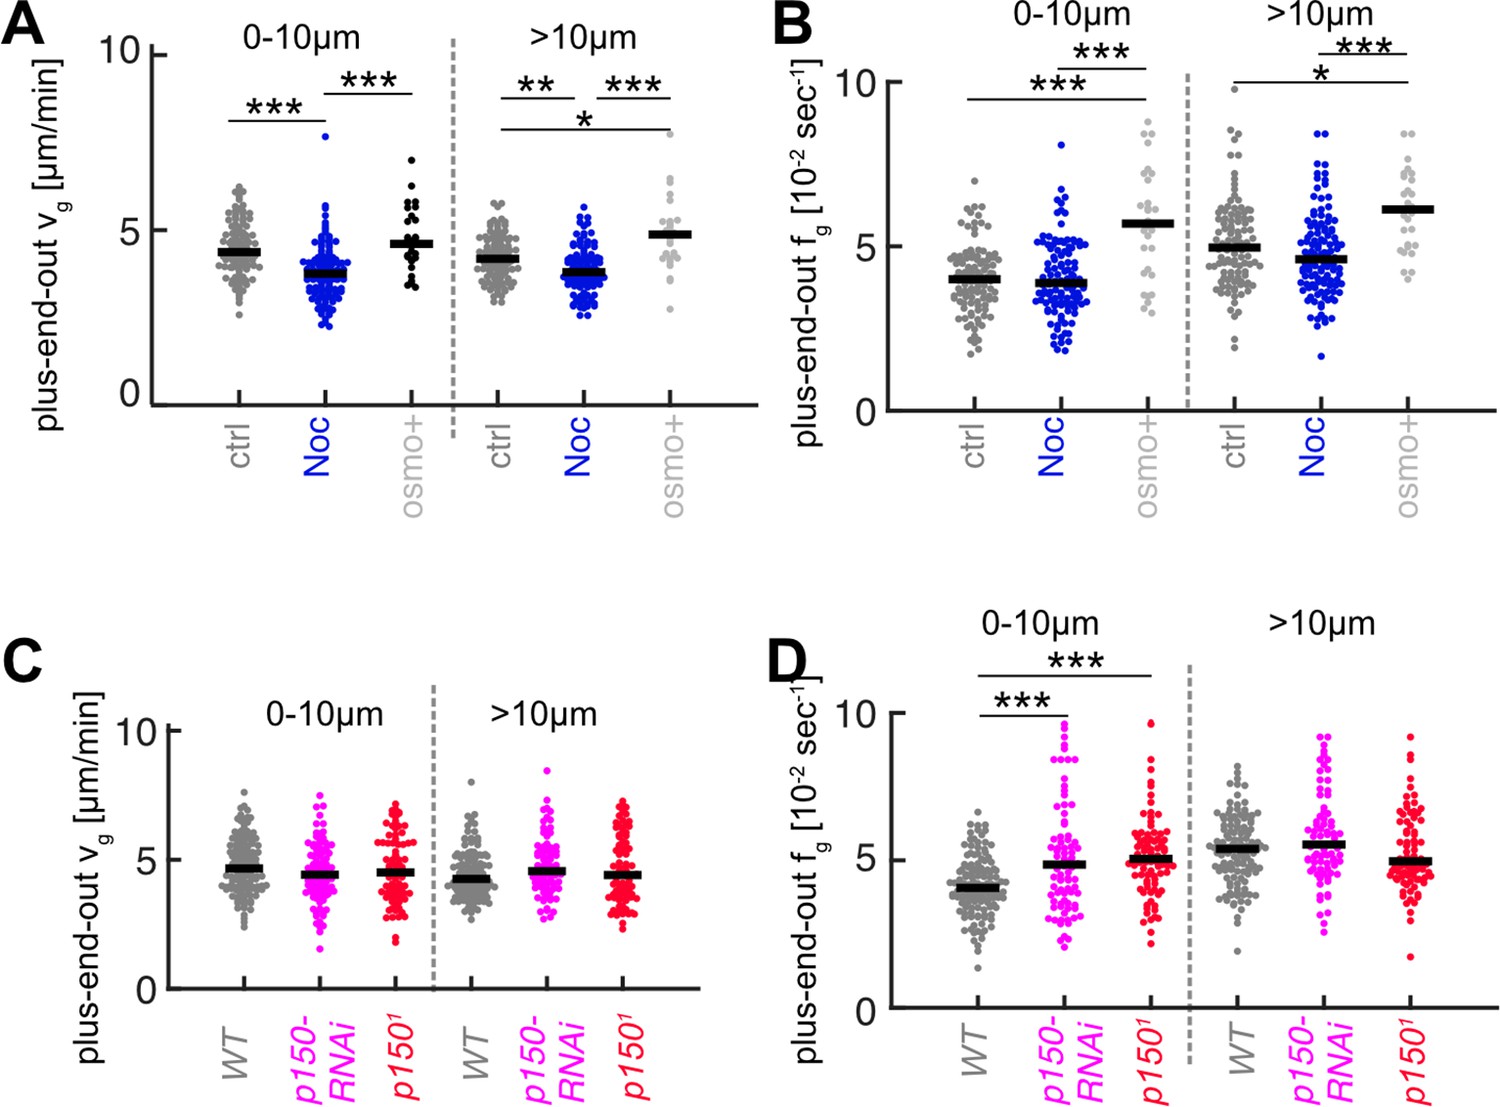
Microtubule (MT) growth parameters for nocodazole and osmo+ treatments (A, B) and p150 knockdown (C, D).
Plots show growth velocities vg (A,C) and catastrophe frequencies fg (B,D) for plus-end-out MTs within 10 µm of the axon tip and further away for the experiments shown in Figure 3 (***=p < 0.001, *=p < 0.05, Dunn-Sidak post hoc).
Figure 4—figure supplement 4
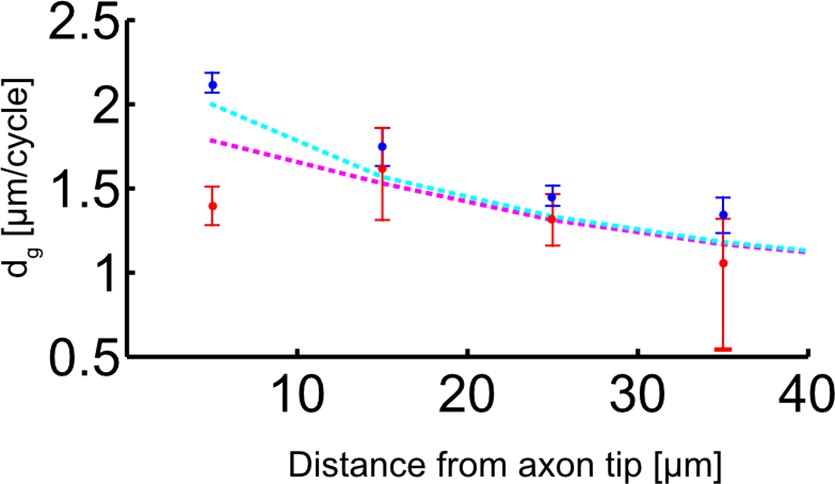
The relationship between p150 protein concentration and the added length per microtubule (MT) growth cycle.
Dots with error bars: experimental data of added length per MT growth cycle dg as a function of distance from the axon tip is shown in blue (plus-end-out) and red (minus-end-out) (median±95% confidence, same plot as in Figure 4—figure supplement 1A). Dashed lines: analytic model (see Supplemental methods: ‘Analytic model for MT growth as a function of p150 fluorescence’ for details), which assumes that dg(x)=A p150(x)α and dg plus-end-out, (x) = 0.5(dg(−dg(x)+x)+dg(x)) and dgminus-end-out, (x) = 0.5(dg(dg(x)+x)+dg(x)). The model thus results in one equation describing the average growth length per cycle, dg, for plus-end-out MTs, and in another equation describing dg for minus-end-out MTs. Both equations depend on A, α, and the measured p150 fluorescence intensity profile. We simultaneously fitted the predicted dg’s for plus-end-out and minus-end-out MTs to the experimentally determined values by varying A and α. The resulting pair of parameters was: A=0.86 and α=3.62. Our model returned a clear bifurcation between plus-end-out and minus-end-out MT growth towards the axon tip, resembling the experimental data and thus suggesting that the observed p150 gradient at the axon tip is strong enough to alter catastrophe frequencies in MTs depending on their orientation.
Figure 4—figure supplement 5
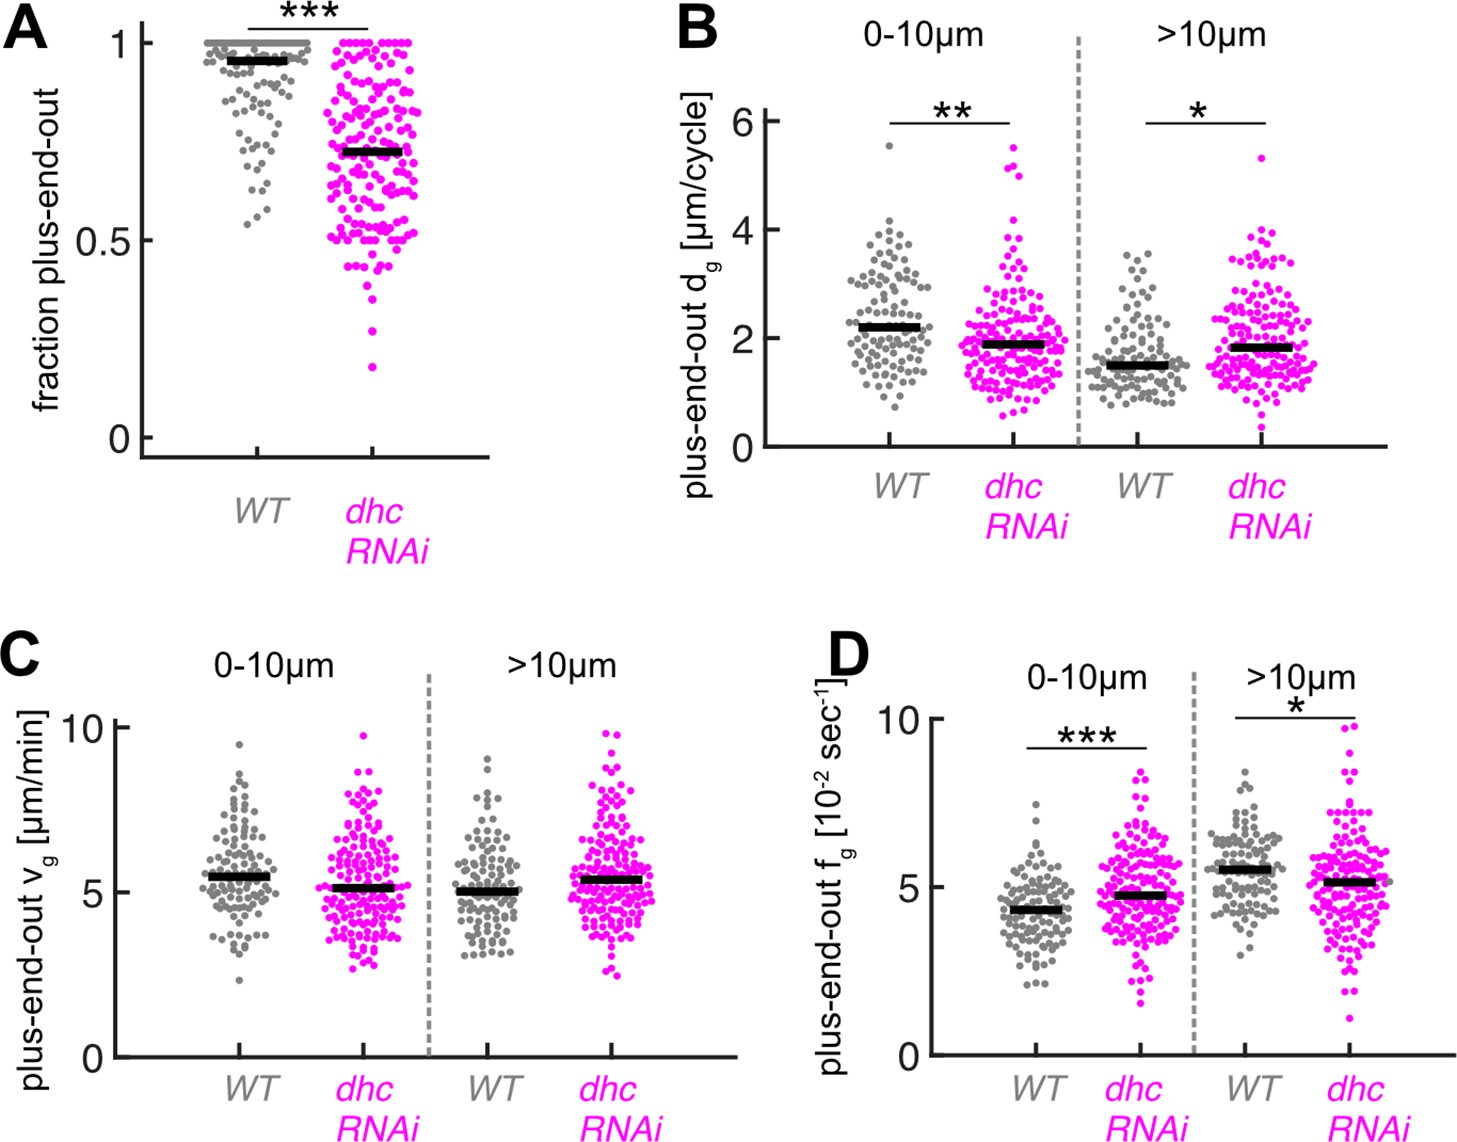
Downregulation of dynein heavy chain expression decreases microtubule (MT) orientation and plus-end-out MT growth at axon tips.
(A) MT orientation (fraction of plus-end-out MTs) for wild-type (N=111, 8 biological replicates) and dhc-RNAi (N=168, 8 biological replicates). MT orientation was significantly decreased in dhc-RNAi axons (p<10–18, Wilcoxon rank sum test, ***p<0.001). (B) Plus-end-out MT growth in wild-type and dhc-RNAi. MT growth in axons expressing dhc-RNAi was significantly decreased at the distalmost 10 µm of the axon compared to control cells and increased further away towards the cell body (p<10–8, Kruskal-Wallis test, **=p < 0.01, *=p < 0.05, Dunn-Sidak post hoc). (C) Growth velocities vg of plus-end-out MTs. No significant differences were observed between different MTs. (D) Growth time per cycle tg for plus-end-out MTs (p<10–12, Kruskal-Wallis test, ***=p < 0.001, *=p < 0.05, Dunn-Sidak post hoc). Changes in dg were caused by changes in fg.
Figure 4—figure supplement 6
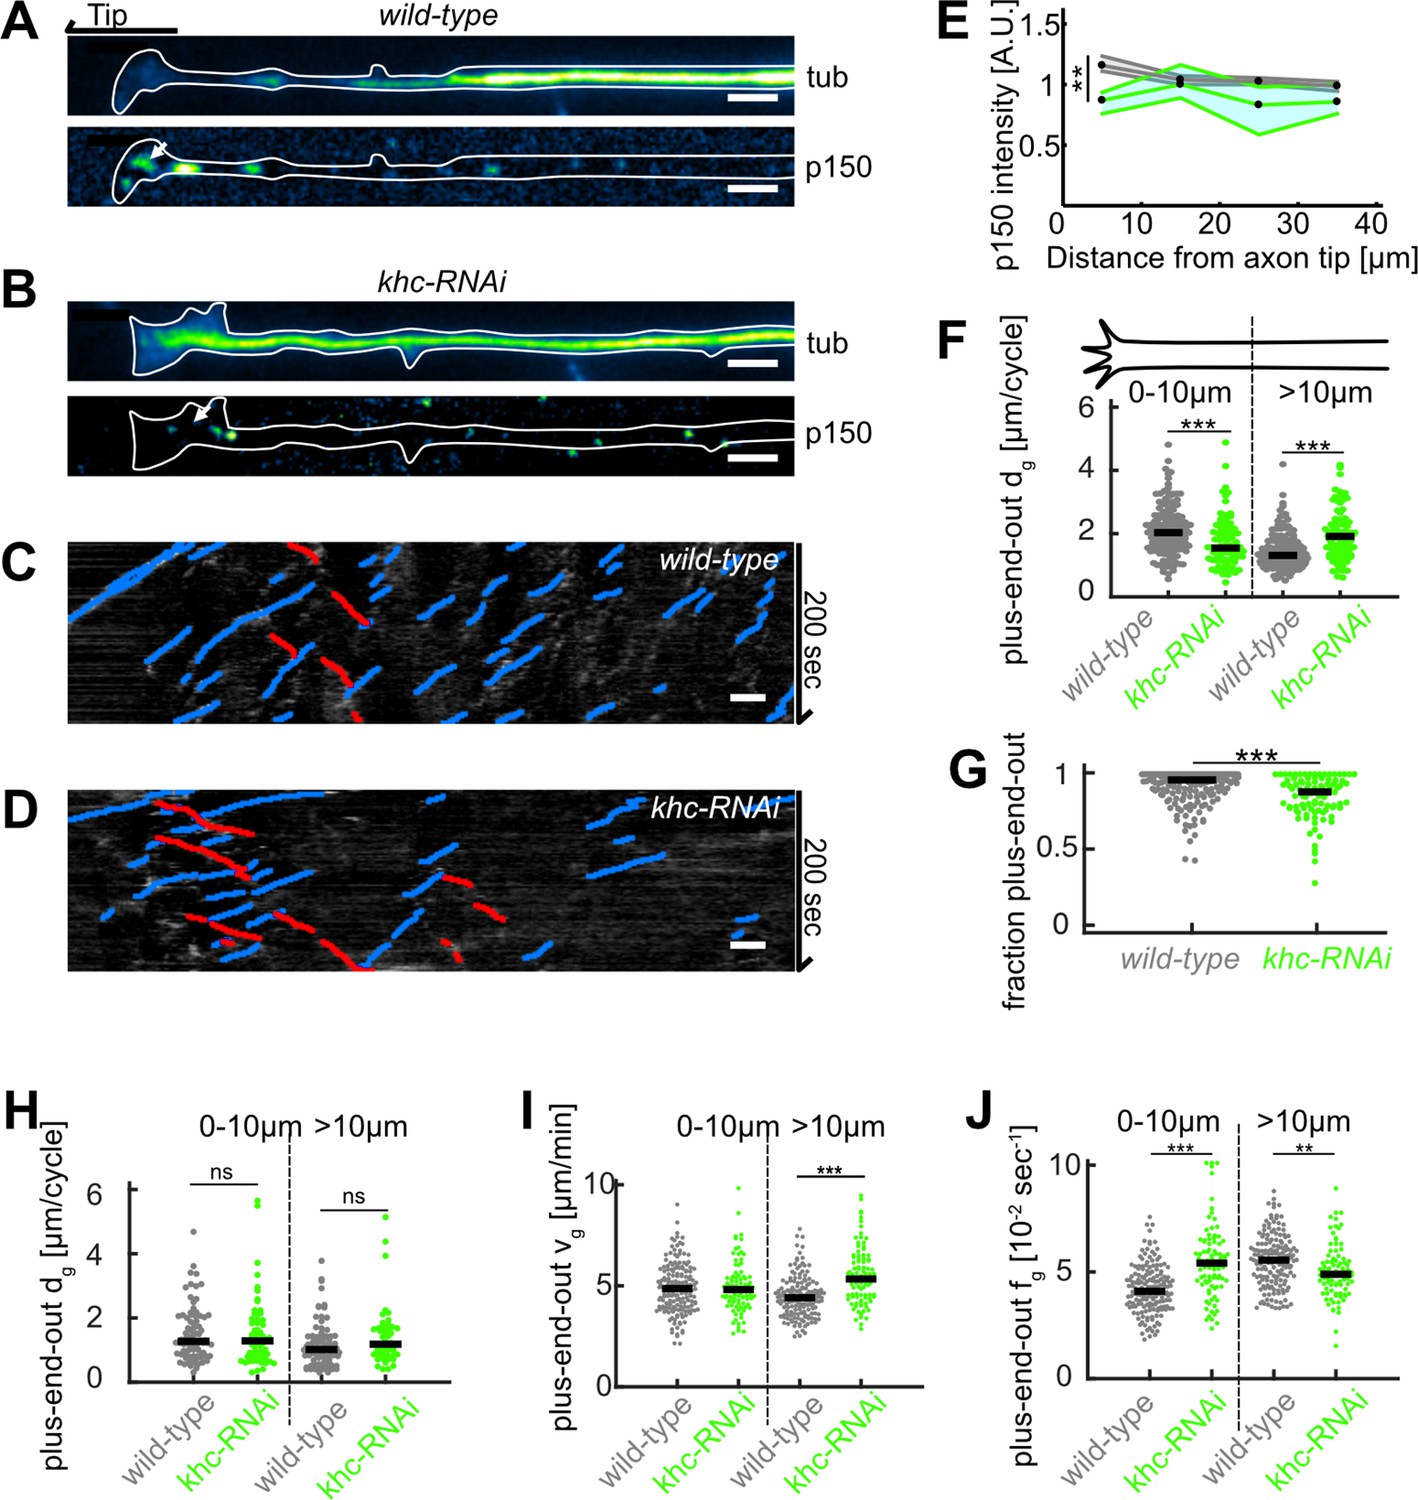
Disruption of kinesin 1 function reduces p150 concentration at axon tips and decreases microtubule (MT) orientation.
(A–B) Tubulin (top) and normalized p150 (bottom) immunostainings of cultured Drosophila melanogaster larvae axonal processes. The distal axon tip is pointing left. p150 puncta were more densely clustered around the axon tip in control cells (A) compared to axonal processes that expressed UAS-driven khc-RNAi (B). (C–D) Kymographs of EB1-GFP-expressing axons of (C) wild-type and (D) khc-RNAi-treated neurons. (E) Normalized p150 protein fluorescence as a function of distance from the axon tip for wild-type axons (N=162, 5 biological replicates, black line) and khc-RNAi axons (N=68, 2 biological replicates, green line). Lines represent median±95% confidence interval. p150 protein was less enriched in khc-RNAi axon tips (p<10–16, Kruskal-Wallis test, 25% downregulation for 0–10 µm: **p<0.01, Dunn-Sidak post hoc test). (F) Plus-end-out MT growth in wild-type (N=167, 7 biological replicates) and khc-RNAi neurons (N=91, 2 biological replicates). MT growth in axons expressing khc-RNAi was significantly decreased at the distalmost 10 µm of the axon compared to control cells. Additionally, plus-end-out MT growth of MTs further away from the tip than 10 µm was increased in khc-RNAi compared to control cells (p<10–9, Kruskal-Wallis test, ***=p < 0.001, Dunn-Sidak post hoc). We can only speculate why the distance grown by MTs further way from the axon tip was increased. It seems rather unlikely that this phenomenon can be explained by impaired dynein-based MT sliding. It is conceivable, however, that the lack of concentrated p150 in the growth cone frees up a pool of tubulin, which is now available for polymerization further away in the axon. (G) MT orientation (fraction of plus-end-out MTs) for wild-type and khc-RNAi neurons. MT orientation was significantly decreased in khc-RNAi axons (p<10–9, Kruskal-Wallis test, p<10–5, ***p<0.001, Dunn-Sidak post hoc test). (H) Minus-end-out MT lengths per cycle (p<0.05, Kruskal-Wallis test). (I) Plus-end-out MT growth velocities (p<10–23, Kruskal-Wallis test, ***=p < 0.001, Dunn-Sidak post hoc). (J) Plus-end-out MT growth times in wild-type (N=167, 7 biological replicates) and khc-RNAi neurons (N=91, 2 biological replicates) (p<10–22, Kruskal-Wallis test, ***=p < 0.001, *=p < 0.05, Dunn-Sidak post hoc). All scale bars: 2 µm.
Figure 4—figure supplement 7
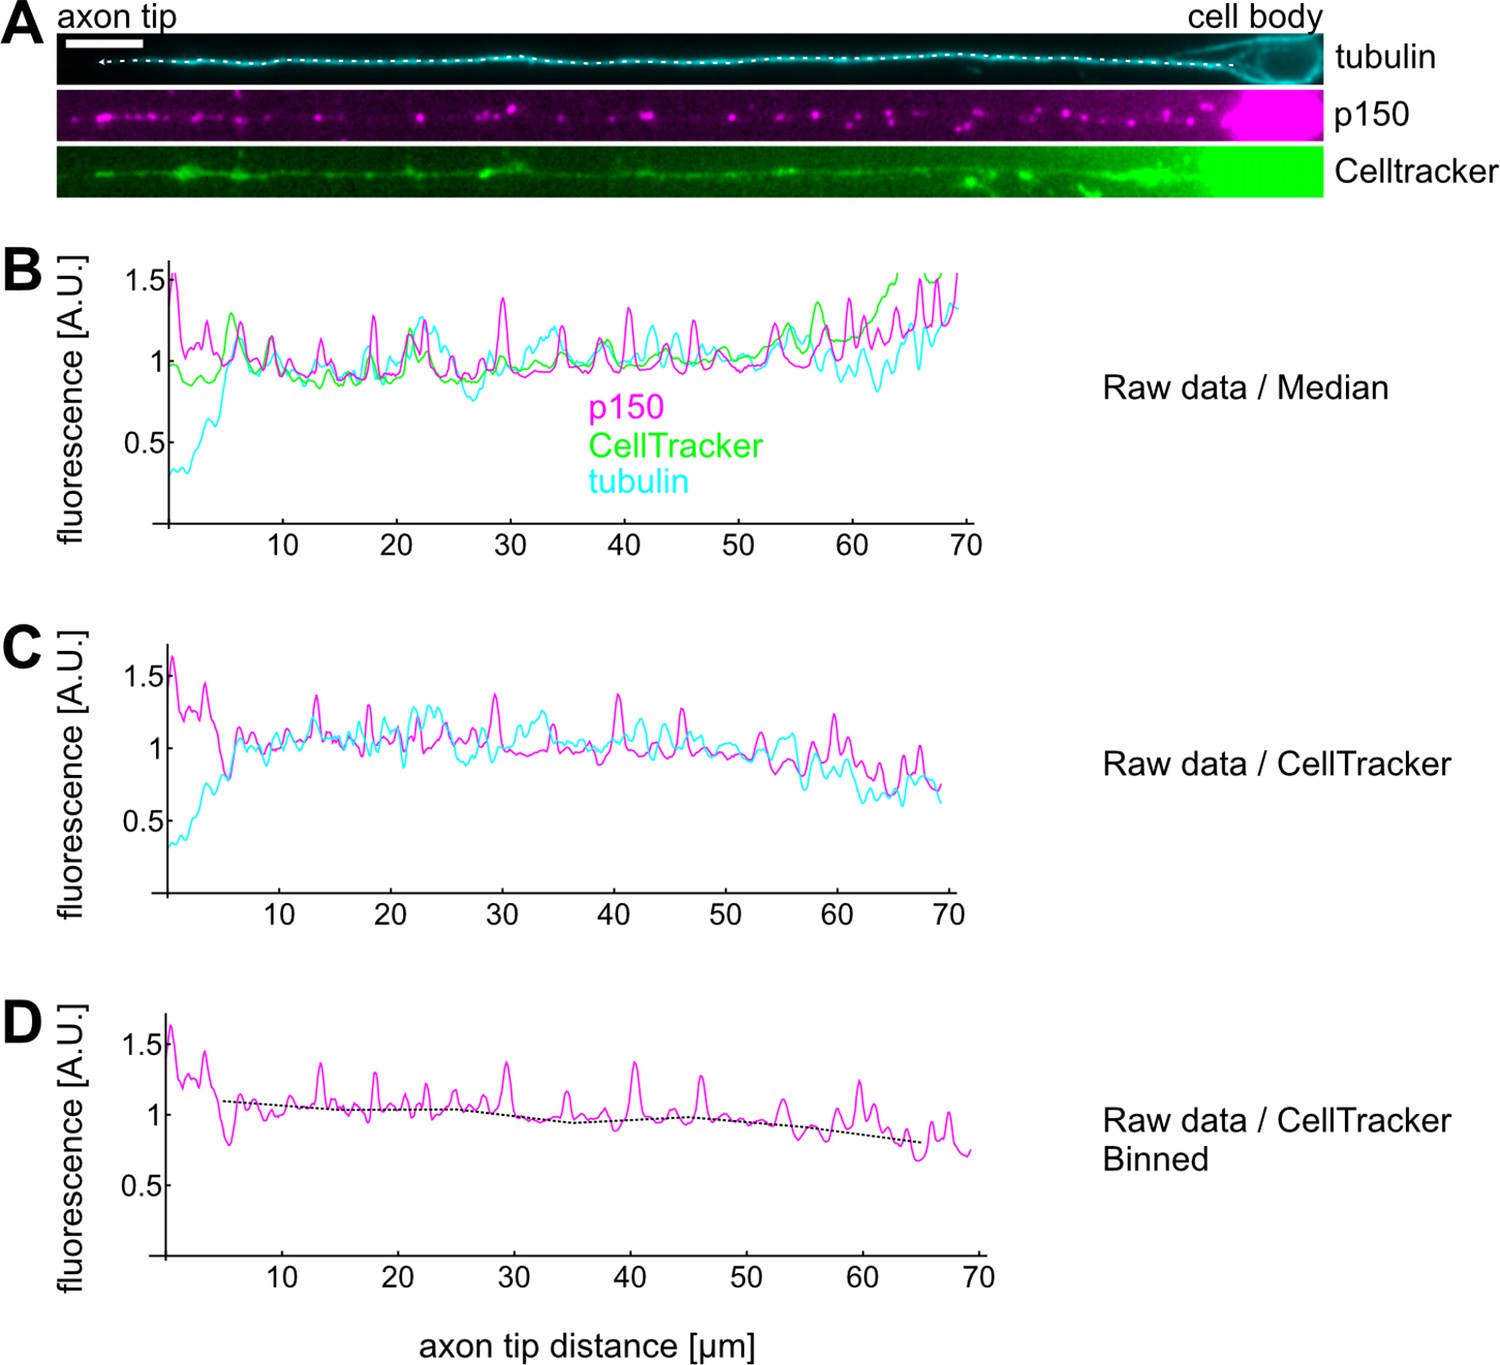
Example calculation of a single axons’ p150 profile.
(A) Drosophila melanogaster neurons were stained for tubulin, p150, and exposed to CellTracker before fixation. Scale bar: 2 µm. (A–B) We then drew a line along the axon from the cell body (right) to the axon tip (left) and extracted intensity profiles for each channel. Typically, we observed a decrease of tubulin and an increase of p150 towards axon tips. Furthermore, all three channels exhibited increased fluorescence towards the cell body. (C) We then divided the tubulin and p150 profiles by the CellTracker profile to control for increased fluorescence due to larger cell volumes. CellTracker begins fluorescing after permeating the cell membrane and is thereby a good measure for how much cytosol is found at a given location. (D) Finally, we binned the data, calculated the mean for each bin, and divided each bin by the average bin value for the corresponding control experiment. The plot in Figure 4C then shows the bootstrapped median of all bins of all axons of the given condition.
Figure 5 with 1 supplement
Biased stabilization of plus-end-out microtubules (MTs) is required to establish uniform axonal MT orientation.
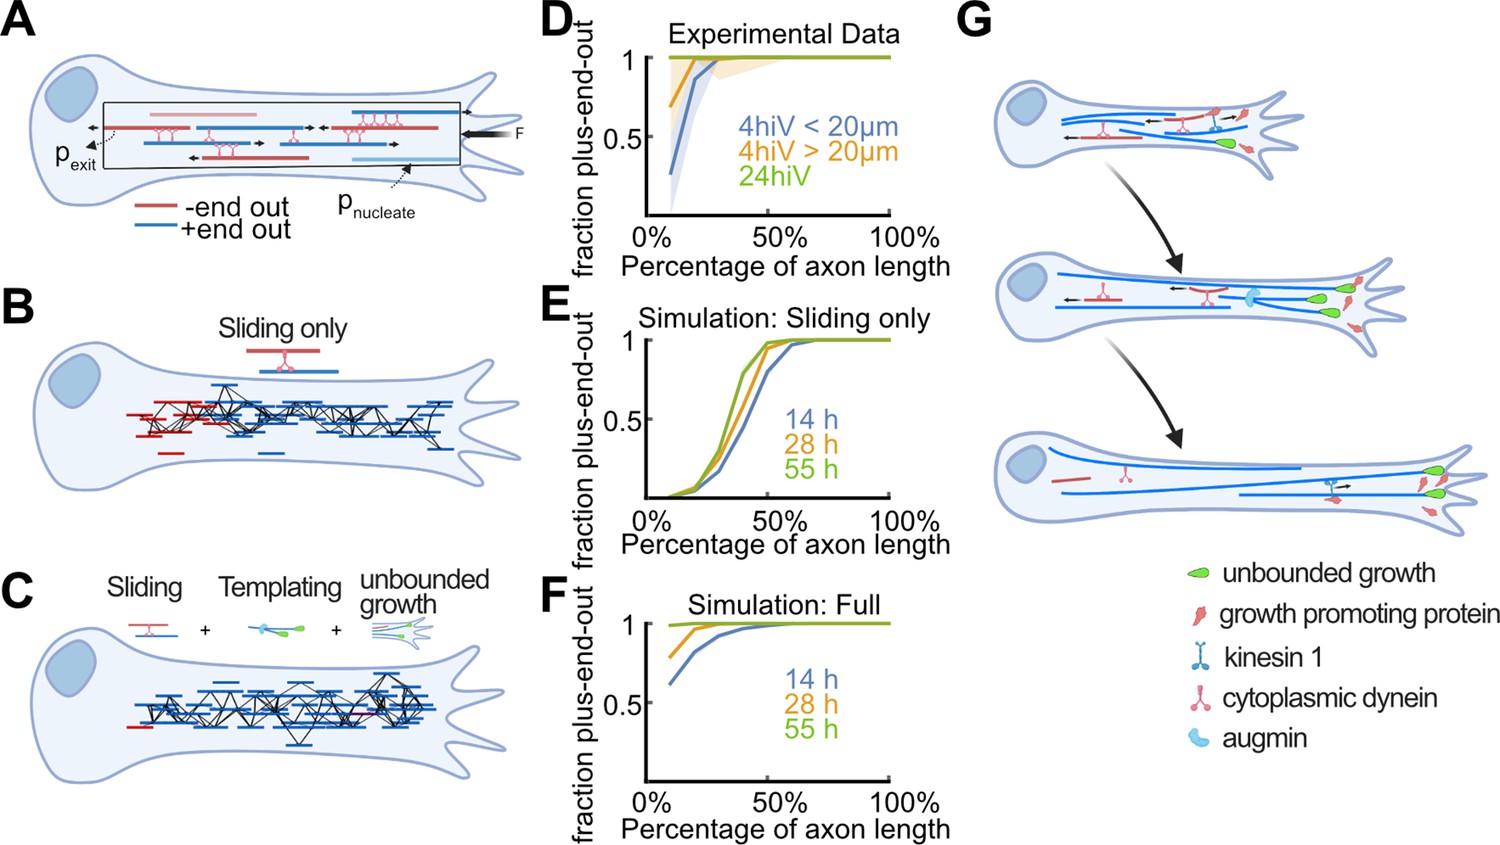
(A) Schematic showing the MT sliding simulation and its relevant parameters. (B–C) Simulation results of MT dynamics. (B) Snapshot of a simulated axon with dynein-based sliding of MTs minus-end-out MTs accumulated within the proximal axon. (C) Snapshot of an axon simulated with sliding, augmin templating (new MTs were likely oriented into the same direction as their surrounding ones), and biased nucleation of plus-end-out MTs at the tip. Much like in real axons, most MTs were oriented with their plus-end-out throughout the axon. (D) Experimental profiles of MT orientation along the (normalized) axon length for axons that were cultured 4 hr in vitro (4hiv), separated into less than 20 µm or more than 20 µm long, and 24 hr in culture (24hiv). Lines represent bootstrapped medians and 95% confidence intervals. (E–F) Simulation profiles of MT orientation along the axon. (E) Profiles obtained from simulations with dynein-mediated sliding only at three different simulation time points. MT orientation was graded along the axon but, unlike in the experimental profiles shown in (D), the proximal axon remained enriched with minus-end-out MTs. (F) MT orientation profiles obtained from simulations with sliding, templating, and biased nucleation of plus-end-out MTs at the axon tip. The observed gradual development of MT orientation along the axon is in excellent agreement with our experimental data (D). (G) Summary of proposed mechanism for establishing MT orientation in axons. Red and blue lines represent minus-end-out and plus-end-out MTs, respectively. Green drop shapes indicate unbounded MT growth into the axon tip for plus-end-out MTs. Kinesin 1 deposits MT growth-promoting proteins, such as p150, at axon tips (Figure 4—figure supplement 4), leading to local unbounded growth of plus-end-out MTs. Augmin templating and cell body-directed sliding of minus-end-out MTs further amplifies this bias. All three mechanisms together lead to a plus-end-out MT cytoskeleton.
Figure 5—figure supplement 1
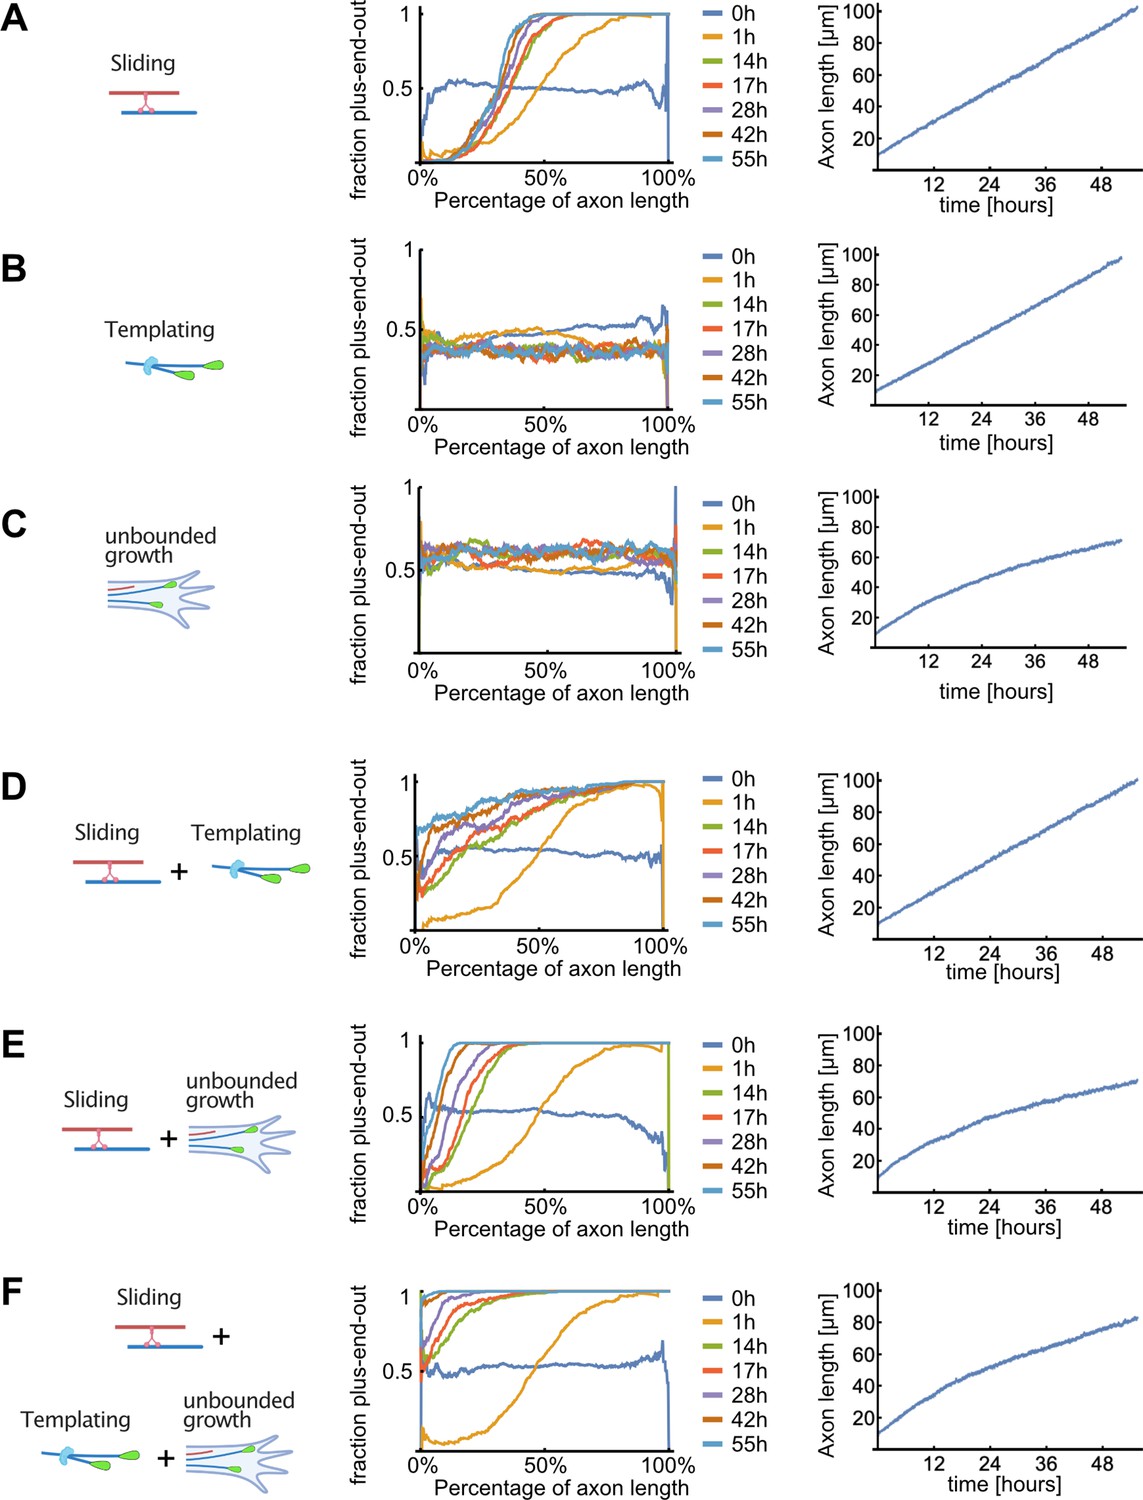
Detailed results of computer simulations for different microtubule (MT) sorting models.
Evolution of the MT orientation profile along the normalized axon length (middle), and of the axon length (right), for different MT sorting models (left). Colours represent simulation time (0–55 hr). (A) Dynein-mediated sliding alone. Minus-end-out MTs were transported towards the cell body and plus-end-out MTs towards the axon tip. The resulting MT orientation profile was graded along the axon with plus-end-out MTs enriched towards the tip; within approximately 14 hr, the orientation profile became stationary where a fixed fraction of the proximal axon remained enriched with minus-end-out MTs. (B) Local bias of MT nucleation (templating) alone. To mimic this situation, the directional movement of dynein motors on the MTs was eliminated by randomly choosing their gliding direction in each MT overlap. As the MT templating mechanism augmented the randomly chosen orientation of the initial MTs in the axon, individually grown axons were either enriched with plus-end-out MTs or with minus-end-out MTs but there was no bias towards either orientation. Consequently, when averaged over many axons, the resulting mean fraction of plus-end-out MTs was ~50% uniformly. (C) Unbounded growth alone. Here, a bias towards nucleation of plus-end-out MTs at the advancing tip of the axon was implemented and calculated from experimental data but motor-induced MT sliding was non-directional as in (B). The resulting MT orientation was stationary along the axon and roughly 55% plus-end-out. The reason for the small effect on overall MT orientation is that the MT growth-promoting factor is concentrated in a small region close to the axon tip, and its range of action thus diminishes in comparison to the axon length when the axon extends. In other words, as the axon extends, a growing portion of its length continues to accumulate ill-oriented MTs. Dynein-mediated sliding is therefore essential for clearing out the generated minus-end-out MTs, and this occurs much more efficiently in the presence of a bias at the growing tip that continually maintains the fraction of minus-end-out MTs small during growth, as can be understood from the comparison between panels (A) and (E). (D) Dynein-mediated sliding with local bias of MT nucleation (templating). The fraction of plus-end-out MTs increased along the axon length, and over time, because the biased nucleation resulted in less minus-end-out MTs. However, occasionally in these simulations the dominating MT polarity in the axon was inverted due to 'erroneous' initial nucleation of minus-end-out MTs, which then amplified during growth. (E) Sliding with unbounded growth of plus-end-out MTs at the tip. The position and orientation of new MTs was chosen at random, but their successful nucleation depended on their likelihood to exhibit unbounded growth as per Figure 2. This led to more plus-end-out MTs appearing in the system but not enough to render the axon fully plus-end-out. Furthermore, axon growth ceased to be linear because longer axons were less likely to nucleate new MTs as the region of unbounded growth at the tip did not increase over time. (F) Unbounded growth in combination with sliding and templating. New MT positions were sampled from a uniform distribution but with an orientation that depended on the local orientation of nearby MTs. MTs were only added to the simulation if they nucleated as calculated in (C). The fraction of plus-end-out MTs monotonically increased towards the axon tip and the orientation profile gradually become uniform over time, resembling the evolution observed in our experimentally determined profiles in Figure 5B.
Author response image 1
Growth length per cycle and catastrophe frequency vs distance from axon tip.
Here we replotted the data shown in SFigure 1A-B with a bin size of 2µm instead of 10µm. Differences in dg and fg exists also at smaller bin sizes.
Author response image 2
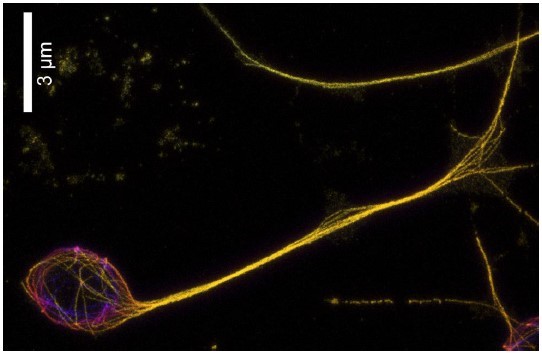
Expansion microscopy image of D. melanogaster neuron.
We stained α-tubulin (yellow) and expanded the sample ~5x. Individual microtubule bundles enter the cell body from the axon and continue to the other side, suggesting that -end out microtubules leaving the axon do not disappear but rather move until hitting a boundary at the opposite side of the soma.
Author response image 3
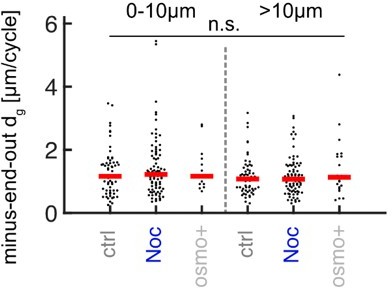
Added MT lengths per growth cycle dg of minus-end-out MTs at the distalmost 10µm from the axon tip and further away for control (N = 107 axons from 5 biological replicates), nocodazole-treated axons (N = 116 axons from 3 biological replicates), and axons cultured in osmo+ medium (N = 30, 2 biological replicates).
No significant differences were observed (p < 0.47 Kruskal Wallis test).
Tables
Key resources table
| Reagent type (species) or resource | Designation | Source or reference | Identifiers | Additional information |
|---|---|---|---|---|
| Strain (Drosophila melanogaster) | EB1-GFP | Bulgakova et al., 2012 | N/A | Flyline used to express EB1-GFP |
| Strain (Drosophila melanogaster) | Ubi EB1-GFP | Shimada et al., 2006 | N/A | Complementary Flyline used to express EB1-GFP |
| Strain (Drosophila melanogaster) | Jupiter-mCherry | Bergstralh et al., 2015 | N/A | Flyline used to label microtubules |
| Strain (Drosophila melanogaster) | P1501 | Bloomington | RRID:BDSC_504 | p150 heterozygous mutant |
| Strain (Drosophila melanogaster) | P150-RNAi | Bloomington | RRID:BDSC_3785 | |
| Strain (Drosophila melanogaster) | khc-RNAi | Bloomington | RRID:BDSC_35770 | |
| Strain (Drosophila melanogaster) | Elav-gal4 | Bloomington | RRID:BDSC_458 | RNAi driver in neuronal cells |
| Antibody | Rb anti-p150 (rabbit polyclonal) | Nieuwburg et al., 2017 | N/A | 1:500 |
| Antibody | Ms anti-alpha-tubulin (mouse monoclonal) | Abcam | Cat#: ab7291 RRID:AB_2241126 | 1:1000 |
| Recombinant DNA reagent | CellTracker | Invitrogen | Cat#: C2925 | ×1 |
| Antibody | CF633 anti-Rb (donkey anti-rabbit polyclonal) | Cambridge Bioscience | Cat#: BT20125 | 1:500 |
| Antibody | AF405 anti-Ms (donkey anti-mouse polyclonal) | Thermo Fisher Scientific | Cat#: ab175658 RRID:AB_2687445 | 1:500 |
| Software, algorithm | MATLAB | Mathworks | RRID:SCR_001622 | |
| Software, algorithm | Mathematica | Wolfram | RRID:SCR_014448 | |
| Software, algorithm | KymoButler | Jakobs et al., 2019 | https://githlab.com/deepmirror/kymobutler; deepMirror, 2019 | |
| Software, algorithm | ImageJ | Schindelin et al., 2012 | RRID:SCR_003070 | |
| Software, algorithm | Neurite Tracer | Pool et al., 2008 | RRID:SCR_016566 |
Additional files
Download links
A two-part list of links to download the article, or parts of the article, in various formats.
Downloads (link to download the article as PDF)
Open citations (links to open the citations from this article in various online reference manager services)
Cite this article (links to download the citations from this article in formats compatible with various reference manager tools)
Unrestrained growth of correctly oriented microtubules instructs axonal microtubule orientation
eLife 11:e77608.
https://doi.org/10.7554/eLife.77608


