Polysome-CAGE of TCL1-driven chronic lymphocytic leukemia revealed multiple N-terminally altered epigenetic regulators and a translation stress signature
- Department of Biomolecular Sciences, The Weizmann Institute of Science, Israel
- Department of Immunology, The Weizmann Institute of Science, Israel
Figures
Figure 1 with 1 supplement
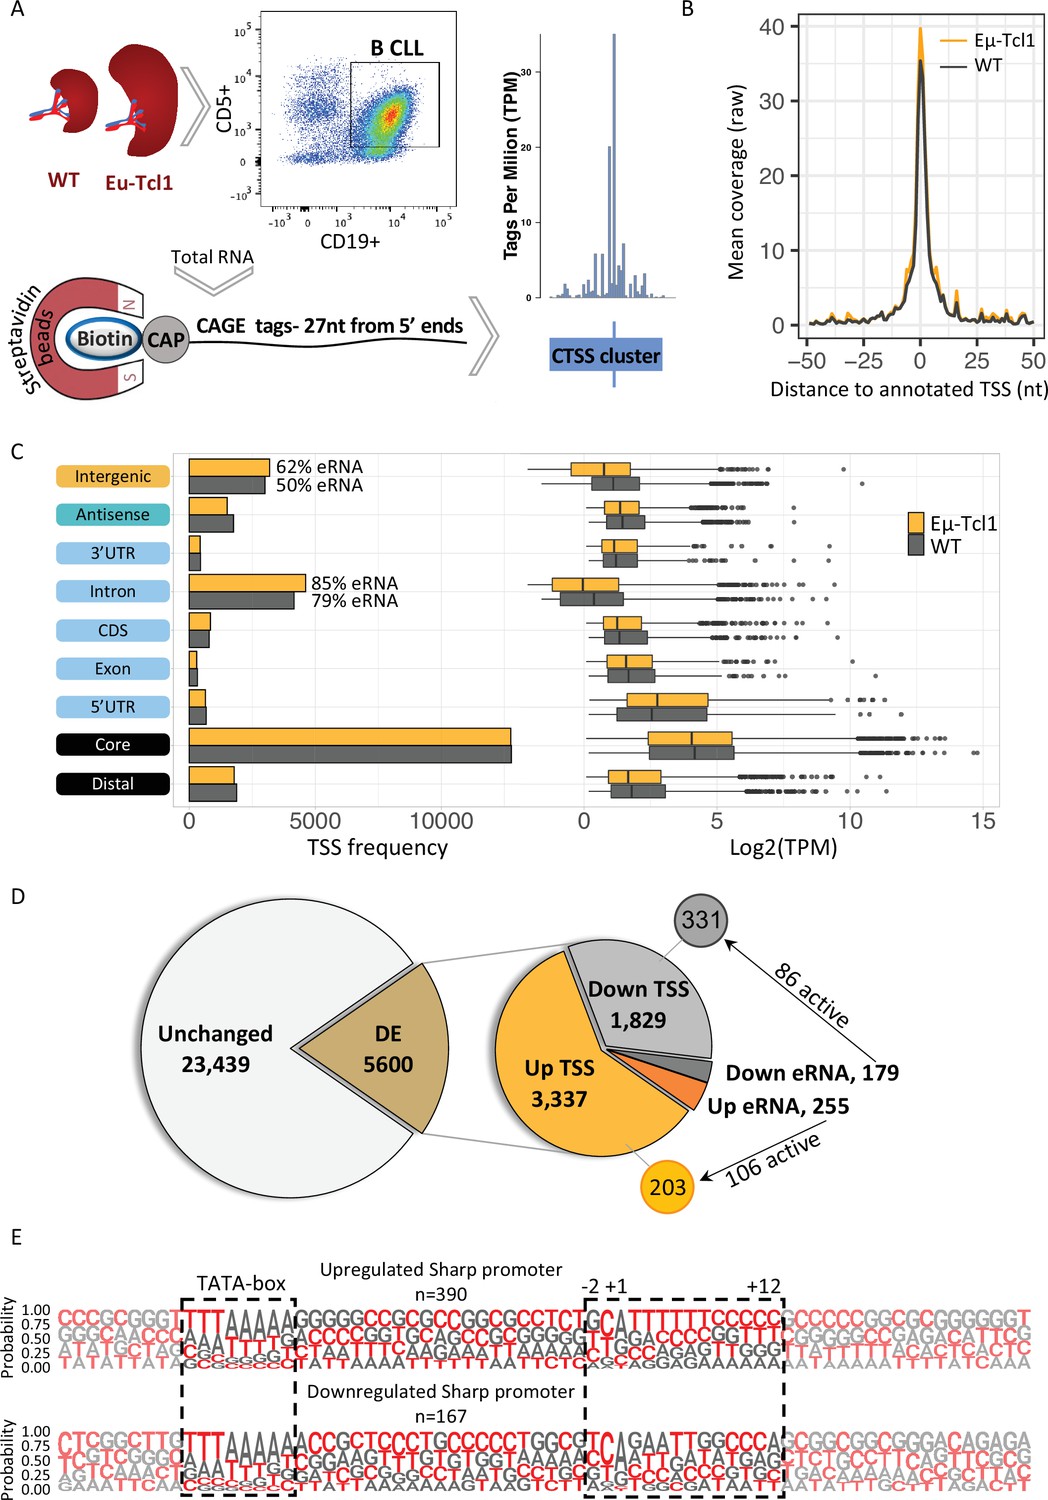
Global analysis of transcription start sites (TSSs) in healthy and chronic lymphocytic leukemia (CLL) B cells.
(A) A scheme of the Cap Analysis Gene Expression (CAGE) in healthy (WT) and CLL B cells (Eµ-Tcl1). WT and Eµ-Tcl1 splenic B cells were isolated using CD5 and CD19 magnetic beads. Total RNA samples were subjected to the CAGE as described in Materials and methods. CAGE-derived TSSs (CTSSs) were mapped and clustered into genomic blocks referred as tag clusters (blue bar) with a peak of most recovered CTSS (blue tick) indicates the TSSs in a single-base resolution. (B) Metagene analysis of Eµ-Tcl1 (orange) and WT (gray) CAGE libraries aligned to annotated TSS atlas of the FANTOM5 project. (C) The frequency (left) and expression level (right, log2 TPM) of CAGE tag clusters in Eµ-Tcl1 (orange) and WT (gray) mice by gene locations. The percentage values on the columns of intronic and intergenic locations refer to predicted enhancer RNA (eRNA) TSSs. (D) Differentially expressed (DE) TSSs. Left circle indicates unchanged (light gray) and significantly DE (brown) TSS between Eµ-Tcl1 and WT mice. Right circle details frequencies of Eµ-Tcl1 upregulated genic and eRNA TSSs (orange and dark orange, respectively) and downregulated genic and eRNA TSSs (gray and dark gray). Subgrouping of DE TSSs that are positively correlated with enhancers are indicated. (E) Sequence LOGOs (−40 to +30 relative to the TSS) of Eµ-Tcl1 upregulated (lower panel) and downregulated (upper panel) sharp promoters where TATA box situated between −31 and −24 sites and cap-proximal region (12 bases) are boxed in a dashed line.
Figure 1—figure supplement 1
Global analysis of transcription start sites (TSSs) in healthy and chronic lymphocytic leukemia (CLL) B cells.
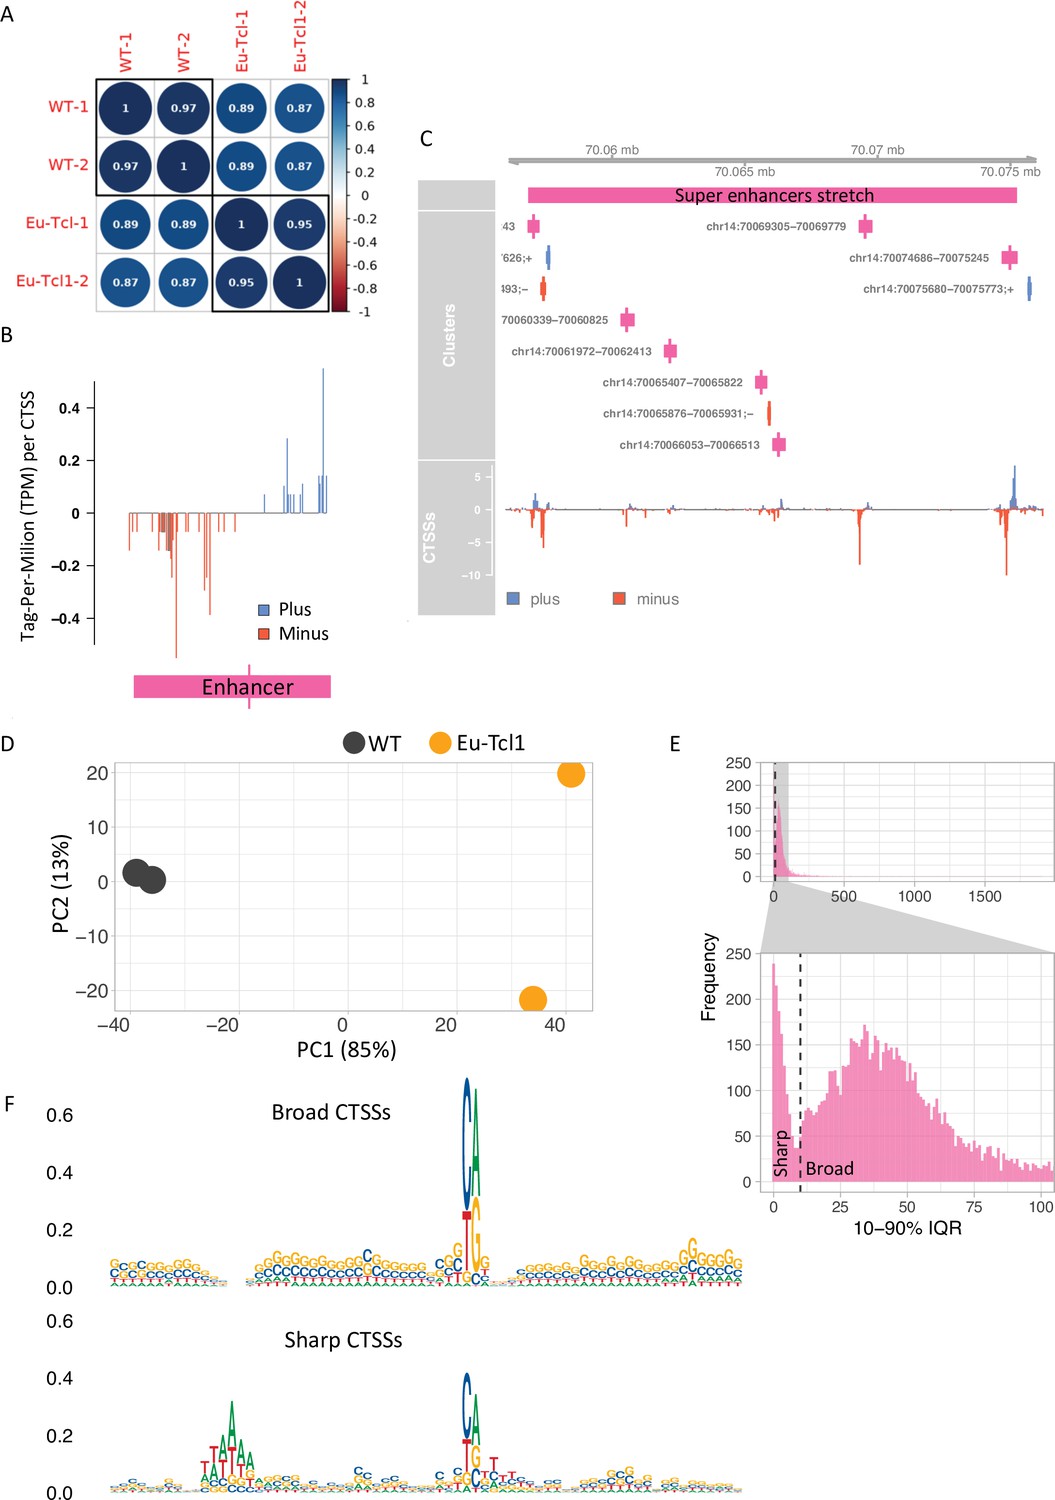
(A) Coefficient scores of Cap Analysis of Gene Expression (CAGE) library replicates of Eu-Tcl1 and WT total RNA samples calculated using Pearson pairwise-correlation test. (B) Genome browser example of an enhancer candidate showing balanced bidirectional transcription of enhancer RNAs (eRNAs). Tag-Per-Million per values plotted in blue for plus strand and in red for minus strand. (C) An example of a super enhancer. Closely spaced enhancers positioned within 18,405 bps range. (D) ‘Blind’ version of the variance-stabilizing transformation of the two replicates of Eu-Tcl1 and WT CAGE samples. (E) Bimodal distribution of the widths of tag clusters (TCs) of highly expressed transcription start sites (TSSs). Most CAGE TCs are distributed either below (Sharp) or above (Broad) 10 bases distance holding 10–90% of pooled CAGE tags. (F) Sequence logos of core promoter regions (−40 and +30 bp) of Sharp and Broad classes of TCs.
Figure 2 with 1 supplement
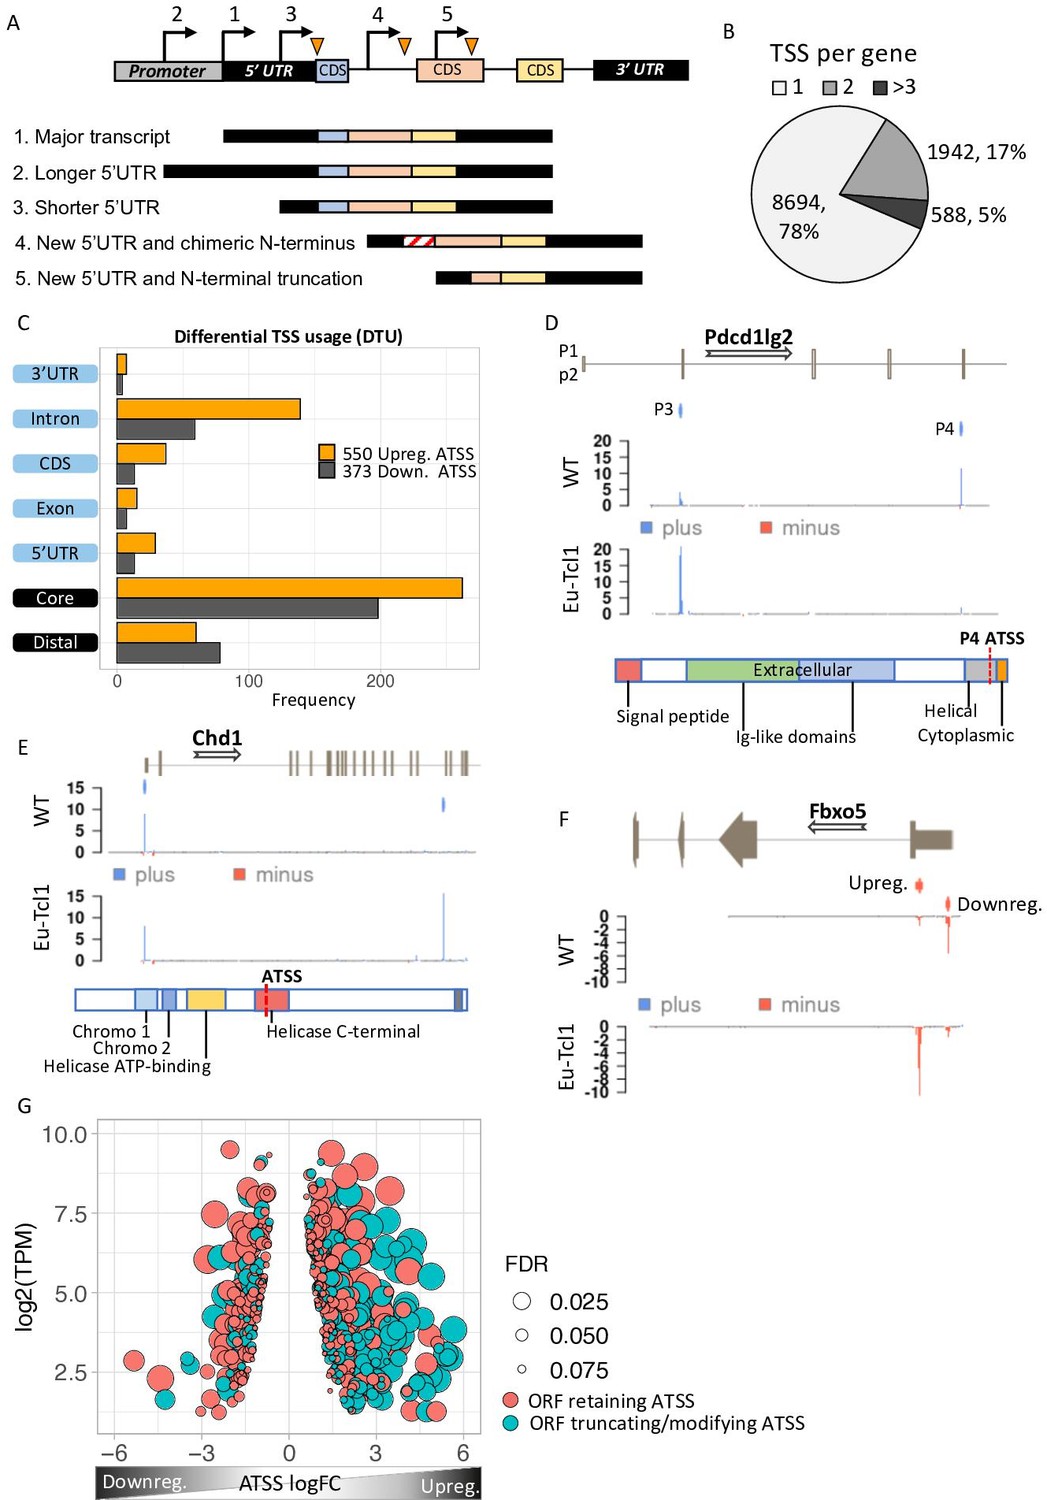
Analysis of differential TSS usage (DTU) reveals alternative 5′ UTRs and new protein isoforms derived from cryptic promoters in chronic lymphocytic leukemia (CLL).
(A) Scheme of five alternative TSSs (ATSSs) generating isoforms with alternative 5′ UTR regions (Siegel et al., 2019; Sant et al., 2010; Kröber et al., 2002; Zenz et al., 2010; Herling et al., 2006) and modification of the N′ termini for example, new chimeric CDS (Kröber et al., 2002) and N′-terminal truncation (Herling et al., 2006). (B) The frequency and the percentage of uni-TSS genes and multi-TSS genes including only TSS clusters that constitute over 10% of total gene expression. (C) Frequencies of alternative TSSs that were upregulated (orange) and downregulated (gray) in Eµ-Tcl1, grouped by gene-structure locations. (D) Gene track showing differential TSS usage (DTU) in Pdcd1lg2 (PD-L2) in Eµ-Tcl1 and WT mice. Canonical promoter (P3) and intra-genic promoter (P4, located just upstrem to the last CDS of PD-L2) are up- and downregulated in Eµ-Tcl1, respecively. Both, located on the plus strand (blue). Bellow, is a scheme illustrating the P4-induced truncation of PD-L2 lossing most of its functional domains. (E) Chd1 protein truncation in Eµ-Tcl1 resulted by induction of cryptic promoter. In the upper track, two promoters on the plus strand (blue ticks) presented along to a partial gene-structure scheme. While the canonical promoter located upstream to the annotated 5′ UTR is similarly expressed in Eµ-Tcl1 and WT, an Eµ-Tcl1-specific induction of an intra-genic alternative TSS located in the 16th intron resulting in N′ terminus truncation of Chd1 lacking several active domains as illustrated below. (F)Fbxo5 5′ UTR shorthening resulted by DTU in Eµ-Tcl1. On the upper track, two alternative promoters located on the minus strand shown as short red bars with indicator tick of TSS. Coverage peaks in the two lower tracks (WT and Eµ-Tcl1) showing differential expression of the two promoters where the nearest alternative TSS to the ORF is upregulated in Eµ-Tcl1. (G) Dot plot of ORF-retaining alternative TSS (ATSS) in peach and ORF-truncating intra-genic alternative TSS (turquoise) presenting expression (log2 TPM) against ATSS log FC evaluating the degree of promoter shifting (DTU). Positive and negative ATSS log FCs refer to Eµ-Tcl1 up- and downregulated ATSS, respectively. Dot sizes correspond to the FDR statistical significance of the DTU analysis.
Figure 2—figure supplement 1

Analysis of differential TSS usage (DTU) reveals alternative 5′’ UTRs and new protein isoforms derived from cryptic promoters in chronic lymphocytic leukemia (CLL).
(A) Boxplot of expression level (log2 TPM) of alternative transcription start site (ATSS) upregulated (orange) or downregulated (gray) in Eu-Tcl1 by gene-structure location. (B) The frequency of positively correlated ATSSs with active enhancers plotted by gene-structure location.
Figure 3 with 1 supplement
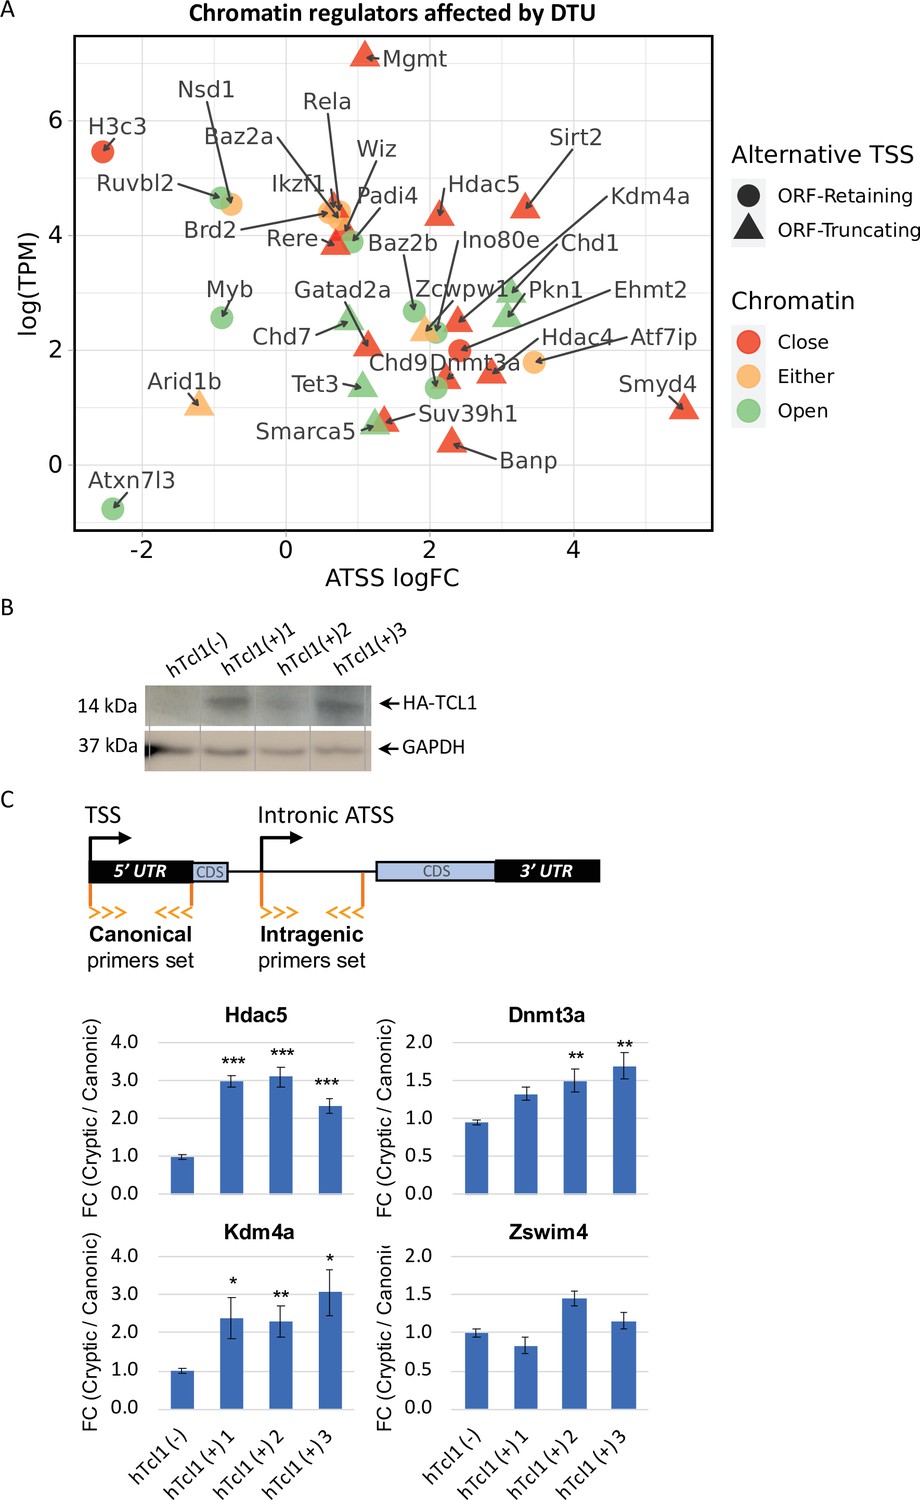
Cryptic promoters of closed chromatin epigenetic regulators and the role of hTCL1.
(A) Dot plot of ORF-retaining (circle) and ORF-truncating (triangular) alternative transcription start sites (TSSs) within genes associated with close (red), open (green), or either (yellow) chromatin states. For evaluating the degree of promoter shifting (DTU), the data are presented by expression (log2 TPM) against log FC of alternative TSS (ATSS). Positive and negative ATSS log FCs refer to Eµ-Tcl1 up- and downregulated ATSS, respectively. (B) Stable mouse embryonic fibroblast (MEF) cell lines expressing exogenous hTCL1 were verified by western blot with anti-HA antibody and anti-GAPDH as loading control. (C) Exogenous expression of hTCL1 induces cryptic promoters. A scheme illustrating the canonical and cryptic promoter and the design of RT-qPCR primers to the 5′ UTR sequences originated by canonical TSS and intra-genic (intronic) alternative TSS. The results are presented as the ratio between cryptic and canonical levels. Statistically significant differences are denoted by asterisks as follows: *p < 0.05, **p < 0.01, and ***p < 0.001.
-
Figure 3—source data 1
Western blot of MEF stable clones expressing HA-tagged human TCL1.
- https://cdn.elifesciences.org/articles/77714/elife-77714-fig3-data1-v1.pptx
Figure 3—figure supplement 1
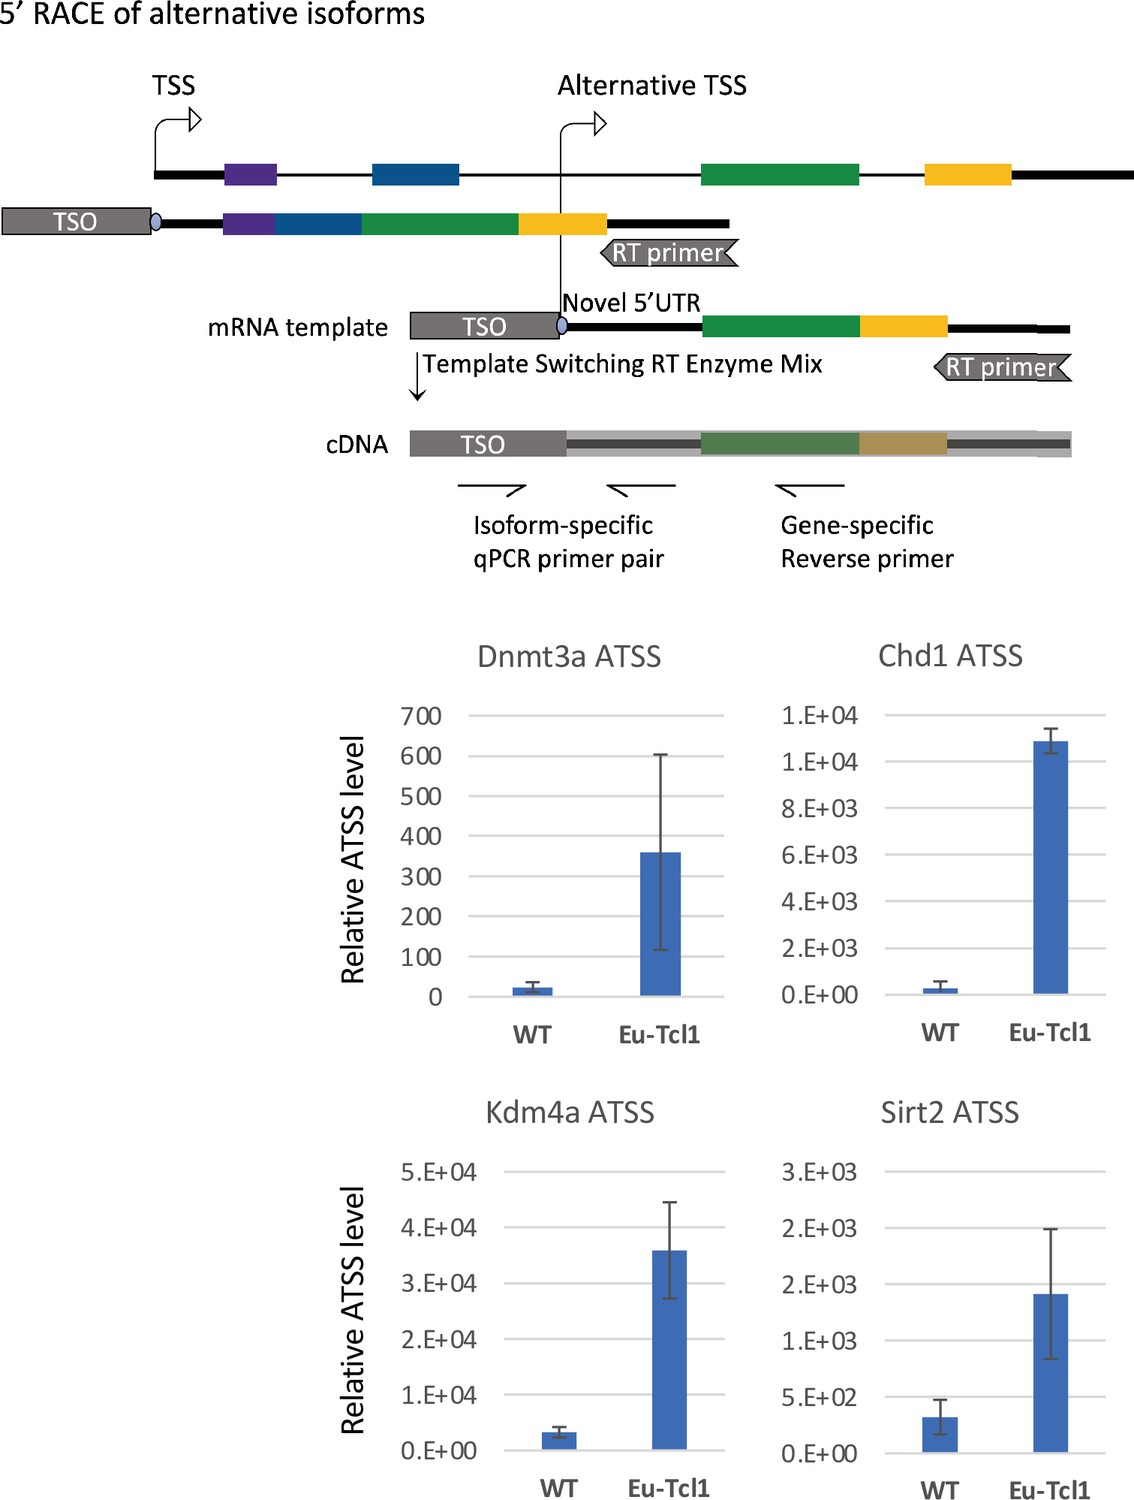
5′ RACE of alternative transcription start sites (TSSs) revealed by Cap Analysis of Gene Expression (CAGE).
The upper panel shows a scheme of the 5′ RACE followed by qPCR (see Materials and methods for details). The lower panel shows the qPCR results of the indicated chromatin modifiers. The total RNA samples of Eu-Tcl1 and WT mice are the same ones used for the CAGE.
Figure 4

Upregulation of TFs targeting cryptic promoters and enhancers.
(A) A principle component analysis (PCA) analysis of motif occurrence (%) of 119 transcription factor-binding sites (Fornes et al., 2020, mouse core collection) searched in 923 promoters (−1000 upstream and +100 downstream to transcription start site [TSS]) of upregulated (red) and downregulated (blue), ORF-retaining (squares) or ORF-truncating (circles) alternative TSSs. PCA1 and PCA2 explain 38.6% and 41.1% of the total variation, respectively. (B) TFBS enrichment analysis of activated alternative promoters (−1000 upstream and +100 downstream to TSS) relative to the overall activated promoters. Among the enriched TFs, Ets2 and c-Myc levels are upregulated in Eµ-Tcl1 (Supplementary file 3) and are indicated. (C) Analysis of the c-Myc expression in the stable mouse embryonic fibroblast (MEF) clones expresing hTCL1 by RT-qPCR. Statistically significant differences are marked with asterisks ***p < 0.001. (D) TFBS enrichment analysis of enhancers associated with alternative promoters relative to overall induced enhancers. The levels of indicated enriched TFs are upregulated in Eµ-Tcl1 (see Supplementary file 3).
Figure 5 with 1 supplement
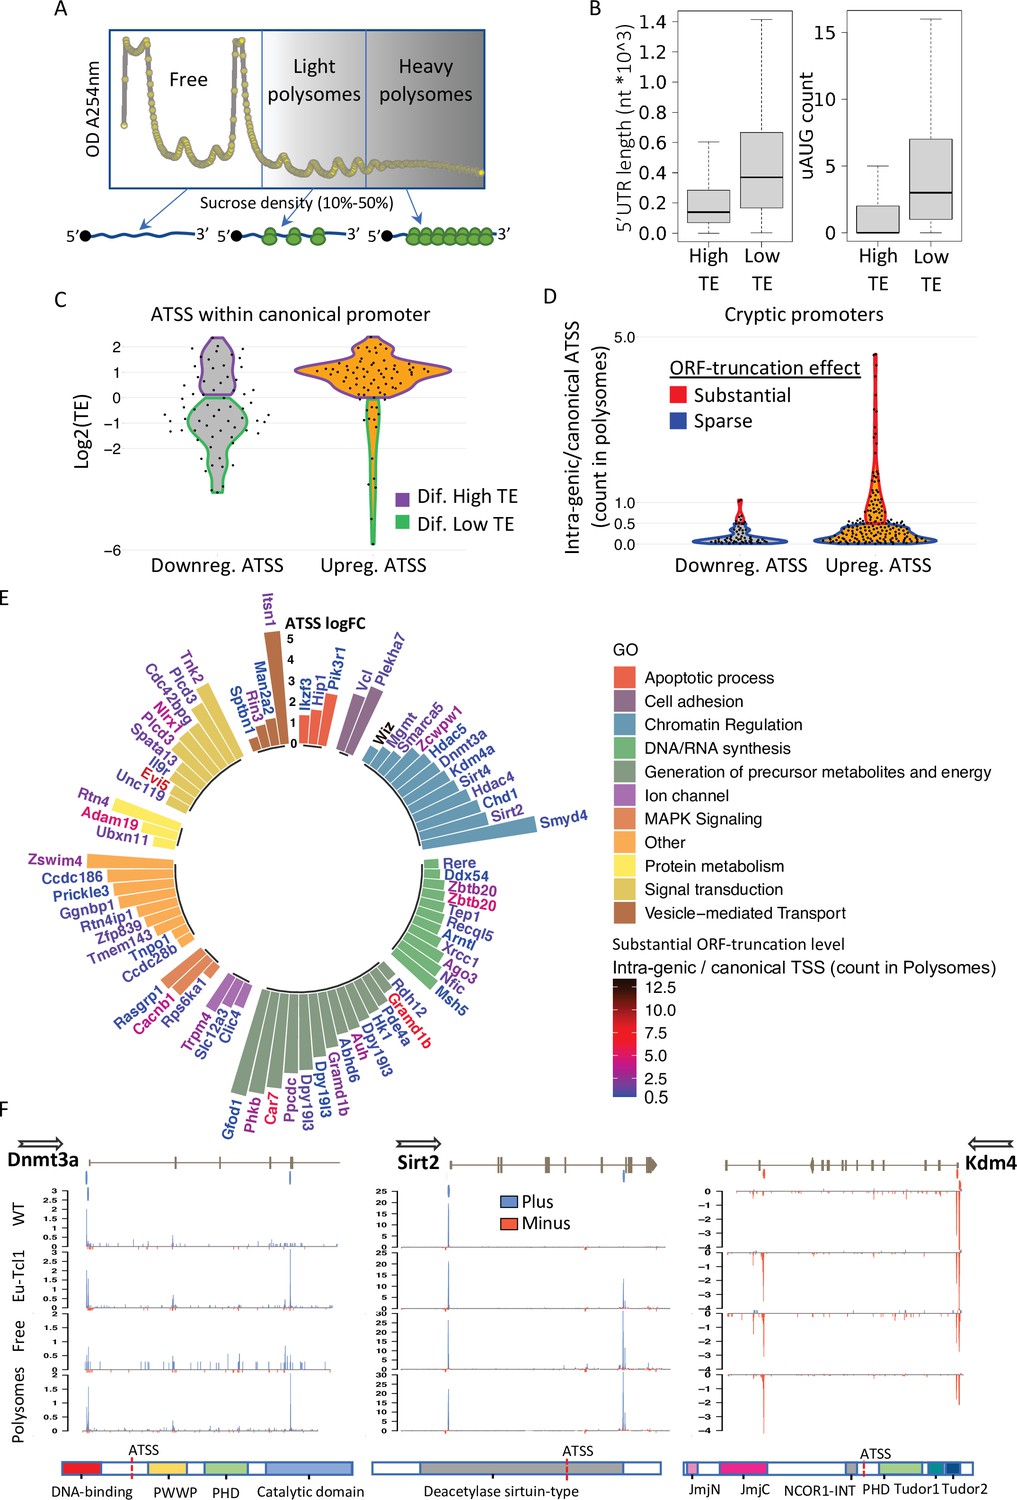
Translatability of ORF-retaining and -truncating alternative transcription start sites (TSSs).
(A) Schematic presentation of polysome fractionation into three main fractions. Free fraction corresponds to nontranslated transcripts and Light and the Heavy fractions corresponds to intermediate and highly translated transcripts, respectively. (B) Boxplot of 5′ UTR length and number of upstream AUG of transcript isoforms defined by high translation efficiency (High-TE) and low translation efficiency (Low-TE). (C) The TE distribution of differentially expressed ORF-retaining alternative TSSs (within canonical promoter) leading to differential High-TE (purple border) and differential Low-TE (green border) transcript isoforms. (D) ORF-truncating ATSSs that are either above (Substantial ORF truncation) or below (Sparse ORF truncation) 50% of the canonical TSS count in the polysomes fraction. (E) Gene ontology (GO) anlysis of genes with Eµ-Tcl1 upregulated and translated intra-genic ORF-truncating ATSSs. Bar heights present an inclusive log FC explaining the magnitude of promoter shifting, taking in consideration TSS FC between Eµ-Tcl1 and WT mice and FC between cannonical and intra-genic TSSs paires, per gene. Gene names are colored by a relative scale of translation level between ORF-truncating ATSS and the canonical TSS, calculated by the ratio of intra-genic/canonical TSS counts in the polysome fractions. Blue colored gene refers to ORF-truncating ATSS that exceeds 50% (0.5) of the canonical representation in the polysomes fraction and dark red refers to the maximum of 12.5 FC higher representation in the polysomes fraction by the ORF-truncating ATSS. (F) Coverage peaks of TSSs of canonical and intra-genic cryptic promoters (indicated by blue and red ticks in the upper track) found in Dnmt3a Sirt2 and Kdm4a genes. Blue and red coverage peaks represent transcription from the plus and minus strands, respectively. Eµ-Tcl1 and WT tracks presented TSS peaks of total RNA and Polysomes and Free tracks derived from Eµ-Tcl1 polysome profilling. On the bottom are schemes of each gene’s protein domains in which the points of truncation due to intra-genic ATSS are marked.
Figure 5—figure supplement 1
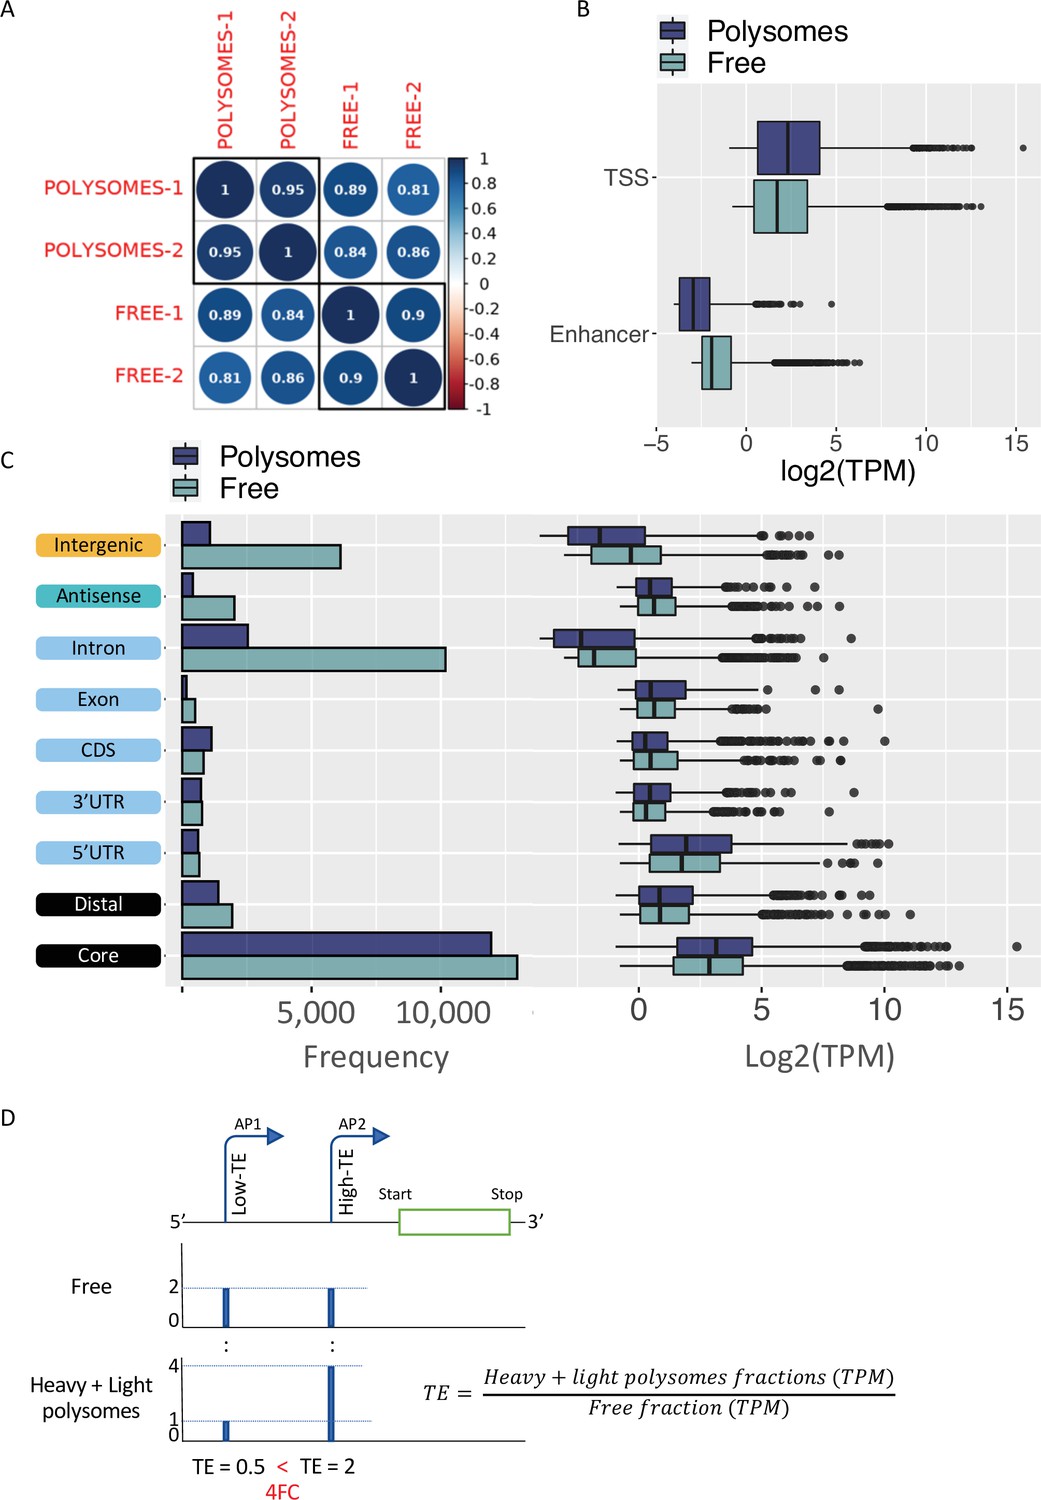
Translatability of ORF-retaining and ORF-truncating alternative transcription start sites (TSSs).
(A) Coefficient scores of Cap Analysis of Gene Expression (CAGE) library replicates of Eu-Tcl1 polysome-free (Free) and polysomes RNA samples calculated using Pearson pairwise-correlation test. (B) Frequency and boxplot of expression level (log2(TPM)) of CAGE tag clusters (TCs) in polysome-free (light blue) and polysomes (dark blue) by gene-structure locations. (C) Boxplot of expression level (log2(TPM)) of TCs classified as transcription start site (TSS) or enhancer in polysome-free (light blue) and Heavy polysomes (dark blue). (D) Example of differentially translated isoforms originated by alternative promoters (P1 and P2), differing in 5′ UTR lengths. TSS coverage tracks of polysome-free (Free) and Heavy + Light polysomes are used for calculating TE values of the alternative isoforms. When the TE of the one isoform (shorter 5′ UTR, AP-2) is 2FC greater than the longer isoform (AP-1), the first assigned as Low-TE isoform and the latter as High-TE isoform.
Figure 6 with 1 supplement
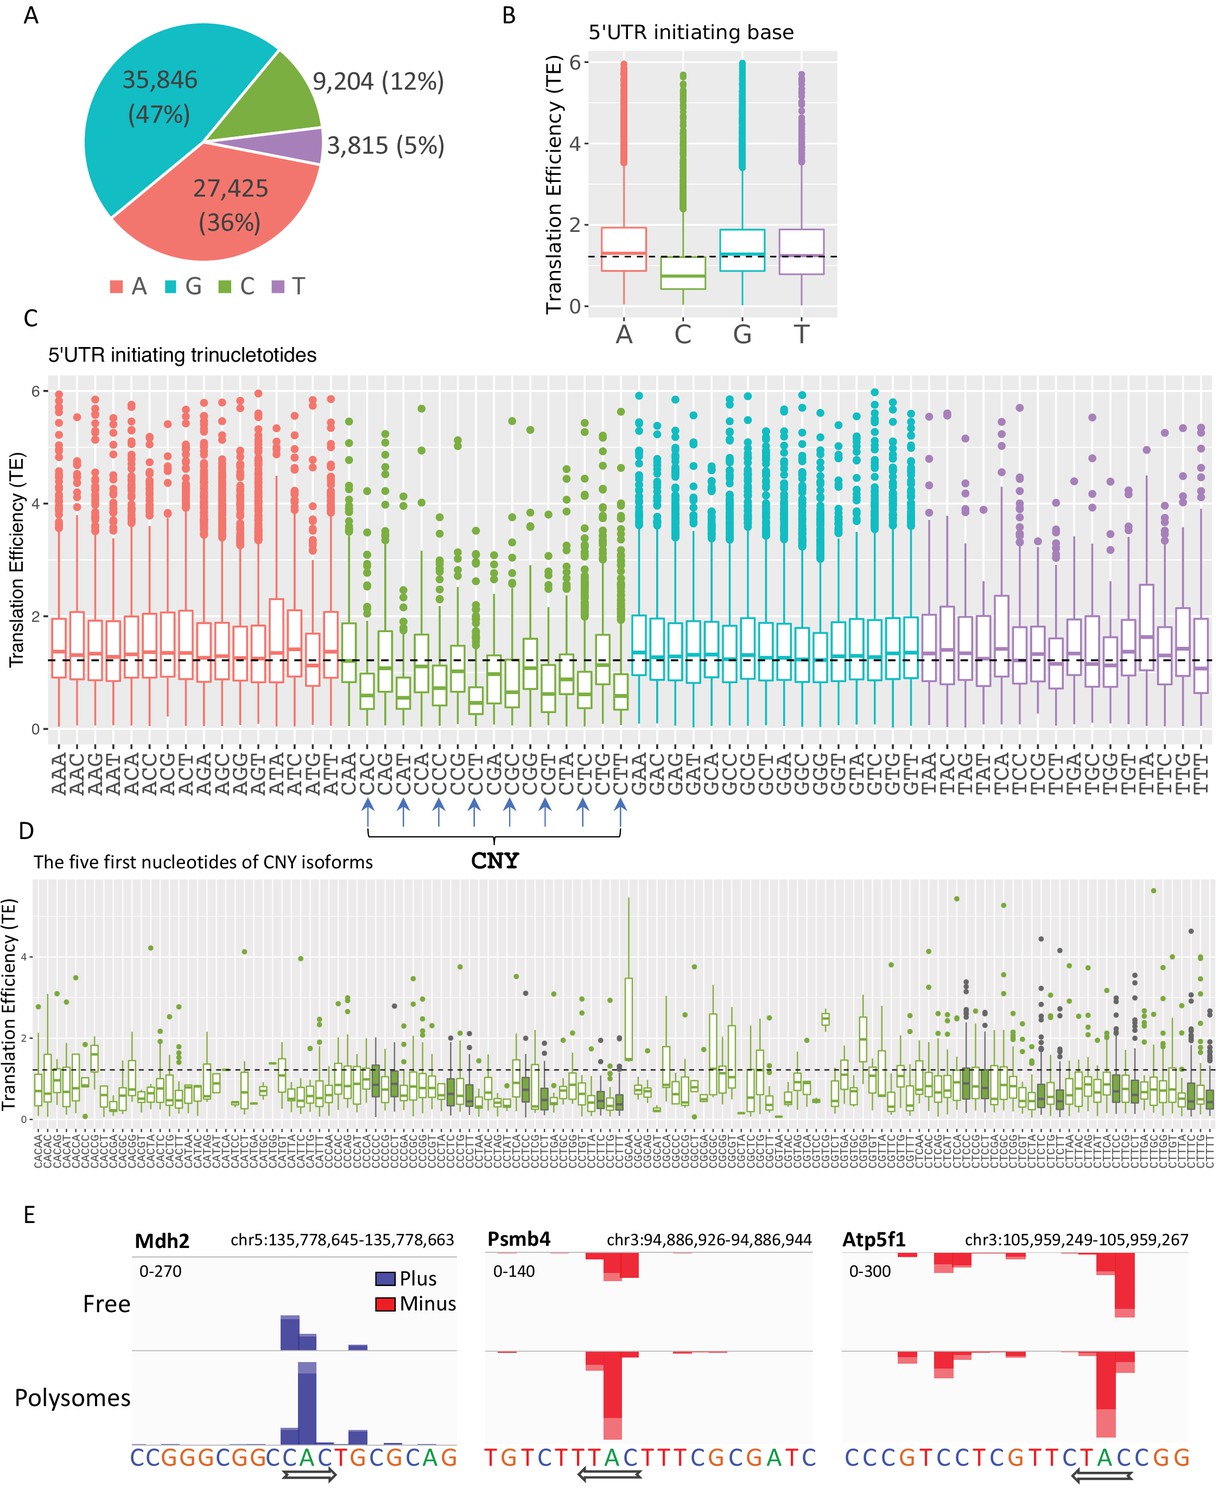
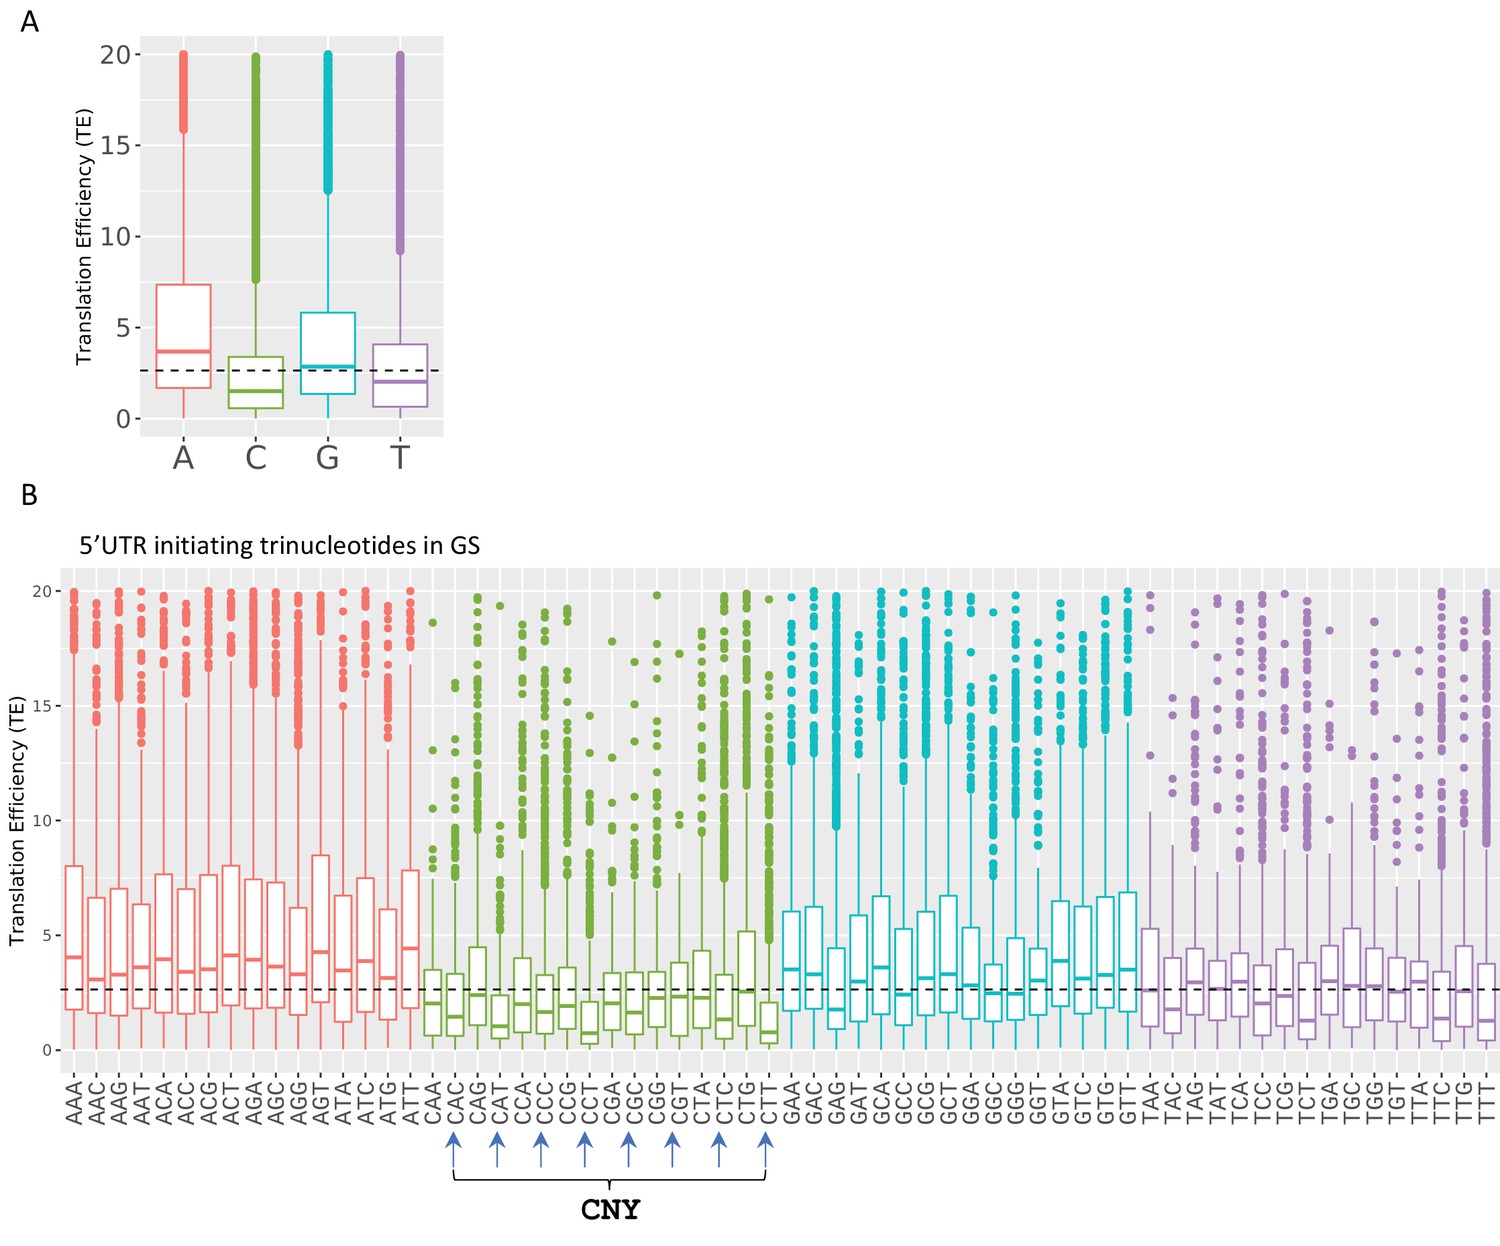
The impact of transcription start site (TSS) nucleotides on translation efficiency (TE).
(A) The frequency of initiating TSS nucleotide in Eµ-Tcl1. (B) Boxplots of TE of isoforms that differ in their TSS first nucleotide. The horizontal dashed line marks the overall median value. (C) Boxplots of TE of transcripts that differ in their first three nucleotides. CNY trinucleotides are marked by arrows. (D) Boxplots of TE of the first five nucleotides of the CNY-initiating transcripts. The nucleotides corresponding to the TOP element are marked with filled boxes. All the data presented in this figure are the mean of the two independent replicates. The bottom and the top whiskers represent 5% and 95% of the distribution, respectively. (E) Examples representing the effect of the first nucleotides on TE in Mdh2, Psmb4, and Atp5f1 genes. CAGE-derived TSS (CTSS) tags per million (TPM) is plotted separately for plus (blue) and minus (red) strands of the polysome-free and polysomal fractions with a scale set for the two tracks shown in the upper-left corner. Direction of transcription is marked by an arrow located at the first CTSS.
Figure 6—figure supplement 1
Boxplots of transcription efficiency (TE) of isoforms differ in their initiating transcription start site (TSS) single nt (A) and first three nucleotides (B) are distributed and colored by initiating Adenosine, Cytosine, Guanin and Tyrosine.
Horizonal line represents overall median of TE values. All the data presented in this figure are the mean of the two independent replicates. The bottom and the top whiskers represent 5% and 95% of the distribution, respectively.
Figure 7
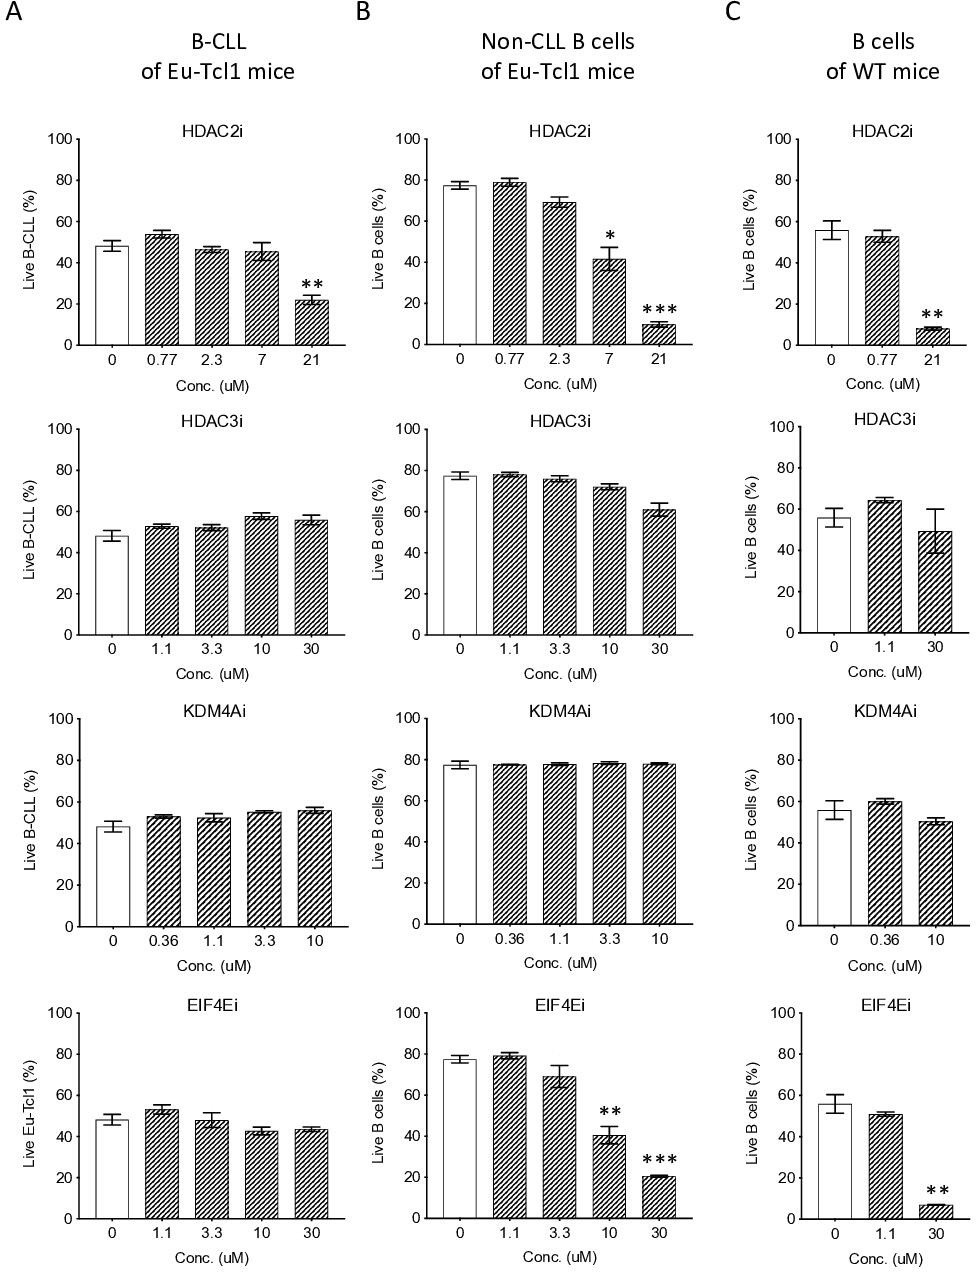
Eµ-Tcl1 B cells are relativlely resistant to inhibitors of affected pathway.
Survival assay of B-CLL of Eµ-Tcl1 mice (A), non-CLL B cells of Eµ-Tcl1 mice (B), and B cell of WT mice (C) treated with inhibitors (i) targeting HDAC2, HDAC3, KDM4A and eIF4E. The significance between DMSO (vehicle control) and inhibitor-treated cells is indicated by asterisks (*p < 0.05, **p < 0.01, and ***p < 0.001).
Tables
Table 1
Differential expressed chromatin-regulating genes.
| Symbol | log FC | Adj. p value | Protein |
|---|---|---|---|
| Chd2 | −1.28 | 0.04 | Chromodomain helicase DNA-binding protein 2 |
| Chd3 | −8.29 | 0.01 | Chromodomain helicase DNA-binding protein 3 |
| Cbx4 | −1.69 | 0.02 | Chromobox 4, E3 SUMO ligase |
| Kmt2c | −1.2 | 0.03 | Lysine methyltransferase 2C |
| Kmt5b | −1.47 | 0.03 | Lysine methyltransferase 5B |
| Hdac11 | −13.79 | 0.02 | Histone deacetylase 11 |
| Hdac9 | −4.59 | 0.02 | Histone deacetylase 9 |
| Kat6a | −1.04 | 0.03 | Lysine acetyltransferase 6A |
| Kdm7a | −1.27 | 0.02 | Lysine demethylase 7A |
| Smarca2 | −2.13 | 0.03 | SWI/SNF related |
| Asf1b | 4.36 | 0.032 | Anti-silencing function 1B histone chaperone |
Additional files
-
Supplementary file 1
Gene ontology (GO) pathways affected by differential transcription start site (TSS) usage.
GO enrichment analysis by the GeneAnalytics tool of GeneCardSuite, performed over a total of 923 gene set affected by differential TSS usage, generating alternative isoforms either up- or downregulated in Eu-Tcl1 mice. SuperPath matching score is based on the binomial distribution.
- https://cdn.elifesciences.org/articles/77714/elife-77714-supp1-v1.docx
-
Supplementary file 2
Mouse genome informatics (MGI) phenotypes affected by differential TSS usage.
Enrichment analysis of MGI phenotypes performed by the GeneAnalytics tool of GeneCardSuite over a total of 923 gene set affected by differential transcription start site (TSS) usage, generating alternative isoforms, either up- or downregulated in Eu-Tcl1 mice. MGI phenotypes matching scores are based on the binomial distribution.
- https://cdn.elifesciences.org/articles/77714/elife-77714-supp2-v1.docx
-
Supplementary file 3
Transcription factors upregulated in Eu-Tcl1 A list of gene-level upregulated (positive log(FC)) transcription factors in Eu-Tcl1 mice.
- https://cdn.elifesciences.org/articles/77714/elife-77714-supp3-v1.docx
-
Supplementary file 4
A list of oligos/primers used in 5′ RACE and qPCR methods.
- https://cdn.elifesciences.org/articles/77714/elife-77714-supp4-v1.docx
-
Transparent reporting form
- https://cdn.elifesciences.org/articles/77714/elife-77714-transrepform1-v1.pdf
Download links
A two-part list of links to download the article, or parts of the article, in various formats.
Downloads (link to download the article as PDF)
Open citations (links to open the citations from this article in various online reference manager services)
Cite this article (links to download the citations from this article in formats compatible with various reference manager tools)
Polysome-CAGE of TCL1-driven chronic lymphocytic leukemia revealed multiple N-terminally altered epigenetic regulators and a translation stress signature
eLife 11:e77714.
https://doi.org/10.7554/eLife.77714


