Single-cell glycomics analysis by CyTOF-Lec reveals glycan features defining cells differentially susceptible to HIV
- Department of Urology, University of California, San Francisco, United States
- Gladstone Institutes, United States
- The Wistar Institute, United States
Figures
Figure 1 with 1 supplement

Validation of cytometry by time of flight (CyTOF)-Lec.
(A) Antibody staining for protein markers is not altered by lectins. Shown are histograms of tonsil cells expressing CD3, CD8, or CD4, as detected by CyTOF after antibody staining followed or not by staining with metal-conjugated lectins (AOL: Aspergillus oryzae; MAL-1: Maackia amurensis I; WGA: wheat germ agglutinin; UEA-1: Ulex europaeus I; and ABA: Agaricus bisporus agglutinin). Protein expression (y-axis) is represented as the percentage of the maximal expression level detected for each staining. (B–D) Sialidase treatment elicits expected changes in lectin binding. Tonsil cells were treated with sialidase (20 μg/ml) for 1 hr at 37°C, and then stained with the CyTOF-Lec panel. Shown are histograms depicting the extent of interaction with sialic acid-binding (B), fucose-binding, (C) or T antigen-binding (D) lectins. Removal of sialic acid by sialidase decreases binding by sialic acid-binding lectins, while increasing binding by the fucose- and T antigen-binding lectins, as expected.
Figure 1—figure supplement 1
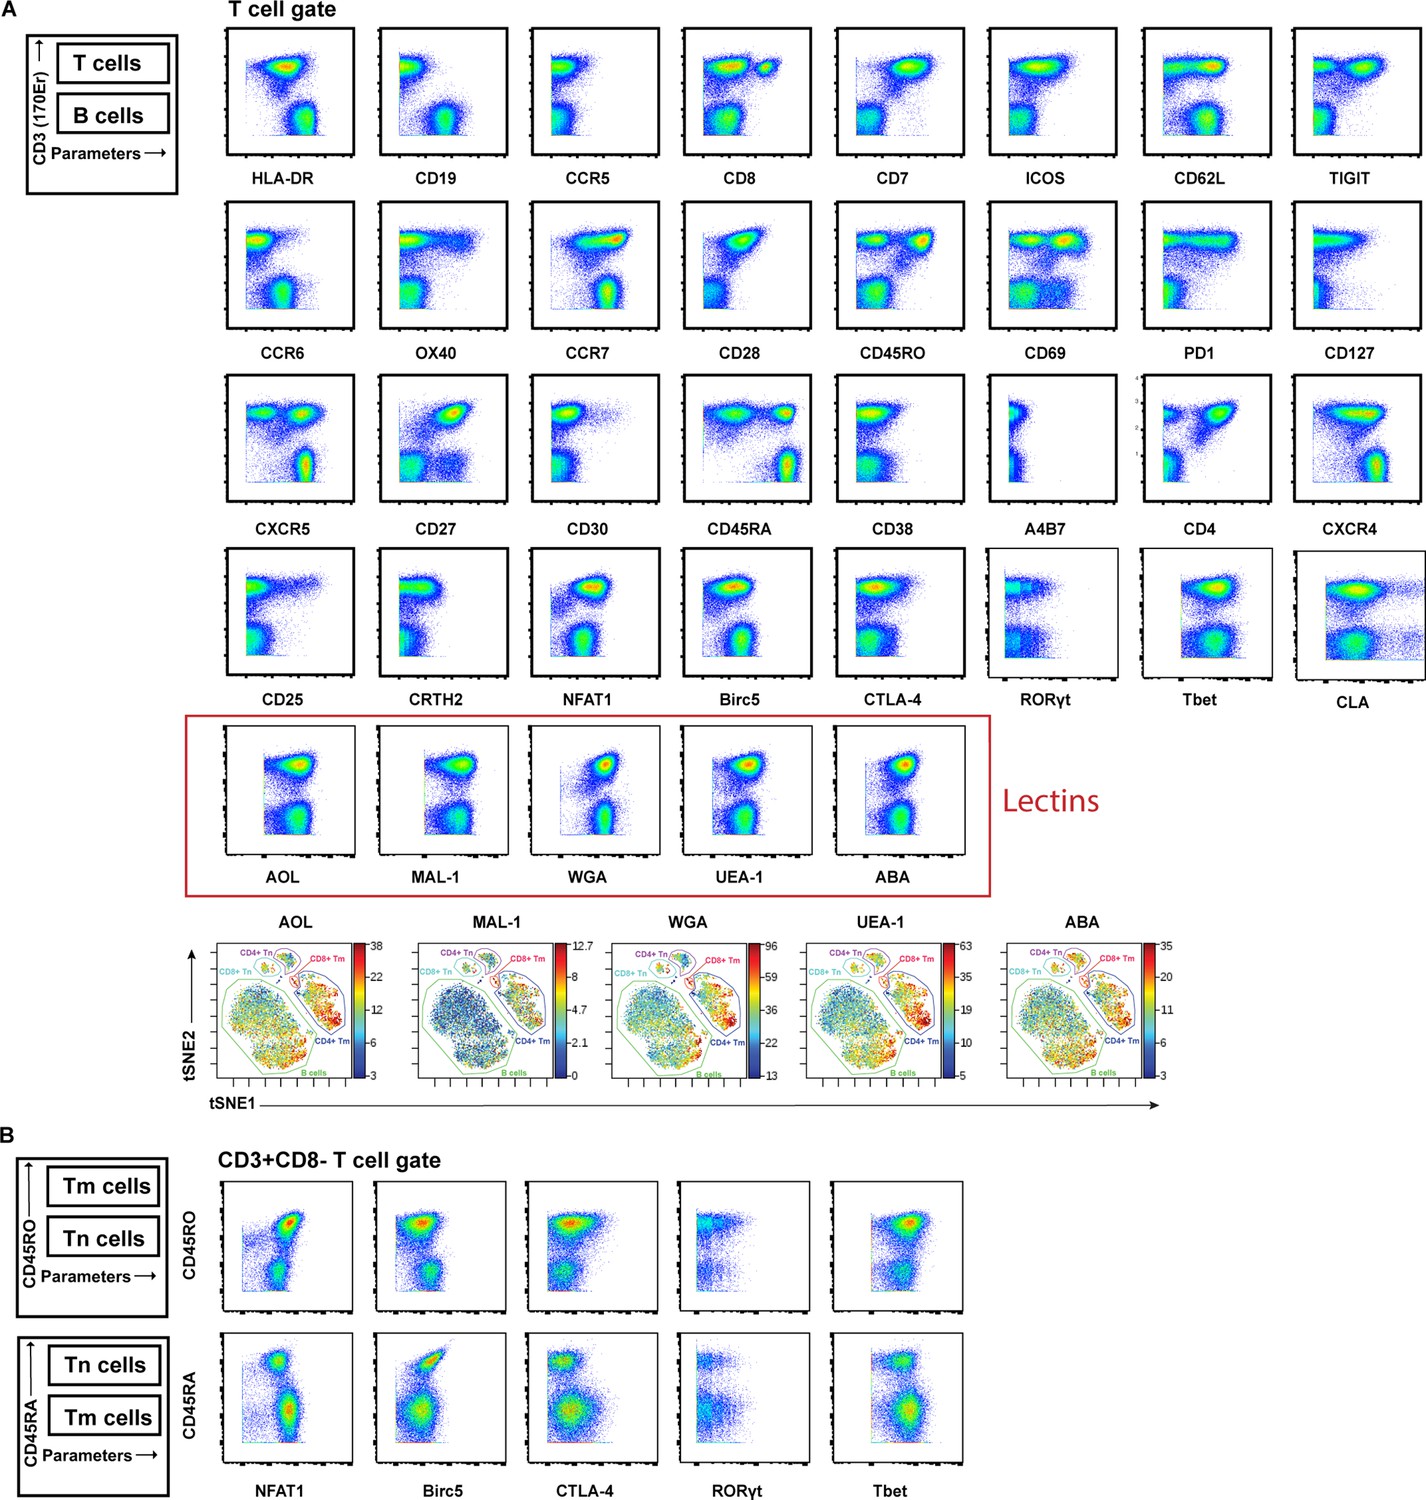
Validation of antibodies and lectins used for cytometry by time of flight (CyTOF) analysis.
(A) Expression levels of each protein antigen and glycan (the latter identified by their lectin) on tonsillar T and B cells, as assessed by CyTOF. As demonstrated schematically in the upper left, the top population of each plot corresponds to T cells (CD3+) while the bottom population corresponds to B cells (CD3-). Each antibody in the panel was validated by standard two-dimensional plots showing expression of CD3 (y-axis) vs. each indicated antibody or lectin (x-axis). The observed expression patterns of the protein antigens are consistent with known expression patterns on T cells and B cells. Results are gated on live, singlet cells. The bottom row depicts relative lectin staining viewed as a t-SNE heatmap, with the B cells, CD8+ naïve T cells (CD8+ Tn), CD8+ memory T cells (CD8+ Tm), CD4+ naïve T cells (CD4+ Tn), and CD4+ memory T cells (CD4+ Tm) annotated. (B) The intracellular protein antigens NFAT1, Birc5, CTLA-4, RORγt, and Tbet were further assessed for differential expression among CD4+ Tm vs. CD4+ Tn populations by monitoring for expression levels on CD45RO+ (marker of memory) vs. CD45RA+ (marker of naïve) cells. These antigens were all preferentially expressed in the memory compartment, consistent with their known expression patterns.
Figure 2
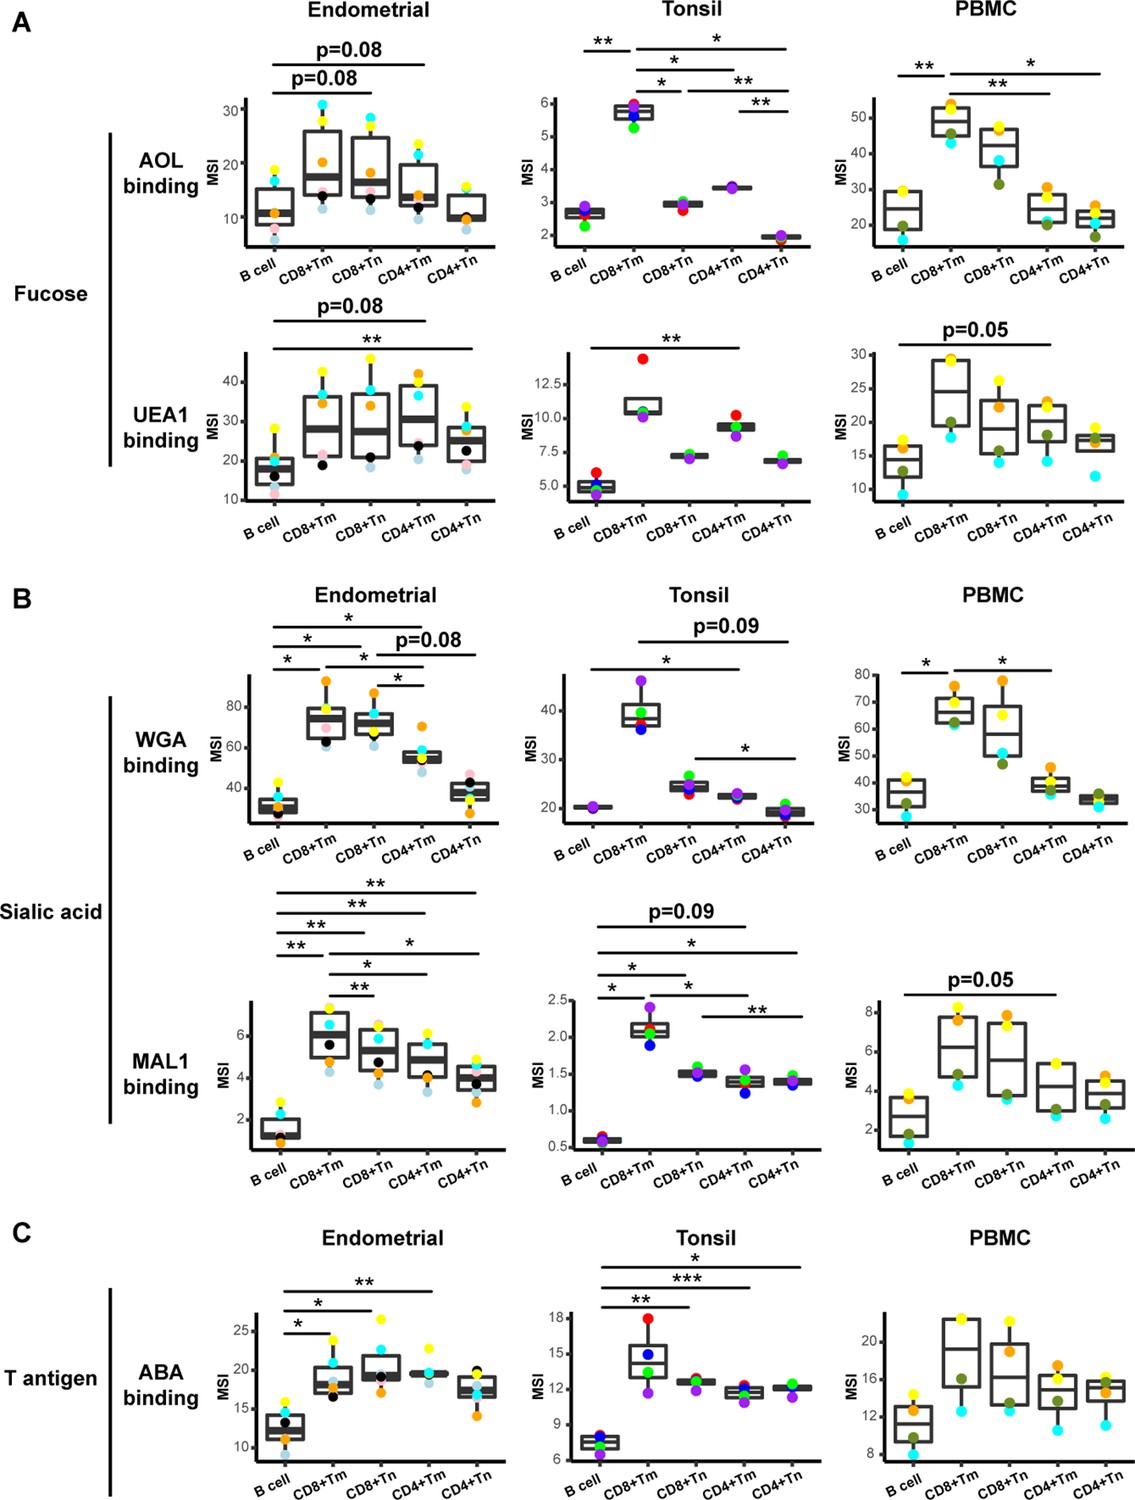
Glycan expression in lymphocytes from human endometrium, tonsils, and blood.
(A) Box plots showing staining by fucose-binding lectins on B and T cells from the endometrium, tonsils, and PBMCs, quantified as median signal intensity (MSI). T cells were subdivided into memory CD8+ T cells (CD8+ Tm), naïve CD8+ T cells (CD8+ Tn), memory CD4+ T cells (CD4+ Tm), and naïve CD4+ T cells (CD4+ Tn) based on their expression of Tm- and Tn-specific CyTOF markers. AOL binds to total/core fucose, UEA1 binds to α1–2 branched fucose. Although there were some differences in binding between sites and between the different lectins, in all instances fucose-binding proteins bound CD4+ Tm at higher levels than they did CD4+ Tn. (B) Box plots showing binding by sialic acid-binding lectins WGA and MAL-1. Results are presented as in panel A. WGA binds to total sialylated glycans and MAL-1 binds to α2–3 sialylated glycans. Overall, the sialic acid-binding lectins bound CD8+ T cells at higher levels than they did CD4+ T cells and B cells. (C) Box plots showing binding by the T antigen-binding lectin ABA. Results are presented as in panel A. Overall, ABA bound T cells at higher levels than they did B cells. *p<0.05, **p<0.01, ***p<0.001 as assessed using the Student’s paired t test and adjusted for multiple testing using the Holm method.
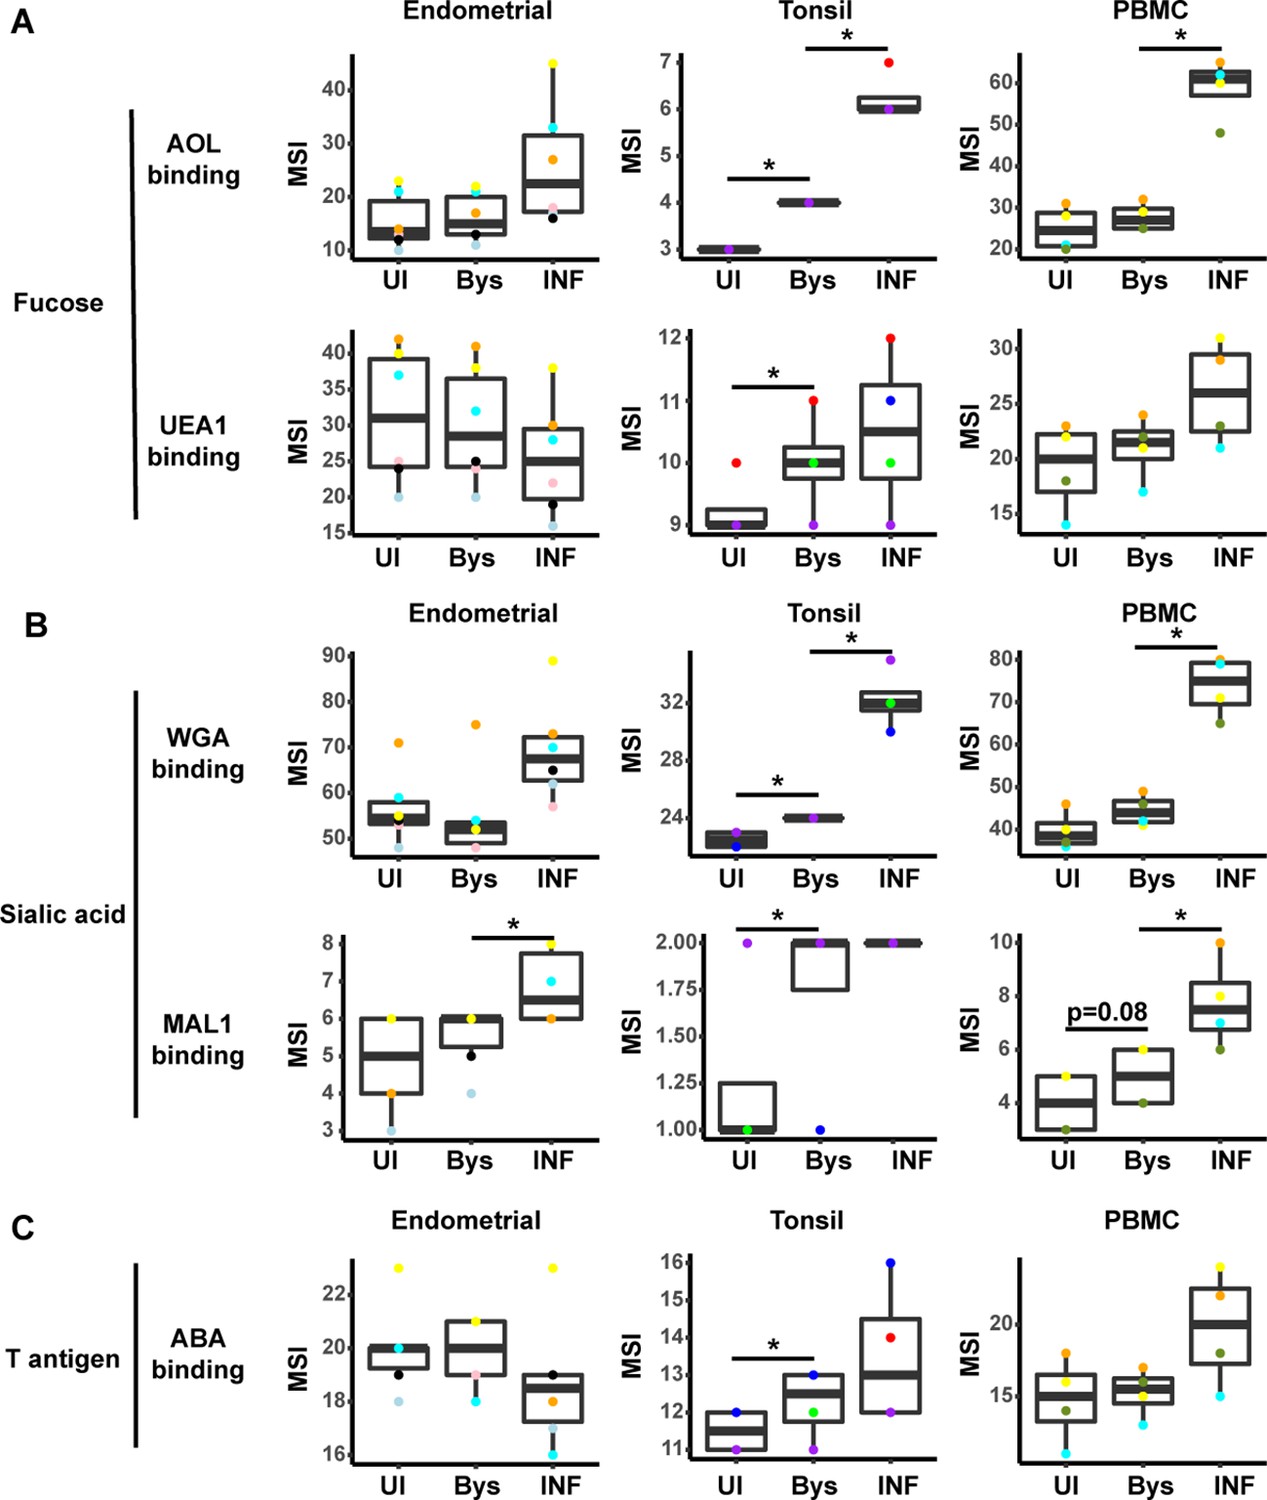
Figure 3 with 6 supplements
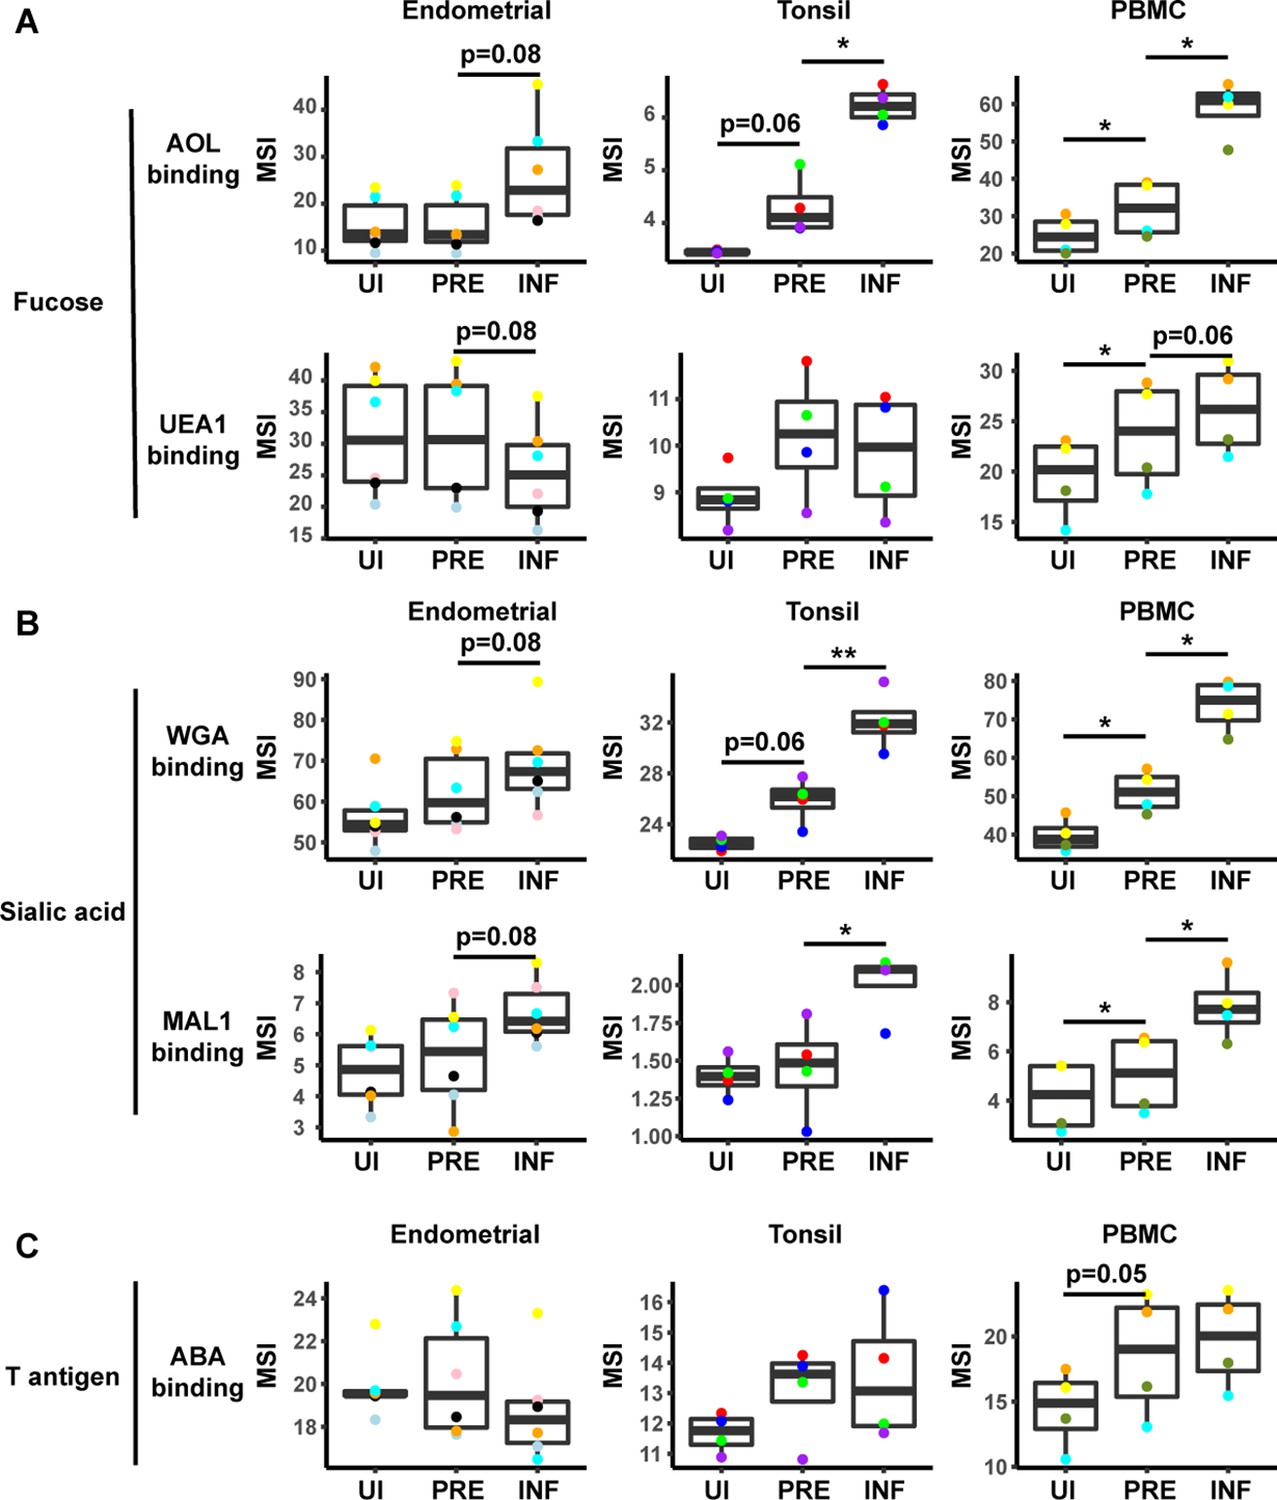
HIV alters expression of fucose and sialic acid in a tissue site-dependent manner.
(A) HIV preferentially infects fucose-expressing cells and further upregulates fucose expression in a tissue site-dependent manner. Box plots showing binding by fucose-binding proteins on uninfected (UI), predicted precursor (PRE), and infected (INF) CD4+ T cells from the endometrium, tonsils, and PBMCs. All populations were pre-gated on live, singlet CD4+ Tm cells. AOL binds total/core fucose, while UEA1 binds α1–2 branched fucose. (B) HIV preferentially infects sialic acid-expressing cells and further upregulates sialic acid in a tissue site-dependent manner. Box plots showing binding by sialic acid-binding lectins. Results are presented as in panel A. WGA binds total sialylated glycans and MAL1 binds α2–3 sialylated glycans. (C) Box plots showing binding by T antigen-binding lectin ABA. Results are presented as in panel A. *p<0.05, **p<0.01 as assessed using the Student’s paired t test and adjusted for multiple testing using the Benjamini-Hochberg for false discovery rate (FDR).
Figure 3—figure supplement 1
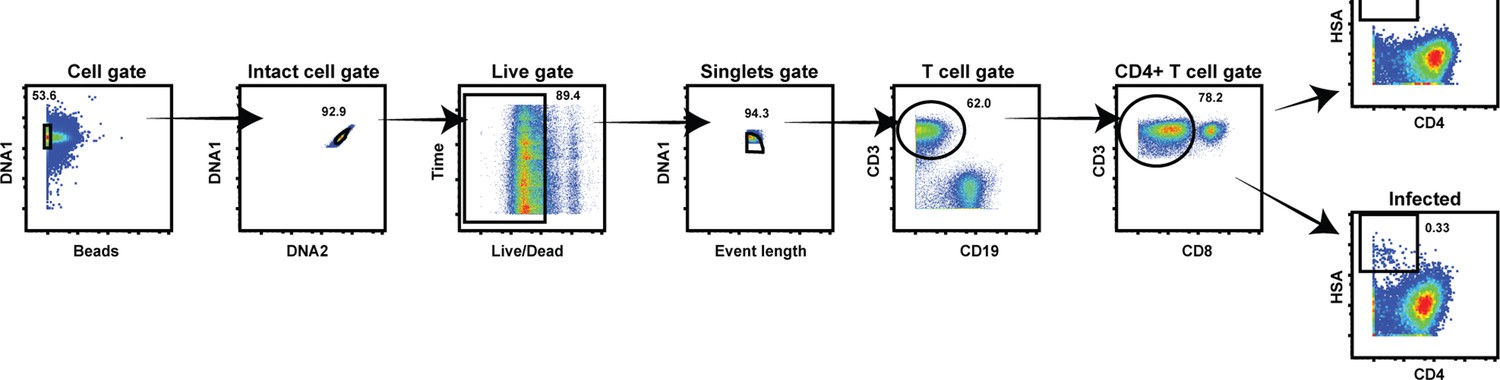
Cytometry by time of flight (CyTOF) gating strategy to identify uninfected and HIV-infected T cells.
Productively infected cells were defined as those that were CD3+ CD8- CD4LowHSA+. The plots on the far right show specimens from a representative uninfected (top) and infected (bottom) sample.
Figure 3—figure supplement 2
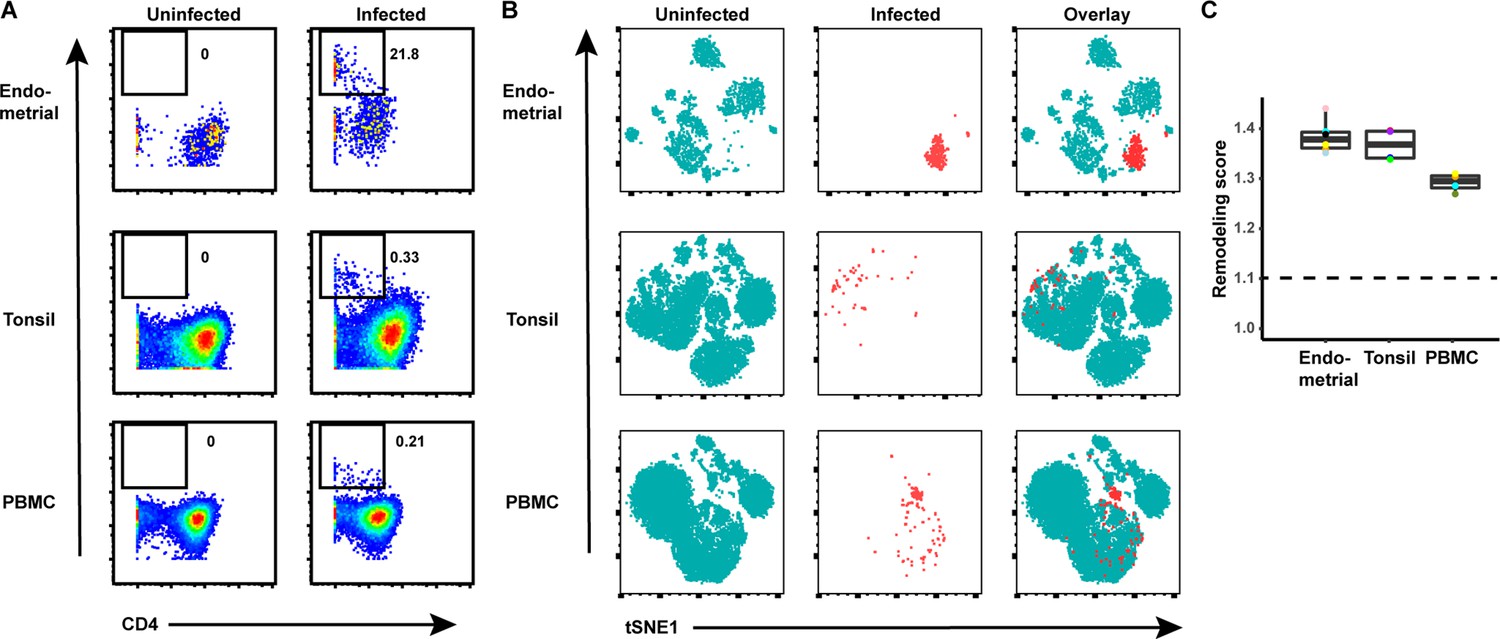
HIV remodels T cells from both tissues and blood.
(A) Cells from each of the indicated specimens from a representative donor were mock-treated or inoculated with the CCR5-tropic HIV-1 reporter virus F4.HSA, and monitored 3 days later for levels of productive infection. Results are gated on live, singlet CD3+ CD8- cells. Numbers correspond to the percentage of infected cells in each sample. (B) t-SNE plots of uninfected and infected cells from all donors combined. The observation that infected cells (red) reside in unique regions of the t-SNEs suggest viral-induced remodeling in all specimen types. Data are representative of a total of four to six donors per specimen type. (C) Quantification of viral-induced remodeling by SLIDE reveals viral-induced remodeling in all specimen types. The dashed line corresponds to the SLIDE score in the absence of remodeling (see Materials and methods).
Figure 3—figure supplement 3

HIV preferentially infects memory CD4+ T cells from both tissues and blood.
(A) Schematic showing how predicted precursor (PRE) cells are identified. Blood or tissue cells, represented as different colored ovals, were mock-treated (top left) or infected with the CCR5-tropic HIV reporter virus F4.HSA (bottom left) for 3 days. HIV-infected cells (identified as those with a black border) were identified as cells expressing HSA that had downregulated CD4 (Figure 3—figure supplement 1). The HIV-infected cells are distinct from cells in the uninfected (UI) culture as they have been remodeled. However, by implementing PRE as determined by single-cell linkage using distance estimation (PP-SLIDE), we identify, in CyTOF high-dimensional space, the phenotypically most similar CD4+ T cells in the uninfected culture (purple and blue cells in schematic) for every HIV-infected cell (red and pink cells in schematic). The ‘PRE‘ cells thus identified display the predicted phenotypes of the original cells targeted for HIV infection, prior to HIV-induced remodeling. (B) t-SNE plots of uninfected and PRE cells demonstrate that CD4+ Tm is the dominant population of T cells targeted for infection in all of the three specimen types. CD4+ Tm, CD4+ Tn, CD8+ Tm, and CD8+ Tn cells were identified by manual gating and colored as indicated. Shown is one representative donor from each site . (C) Quantification of preferential infection of CD4+ Tm cells among all donors reveals enrichment of CD4+ Tm cells among PRE cells. ***p<0.001, ****p<0.0001 as assessed using the Student’s paired t test.
Figure 3—figure supplement 4
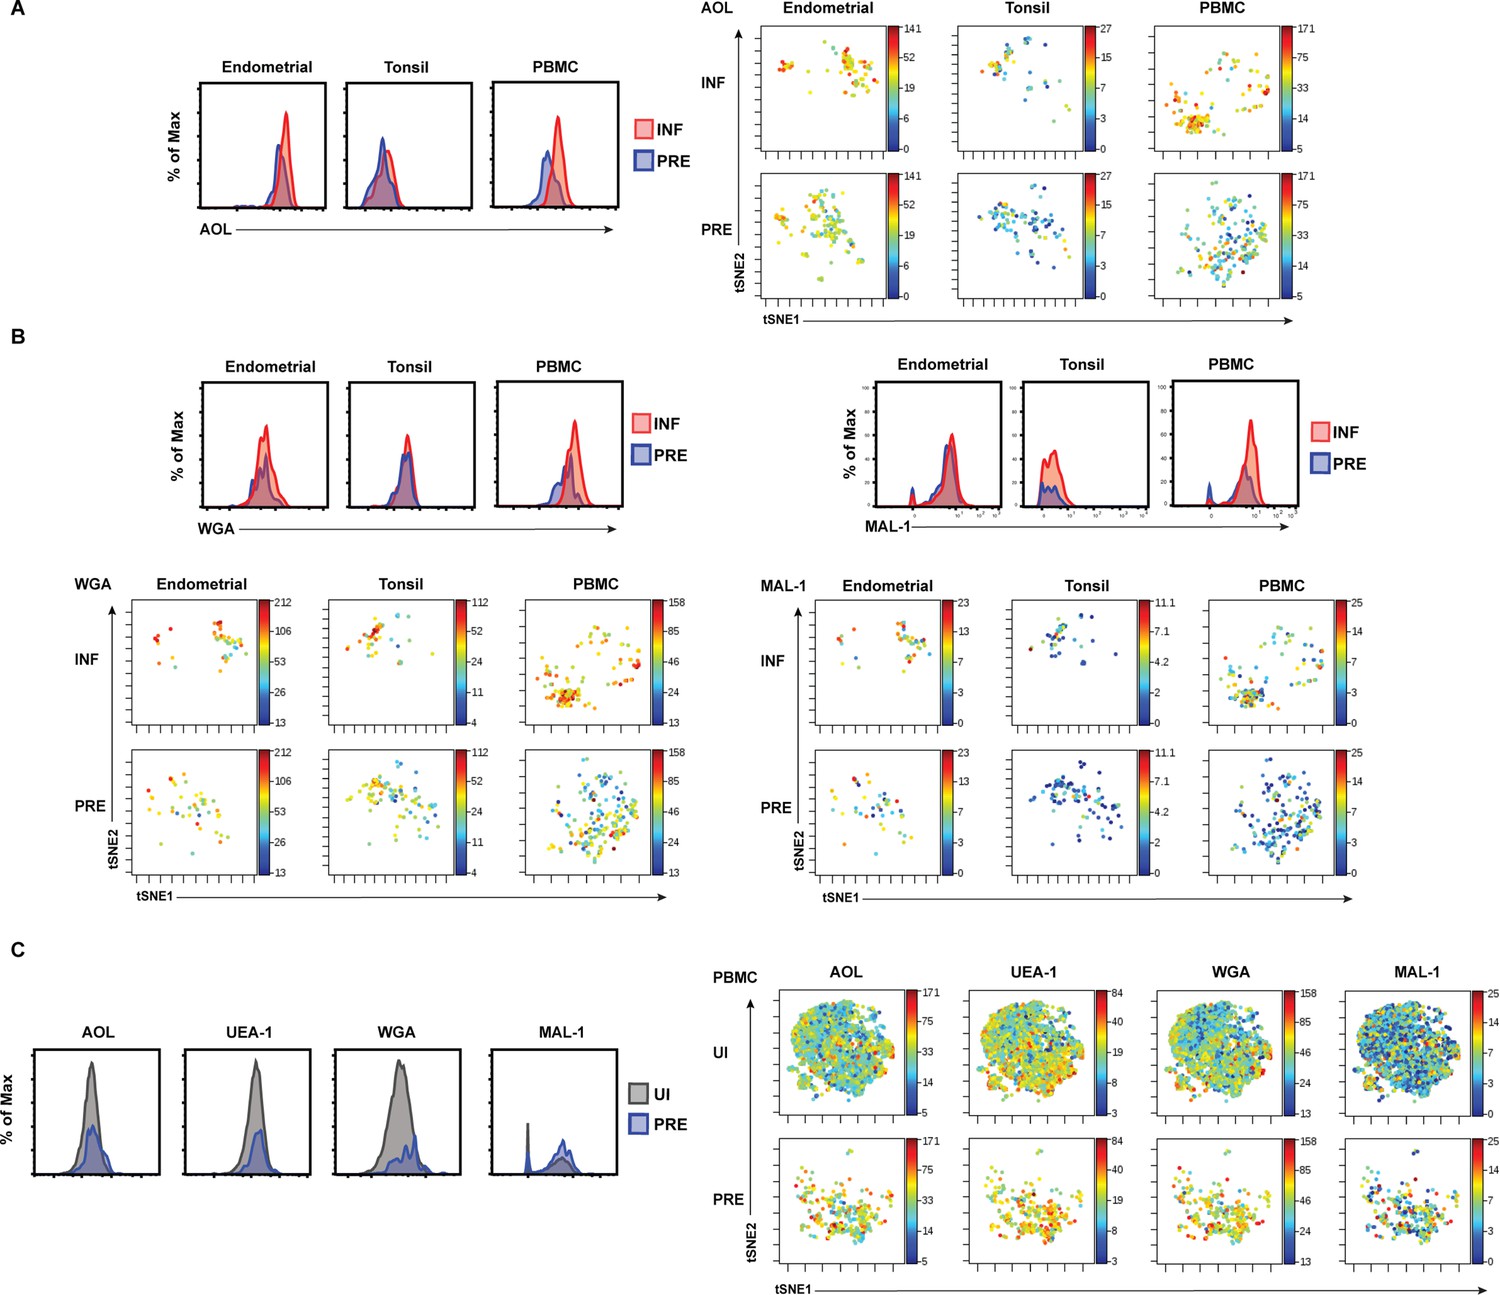
Histogram and t-SNE visualizations of HIV-induced alteration of fucose and sialic acid expression.
(A) HIV infection upregulates fucose expression. Shown are histograms (left) and t-SNE plots (right) depicting as heatmaps AOL binding on uninfected predicted precursor (PRE) and infected (INF) singlet CD4+ Tm cells from the three indicated compartments. (B) HIV infection upregulates sialic acid expression. Shown are histograms (top) and t-SNE plots (bottom) depicting as heatmaps WGA and MAL-1 binding on PRE and INF singlet CD4+ Tm cells from the three indicated compartments. (C) Among PBMCs, HIV preferentially infects CD4+ Tm cells with high levels of fucose and sialic acid. Shown are histograms (left) and t-SNE plots (right) depicting as heatmaps AOL, UEA-1, WGA, and MAL-1 binding on uninfected (UI) and PRE singlet CD4+ Tm cells.
Figure 3—figure supplement 5
HIV infection alters expression of fucose and sialic acid in bystander cells.
(A) HIV infection upregulates fucose expression in bystander cells. Box plots showing binding by fucose-binding proteins on uninfected (UI), bystander (Bys), and infected (INF) CD4+ Tm cells from the endometrium, tonsils, and PBMCs. Bystander CD4+ T cells were defined as CD4+ Tm cells in the infected cultures that did not express the HIV reporter gene HSA. All populations were pre-gated on live, singlet CD4+ Tm cells. AOL binds total/core fucose, while UEA1 binds α1–2 branched fucose. (B) HIV infection upregulates sialic acid in bystander cells. Box plots showing binding by sialic acid-binding lectins. Results are presented as in panel A. WGA binds total sialylated glycans and MAL1 α2–3 sialylated glycans. (C) Box plots showing binding by T antigen-binding lectin ABA. Results are presented as in panel A. *p<0.05 as assessed using the Student’s paired t test and adjusted for multiple testing using the Benjamini-Hochberg for false discovery rate (FDR).
Figure 3—figure supplement 6
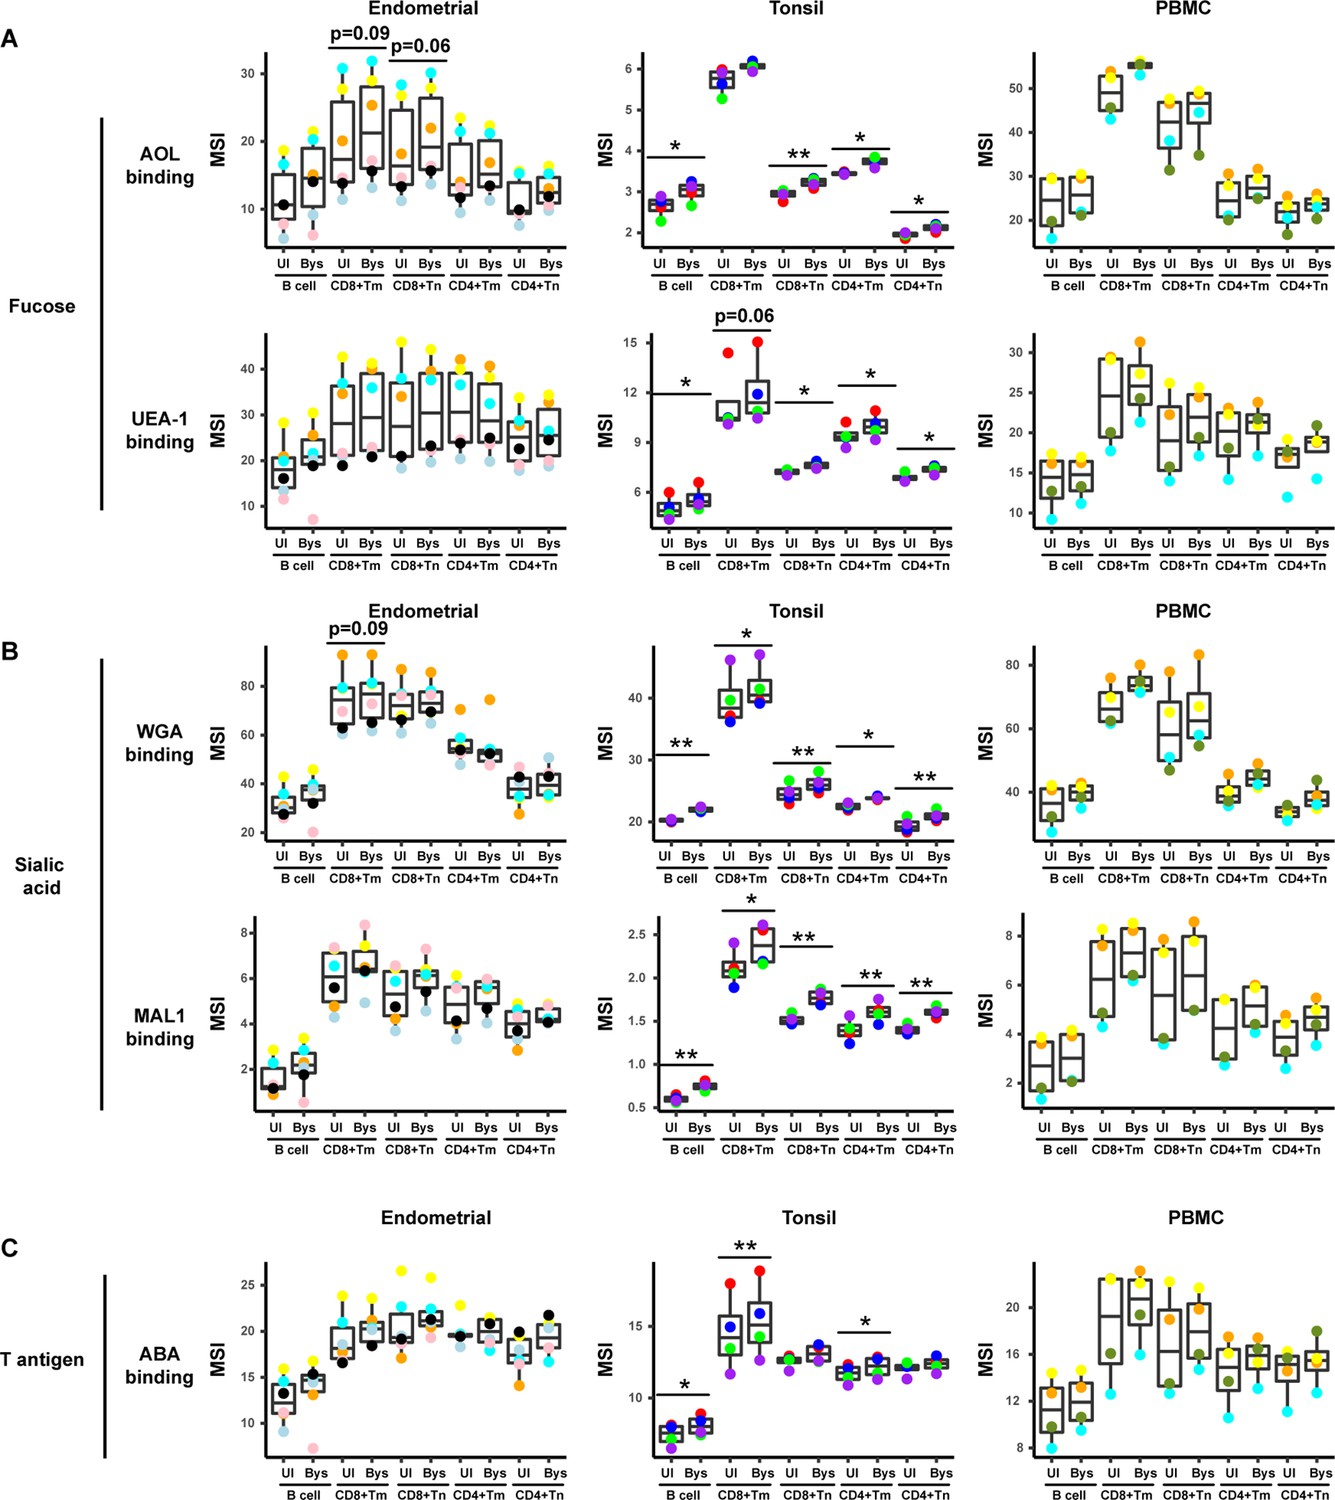
HIV upregulates fucose, sialic acid, and T antigen expression in subsets of bystander cells.
(A) Box plots showing staining by fucose-binding proteins on uninfected (UI) and bystander (Bys) B and T cells from the endometrium, tonsils, and PBMCs. Bystander CD4+ Tm cells were defined as those that did not express the HIV reporter HSA. AOL binds to total/core fucose, and UEA1 binds to α1–2 branched fucose. (B) Box plots showing staining by sialic acid-binding lectins WGA and MAL1. Results are presented as in panel A. WGA binds to total sialylated glycans and MAL-1 binds to α2–3 sialylated glycans. (C) Box plots showing staining by the T antigen-binding lectin ABA. Results are presented as in panel A. Elevation of fucose, sialic acid, and T antigen on Bys relative to UI cells were most apparent in tonsils. *p<0.05, **p<0.01 as assessed using the Student’s paired t test and adjusted for multiple testing using the Benjamini-Hochberg for false discovery rate (FDR). CD8+ Tm: memory CD8+ T cells; CD8+ Tn: naive CD8+ T cells; CD4+ Tm: memory CD4+ T cells; CD4+ Tn: naive CD4+ T cells.
Figure 4

HIV preferentially infects memory CD4+ T cells from tonsils and PBMCs with high levels of fucose and sialic acid.
(A) Gating strategy to identify CD4+ Tm populations expressing different levels of fucose and sialic acid (as detected by AOL and WGA binding, respectively) (B) The proportions of CD4+ Tm cells that were productively infected (as assessed by HSA positivity) are higher among the AOLHigh and WGAHigh cells than among their AOLLow and WGALow counterparts for all three sites. *p<0.05, **p<0.01, and ***p<0.001 as assessed using the Student’s paired t test. Each color corresponds to a different donor. Gates for the depicted populations are shown in panel A. (C) Proportion of uninfected CD4+ Tm and PRE cells expressing high levels of fucose, sialic acid, or both (as determined by high binding by AOL or WGA, respectively), as assessed by manual gating. In tonsils and PBMCs, cells expressing fucose and sialic acid were preferentially selected for infection by HIV. *p<0.05, **p<0.01 as assessed using the Student’s paired t test. (D) Co-expression of fucose and sialic acid on PRE cells in the indicated specimens, as depicted by t-SNE heatmaps. Shown are cells concatenated from all donors analyzed in the study. Regions of the t-SNE co-expressing fucose and sialic acid are circled. (E) Levels of fucose and sialic acid differ between CD4+ Tm cells from different origins, as shown by median signal intensity (MSI) for binding by WGA (sialic acid-binding) and AOL (fucose-binding). *p<0.05, **p<0.01, ***p<0.001, ****p<0.0001 as assessed using a one-way ANOVA and adjusted for multiple testing using the Bonferroni.
Figure 5 with 1 supplement
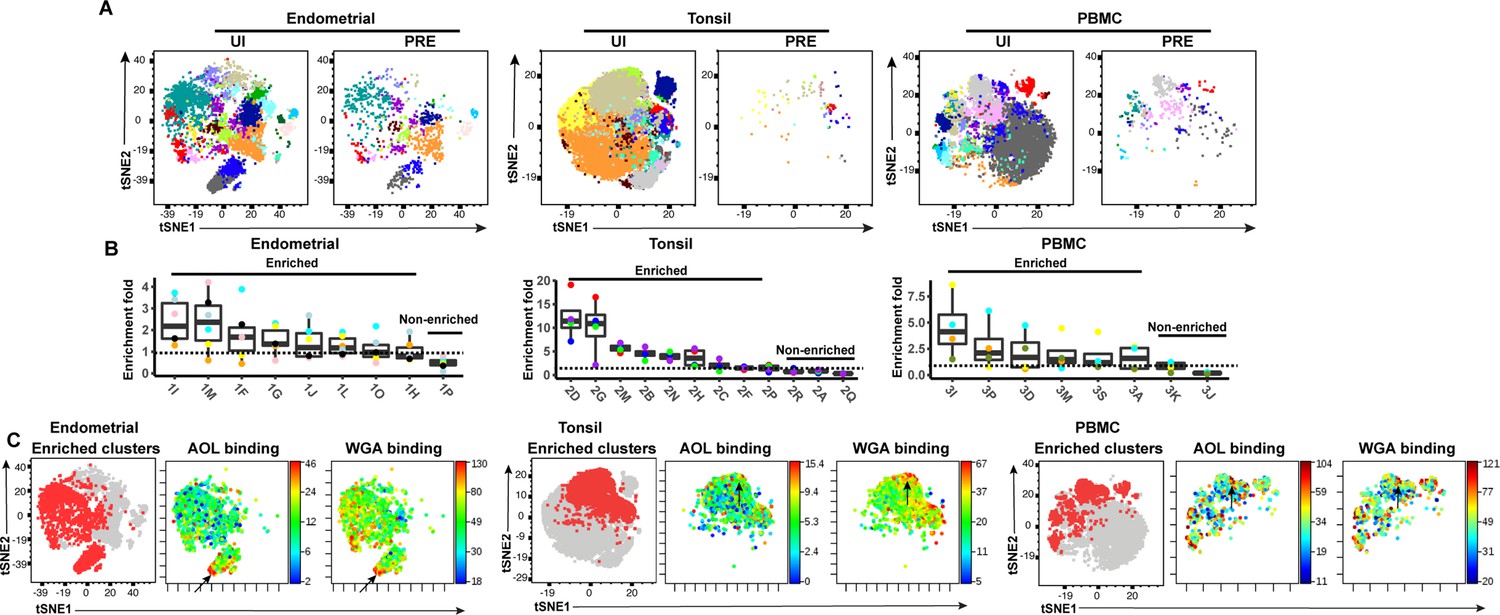
FlowSOM clustering confirms that HIV-susceptible subsets from tonsils and PBMCs harbor high levels of fucose and sialic acid.
(A) t-SNE plots based on FlowSOM analysis of uninfected CD4+ Tm and PRE cells from endometrium, tonsil, and PBMC specimens, showing 20 color-labeled clusters of cells. (B) Enrichment of clusters among PRE cells. PRE enrichment-folds were determined by dividing the sizes of each cluster in PRE cells by that in the corresponding uninfected CD4+ Tm cells. Enriched clusters (those with an enrichment fold above 1) correspond to cells preferentially selected for infection. Note that the highest enrichment-folds were observed in tonsils, suggesting the most preferential selection of subsets for infection in this specimen type. Each color corresponds to a different donor. Labels on the x-axis refer to the cluster name. (C) Clusters enriched among PRE cells express high levels of fucose and sialic acid, as depicted by t-SNE. For each specimen set, the left-hand t-SNE plot depicts clusters enriched among PRE (red) against total cells (gray), while the t-SNE plots on the right depict by heatmaps the expression levels of fucose (as assessed by AOL binding) and sialic acid (as assessed by WGA binding) among the enriched clusters. Note that the enriched clusters from all three sites include cells expressing high levels of both fucose and sialic acid (highlighted by arrows).
Figure 5—figure supplement 1
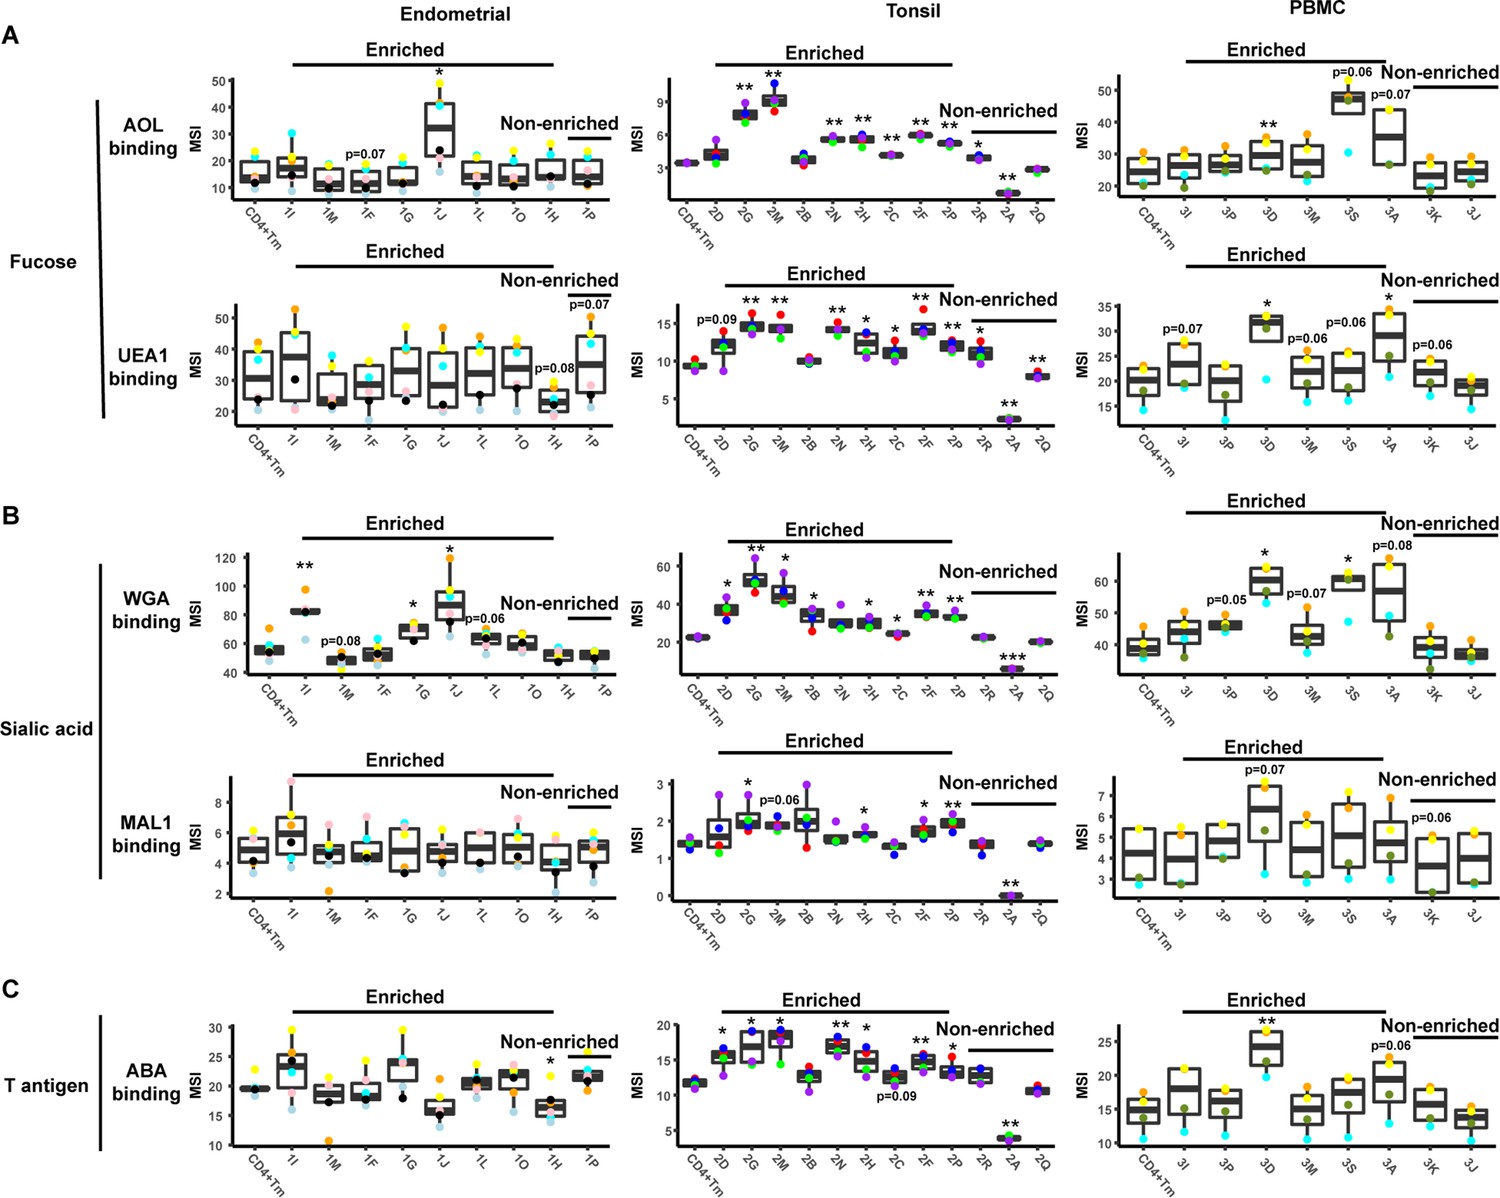
Levels of glycans on FlowSOM-defined clusters.
An enrichment ratio was determined for each cluster by dividing the frequencies of the cells of that cluster among the PRE cells by their frequency among the uninfected CD4+ Tm cells. Clusters with an enrichment ratio above 1 correspond to those preferentially selected for infection. Relative binding by proteins specific for fucose (panel A), sialic acid (panel B), or T antigen (panel C) were assessed by reporting median signal intensity (MSI) of the bound lectins. Enriched clusters included those with high levels of the examined glycans. Total CD4+ Tm cells are shown for comparison. *p<0.05, **p<0.01, ***p<0.001 as assessed using the Student’s paired t test and adjusted for multiple testing using the Benjamini-Hochberg for false discovery rate (FDR), and correspond to statistically significant differences between each cluster and total CD4+ Tm cells.
Figure 6 with 2 supplements
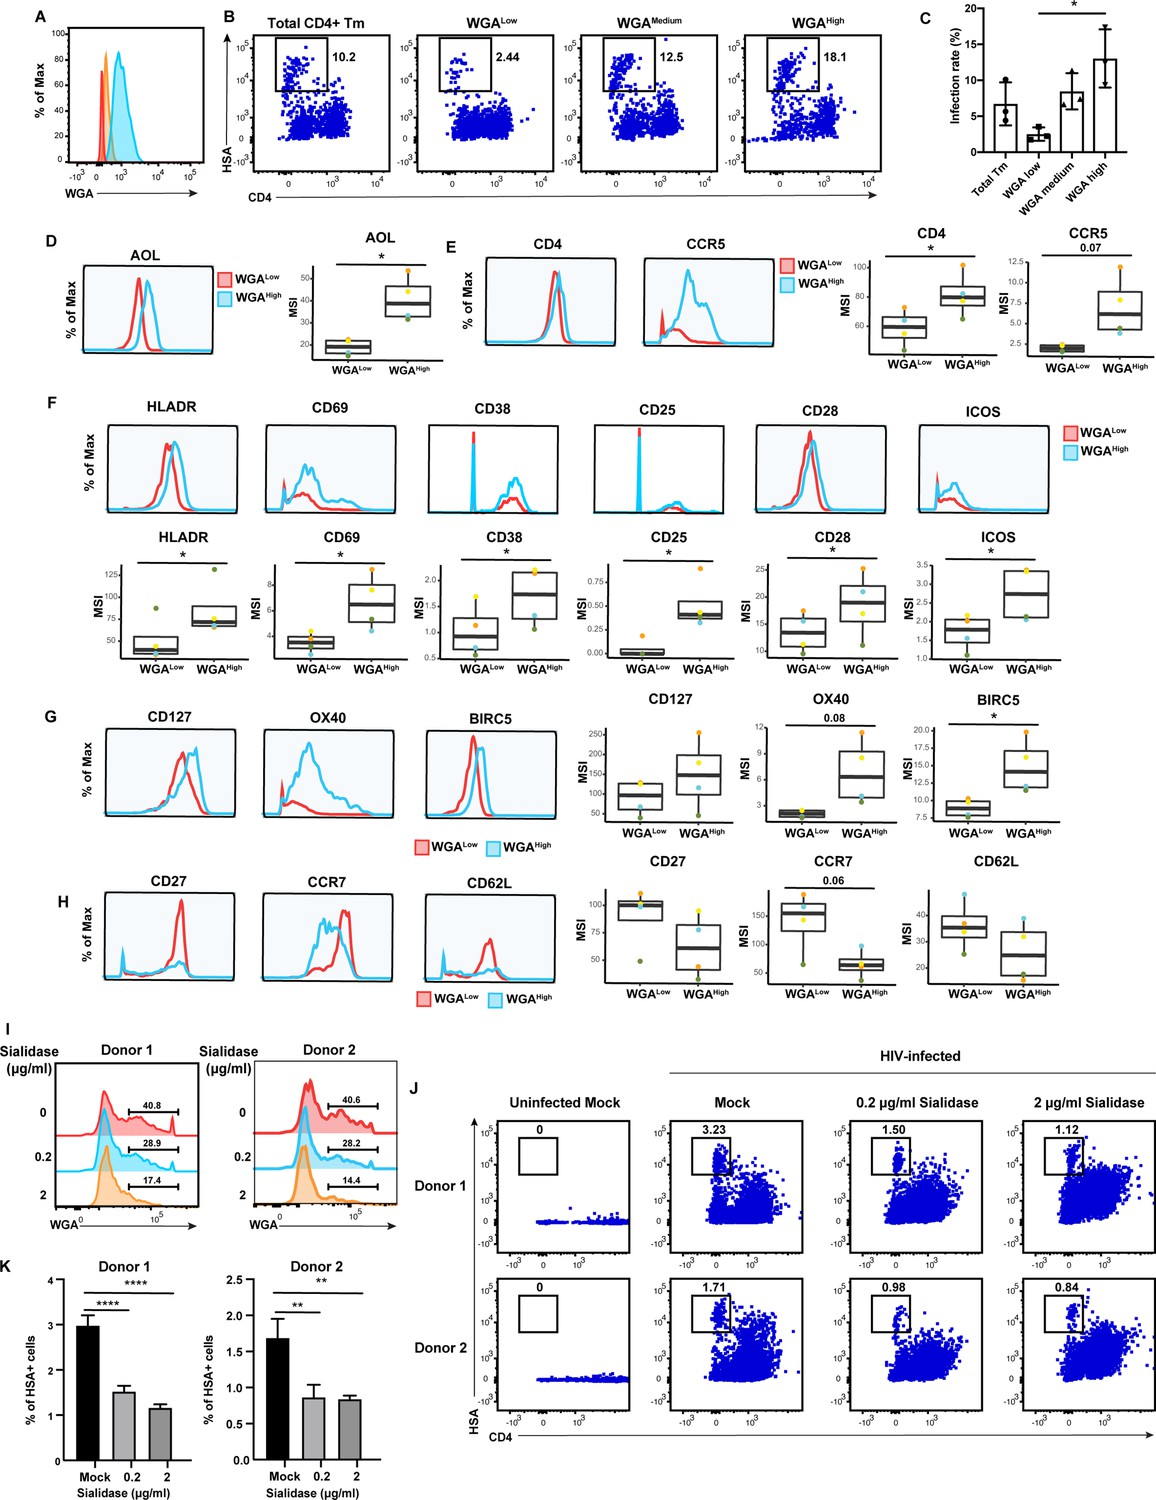
High levels of sialylated glycans identifies highly susceptible and activated CD4+ Tm cells, and plays a direct role in susceptibility.
(A) Histograms showing the expression of total sialylated glycans on three populations (WGALow [red], WGAMedium [yellow], and WGAHigh [blue]) of sorted uninfected CD4+ Tm cells (CD3+ CD4+ CD45RA-), as assessed by WGA binding. One of three representative donors is shown. (B–C) The sorted uninfected CD4+ Tm cells in panel A, along with total CD4+ Tm cells, were exposed to F4.HSA and assessed by flow cytometry for infection rates 3 days later. Results are gated on live, singlet CD3+ CD8- cells. Shown are representative FACS plots from one donor (B) and compiled results from three donors (C). For each donor, experimental duplicates were performed for each condition. Each datapoint shown corresponds to one donor. *p<0.05 as assessed using a one-way ANOVA and adjusted for multiple testing using the Bonferroni. (D) WGAHigh Tm cells bind more AOL than WGALow Tm cells do. Shown are the histogram plots from one representative PBMC donor (left) and box plots from all four PBMC donors (right). (E) WGAHigh Tm cells express more CD4 and CCR5 than WGALow Tm cells do. Shown are the histogram plots from one representative PBMC donor (left) and box plots from all four PBMC donors (right). (F) WGAHigh Tm cells express higher levels of activation markers than WGALow Tm cells do. Shown are the histogram plots from one representative PBMC donor (top) and box plots from all four PBMC donors (bottom). (G) WGAHigh Tm cells express higher levels of the pro-survival factors CD127, BIRC5, and Ox40 than WGALow Tm cells do. Shown are the histogram plots from one representative PBMC donor (left) and box plots from all four PBMC donors (right). (H) The CD127, CCR7, and CD62L receptors are expressed at lower levels in WGAHigh relative to WGALow Tm cells. Shown are the histogram plots from one representative PBMC donor (left) and box plots from all four PBMC donors (right). For panels D–G, *p<0.05 as assessed using the Student’s paired t test and adjusted for multiple testing using the Benjamini-Hochberg for false discovery rate (FDR). (I) Transient treatment with sialidase decreases cell-surface levels of sialidase on CD4+ T cells. PBMCs were treated for 1 hr with sialidase prior to assessment of cell-surface WGA binding. Shown are overlaid histograms demonstrating a decrease in cell-surface sialic acid levels (as reflected by WGA binding) in the sialidase-treated cells from two independent donors. Results are gated on live, singlet CD3+ CD8- CD4+ cells. Numbers correspond to percent of cells within the indicated gate. (J–K) PBMCs treated for 1 hr with the indicated concentrations of sialidase were exposed to F4.HSA and assessed by flow cytometry for infection rates 3 days later. Results are gated on live, singlet CD3+ CD8- cells. Shown are representative FACS plots from two donors (J) and the results of experimental triplicates from each of these donors (K). **p<0.01 and ****p<0.0001 as assessed using a one-way ANOVA and adjusted for multiple testing using the Bonferroni.
Figure 6—figure supplement 1
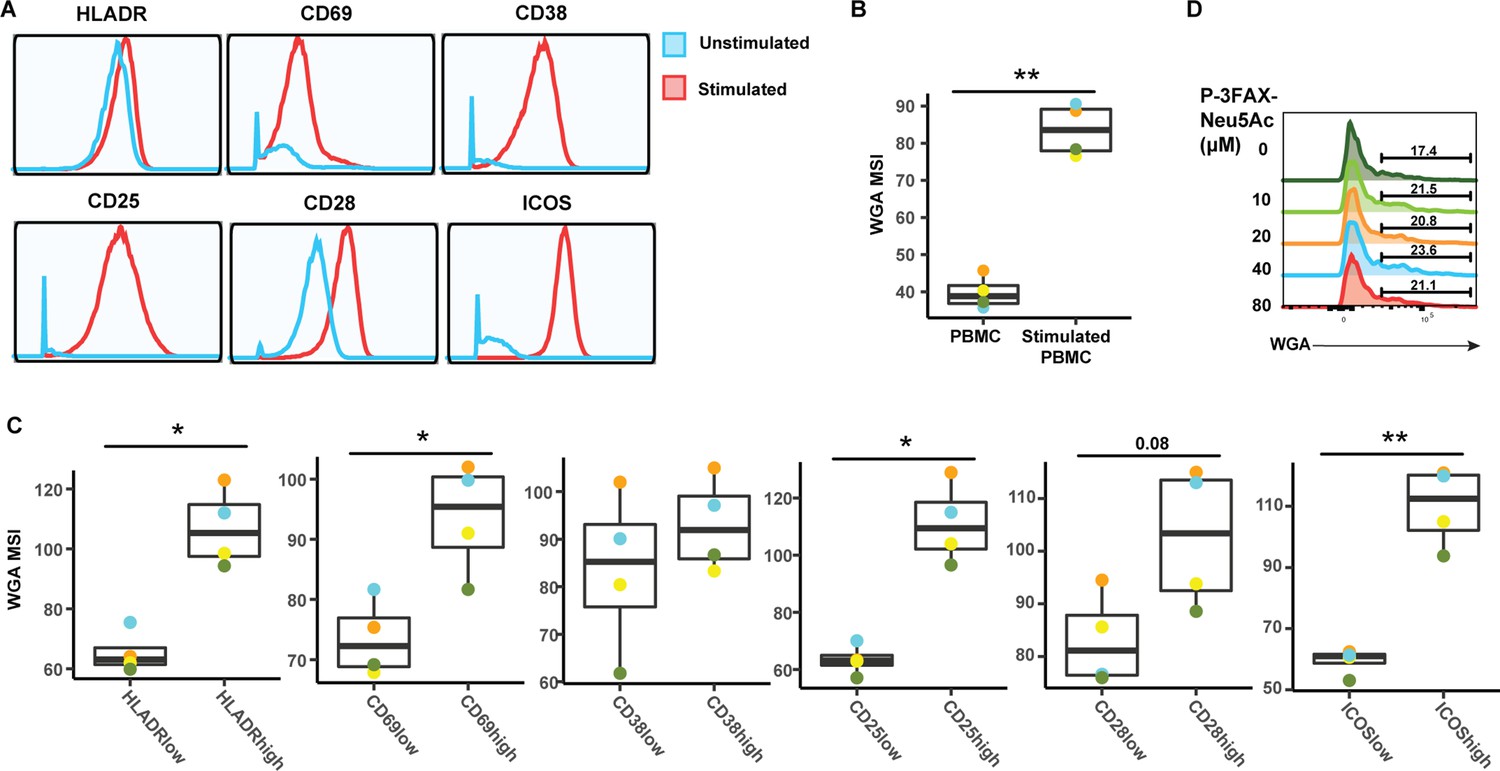
Activated CD4+ Tm cells express high levels of sialic acid.
(A) Histograms showing the expression of activation markers on CD4+ Tm cells from resting (blue) and PHA-stimulated PBMCs (red). One of four representative donors is shown. (B) Stimulated CD4+ Tm cells express more sialic acid than resting CD4+ Tm cells do. Shown are the four PBMC donors. (C) HLADRHigh, CD69High, CD38High, CD38High, CD25High, CD28High, and ICOSHigh CD4+ Tm cells bind more WGA than CD4+ Tm cells expressing low levels of these activation markers. Shown are the four PBMC donors. For panels B–C, *p<0.05, **p<0.01 as assessed using the Student’s paired t test and adjusted for multiple testing using the Benjamini-Hochberg for false discovery rate (FDR). (C) Treatment with the sialic acid synthase inhibitor P-3FZX-Neu5Ac does not decrease cell-surface levels of sialidase on CD4 + T cells. PBMCs were treated for 24 hr with the indicated concentrations of P-3FZX-Neu5Ac prior to assessment of cell-surface WGA binding. Shown are overlaid histograms demonstrating no decrease in cell-surface sialic acid levels (as reflected by WGA binding) in the inhibitor-treated cells. Results are gated on live, singlet CD3+ CD8- CD4+ cells. Numbers correspond to percent of cells within the indicated gate.
Figure 6—figure supplement 2
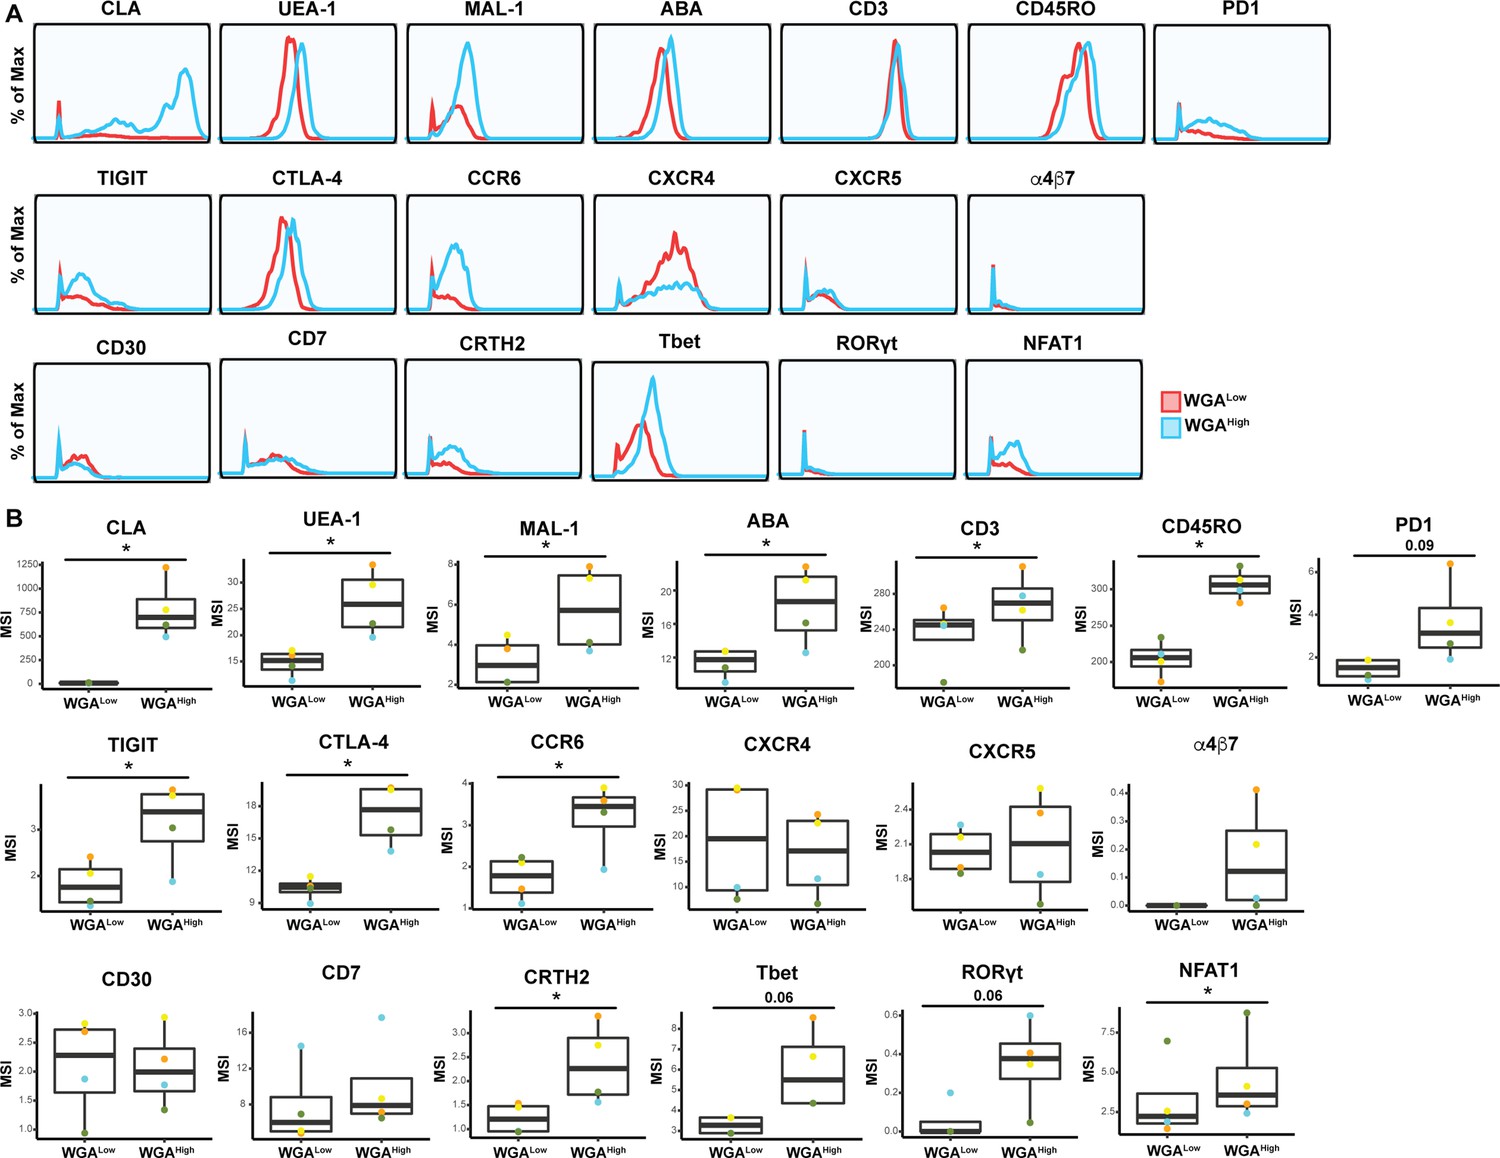
Expression levels of cytometry by time of flight (CyTOF) antigens on WGALow and WGAHigh Tm cells.
Shown are histogram and box plots depicting antibody and lectin staining of the WGALow (red) and WGAHigh (blue) Tm cells. Shown are antigens not already depicted in Figure 6. Data from one of four representative PBMC donors is shown in histogram plots. Data from four independent PBMC donors is shown in box plots. *p<0.05 as assessed using the Student’s paired t test and adjusted for multiple testing using the Benjamini-Hochberg for false discovery rate (FDR).
Author response image 1
Tables
Key resources table
| Reagent type (species) or resource | Designation | Source or reference | Identifiers | Additional information |
|---|---|---|---|---|
| Strain, strain background (Escherichia coli) | Stbl3 | Fisher | C737303 | |
| Cell line (human) | 293T cells | ATCC | CRL-3216 | |
| Biological sample (human) | Endometrial tissue | Women’s Health Clinic of Naval Medical Center Portsmouth (NMCP) | ||
| Biological sample (human) | Tonsil | Cooperative Human Tissue Network (CHTN) | ||
| Biological sample (human) | Blood | Vitalant Research Institute and Stanford Blood Bank | ||
| Peptide, recombinant protein | AOL | TCI Chemicals | Cat# L0169 | CyTOF (1:20) |
| Antibody | Anti-Human CD49d (9F10) (Mouse, Monoclonal) | Fluidigm | Cat# 3141004B | CyTOF (1:200) |
| Antibody | Anti-Human CD195/CCR5 (NP-6G4) (Mouse, Monoclonal) | Fluidigm | Cat# 3144007A | CyTOF (1:50) |
| Antibody | Anti-Human CD8 (RPA-T8) (Mouse, Monoclonal) | Fluidigm | Cat# 3146001B | CyTOF (1:33) |
| Antibody | Anti-Human CD7 (CD7-6B7) (Mouse, Monoclonal) | Fluidigm | Cat# 3147006B | CyTOF (1:200) |
| Antibody | Anti-CD278/ICOS (C398.4A) (Mouse, Monoclonal) | Fluidigm | Cat# 3148019B | CyTOF (1:100) |
| Antibody | Anti-Mouse CD24 (M1/69) (Rat, Monoclonal) | Fluidigm | Cat# 3150009B | CyTOF (1:200) |
| Peptide, recombinant protein | MAL-1 | Vector Laboratories | Cat# L-1310–5 | CyTOF (1:25) |
| Peptide, recombinant protein | WGA | Vector Laboratories | Cat# L-1020–25 | CyTOF (1:15) |
| Antibody | Anti-Human CD62L (DREG-56) (Mouse, Monoclonal) | Fluidigm | Cat# 3153004B | CyTOF (1:50) |
| Antibody | Anti-Human TIGIT (MBSA43) (Mouse, Monoclonal) | Fluidigm | Cat# 3154016B | CyTOF (1:15) |
| Antibody | Anti-Human CD196 (CCR6) (Mouse, Monoclonal) | BD Biosciences | Cat# 559560 | CyTOF (1:25) |
| Peptide, recombinant protein | UEA-1 | Vector Laboratories | Cat# L-1060–5 | CyTOF (1:33) |
| Antibody | Anti-Human CD134/OX40 (ACT35) (Mouse, Monoclonal) | Fluidigm | Cat# 3158012B | CyTOF (1:25) |
| Antibody | Anti-Human CD197/CCR7 (G043H7)- (Mouse, Monoclonal) | Fluidigm | Cat# 3159003A | CyTOF (1:25) |
| Antibody | Anti-Human CD28 (CD28.2) (Mouse, Monoclonal) | Fluidigm | Cat# 3160003B | CyTOF (1:100) |
| Antibody | Anti-human CD45RO (Mouse, Monoclonal) | Biolegend | Cat# 304239 | CyTOF (1:25) |
| Antibody | Anti-Human CD69 (FN50) (Mouse, Monoclonal) | Fluidigm | Cat# 3162001B | CyTOF (1:400) |
| Antibody | Anti-Human CD294/CRTH2 (BM16) (Rat, Monoclonal) | Fluidigm | Cat# 3163003B | CyTOF (1:50) |
| Antibody | Anti-Human CD279 (PD-1) (Mouse, Monoclonal) | BD Biosciences | Cat# 562138 | CyTOF (1:50) |
| Antibody | Anti-Human CD127/IL-7Ra (A019D5) (Mouse, Monoclonal) | Fluidigm | Cat# 3165008B | CyTOF (1:25) |
| Antibody | Anti-Human CXCR5 (CD185) (Rat, Monoclonal) | BD Biosciences | Cat# 552032 | CyTOF (1:50) |
| Antibody | Anti-Human CD27 (L128) (Mouse, Monoclonal) | Fluidigm | Cat# 3167006B | CyTOF (1:100) |
| Antibody | Anti-Human CD30 (Mouse, Monoclonal) | BD Biosciences | Cat# 555827 | CyTOF (1:33) |
| Antibody | Anti-Human CD45RA (HI100) (Mouse, Monoclonal) | Fluidigm | Cat# HI100 | CyTOF (1:200) |
| Antibody | Anti-Human CD3 (UCHT1) (Mouse, Monoclonal) | Fluidigm | Cat# 3170001B | CyTOF (1:100) |
| Peptide, recombinant protein | ABA | Vector Laboratories | Cat# L-1420–2 | CyTOF (1:33) |
| Antibody | Anti-Human CD38 (HIT2) (Mouse, Monoclonal) | Fluidigm | Cat# 3172007B | CyTOF (1:200) |
| Antibody | α4β7 | Gift from E Butcher | CyTOF (1:100) | |
| Antibody | Anti-Human CD4 (SK3) (Mouse, Monoclonal) | Fluidigm | Cat# 3174004B | CyTOF (1:50) |
| Antibody | Anti-Human CD184/CXCR4 (12G5) (Mouse, Monoclonal) | Fluidigm | Cat# 3175001B | CyTOF (1:50) |
| Antibody | Anti-Human CD25 (Mouse, Monoclonal) | BD Biosciences | Cat# 555430 | CyTOF (1:300) |
| Antibody | Anti-human/mouse Cutaneous Lymphocyte Antigen (CLA) Antibody (Rat, Monoclonal) | Biolegend | Cat# 321302 | CyTOF (1:50) |
| Antibody | HLA-DR Monoclonal Antibody (TU36), Qdot 655 (Mouse, Monoclonal) | Thermo Fisher | Cat# Q22158 | CyTOF (1:50) |
| Antibody | ROR gamma (t) (Rat, Monoclonal) | Thermo Fisher | Cat# 14-6988-82 | CyTOF (1:25) |
| Antibody | Anti-Human NFAT1 (Rat, Monoclonal) | Fluidigm | Cat# 3143023A | CyTOF (1:100) |
| Antibody | Human Survivin Antibody (Mouse, Monoclonal) | R&D Systems | Cat# MAB886 | CyTOF (1:15) |
| Antibody | T-bet Monoclonal Antibody (Mouse, Monoclonal) | Thermo Fisher | Cat# 14-5825-82 | CyTOF (1:25) |
| Antibody | CD152 (CTLA-4) Monoclonal Antibody (Mouse, Monoclonal) | Thermo Fisher | Cat# 14-1529-82 | CyTOF (1:50) |
| Commercial assay or kit | Lenti-X p24Gag Rapid Titer Kit | Takara | Cat# 632200 | |
| Commercial assay or kit | EasySep CD4 enrichment kit | Stem Cell Technologies | ||
| Commercial assay or kit | CD45RA MicroBeads, human | Miltenyi Biotec | ||
| Commercial assay or kit | Zombie Aqua Fixable Viability Kit | Biolegend | Cat# 423102 | FACS (1:100) |
| Antibody | APC/Cyanine7 anti-human CD3 Antibody (Mouse, Monoclonal) | Biolegend | Cat# 344818 | FACS (1:100) |
| Antibody | PE/Cyanine7 anti-human CD4 Antibody (Rat, Monoclonal) | Biolegend | Cat# 357410 | FACS (1:100) |
| Antibody | APC anti-human CD8 Antibody (Mouse, Monoclonal) | Biolegend | Cat# 344722 | FACS (1:100) |
| Antibody | FITC Rat Anti-Mouse CD24 (Rat, Monoclonal) | BD Biosciences | Cat# 561777 | FACS (1:100) |
| Software, algorithm | CyTOF software (6.7.1014) | Fluidigm | ||
| Software, algorithm | FlowJo software (10.7.2) | FlowJo LLC, BD Biosciences | ||
| Software, algorithm | Cytobank (9.1, 2022) | Cytobank, Inc. |
Additional files
-
MDAR checklist
- https://cdn.elifesciences.org/articles/78870/elife-78870-mdarchecklist1-v1.docx
-
Supplementary file 1
Supplementary tables.
- https://cdn.elifesciences.org/articles/78870/elife-78870-supp1-v1.docx
Download links
A two-part list of links to download the article, or parts of the article, in various formats.
Downloads (link to download the article as PDF)
Open citations (links to open the citations from this article in various online reference manager services)
Cite this article (links to download the citations from this article in formats compatible with various reference manager tools)
Single-cell glycomics analysis by CyTOF-Lec reveals glycan features defining cells differentially susceptible to HIV
eLife 11:e78870.
https://doi.org/10.7554/eLife.78870


