Overcoming the cytoplasmic retention of GDOWN1 modulates global transcription and facilitates stress adaptation
- School of Life Sciences, Lanzhou University, China
- Cuiying Honors College, Lanzhou University, China
- Key Laboratory of Cell Activities and Stress Adaptations, Ministry of Education, Lanzhou University, China
Figures
Figure 1 with 1 supplement

Detection of the subcellular localization of GDOWN1 or BiFC signal between GDOWN1 and some transcription related factors.
(A) The ectopically expressed human GDOWN1 in HeLa cells was stringently localized in the cytoplasm. Human GDOWN1 proteins fused with indicated tags, including a fluorescent tag at either terminus, a Flag tag alone or together with two NLS motifs, were ectopically expressed in HeLa cells and the subcellular localization was detected by directly monitoring the fluorescent signal or by immunofluorescence assays (IF) using an anti-FLAG antibody. (B) The endogenous human or mouse GDOWN1 was stringently located in the cytoplasm. Each indicated cell line was fractionated to separate the cytosol from the nuclei, and the cytoplasmic fraction, C,the nuclear fraction, N, and the whole cell lysate, T (total), were further detected by WB. α-TUBULIN and FBL (a nucleolus protein) were used as markers of the cytoplasmic and nuclear fractions, respectively. (C) GDOWN1 remained in the cytoplasm upon LMB treatment. The indicated cell lines were subjected to either mock or LMB treatment (detailed below) before further fractionation and WB analyses. (D) BiFC analyses of the protein-protein interactions between GDOWN1 and its potential binding partners. (E) BiFC analyses of the protein-protein interactions between NEFL-E•NEFL-A, SPT4•SPT5, GDOWN1•GDOWN1 or 3xNLS-GDOWN1•3xNLS-GDOWN1. Proteins of interest were cloned and fused with either VN (the N-terminus of Venus) or YC (the C-terminus of YFP), and each of the indicated pair of plasmids was co-transfected into HeLa cells, and the confocal microscopy images were acquired 24 hr post transfection. The LMB treatment was carried out at 20 nM final concentration for 6 hr and the mock treatment was done with an equal volume of ethanol in parallel. Nuclear DNA was stained by Hoechst 33342. scale bars—30 μm. Without further labeled with details, the GDOWN1 antibody used in WB assays was the one generated from rabbits.
-
Figure 1—source data 1
Raw data of WB for Figure 1B and C.
- https://cdn.elifesciences.org/articles/79116/elife-79116-fig1-data1-v1.zip
Figure 1—figure supplement 1
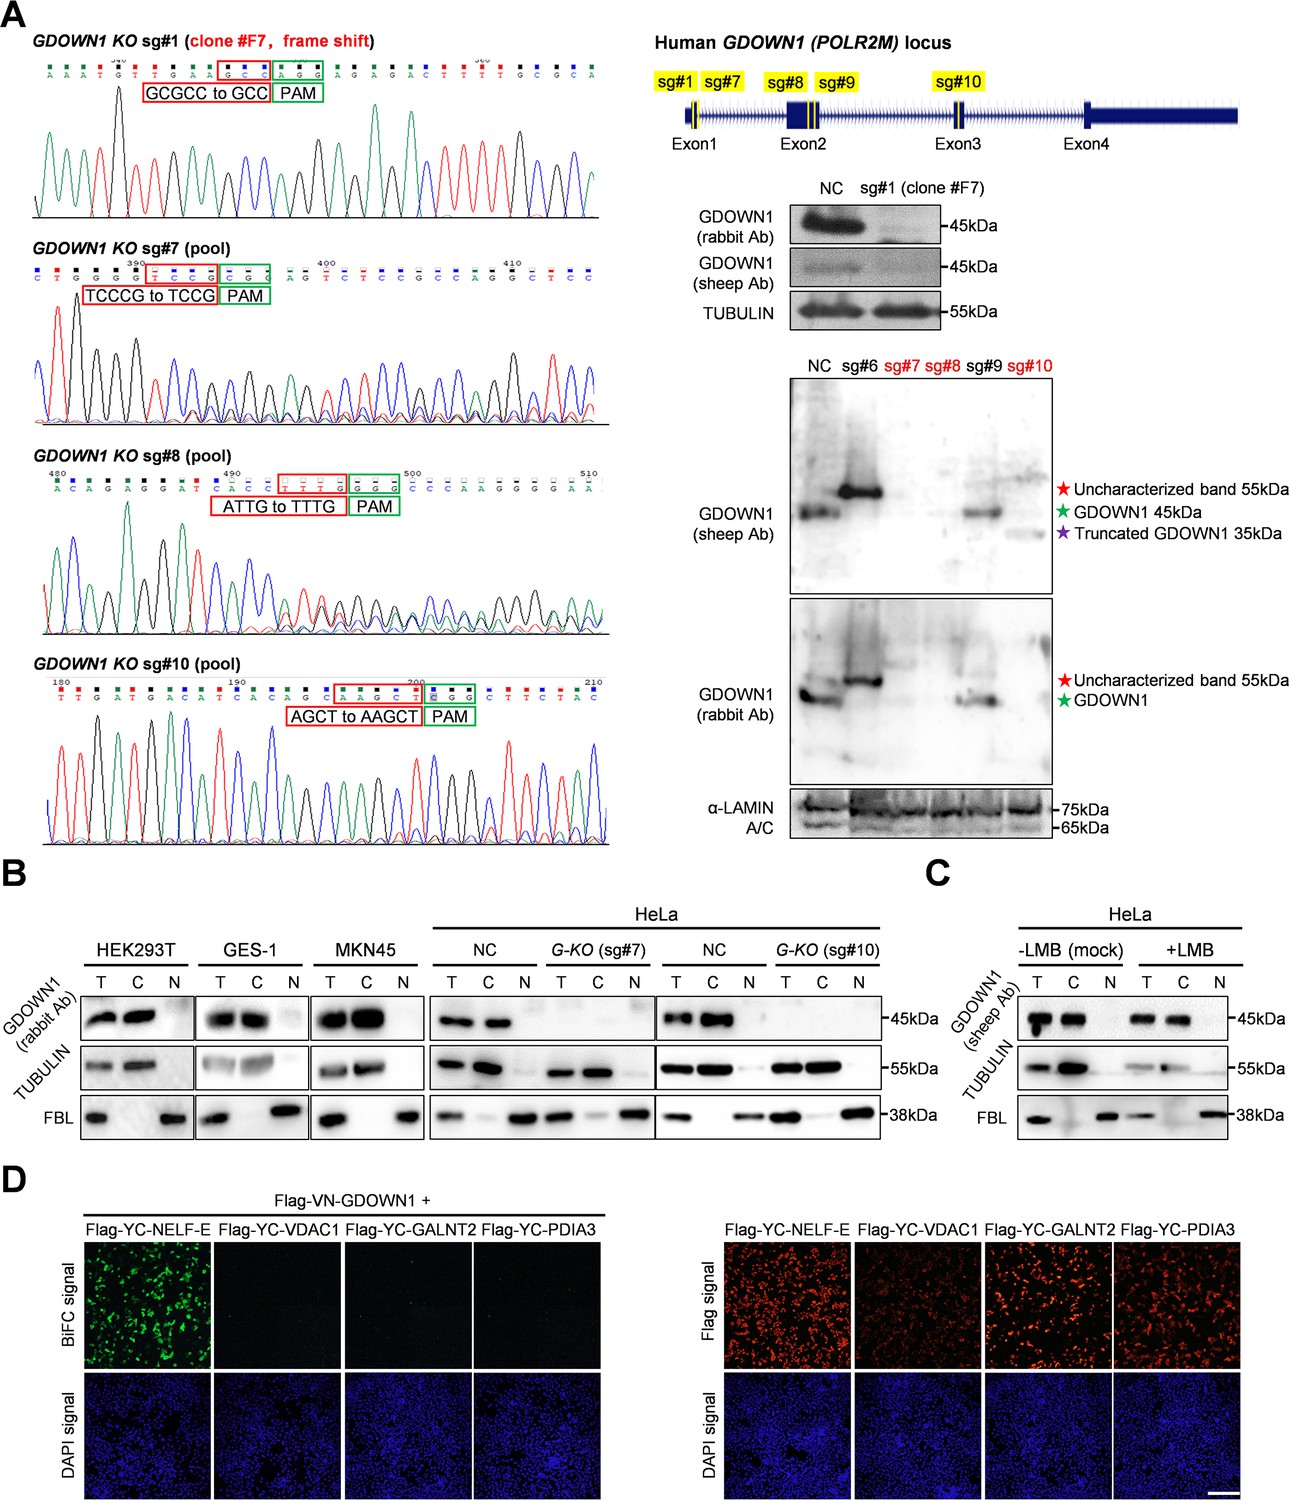
Verification of GDOWN1 KO cell lines and the negative control of BiFC system.
(A) Verification of the GDOWN1 antibodies and the GDOWN1 KO cell lines used in this study and the extension data for Figure 1B–E.Human GDOWN1 locus and the targeting positions of sg#1, #7, #8, #9, and #10 are shown as yellow bars. HeLa cells were transfected with pX459-sg#1, sg#7, sg#8,sg#9, or sg#10 plasmid, respectively, and subjected to puromycin selection. The survived cells were subjected to the genomic DNA isolation, PCR amplification and sanger sequencing. Part of the sequencing results surrounding the cleavage sites in the indicated samples are shown as screenshots of the chromas images, with PAM sites marked in green boxes and the edited sequences at the cleavage sites marked in the red boxes. Clone #F7 was a single colony selected from pX459-sg#1 transfection and the rest samples were cell pools collected after pX459-sg#7, sg#8, sg#9, or sg#10 transfection and selection. All the samples were also verified via WB using two GDOWN1 antibodies generated from rabbits or sheep, respectively, shown on the right. (B) The cell fractionation and the following WB analyses were carried in the same way as previously described in Figure 1B. (C) HeLa cells were subjected to either mock or LMB treatment (as described in Figure 1) before further fractionation. WB analyses were carried out to check the subcellular localization of GDOWN1 using a GDOWN1 antibody generated from sheep. D. Negative controls of the BiFC analyses. Left panel: BiFC results between GDOWN1 and the indicated cytoplasmic proteins. Right panel: IF detection of the expression of the cytoplasmic proteins in the transfected HeLa cells using a Flag antibody. Cell transfection, sample handling, and the acquisition of the confocal images were the same as described in Figure 1E. scale bars—400 μm.
-
Figure 1—figure supplement 1—source data 1
Raw data of WB for Figure 1—figure supplement 1A.
- https://cdn.elifesciences.org/articles/79116/elife-79116-fig1-figsupp1-data1-v1.zip
-
Figure 1—figure supplement 1—source data 2
Raw data of WB for Figure 1—figure supplement 1B.
- https://cdn.elifesciences.org/articles/79116/elife-79116-fig1-figsupp1-data2-v1.zip
-
Figure 1—figure supplement 1—source data 3
Raw data of WB for Figure 1—figure supplement 1C.
- https://cdn.elifesciences.org/articles/79116/elife-79116-fig1-figsupp1-data3-v1.zip
Figure 2 with 1 supplement
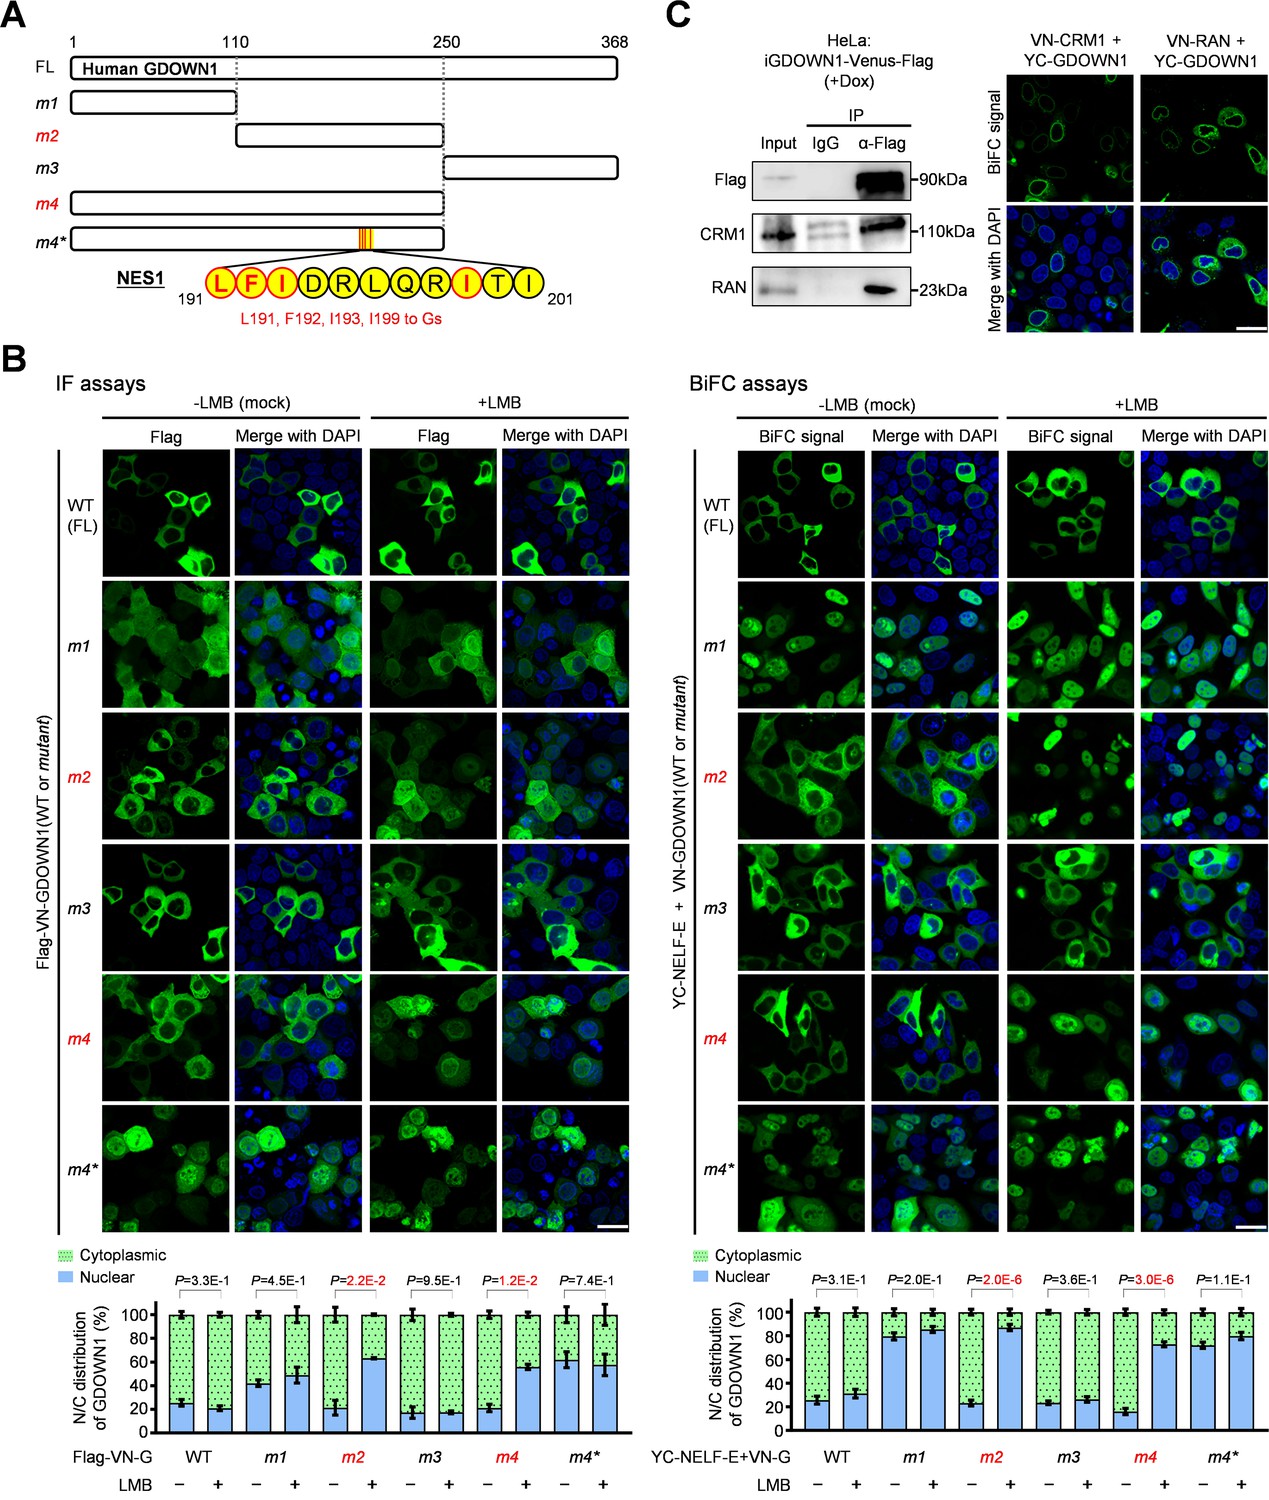
Identification of the Nuclear Export Signal (NES) motifs in GDOWN1.
(A) A diagram of human GDOWN1 and its mutants used in the IF or BiFC-based motif screening analyses. The mutants whose names are marked in red are the ones translocated into the nucleus in response to LMB treatment. The sequences of the identified NES motifs are shown in yellow circles and the positions are labled on each side, and the core amino acids selected for mutagenesis are highlighted in red. (B) Identification of the NES motifs in GDOWN1 via IF or BiFC-based screening analyses. Left panel: HeLa cells were transiently transfected with a plasmid carrying Flag- WT or mutant GDOWN1 as indicated, and further subjected to either mock or LMB treatment, the subcellular localization was detected by IF using a Flag antibody; Right panel: HeLa cells were transiently transfected with two BiFC plasmids, YC-NELF-E and VN-WT or mutant GDOWN1 as indicated (VN—the N-terminus of Venus; YC—the C-terminus of YFP), and further subjected to either mock or LMB treatment before signal detection by a confocal microscope. The nucleocytoplasmic distribution of the fluorescent signals was quantified using ImageJ and shown at the bottom. The P values were calculated via a t-test using the built-in tools in Graphpad Prism8, n≥2, significant: P<0.05. (C) Detection of the interaction between GDOWN1 and CRM1 or RAN by IP-WB or BiFC assays. Left panel: HeLa cells stably expressed GDOWN1-Venus-Flag were employed for IP experiment using a Flag antibody or IgG and further detected by WB with the indicated antibodies; Right panel: BiFC analyses of GDOWN1•CRM1/RAN interactions. HeLa cells were transfected with YC-GDOWN1 and VN-CRM1 or RAN. The LMB treatment was carried out at a final concentration of 20 nM for 6 hr and the mock treatment was done with an equal volume of ethanol in parallel. The nuclear DNA was stained with Hoechst 33342. scale bars—30 μm.
-
Figure 2—source data 1
Raw data used for the statistical analyses presented in Figure 2B.
- https://cdn.elifesciences.org/articles/79116/elife-79116-fig2-data1-v1.zip
-
Figure 2—source data 2
Raw data of WB for Figure 2C.
- https://cdn.elifesciences.org/articles/79116/elife-79116-fig2-data2-v1.zip
Figure 2—figure supplement 1

Detection of the subcellular localization of the indicated GDOWN1 mutants.
(A) The secondary structural prediction of human GDOWN1 using PSIPRED (http://bioinf.cs.ucl.ac.uk/psipred/). (B) Detection of the subcellular localization of GDOWN1(wild type or mutants)-Venus. HeLa cells were transiently transfected with the indicated plasmids, induced by 2.5 μg/mL Dox for 12 hr, further subjected to either mock or LMB treatment, and detected by a confocal microscope. The nucleocytoplasmic distribution of the fluorescent signals was quantified using ImageJ and shown at the bottom. The P values were calculated via a t-test using the built-in tools in Graphpad Prism8, n=2, significant: P<0.05. (C) Identification of the NES1 motif in the BiFC reporter system as described in Figure 2B. The details for the truncation mutants used are shown on the top. The nucleocytoplasmic distribution of the fluorescent signals was quantified using ImageJ and shown at the bottom. The P values were calculated via a t-test using the built-in tools in Graphpad Prism8, n=4, significant: P<0.05. The nuclear DNA was stained by Hoechst 33342. scale bars—30 μm.
-
Figure 2—figure supplement 1—source data 1
Raw data used for the statistical analyses presented in Figure 2—figure supplement 1B.
- https://cdn.elifesciences.org/articles/79116/elife-79116-fig2-figsupp1-data1-v1.zip
-
Figure 2—figure supplement 1—source data 2
Raw data used for the statistical analyses presented in Figure 2—figure supplement 1C.
- https://cdn.elifesciences.org/articles/79116/elife-79116-fig2-figsupp1-data2-v1.zip
Figure 3 with 2 supplements
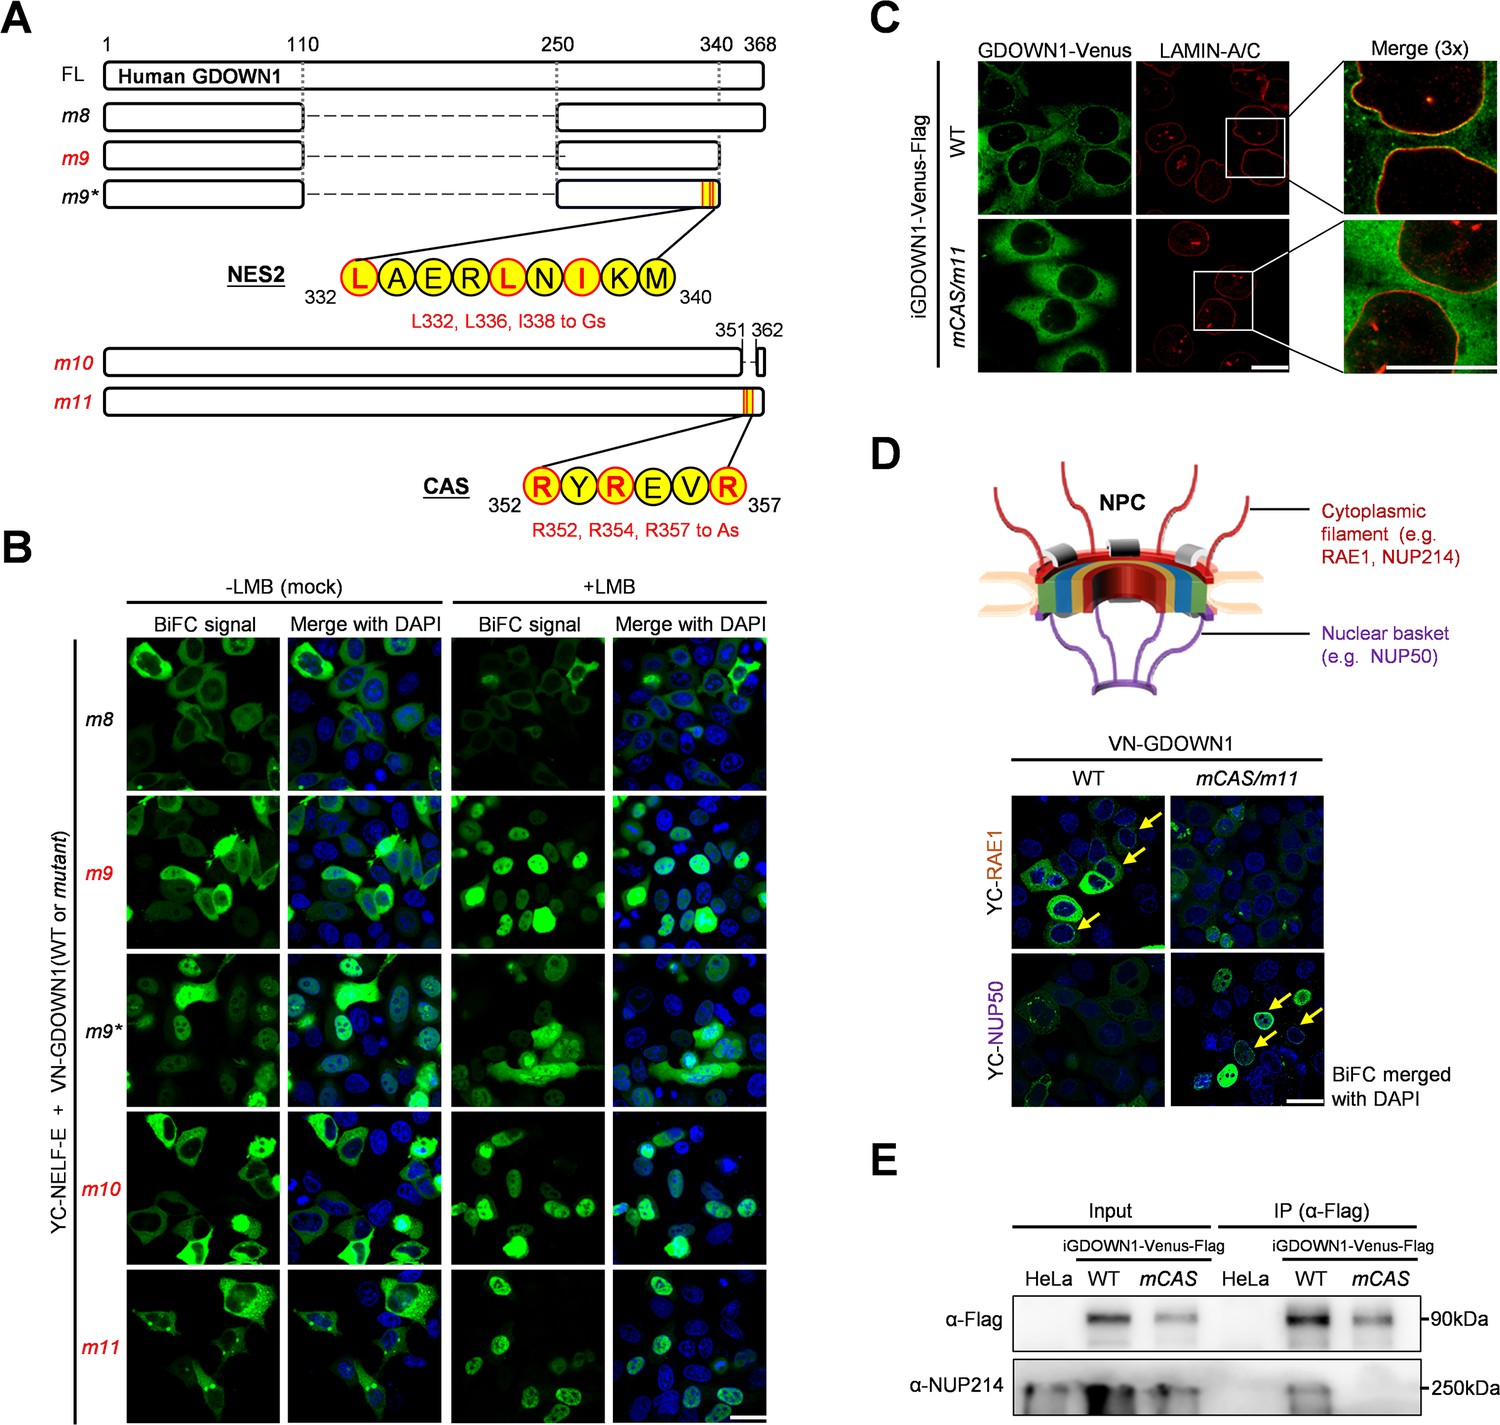
Identification and mechanistic analyses of the Cytoplasmic Anchoring Signal (CAS) motif in GDOWN1.
(A) A diagram of human GDOWN1 and its mutants used in the BiFC-based motif screening analyses. The mutants whose names are marked in red are the ones translocated into the nucleus in response to LMB treatment. The sequences of the identified NES or CAS motif are shown in yellow circles and the core amino acids selected for mutagenesis are highlighted in red. (B) Identification of the second NES and the CAS motif in GDOWN1 via BiFC-based screening analyses. The experiments were carried out in the same way as described in Figure 2B. (C) The enrichment of GDOWN1 at the nuclear pore region was regulated by the CAS motif. HeLa cells stably expressing the wild type GDOWN1 (WT-Venus) or the CAS mutant (mCAS-Venus) were used for detection. The nuclear membrane was approximately represented via IF using an antibody against the nuclear lamina (α-LAMIN-A/C). Confocal Images were collected and further zoomed in for 3 folds to show more details of the nuclear membranes. (D) BiFC analyses of the interactions between GDOWN1 and some subunits of NPC in HeLa cells. Upper panel: a simplified diagram of an NPC; lower panel: BiFC results between GDOWN1 (or its CAS mutant) and the indicated NPC components. (E) Detection of the interaction between GDOWN1 and NUP214 by IP-WB. Parental Hela cells or HeLa cells stably expressed GDOWN1(WT or mCAS)-Venus-Flag were employed in IP experiment using a Flag antibody and further detected by WB with indicated antibodies. The LMB treatment was carried out as previously described. The nuclear DNA was stained with Hoechst 33342. The scale bars represent 30 μm except for the ones in C represent 15 μm.
-
Figure 3—source data 1
Raw data of WB for Figure 3E.
- https://cdn.elifesciences.org/articles/79116/elife-79116-fig3-data1-v1.zip
Figure 3—figure supplement 1
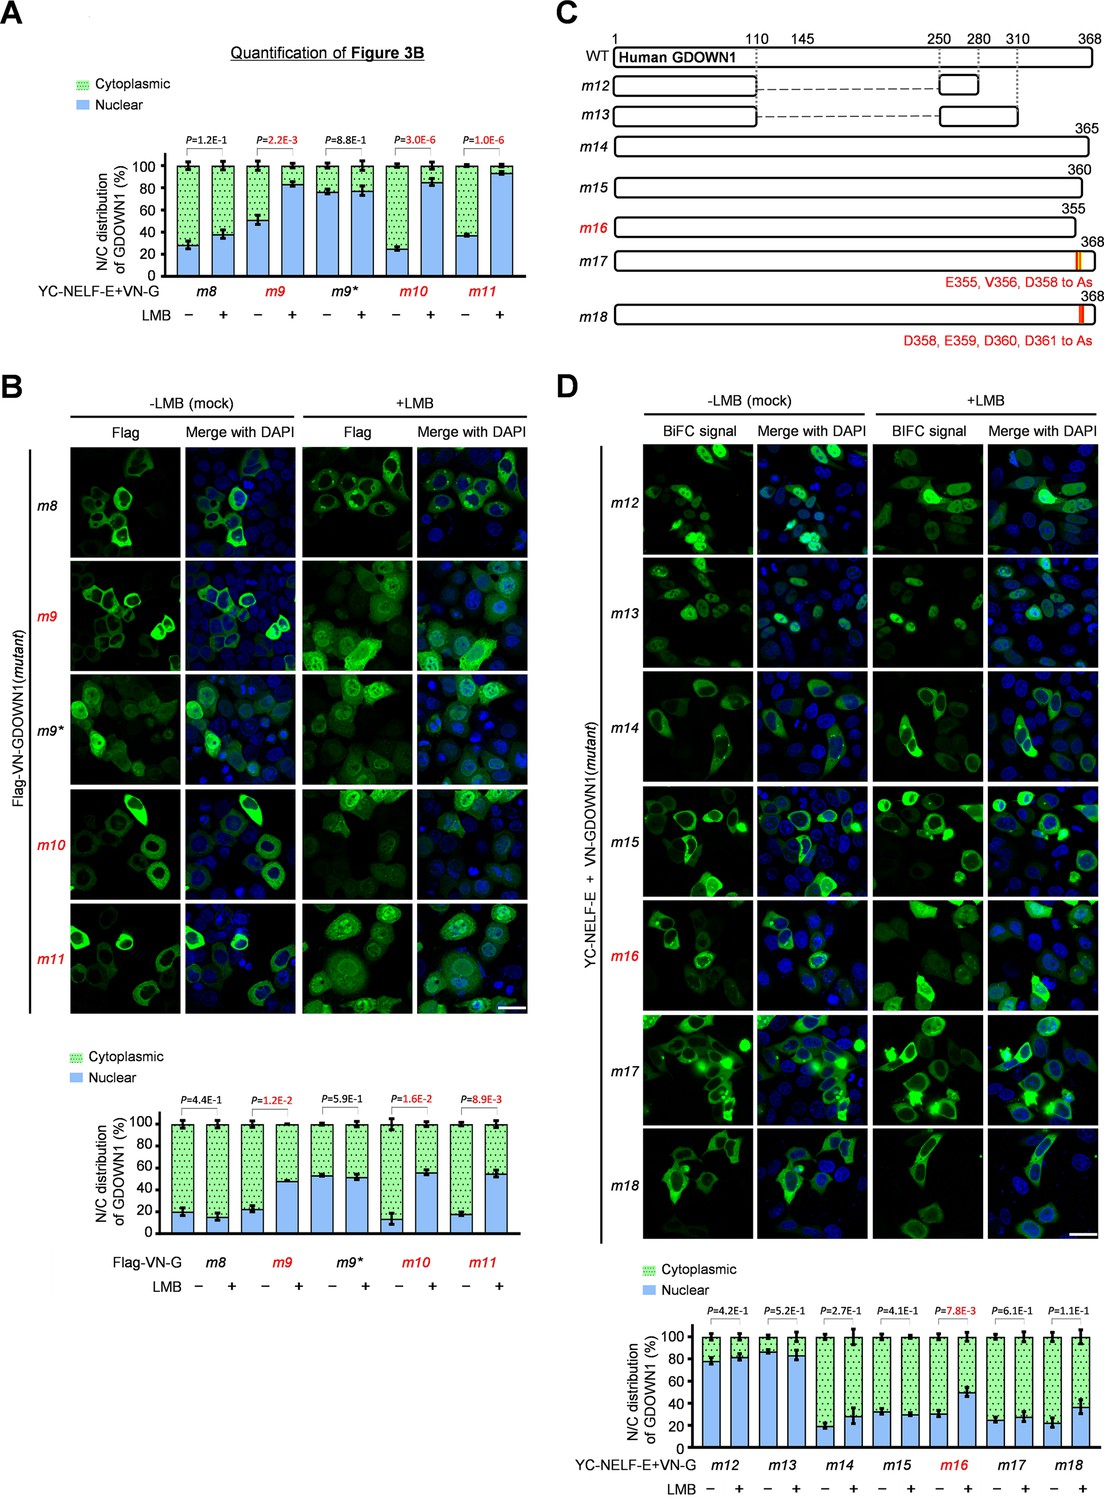
Detection of the subcellular localization of the indicated GDOWN1 mutants.
(A) The nucleocytoplasmic distribution of the fluorescent signals in Figure 3B were quantified using ImageJ. The P values were calculated via a t-test using the built-in tools in Graphpad Prism8, n≥3, significant: P<0.05. (B) Detection of the subcellular localization of GDOWN1(the wild type or its mutants)-Venus by IF. The details of the indicated truncation mutants are shown on Figure 3A, and the cell treatments and IF experiments were performed as described in Figure 2—figure supplement 1B. The nucleocytoplasmic distribution of the fluorescent signals was quantified using ImageJ and shown on the bottom. The P values were calculated via a t-test using the built-in tools in Graphpad Prism8, n=2, significant: P<0.05. (C) The details of a new set of GDOWN1 mutants. (D) Identification of NES2 and CAS motifs using the mutants shown in C in the BiFC reporter system as described in Figure 2B. The nucleocytoplasmic distribution of the fluorescent signals was quantified using ImageJ and shown at the bottom. The P values were calculated via a t-test using the built-in tools in Graphpad Prism8, n≥3, significant: P<0.05. The nuclear DNA was stained by Hoechst 33342. scale bars—30 μm.
-
Figure 3—figure supplement 1—source data 1
Raw data used for the statistical analyses presented in Figure 3—figure supplement 1A.
- https://cdn.elifesciences.org/articles/79116/elife-79116-fig3-figsupp1-data1-v1.zip
-
Figure 3—figure supplement 1—source data 2
Raw data used for the statistical analyses presented in Figure 3—figure supplement 1B.
- https://cdn.elifesciences.org/articles/79116/elife-79116-fig3-figsupp1-data2-v1.zip
-
Figure 3—figure supplement 1—source data 3
Raw data used for the statistical analyses presented in Figure 3—figure supplement 1D.
- https://cdn.elifesciences.org/articles/79116/elife-79116-fig3-figsupp1-data3-v1.zip
Figure 3—figure supplement 2
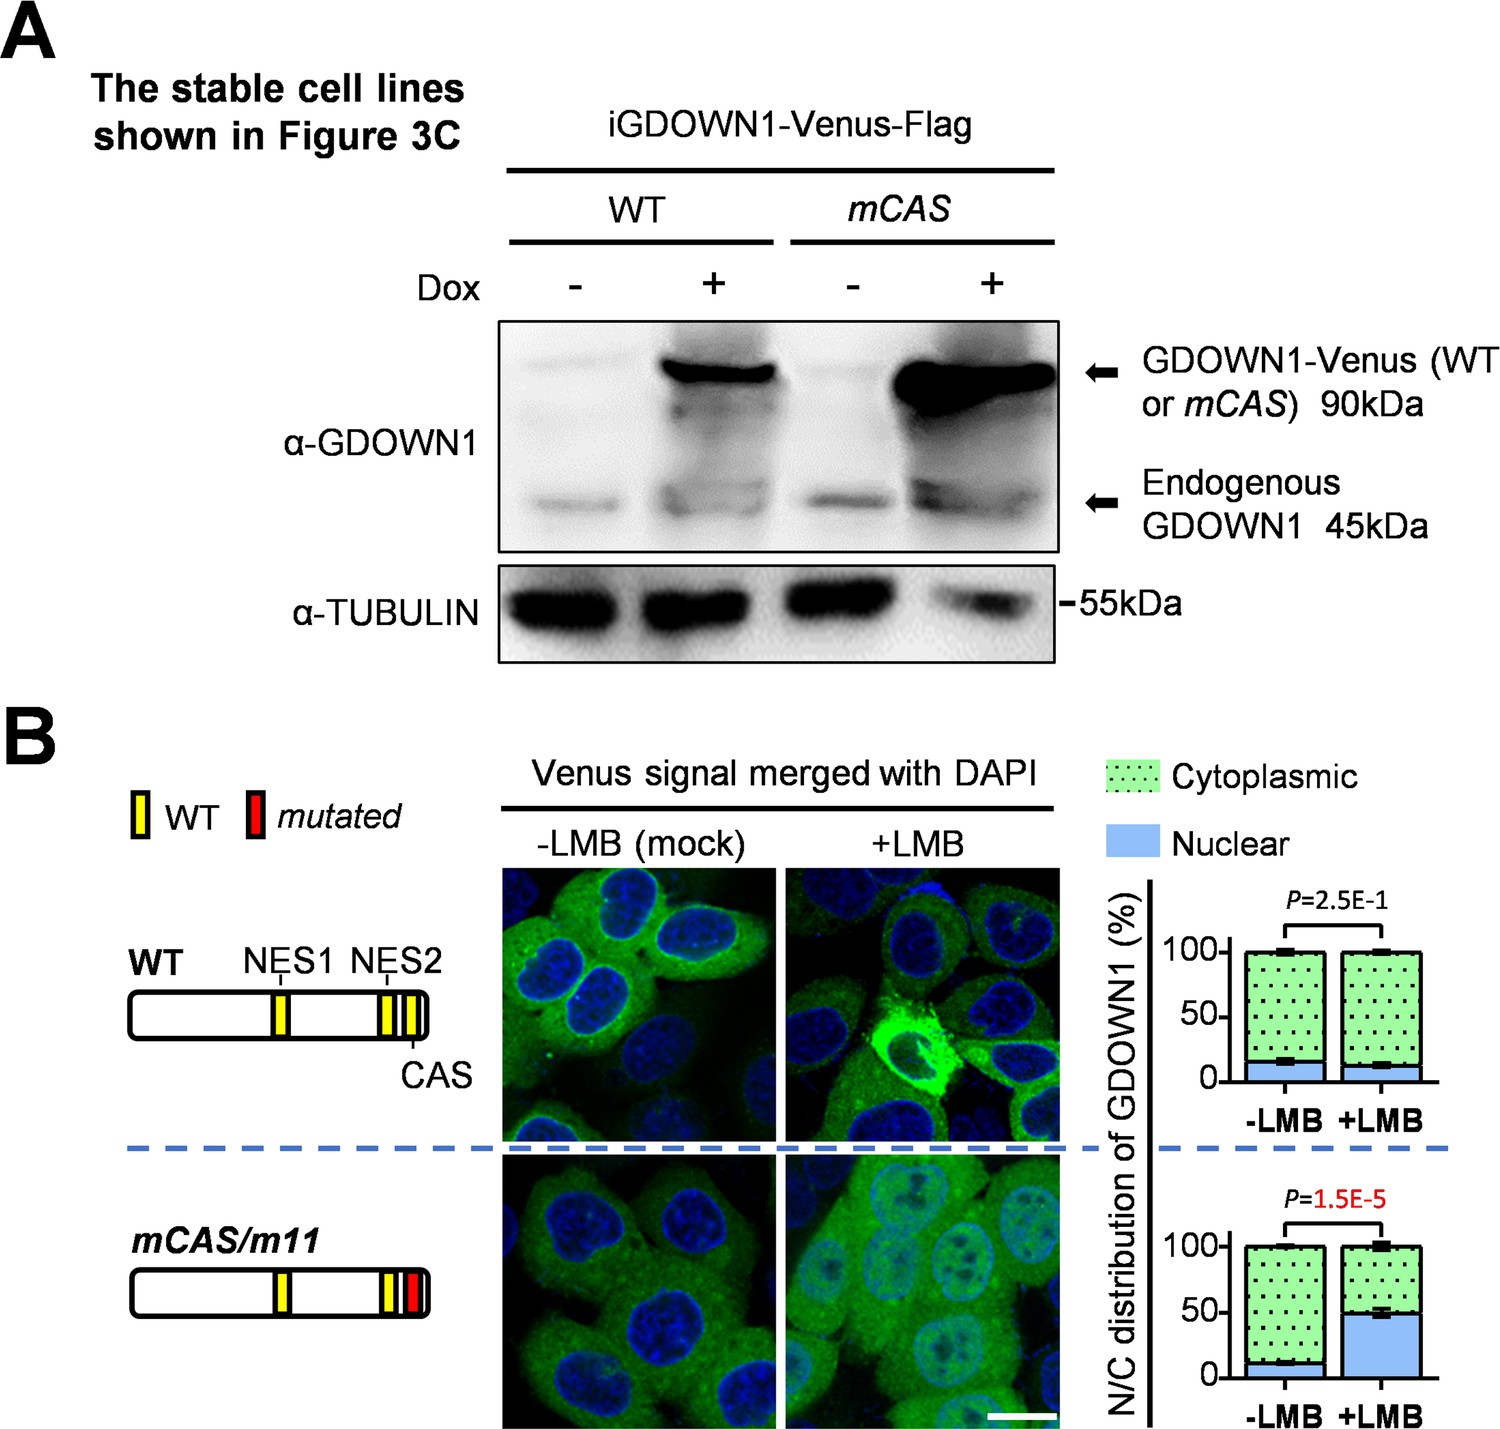
Detection of the expression and the subcellular localization of the CAS mutant.
(A) HeLa cells stably transfected the wild type GDOWN1-Venus or the CAS mutant fused with Venus (in a pTripZ backbone) were verified by WB using a GDOWN1 antibody. (B) The cell lines in A were treated with 2.5 μg/mL of Dox for 12 hr to induce the expression of GDOWN1(WT or the CAS mutant)-Venus, and then subjected to mock or LMB treatment as described in Figure 1C. The nuclear DNA was stained by Hoechst 33342. scale bars—30 μm.
-
Figure 3—figure supplement 2—source data 1
Raw data of WB for Figure 3—figure supplement 2A.
- https://cdn.elifesciences.org/articles/79116/elife-79116-fig3-figsupp2-data1-v1.zip
-
Figure 3—figure supplement 2—source data 2
Raw data used for the statistical analyses presented in Figure 3—figure supplement 2B.
- https://cdn.elifesciences.org/articles/79116/elife-79116-fig3-figsupp2-data2-v1.zip
Figure 4 with 1 supplement
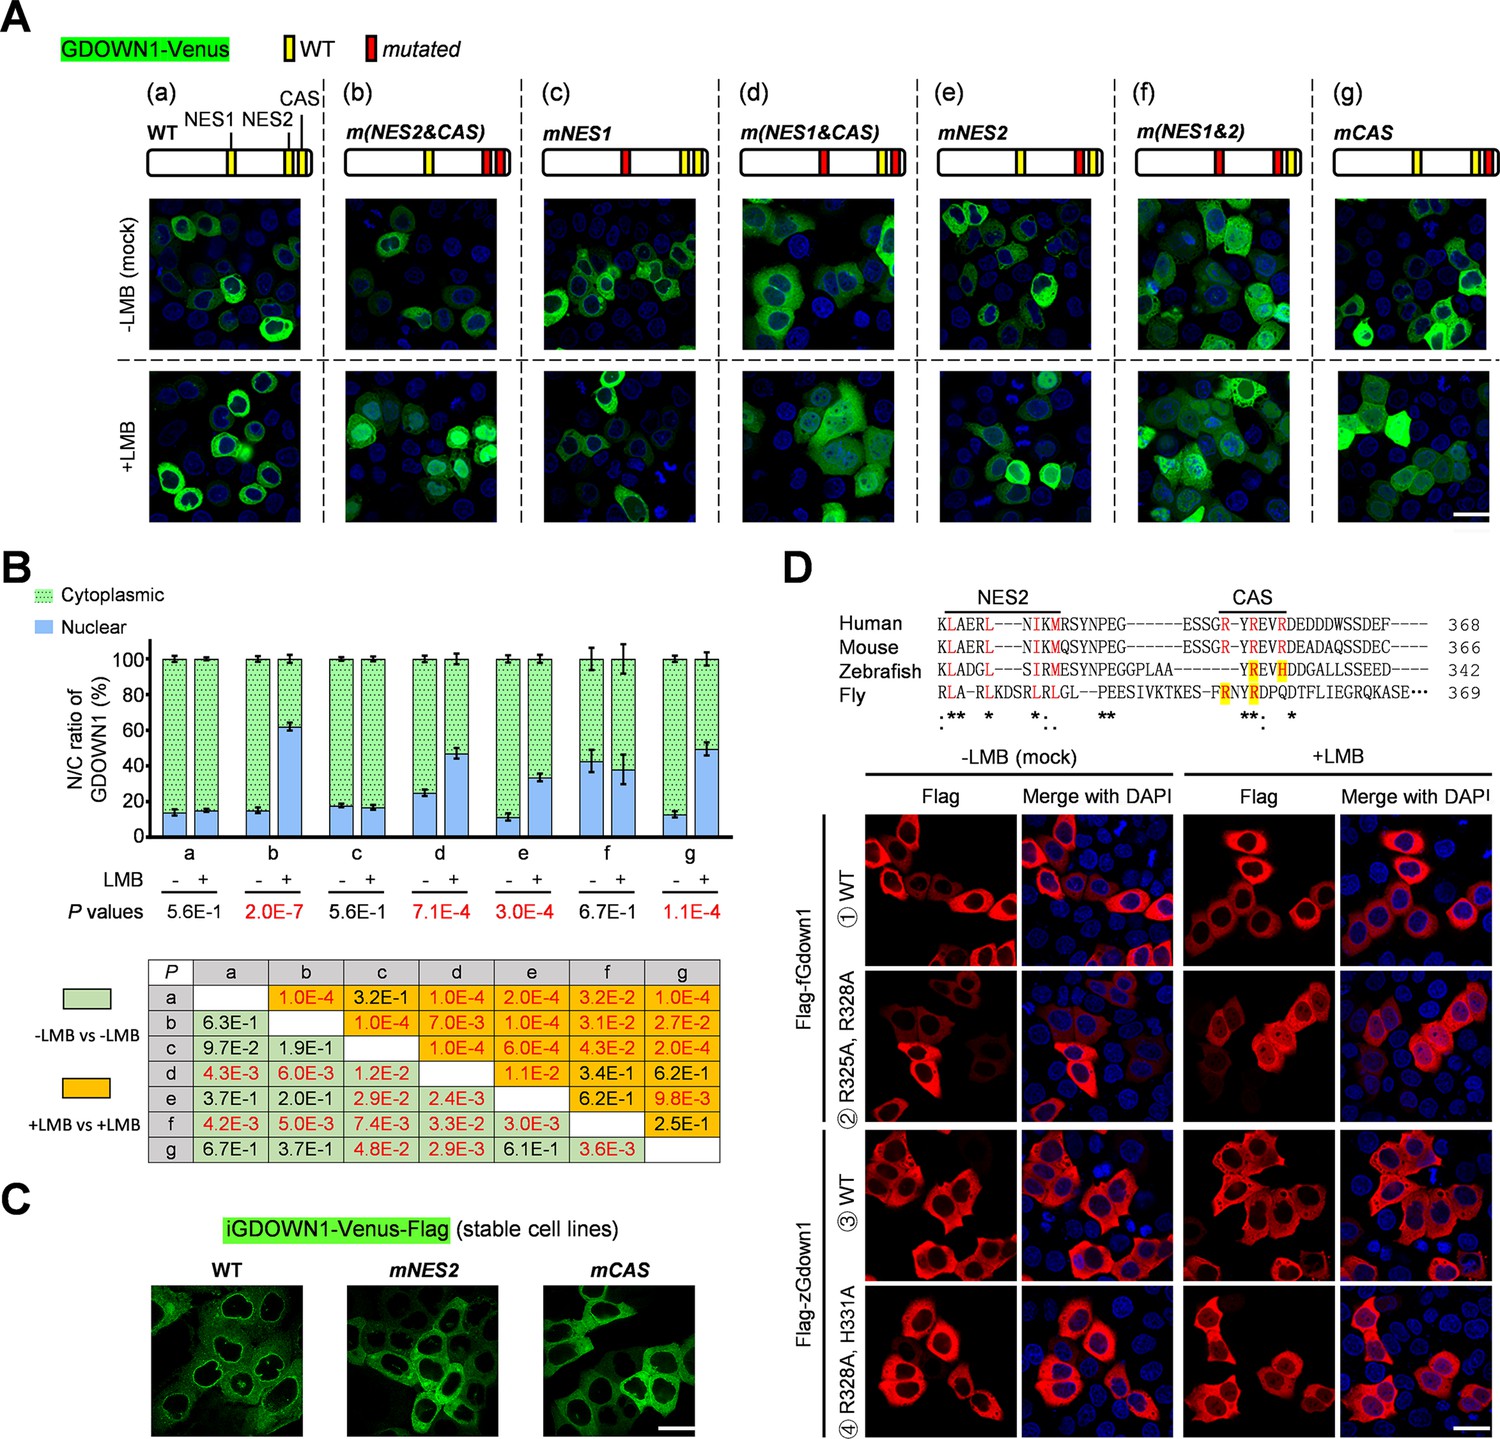
The working mechanisms and conservation of the binary localization regulatory apparatus in Gdown1.
(A) Dissection of the functional independence and interplay among CAS and NES motifs. The wild type GDOWN1 or the indicated CAS or NES mutants carrying point mutations were fused with Venus and ectopically expressed in HeLa cells. The cells were subjected to mock or LMB treatment the same as described in Figure 1. The schematic diagram of each mutant is shown on the top side of the corresponding representative confocal microscopy images. (B) The quantitative and statistical analyses of A. The nucleocytoplasmic distribution of the fluorescent signals for all the mutants shown in A was quantified using ImageJ and shown on the top panel. For the statistical analyses, the P values about the distribution changes in response to LMB for each mutant and about the differences between each pair of the samples were calculated via t-test using the built-in tools in Graphpad Prism8, n=4. The P values that are smaller than 0.05 (significant) were highlighted in red. (C) Confocal images demonstrating the subcellular localization of GDOWN1 in the indicated stable cell lines upon Dox induction for 2 days. (D) The function of the NES and CAS motifs was very conservative from zebrafish and drosophila to mammals. Upper panel: the sequence alignment of the putative NES2-CAS regions of Gdown1 proteins from the indicated species (Homo sapiens, NP_056347.1, Mus musculus, NP_848717.1, Danio rerio, NP_001333109.1, Drosophila melanogaster, NP_650794.1). ‘*’—identical in all species analyzed; ‘:’—highly conserved; ‘.’—moderately conserved. Lower panel: the dynamic subcellular localization of the wild type or CAS mutants of zebrafish (zGdown1) and fly (fGdown1) was detected by IF experiments. The plasmids expressing the indicated proteins were transfected into HeLa cells and the LMB treatment was carried out as previously described. The nucleocytoplasmic distribution of the fluorescent signals was quantified using ImageJ and shown on the bottom. scale bars—30 μm.
-
Figure 4—source data 1
Raw data used for the statistical analyses presented in Figure 4B.
- https://cdn.elifesciences.org/articles/79116/elife-79116-fig4-data1-v1.zip
Figure 4—figure supplement 1
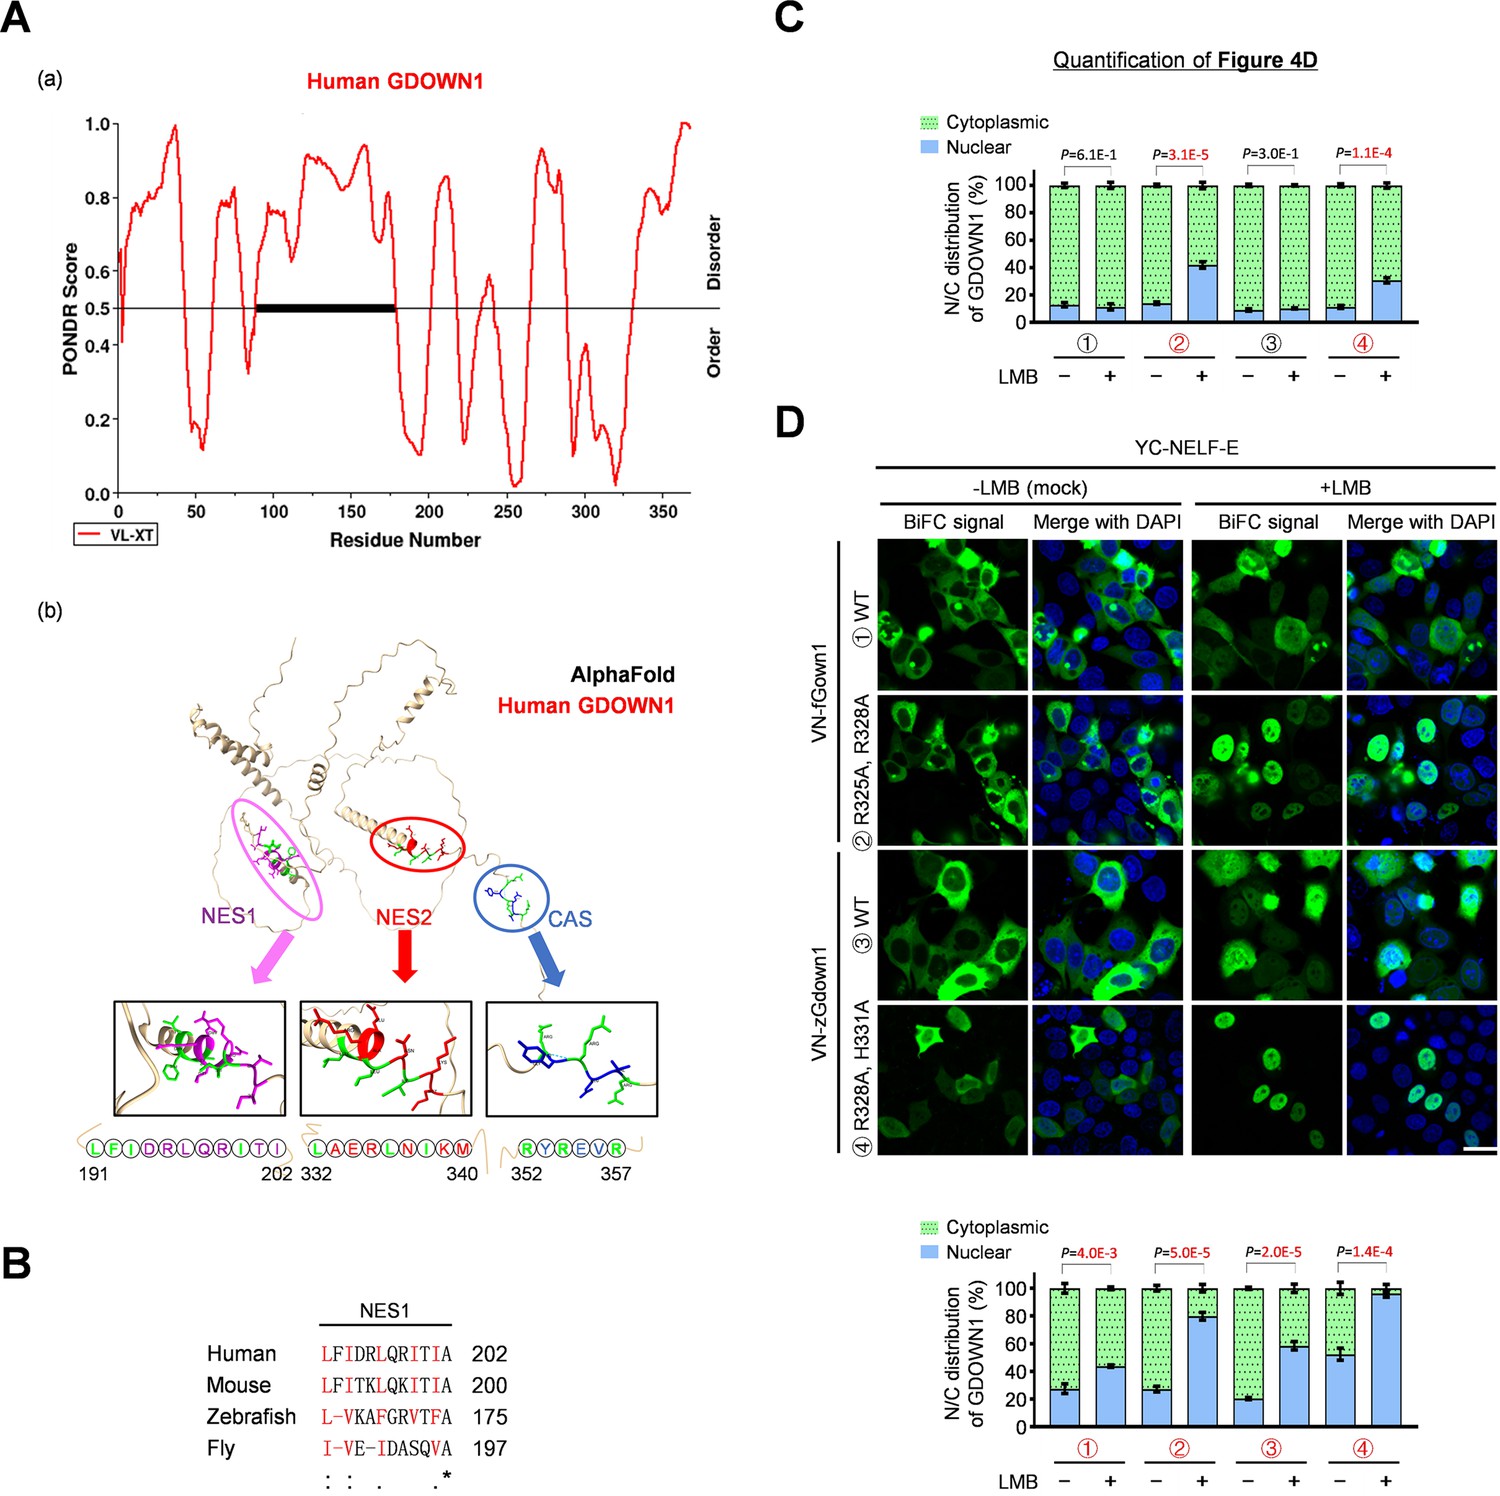
The structural prediction of GDOWN1 and the conservation analyses of Gdown1 across species.
(A) The structural prediction of human GDOWN1. (a) The distribution of the ordered and disordered regions within human GDOWN1 using PONDR (http://www.pondr.com/). (b) The structure of human GDOWN1 predicted by AlphaFold2 (https://alphafold.ebi.ac.uk/). NES1, NES2 and CAS were marked with purple, red, and blue circles, respectively, and the mutated amino acids in this study were marked with green. (B) Sequence alignment of the putative NES1 regions of Gdown1 proteins from the indicated species. ‘*’—identical in all the species analyzed; ‘:’—highly conserved; ‘.’—moderately conserved. (C) The quantification analyses of the confocal images shown in Figure 4D. The p values were calculated via t-test using the built-in tools in Graphpad Prism8, n=4, significant: P<0.05. (D) BiFC assays monitoring the interaction signals between NELF-E and the fly (f) or zebrafish (z) Gdown1, either the wild type or the CAS mutant as indicated. The nucleocytoplasmic distribution of the fluorescent signals was quantified using ImageJ and shown at the bottom. The P values were calculated via a t-test using the built-in tools in Graphpad Prism8. n=4, significant: P<0.05. The nuclear DNA was stained by Hoechst 33342. scale bars—30 μm.
-
Figure 4—figure supplement 1—source data 1
Raw data used for the statistical analyses presented in Figure 4—figure supplement 1C.
- https://cdn.elifesciences.org/articles/79116/elife-79116-fig4-figsupp1-data1-v1.zip
-
Figure 4—figure supplement 1—source data 2
Raw data used for the statistical analyses presented in Figure 4—figure supplement 1D.
- https://cdn.elifesciences.org/articles/79116/elife-79116-fig4-figsupp1-data2-v1.zip
Figure 5 with 1 supplement
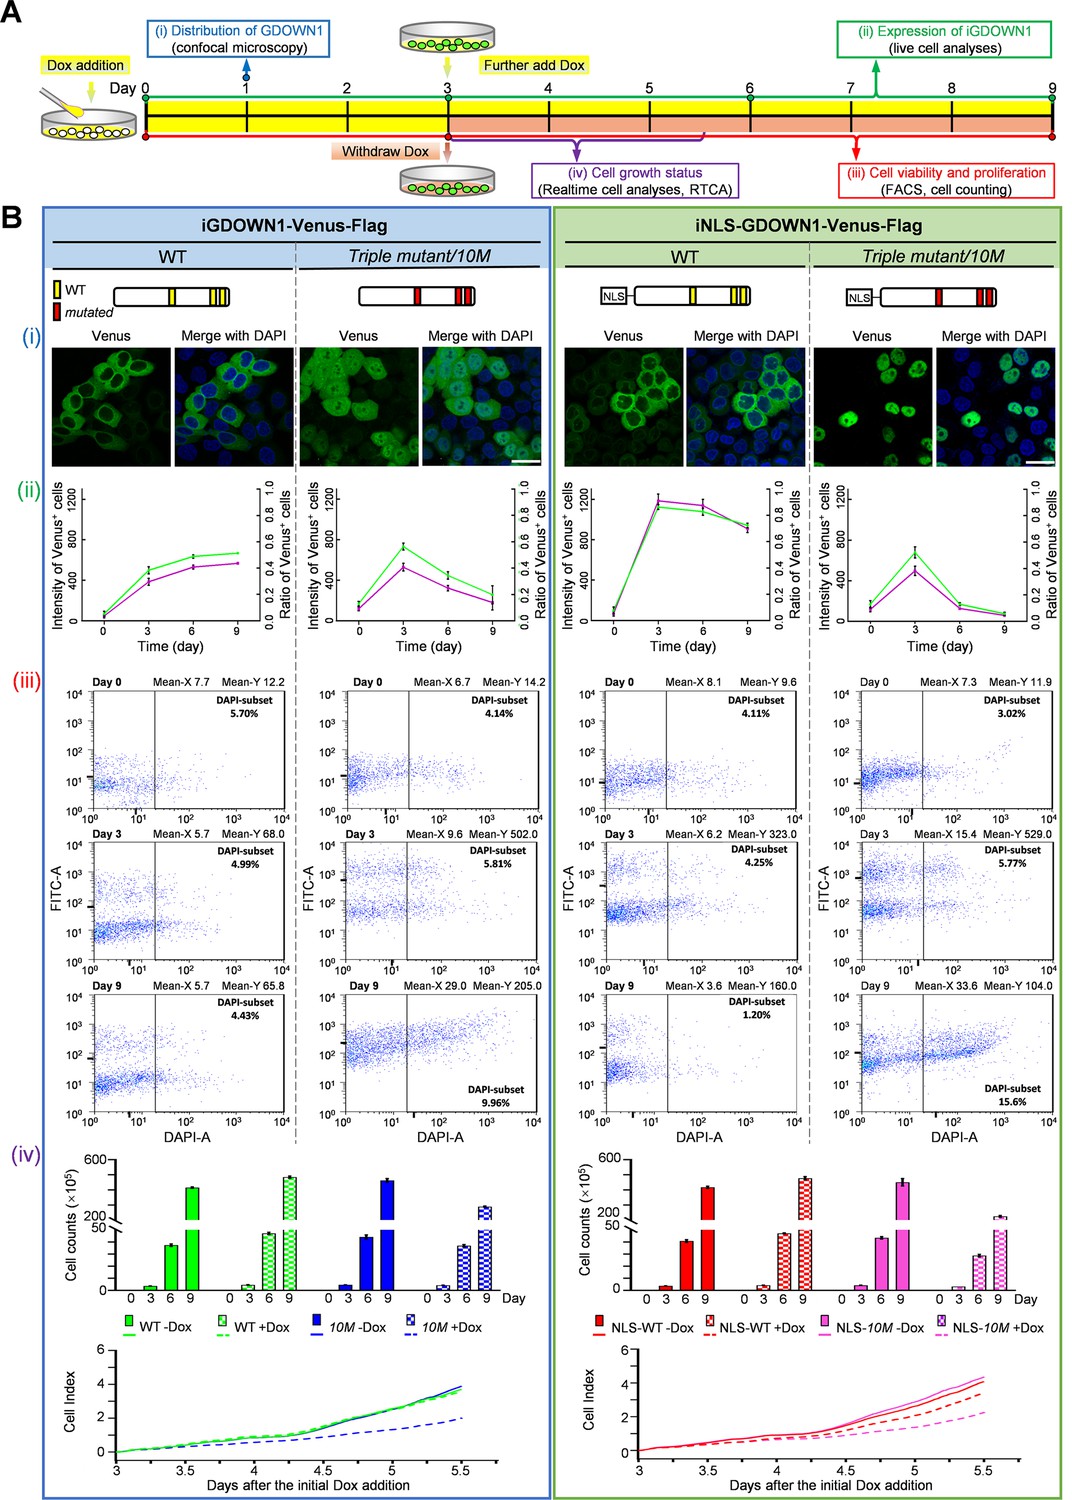
Massive accumulation of GDOWN1 in the nucleus slows down cell growth and may trigger cell death.
HeLa cells stably and inducibly expressing GDOWN1- or NLSsv40-GDOWN1-Venus-Flag, either wild type or the 10M mutants were used for detection. ‘i’ stands for inducible and Dox was used as the inducer. (A) The experimental scheme of the comprehensive analyses of the GDOWN1 expressing cell lines (B) The schematic diagrams of the GDOWN1 variants are shown on the top panel. (i) Confocal images are presented to show the subcellular localization of the indicated cells upon Dox induction for 1 day. The nuclear DNA was stained with Hoechst 33342. scale bars—30 μm (ii) The changes of the fluorescence intensity and the ratio of Venus+ cells were monitored upon the induction of GDOWN1 or its mutants. Images were acquired by Cytation 5 and data were further analyzed by Gen5. (iii) The cell death and the changes in the fluorescence intensity were detected via flow cytometry. Cells were induced by Dox for 3 days to reach the maximum expression and continuously cultured for 6 days in the absence of Dox. Then, the cells were subjected to a quick DAPI staining, followed by the flow cytometry analyses. The mean values of the FITC signal (indicating the expression levels of GDOWN1-Venus proteins) and of the DAPI signals were labeled on each graph. Meanwhile, cells were counted on days 0, 3, 6, and 9, and the growth curves were plotted and shown at the bottom. (iv) Two methods were employed to generate the cell growth curves, including the direct cell counting by a cell counter at the indicated time points (the top panels,n≥3) or detection of the cell growth status by a live cell analyzer (the bottom panels). The same amounts of the cells from each cell line were re-plated in an E-plate 16 (Agilent) after a 3 day Dox induction, and subjected to the RTCA analyses in the presence or absence of Dox (0.25 μg/mL) for another 2.5 days. The real time cell index parameters were recorded and plotted by RTCA.
-
Figure 5—source data 1
Raw data used for the line chart presented in Figure 5B (ii).
- https://cdn.elifesciences.org/articles/79116/elife-79116-fig5-data1-v1.zip
-
Figure 5—source data 2
Raw data of the cell counting presented in Figure 5B (iv).
- https://cdn.elifesciences.org/articles/79116/elife-79116-fig5-data2-v1.zip
-
Figure 5—source data 3
Raw data used for the line chart presented in Figure 5B (iv).
- https://cdn.elifesciences.org/articles/79116/elife-79116-fig5-data3-v1.zip
Figure 5—figure supplement 1

The expression analyses by WB and the cell index measurement by RTCA for the indicated GDOWN1 expressing cell lines.
(A) WB results of the indicated stable cell lines (after a 2 day Dox induction) using a Gdown1 antibody. (B) Cell index values measured by RTCA at the indicated time points using the samples shown in Figure 5B -iv were plotted in a bar graph via Graphpad Prism8,n=2.
-
Figure 5—figure supplement 1—source data 1
Raw data of WB for Figure 5—figure supplement 1A.
- https://cdn.elifesciences.org/articles/79116/elife-79116-fig5-figsupp1-data1-v1.zip
Figure 6 with 1 supplement
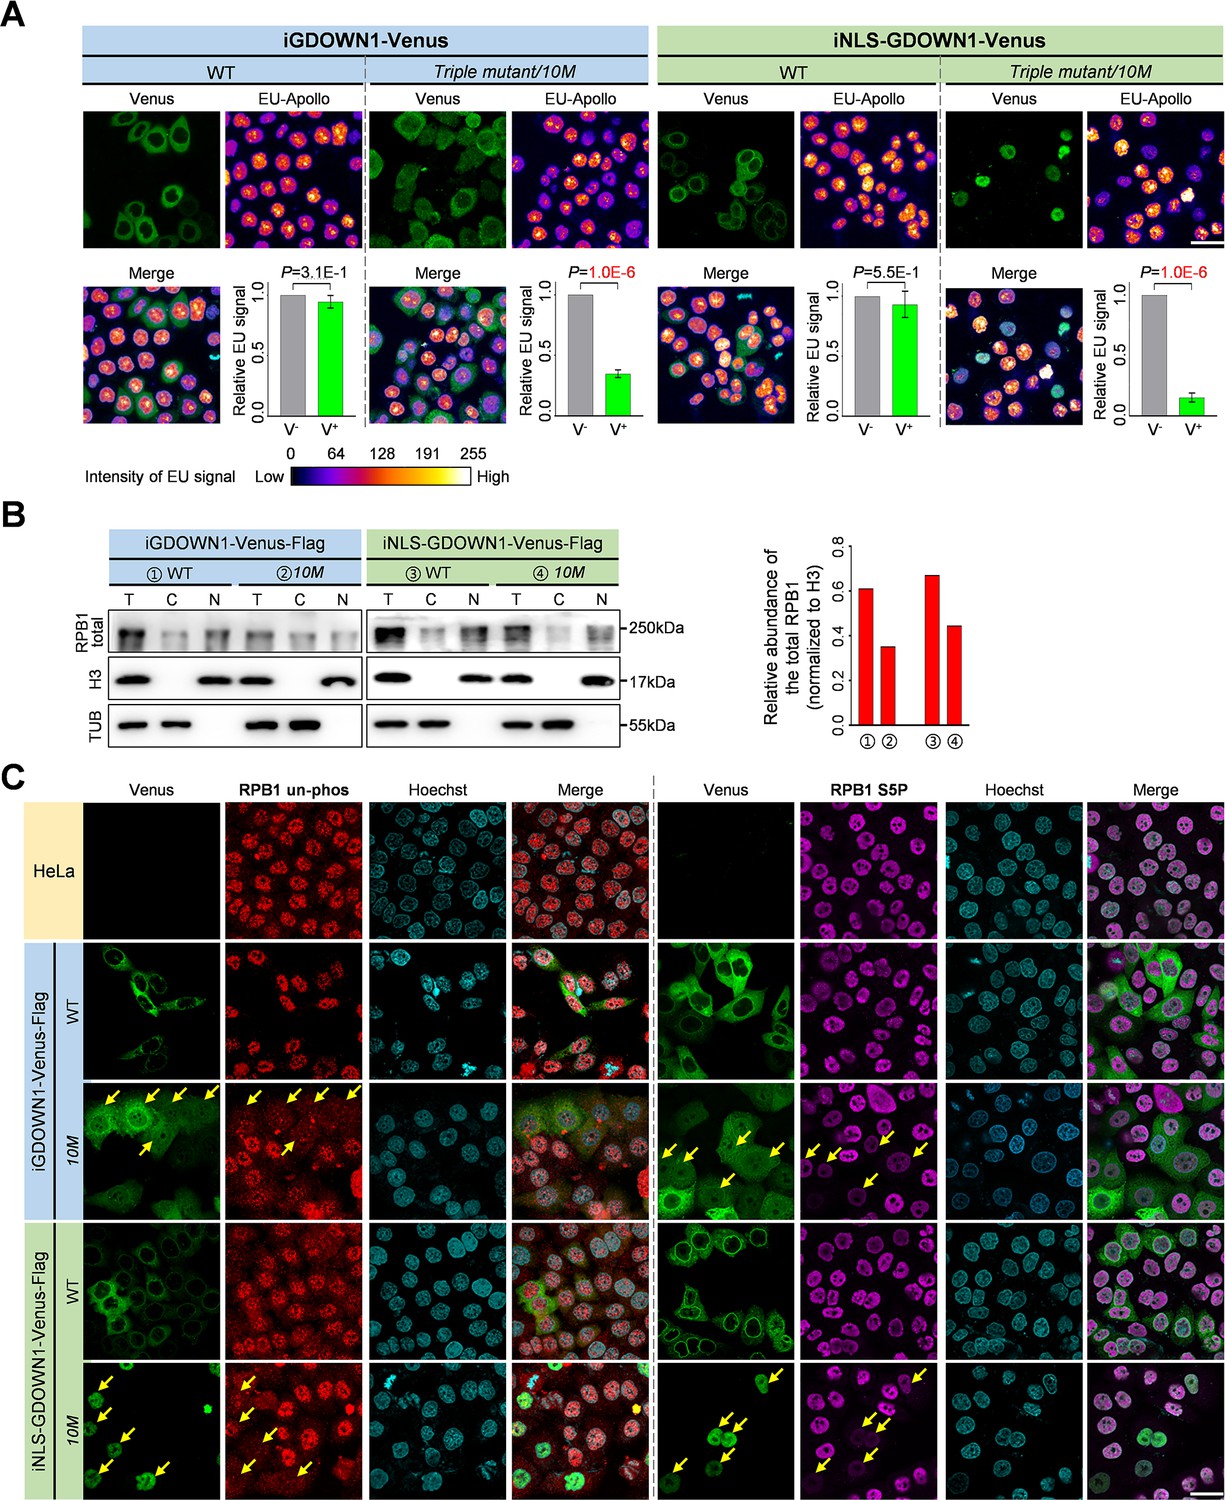
The Nuclear GDOWN1 represses the global transcription.
All the experiments shown in this figure were carried out after four days of Dox induction. (A) The massive accumulation of GDOWN1 in the nucleus caused the global transcriptional repression detected by the EU labeling assays. Confocal images were acquired, and the EU-Apollo signals were color-coded by ImageJ as indicated by the calibration bar shown at the bottom, based on the obtained signal intensity (the original images are shown in Figure 6—figure supplement 1). The averaged EU signal per cell of the Venus+ cells (green, V+) or of the Venus- cells (gray, V-) was shown in the graph at the lower right corner for each of the indicated cell line. The P values were calculated via a t-test using the built-in tools in Graphpad Prism8. n=4. (B) WB analyses of the total Pol II in the GDOWN1 expressing cell lines. The cell fractionation and the following WB analyses were carried out in the same way as previously described in Figure 1B. Differently, the signals of Histone H3 were served as a nuclear protein control and also for data normalization. The RPB1 level in the whole cell lysate relative to that of H3 were calculated and shown on the right. (C) The nuclear GDOWN1 reduces the levels of both the un-phosphorylated and the S5P forms of Pol II. IF experiments were carried out to detect the changes in the indicated RPB1 levels in the four indicated cell lines. Confocal images were acquired and some representative Venus+ cells were pointed out with yellow arrows. The nuclear DNA was stained with Hoechst 33342. scale bars—30 μm.
-
Figure 6—source data 1
Raw data used for the statistical analyses presented in Figure 6A.
- https://cdn.elifesciences.org/articles/79116/elife-79116-fig6-data1-v1.zip
-
Figure 6—source data 2
Raw data of WB for Figure 6B.
- https://cdn.elifesciences.org/articles/79116/elife-79116-fig6-data2-v1.zip
-
Figure 6—source data 3
Raw data used for the statistical analyses presented in Figure 6B.
- https://cdn.elifesciences.org/articles/79116/elife-79116-fig6-data3-v1.zip
Figure 6—figure supplement 1

The extended data for Figure 6 and the IF data quantification of the changes of various Pol II forms in response to the expression of the indicated GDOWN1.
(A) The original confocal images from EU-labeling experiments shown in Figure 6A. (B) WB analyses of the unphosphorylated RPB1 (detected by the 8WG16 antibody) in the indicated GDOWN1 expressing cells. The cell fractionation and the following WB analyses were carried in the same way as previously described in Figure 6B. The LMB treatment was done as previously described in Figure 1. (C) The confocal images about the IF results for the indicated cell lines detecting the S2P-Pol II after 4 days of Dox induction. (D) The nucleocytoplasmic distribution of the fluorescent signals in Figure 6C and (C) were combined and quantified using Gen5. The P values were calculated via a t-test using the built-in tools in Graphpad Prism8. n≥20, significant: P<0.05. The nuclear DNA was stained by Hoechst 33342. scale bars—30 μm.
-
Figure 6—figure supplement 1—source data 1
Raw data of WB for Figure 6—figure supplement 1B.
- https://cdn.elifesciences.org/articles/79116/elife-79116-fig6-figsupp1-data1-v1.zip
-
Figure 6—figure supplement 1—source data 2
Raw data used for the statistical analyses presented in Figure 6—figure supplement 1B.
- https://cdn.elifesciences.org/articles/79116/elife-79116-fig6-figsupp1-data2-v1.zip
-
Figure 6—figure supplement 1—source data 3
Raw data used for the statistical analyses presented in Figure 6—figure supplement 1D.
- https://cdn.elifesciences.org/articles/79116/elife-79116-fig6-figsupp1-data3-v1.zip
Figure 7 with 1 supplement
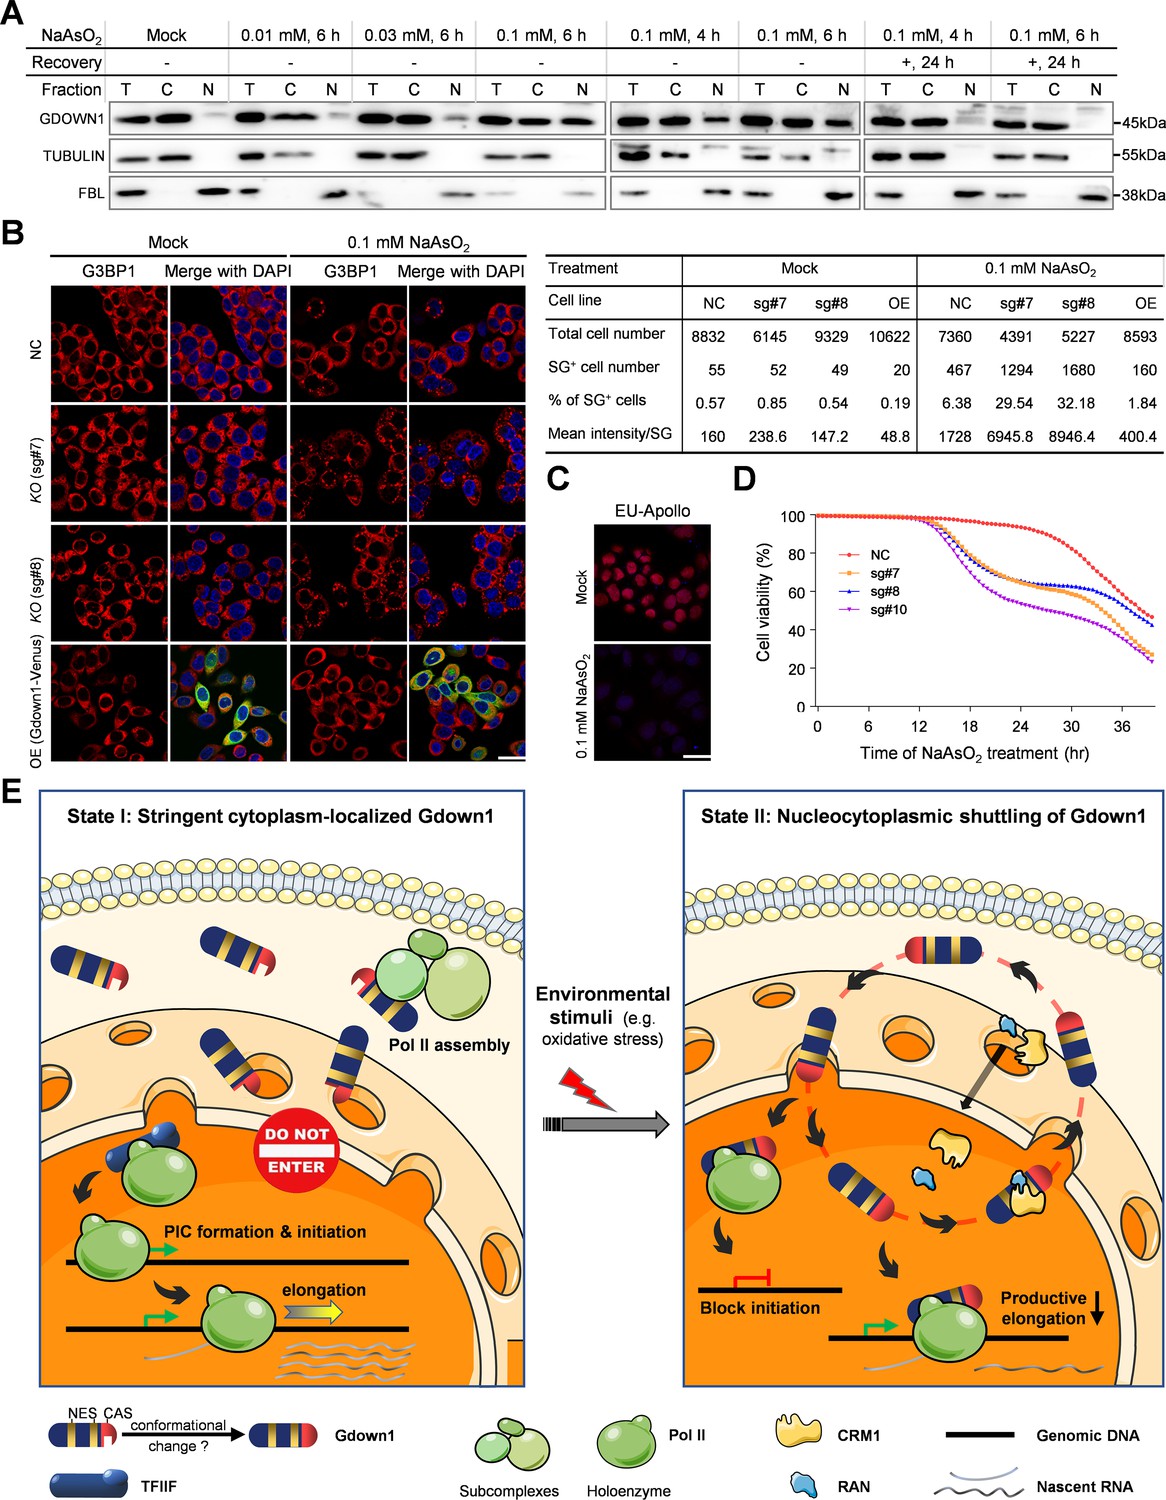
The expression levels of GDOWN1 correlate to the cellular sensitivity to NaAsO2 treatment.
(A) Upon NaAsO2 treatment, a portion of the cellular GDOWN1 was subjected to a reversible translocation into the nucleus. HeLa cells were mock treated or treated with NaAsO2 as indicated. In some samples, the cell culture medium was refreshed after the treatment to remove NaAsO2, and the cells were further cultured for another 24 hr before harvest. The cell fractionation and the following WB analyses were carried in the same way as previously described in Figure 1B. (B) GDOWN1 affected the formation of SGs after NaAsO2 treatment. HeLa cells with GDOWN1 KO (sg#7, sg#8) or the negative control (sg#NC), and the cells stably and inducibly expressing iGDOWN1-Venus-Flag (OE) were employed. Each of the indicated cell lines was subjected with NaAsO2 treatment at 0.1 mM for 6 hr, and the SGs were detected by IF assays using an antibody against G3BP1. The nuclear DNA was stained by Hoechst 33342. scale bars—30 μm. Left: the representative confocal images; Right: the collection of the SG parameters measured and calculated by Gen5, based on the images acquired by Cytation 5. (C) The total transcription level in HeLa cells was repressed upon NaAsO2 treatment. HeLa cells being treated with 0.1 mM NaAsO2 or mock treated were subjected to the EU-Apollo labeling assays. (D) Knockout of GDOWN1 made the cells more sensitive to NaAsO2 stimulation. The relative cell viability of the indicated cell lines in the presence of 0.1 mM NaAsO2 was monitored and calculated by Cytation 5. (E) A model summarizing the working and regulatory mechanisms in GDOWN1 (described in the main text).
-
Figure 7—source data 1
Raw data of WB for Figure 7A.
- https://cdn.elifesciences.org/articles/79116/elife-79116-fig7-data1-v1.zip
-
Figure 7—source data 2
Raw data used for the table presented in Figure 7B.
- https://cdn.elifesciences.org/articles/79116/elife-79116-fig7-data2-v1.zip
-
Figure 7—source data 3
Raw data used for the line chart presented in Figure 7D.
- https://cdn.elifesciences.org/articles/79116/elife-79116-fig7-data3-v1.zip
Figure 7—figure supplement 1

The subcellular localization of GDOWN1 upon various drug treatments and the formation of SGs upon the NaAsO2 treatment at 0.5 mM for half an hour.
(A) The subcellular localization of GDOWN1 upon the indicated drug treatments, detected by WB after cell fractionation. HeLa cells were mock treated or treated with DRB, CHX, X-ray, Madrasin, Tubercidin, CPT, or Doxorubicin as indicated. After treatment, the cell fractionation and the following WB analyses were carried in the same way as previously described in Figure 1B. (B) Each of the indicated cell line was treated with 0.5 mM NaAsO2 for 30 minutes, and the formation of SGs was detected by IF using a G3BP1 antibody. The nuclear DNA was stained by Hoechst 33342. scale bars —30 μm.
-
Figure 7—figure supplement 1—source data 1
Raw data of WB for Figure 7—figure supplement 1A.
- https://cdn.elifesciences.org/articles/79116/elife-79116-fig7-figsupp1-data1-v1.zip
Author response image 1
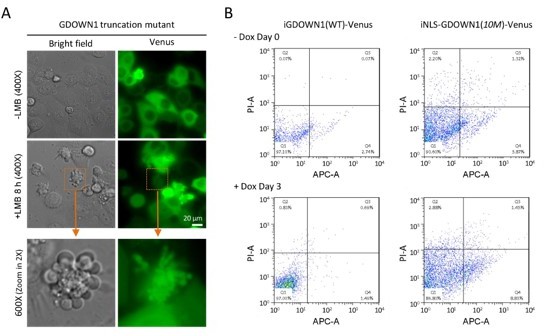
The nuclear accumulation of GDOWN1 may trigger apoptosis.
(A) Transient transfection of a human GDOWN1 truncation mutant resulted in cell death within hours post LMB-induced nuclear translocation of GDOWN1. In this case, we observed the appearance of apoptotic body-like extracellular vesicles. (B) Flow cytometry analyses for detection of the apoptotic signals comparing the cells expressing the either the cytoplasmic GDOWN1-Venus [iGDOWN1(WT)-Venus] or the nuclear GDOWN1 [iNLS-GDOWN1(10M)-Venus]. The X-axis showed the phosphatidylserine (PS) signals of the outer membrane labeled with APC fluorescence, and the Y-axis marked the π signals.
Author response image 2
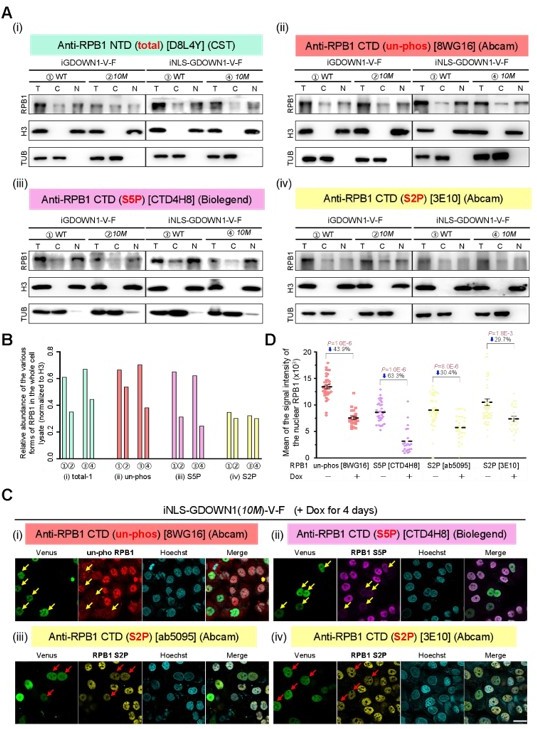
The nuclear accumulation of GDOWN1 causes reduction of Pol II.
(A) Using four different Pol II antibodies to detect the changes of Pol II in the indicated cell lines upon the expression of GDOWN1 on day 4 post Dox addition; [T: total, the whole cell lysate; C: cytosol; N: nuclei] (B) The quantification of the data shown in (A); (C) The nuclear accumulation of GDOWN1 in the iNLS-GDOWN1(10M) cells causes differential decreases of the distinct forms of Pol II in IF assays; (D) The quantification of the data shown in (C).
Author response image 3
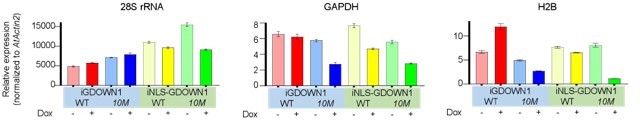
The changes of the indicated transcripts after 3 days of induction in cells expressing the indicated GDOWN1 variants.
Total RNA samples from HeLa cells expressing GDOWN1 (or its mutant) for mock or 3 days of Dox induction were extracted. 700 ng RNA from the indicated cell lines and 300 ng RNA from Arabidopsis were mixed and used to do reverse transcription. The cDNA samples were further prepared and used in qPCR assays and the Actin2 gene of Arabidopsis was used as a reference gene for data normalization.
Author response image 4
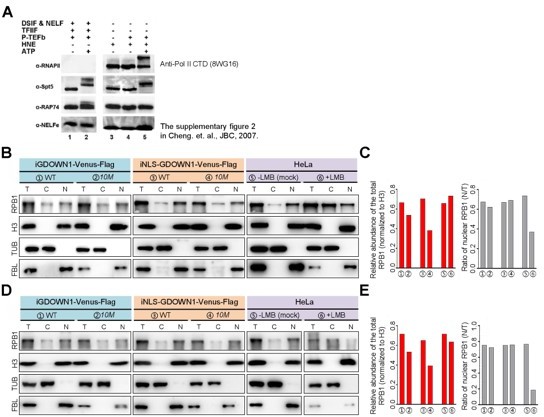
The changes of the level of the un-phosphorylated RPB1 and its nuclear fraction upon the nuclear accumulation of GDOWN1 or the treatment of LMB. A. The target specificity test of the Pol II-CTD antibody, 8WG16. in vitro kinase assays were carried out using the purified P-TEFb as the kinase, and either the purified factors or the HeLa nuclear extract (HNE) as the substrates. The 8WG16 antibody was employed for Pol II detection in the WB experiment. This data was published as the Supplementary Figure 2 in Cheng et al., JBC, 2007, 282(30): 21901-21912. B-E. The indicated cell lines were cultured and subjected to cell fractionation and WB analyses. Two independent experiments were performed and the results are shown in B&C, and D&E, respectively. Antibodies used for detection were labeled on the left side. The relative changes of the RPB1 level as a whole and the ratio of its nuclear fraction were shown in the bar graphs on the right. As a very long-life protein, histone H3 was used as the internal control for data normalization. TUB: TUBULIN; the nuclear fraction (N), and the total cell lysate (T) .
Tables
Key resources table
| Reagent type (species) or resource | Designation | Source or reference | Identifiers | Additional information |
|---|---|---|---|---|
| Gene (human) | POLR2M | EMBL database | ENST00000299638.8 | RNA polymerase II subunit M (GDOWN1) |
| Gene (human) | POLR2E | EMBL database | ENST00000615234.5 | RNA polymerase II subunit E (RPB5) |
| Gene (human) | NELFA | EMBL database | ENST00000382882.9 | negative elongation factor complex member A. Provided by Dr. Ruichuan Chen |
| Gene (human) | NELFE | EMBL database | ENST00000375429.8 | negative elongation factor complex member E. Provided by Dr. Ruichuan Chen |
| Gene (human) | SUPT4H1 | EMBL database | ENST00000225504.8 | SPT4 homolog, DSIF elongation factor subunit. |
| Gene (human) | SUPT5H1 | EMBL database | ENST00000599117.5 | SPT5 homolog, DSIF elongation factor subunit |
| Gene (human) | MED1 | EMBL database | ENST00000300651.11 | mediator complex subunit 1. Provided by Dr. Ruichuan Chen |
| Gene (human) | MED26 | EMBL database | ENST00000263390.8 | mediator complex subunit 26. Provided by Dr. Ruichuan Chen |
| Gene (human) | RPRD1A | EMBL database | ENST00000399022.9 | regulation of nuclear pre-mRNA domain containing 1 A |
| Gene (human) | RPRD1B | EMBL database | ENST00000373433.9 | regulation of nuclear pre-mRNA domain containing 1B |
| Gene (human) | VDAC1 | EMBL database | ENST00000265333.8 | Voltage-dependent anion-selective channel protein 1 |
| Gene (human) | GALNT2 | EMBL database | ENST00000366672.5 | Polypeptide N-acetyl-galactosaminyl transferase 2 |
| Gene (human) | PDIA3 | EMBL database | ENST00000300289.10 | Protein disulfide-isomerase A3 |
| Gene (fly) | Gdown1 | NCBI database | NM_142537.2 | Gdown1 of Drosophila melanogaster. cDNA provided from Mr. Bingtao Niu |
| Gene (zebrafish) | Gdown1 (Polr2m) | NCBI database | NM_001346180.1 | Gdown1 of Danio rerio. cDNA provided from Dr. Yingmei Zhang |
| Cell line (Homo-sapiens) | HeLa | National Collection of Authenticated Cell Cultures | TCHu187 | Authenticated by STR profiling; free from mycoplasma and other microorganisms |
| Cell line (Homo-sapiens) | HEK293T | National Collection of Authenticated Cell Cultures | GNHu17 | Authenticated by STR profiling; free from mycoplasma and other microorganisms |
| Cell line (Homo-sapiens) | GES-1 | Provided by Dr. Kesheng Li, Gansu Provincial Academic Institute for Medical Research, China | Cell line maintained in Kesheng Li lab; Authenticated by STR profiling; free from mycoplasma and other microorganisms | |
| Cell line (Homo-sapiens) | MKN45 | Cell line maintained in Kesheng Li lab; Authenticated by STR profiling; free from mycoplasma and other microorganisms | ||
| Cell line (Homo-sapiens) | SW620 | National Collection of Authenticated Cell Cultures | TCHu101 | Authenticated by STR profiling; free from mycoplasma and other microorganisms |
| Cell line (M. musculus) | NIH3T3 | National Collection of Authenticated Cell Cultures | GNM 6 | Authenticated by STR profiling; free from mycoplasma and other microorganisms |
| Cell line (M. musculus) | E14TG2a | Provided by Dr. Qintong Li, Sichuan university, China. | Originally purchased from ATCC, further adapted to be feeder-free. Authenticated by STR profiling; free from mycoplasma and other microorganisms | |
| Recombinant DNA reagent | pBiFC (VN- or YC-) (plasmid) | Provided by Dr. Tom Kerppola, University of Michigan Medical School, USA | Plasmids used in BiFC assay | |
| Recombinant DNA reagent | pTripZ (plasmid) | Addgene | #127696 | Lentiviral vector for inducible expression in mammalian cells |
| Recombinant DNA reagent | pMD2.G (plasmid) | Addgene | #12259 | Lentivirus packaging vector |
| Recombinant DNA reagent | psPAX2 (plasmid) | Addgene | #12260 | Lentivirus packaging vector |
| Recombinant DNA reagent | pcDNA3.1(+) (plasmid) | Addgene | #78110 | Gene expression vector |
| Recombinant DNA reagent | pX459 (plasmid) | Addgene | #118632 | CRISPR-Cas9 vector |
| Antibody | anti-GDOWN1 (Rabbit polyclonal) | In this study, generated in Biodragon, Suzhou, China | Immunogen: human GDOWN1 (251–368 aa); WB: 1:1000 Preferably used in this study without further indication. | |
| Antibody | anti-GDOWN1 (Sheep polyclonal) | Provided by Dr. David Price, The University of Iowa, USA | Immunogen: human GDOWN1 (full length); WB: 1:1000 | |
| Antibody | anti-α-TUBULIN (Mouse monoclonal) | Biodragon, Suzhou, China | Cat# B1052 | WB: 1:10000 |
| Antibody | anti-FBL/Fibrillarin (Rabbit monoclonal) | Abclonal, Wuhan, China | Cat# A0850 | Nucleoli marker WB: 1:10000 |
| Antibody | anti-CRM1/XPO1 (Rabbit polyclonal) | Abclonal, Wuhan, China | Cat# A0299 | WB: 1:1000 |
| Antibody | anti-RAN (Rabbit polyclonal) | Abclonal, Wuhan, China | Cat# A0976 | WB: 1:1000 |
| Antibody | anti-RPB1-total (Rabbit monoclonal) | CST, Massachusetts, USA | Cat# 14958 S Clone D8L4Y | Immunogen: a synthetic peptide corresponding to the residues surrounding N613 of the human RPB1; WB: 1:1000 |
| Antibody | anti-RPB1- unphosphorylated (Mouse monoclonal) | Abcam, Boston, USA | Cat# AB817 Clone 8WG16 | Immunogen: the purified wheat germ Pol II; IF: 1:200; WB: 1:1000 |
| Antibody | anti-RPB1-Ser5-Phos (Mouse monoclonal) | BioLegend, California, USA | Cat# 904001 Clone CTD4H8 | Immunogen: a peptide containing 10 repeats of the synthetic peptide YSPTSPS with S5 positions phosphorylated; IF: 1:1000 |
| Antibody | anti-RPB1-Ser2-Phos (Rabbit polyclonal) | Abcam, Boston, USA | Cat# AB5095 | Immunogen: a peptide of the CTD repeats of YSPTSPS from S. cerevisiae Pol II with S2 positions phosphorylated; IF: 1:200 |
| Antibody | anti-H3 (Mouse monoclonal) | Biodragon, Suzhou, China | Cat# B1055 Clone 1G1 | WB: 1:500000 |
| Antibody | anti-G3BP1 (Rabbit monoclonal) | Abclonal, Wuhan, China | Cat# A3968 | IF: 1:500 |
| Antibody | anti-Flag (Mouse monoclonal) | Abmart, Shanghai, China | Cat# M20008 Clone 3B9 | WB: 1:2000 IF: 1:300 IP: 1:500 |
| Antibody | HRP-conjugated goat-anti-rabbit IgG (Goat polyclonal) | Biodragon, Suzhou, China | Cat# BF03008 | WB: 1:10000 |
| Antibody | HRP-conjugated goat-anti-mouse IgG (Goat polyclonal) | Biodragon, Suzhou, China | Cat# BF03001 | WB: 1:10000 |
| Antibody | HRP-conjugated goat-anti-sheep IgG (Goat polyclonal) | Biodragon, Suzhou, China | Cat# BF03025 | WB: 1:10000 |
| Antibody | Goat-anti-mouse IgG/Alexa Fluor 594 (Goat polyclonal) | Abcam, Boston, USA | Cat# AB150116 | IF: 1:200 |
| Antibody | Goat-anti-Rabbit IgG/Alexa Fluor 594 (Goat polyclonal) | Abcam, Boston, USA | Cat# AB150080 | IF: 1:200 |
| Chemical compound, drug | Leptomycin B (LMB) | Beyotime, Shanghai, China | Cat# S1726-10 | |
| Chemical compound, drug | Doxycycline (Dox) | Biogems, California, USA | Cat# 2431450 | |
| Chemical compound, drug | Puromycin | InvivoGen, USA | Cat# ant-pr-1 | |
| Chemical compound, drug | NaAsO2 | INNOCHEM, Beijing, China | Cat# A25410 | |
| Chemical compound, drug | Hoechst 33342 | Solarbio Life Sciences, Beijing, China | Cat# C0031 | |
| Chemical compound, drug | Camptothecin (CPT) | Selleck, Houston, USA | Cat# S1288 | |
| Chemical compound, drug | Doxorubicin hydrochloride | Sangon Biotech, Shanghai, China | Cat# A603456 | |
| Chemical compound, drug | Cycloheximide (CHX) | MedChemExpress, New Jersey, USA | Cat# HY-12320 | |
| Madrasin | Cat# HY-100236 | |||
| Tubercidin | Cat# HY-100126 | |||
| Chemical compound, drug | 5, 6-dichloro-1-β-D-ribofuranosylbenzimidazole (DRB) | Sigma, USA | Cat# D1916 | |
| Chemical compound, drug | Propidium iodide (PI) | Solarbio Life Sciences, Beijing, China | Cat# C0080 | |
| Commercial assay or kit | Cell-Light EU Apollo643 RNA Imaging Kit | RIBOBIO, Guangzhou, China | Cat# C10316-2 | |
| Software, algorithm | ImageJ | NIH | Image analysis | |
| Software, algorithm | GraphPad Prism 8.0.2 | GraphPad Software | Data analysis | |
| Software, algorithm | Gen5 | Cytation 5 | Data acquiring and analysis | |
| Software, algorithm | RTCA Software Lite | RTCA | Data acquiring and analysis | |
| Software, algorithm | NIS-ELEMENTS C | Nikon confocal microscope | Data acquiring and analysis | |
| Software, algorithm | BD software | BD LSRFortessa | Data acquiring | |
| Software, algorithm | FlowJQ v10 software | https://www.bdbiosciences.com/zh-cn/products/software/flowjo-v10-software | Data analysis | |
| Software, algorithm | ChopChop | http://chopchop.cbu.uib.no/ | sgRNA design | |
| Software, algorithm | AlphaFold Protein Structure Database | https://alphafold.ebi.ac.uk/ | Structural prediction of GDOWN1 | |
| Software, algorithm | PONDR | http://www.pondr.com/ | Prediction of the natural disordered regions of human GDOWN1 | |
| Software, algorithm | The CUCKOO Workgroup | http://msp.biocuckoo.org/online.php | Prediction of arginine methylation of human GDOWN1 | |
| Other | Exfect Transfection Reagent | Vazyme, Nanjing, China | Cat# T101-02 | This reagent was used in the transfection experiments throughout this article. |
Author response table 1
The sequences of primers used in RT-qPCR assays.
| qPCR Primers | Sequences |
|---|---|
| AtActin2-F | TGTGCCAATCTAGGAGGGTTT |
| AtActin2-R | TTTCCCGCTCTGCTGTTGT |
| hGAPDH-F | GTCAGCCGCATCTTCTTTTG |
| hGAPDH-R | GCGCCCAATACGACCAAATC |
| h28S rRNA-F | GACCCGAAAGATGGTGAACTATG |
| h28S rRNA-R | CGATTTGCACGTCAGGACCG |
| hH2B-F | CCTGAGCCAGCCAAGTCTGC |
| hH2B-R | TGCGGCTGCGCTTGCGCTTC |
Additional files
Download links
A two-part list of links to download the article, or parts of the article, in various formats.
Downloads (link to download the article as PDF)
Open citations (links to open the citations from this article in various online reference manager services)
Cite this article (links to download the citations from this article in formats compatible with various reference manager tools)
Overcoming the cytoplasmic retention of GDOWN1 modulates global transcription and facilitates stress adaptation
eLife 11:e79116.
https://doi.org/10.7554/eLife.79116


