Limitations of principal components in quantitative genetic association models for human studies
- Department of Biostatistics and Bioinformatics, Duke University, United States
- Duke Center for Statistical Genetics and Genomics, Duke University, United States
Figures
Figure 1

Population structures of simulated and real human genotype datasets.
First two columns are population kinship matrices as heatmaps: individuals along x- and y-axis, kinship as color. Diagonal shows inbreeding values. (A) Admixture scenario for both Large and Small simulations. (B) Last generation of 20-generation admixed family, shows larger kinship values near diagonal corresponding to siblings, first cousins, etc. (C) Minor allele frequency (MAF) distributions. Real datasets and subpopulation tree simulations had filter. (D) Human Origins is an array dataset of a large diversity of global populations. (G) Human Genome Diversity Panel (HGDP) is a WGS dataset from global native populations. (J) 1000 Genomes Project is a WGS dataset of global cosmopolitan populations. (F, I, L) Trees between subpopulations fit to real data. (E, H, K). Simulations from trees fit to the real data recapitulate subpopulation structure.
Figure 2 with 3 supplements
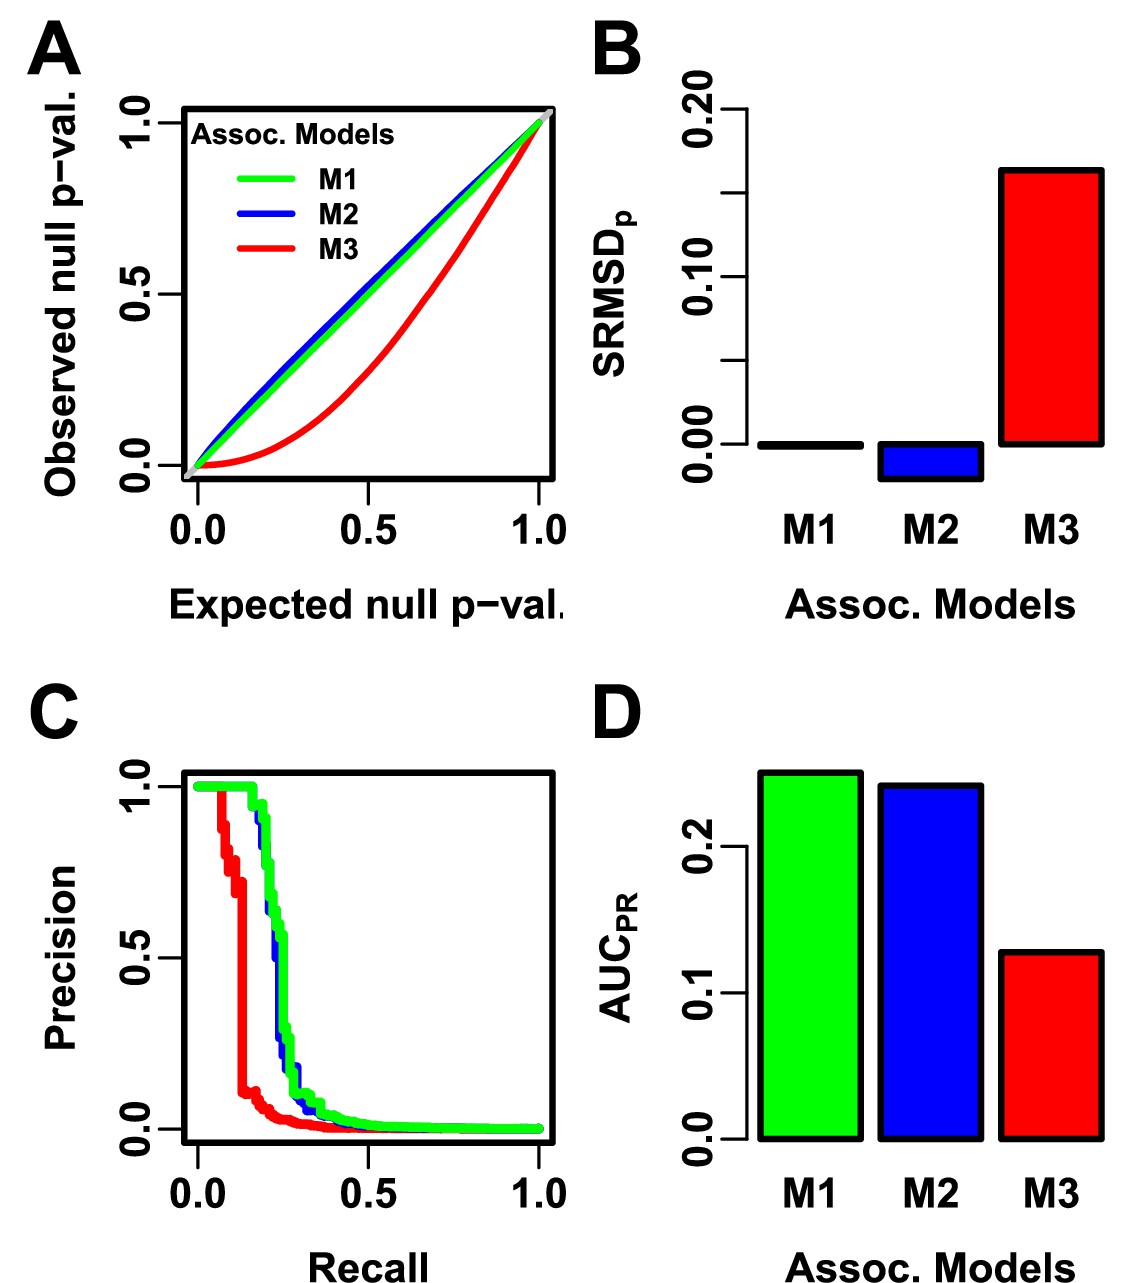
Illustration of evaluation measures.
Three archetypal models illustrate our complementary measures: M1 is ideal, M2 overfits slightly, M3 is naive. (A) QQ plot of p-values of “null” (non-causal) loci. M1 has desired uniform p-values, M2/M3 are miscalibrated. (B) (p-value Signed Root Mean Square Deviation) measures signed distance between observed and expected null p-values (closer to zero is better). (C) Precision and Recall (PR) measure causal locus classification performance (higher is better). (D) (Area Under the PR Curve) reflects power (higher is better).
Figure 2—figure supplement 1

Comparison between and inflation factor.
Each point is a pair of statistics for one replicate, one association model (PCA or LMM with some number of PCs ), one trait model (FES vs RC, all heritability/environments tested), and one dataset (color coded by dataset). Note log y-axis. The sigmoidal curve in Equation 10 is fit to the data.
Figure 2—figure supplement 2
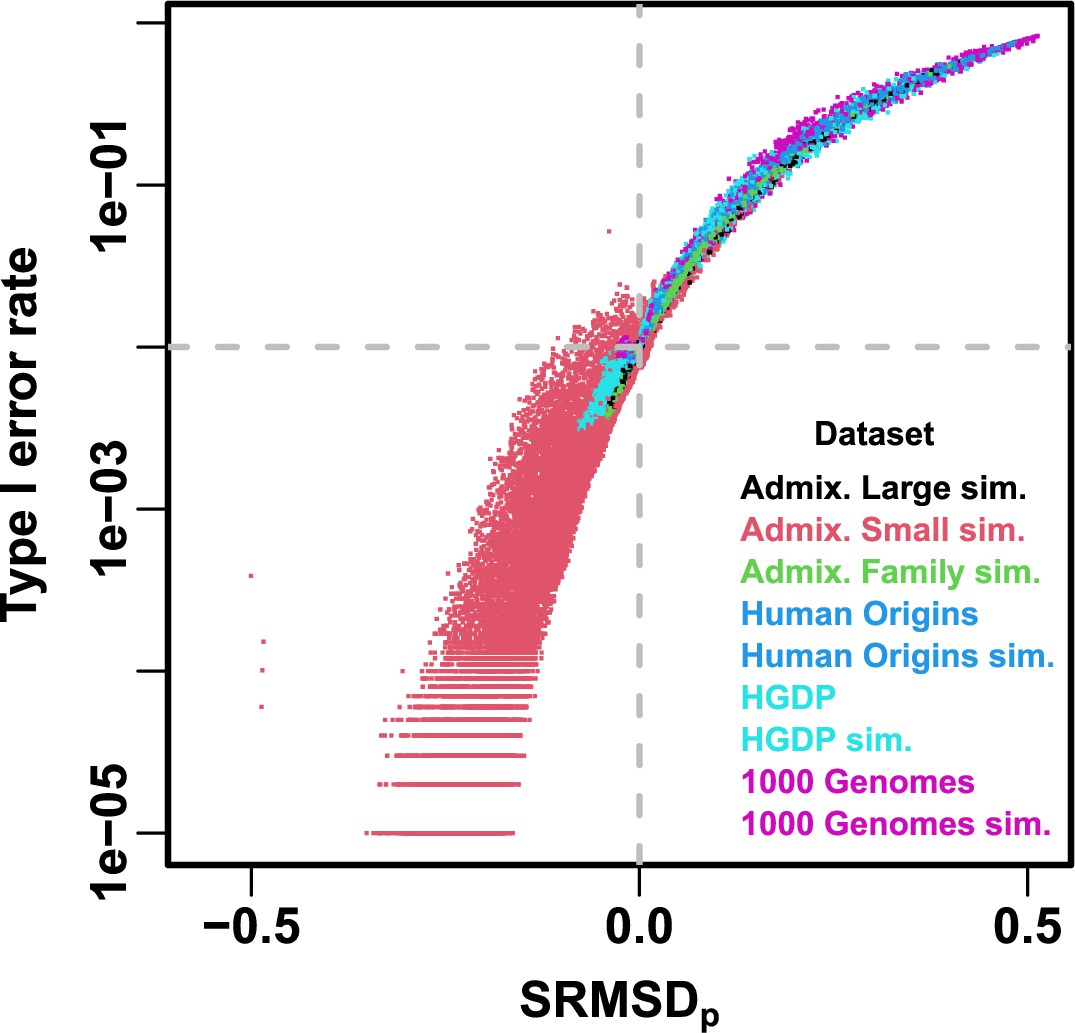
Comparison between and type I error rate.
Type I error rate calculated at a p-value threshold of 1e-2 (horizontal dashed gray line). Thus, a calibrated model has a type I error rate of 1e-2 and (where the dashed lines meet). As expected, increased type I error rates correspond to , while reduced type I error rates correspond to . Each point is a pair of statistics for one replicate, one association model (PCA or LMM with some number of PCs ), one trait model (FES vs RC, all heritability/environments tested), and one dataset (color coded by dataset). Note log y-axis.
Figure 2—figure supplement 3

Comparison between and calibrated power.
Calibrated power is power calculated at an empirical type I error threshold of 1e-4. Each point is a pair of statistics for one replicate, one association model (PCA or LMM with some number of PCs ), one trait model (FES vs RC, all heritability/environments tested), and one dataset (color coded by dataset). Gray dashed line is line.
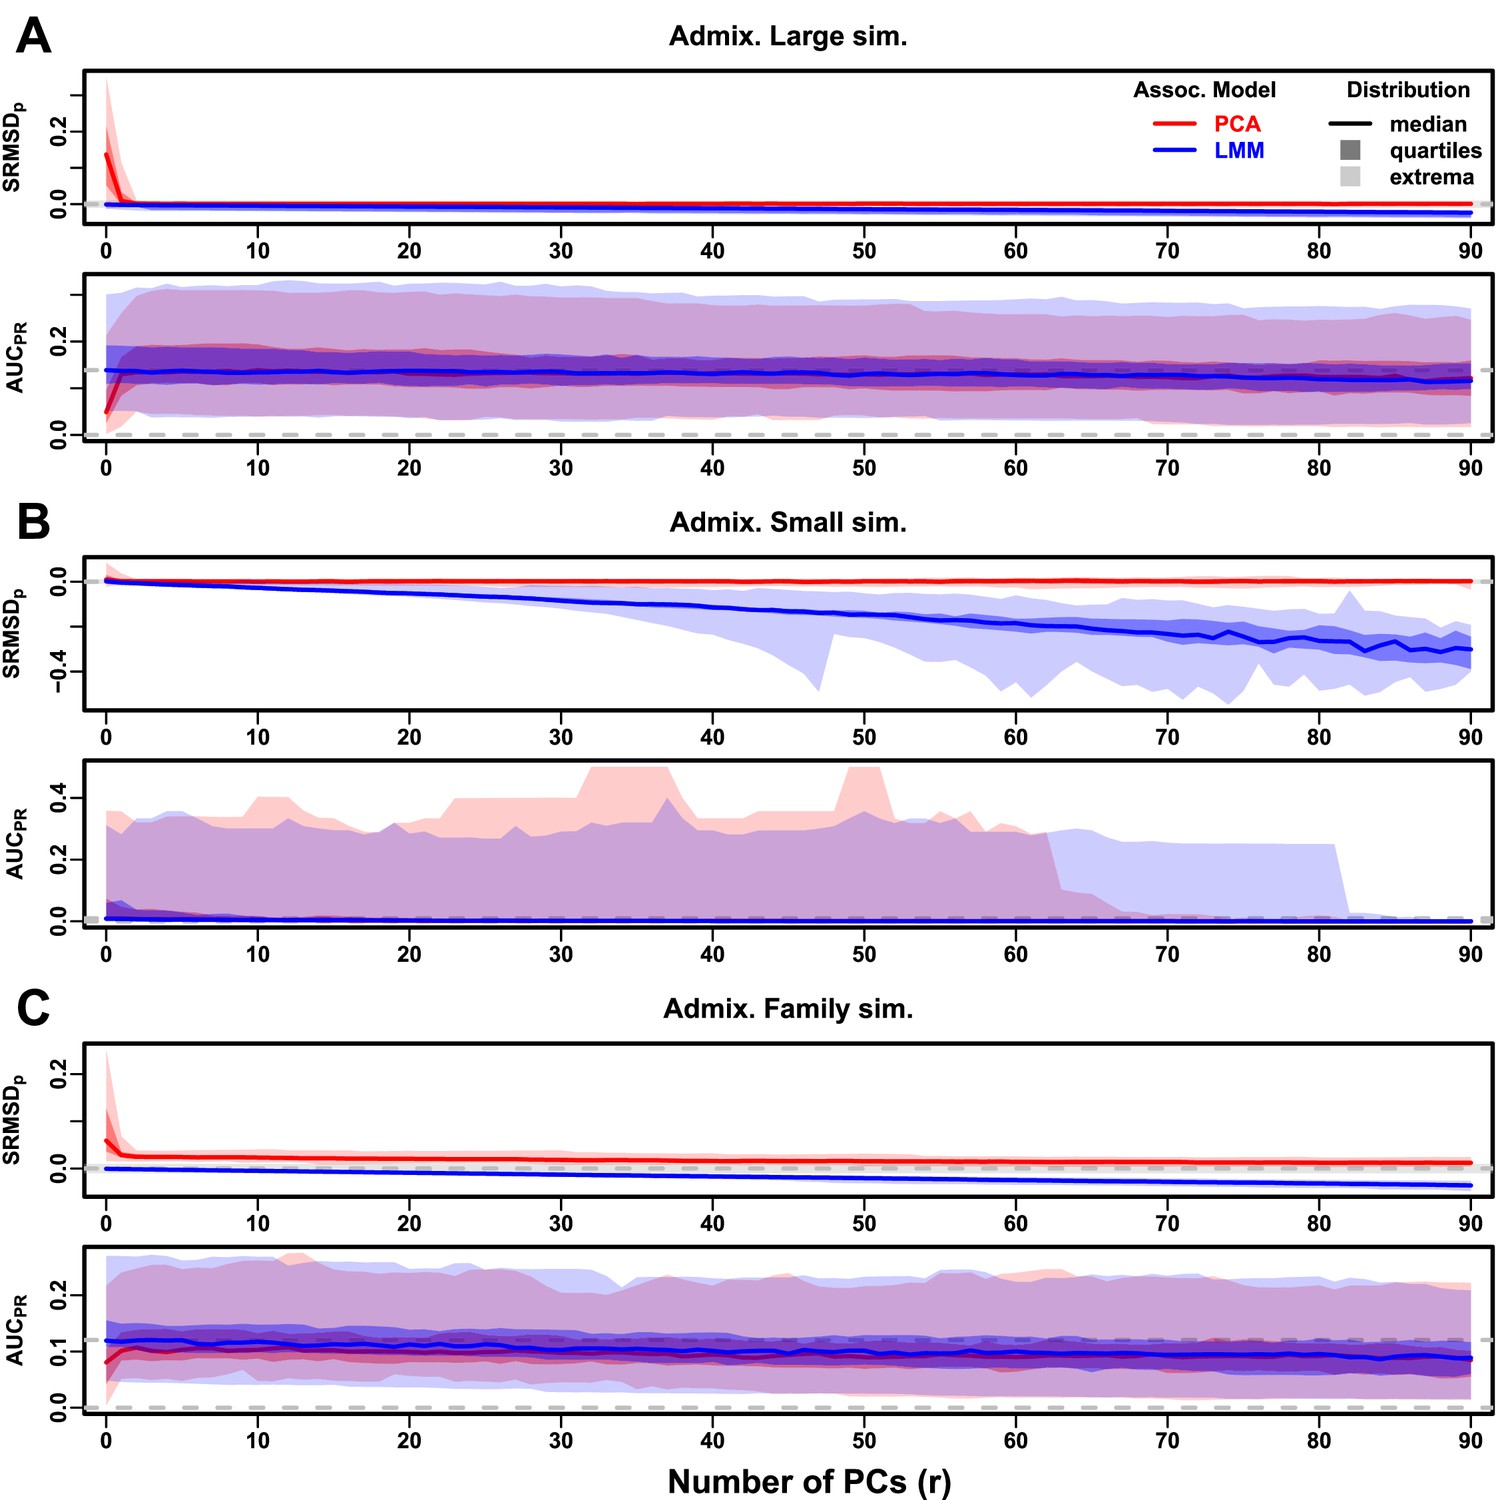
Figure 3 with 5 supplements
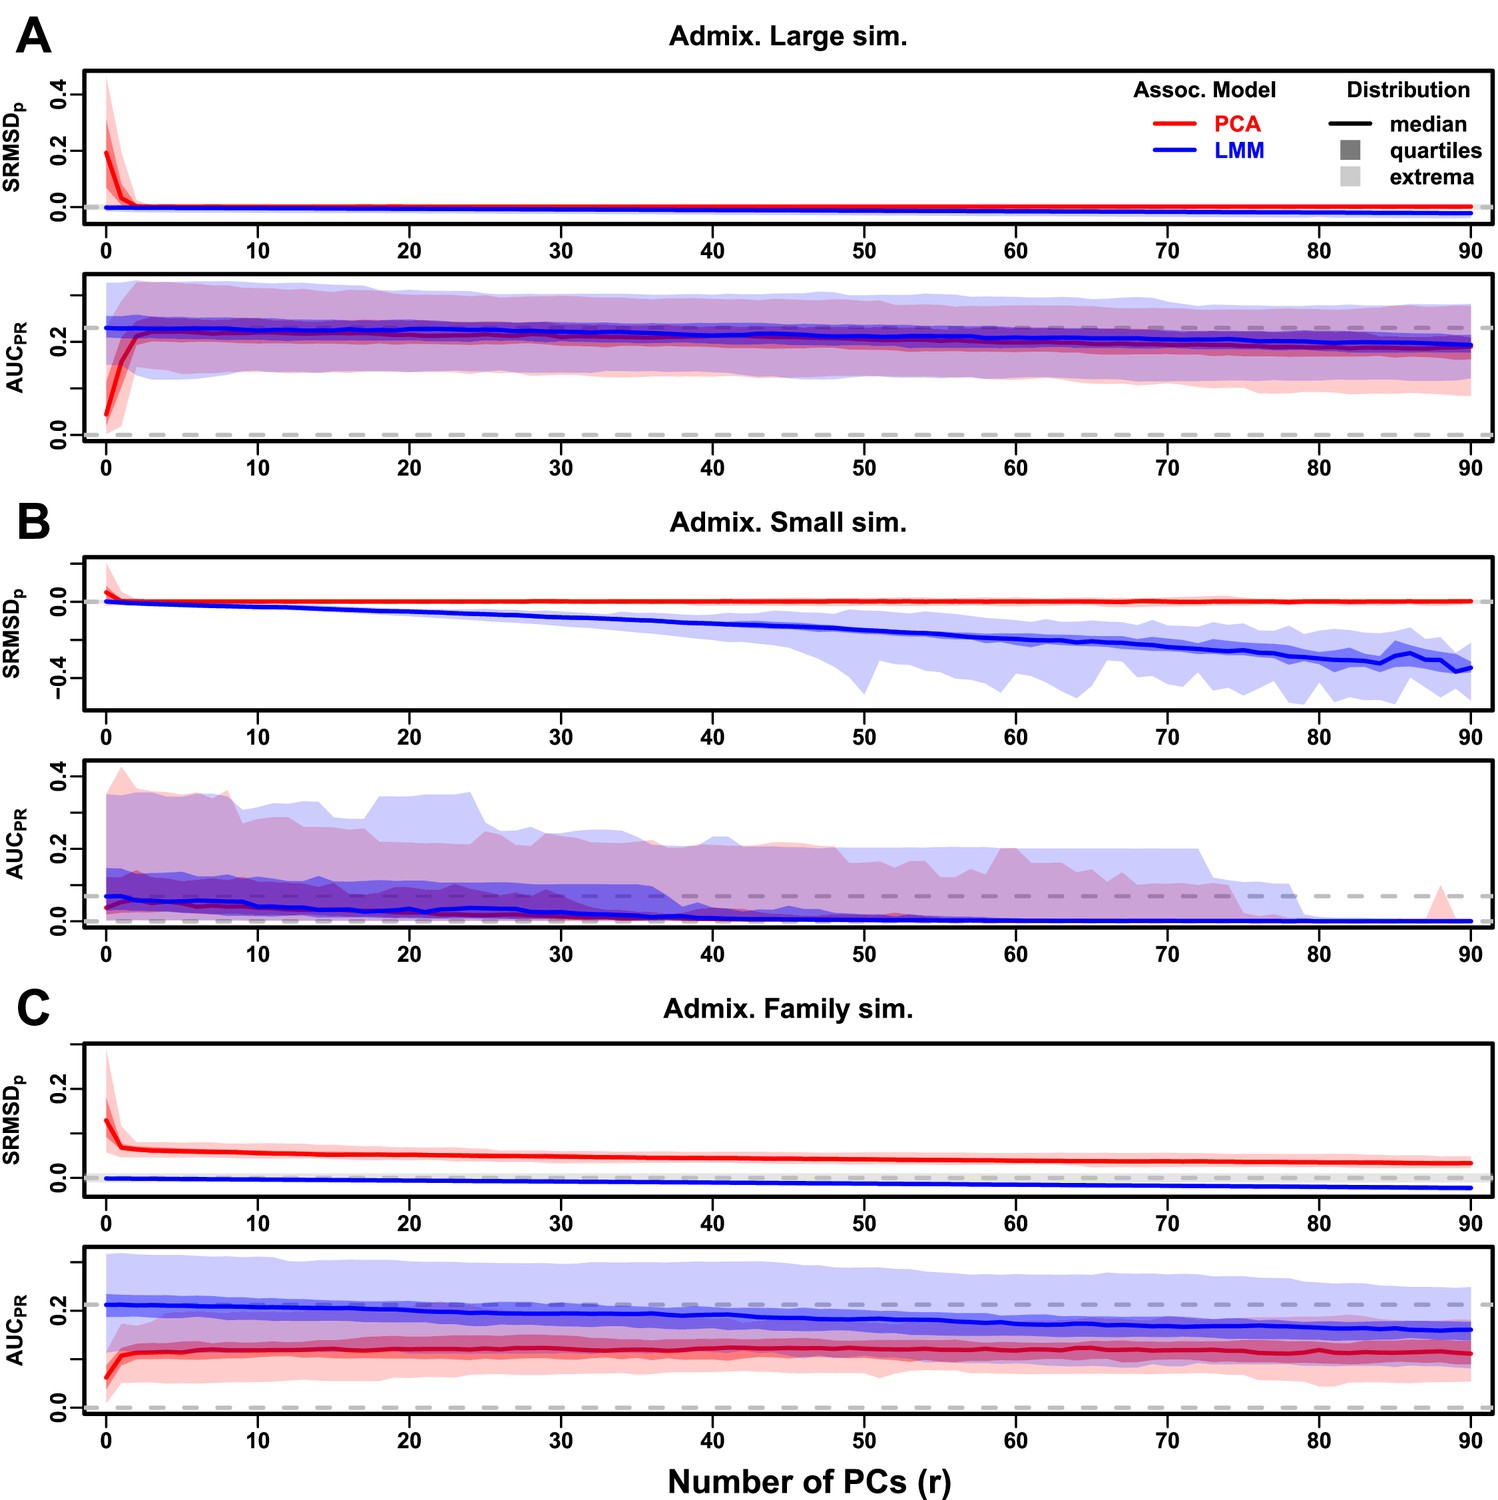
Evaluations in admixture simulations with FES traits, high heritability.
PCA and LMM models have varying number of PCs ( on x-axis), with the distributions (y-axis) of (top subpanel) and (bottom subpanel) for 50 replicates. Best performance is zero and large . Zero and maximum median values are marked with horizontal gray dashed lines, and is marked with a light gray area. LMM performs best with , PCA with various . (A) Large simulation ( individuals). (B) Small simulation () shows overfitting for large . (C) Family simulation () has admixed founders and large numbers of close relatives from a realistic random 20-generation pedigree. PCA performs poorly compared to LMM: for all and large gap.
Figure 3—figure supplement 1
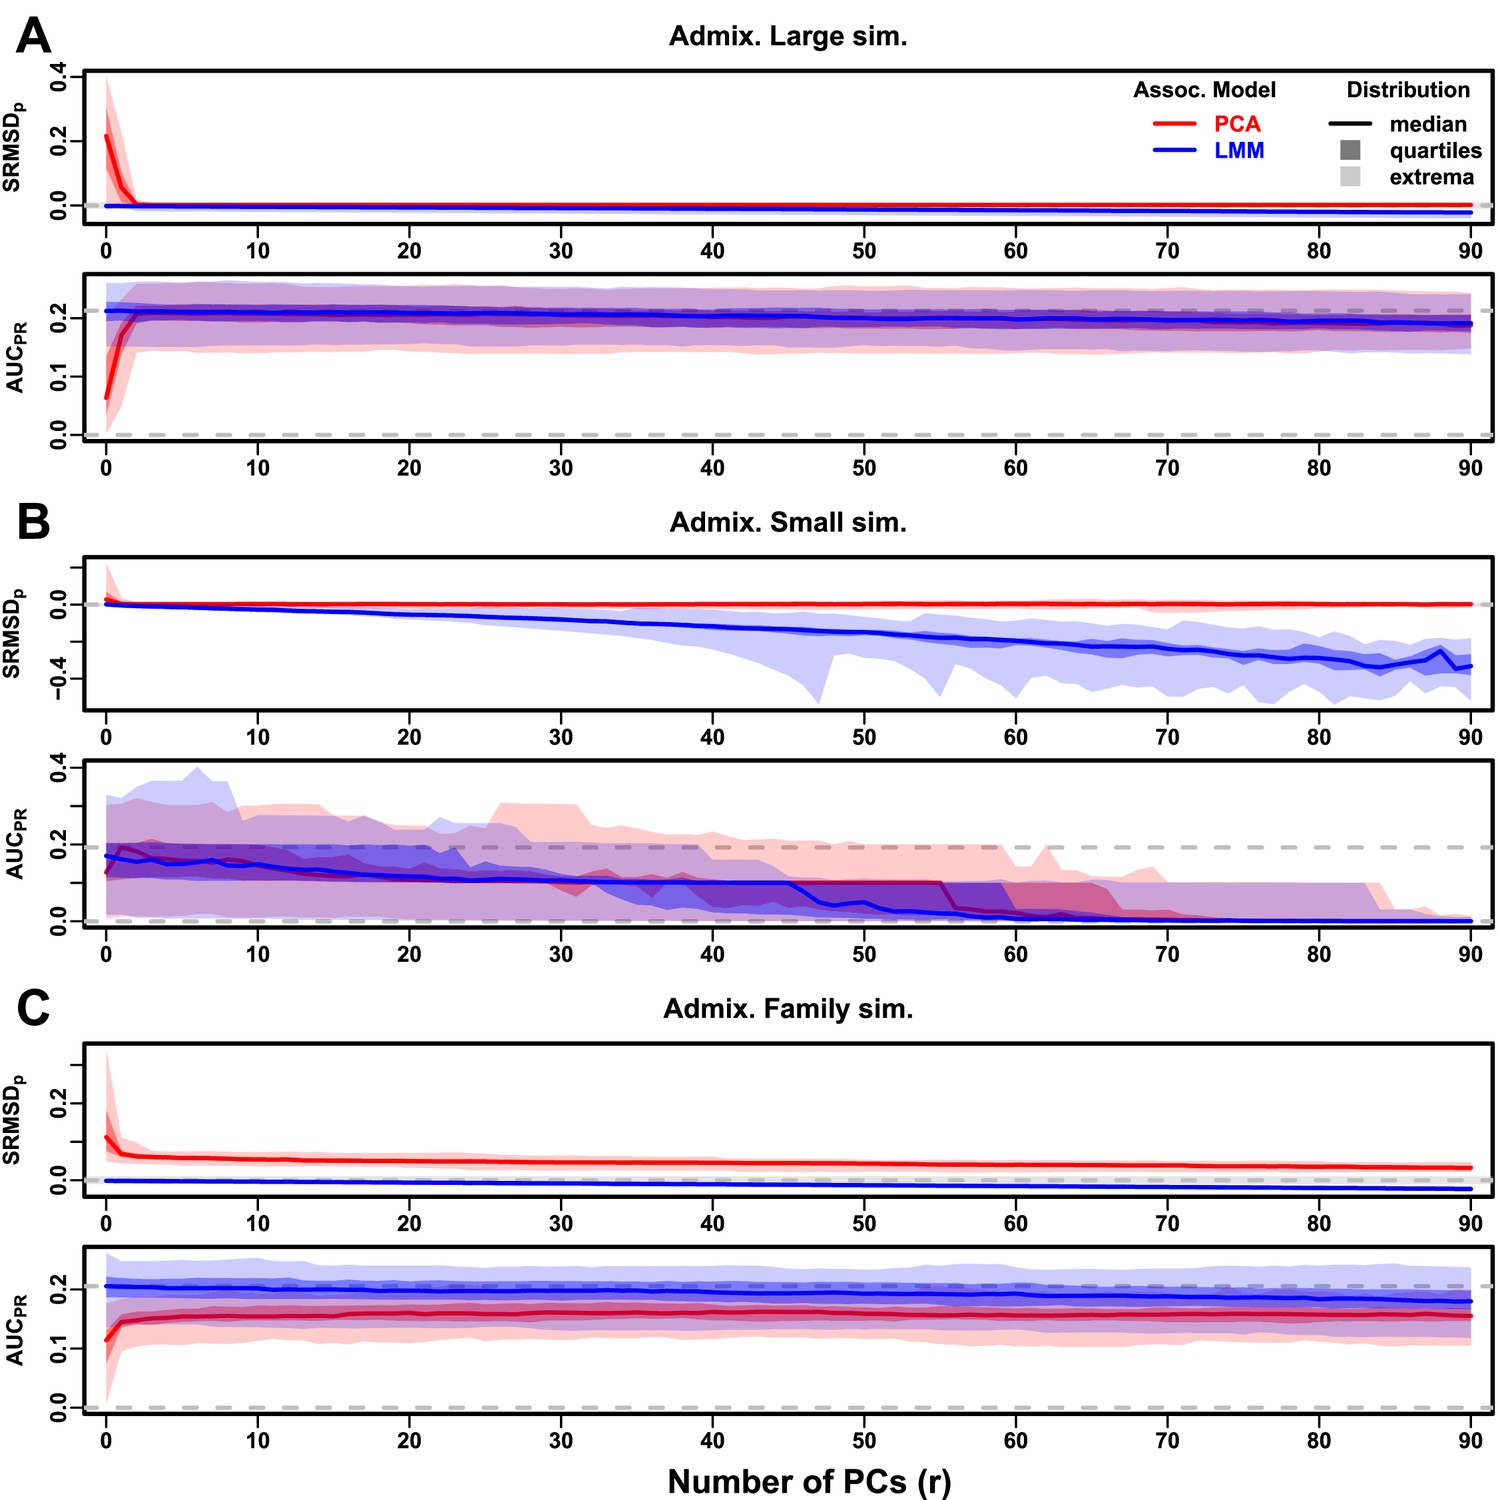
Evaluations in admixture simulations with RC traits, high heritability.
Figure 3—figure supplement 2
Evaluations in admixture simulations with FES traits, low heritability.
Figure 3—figure supplement 3

Evaluations in admixture simulations with RC traits, low heritability.
Figure 3—figure supplement 4
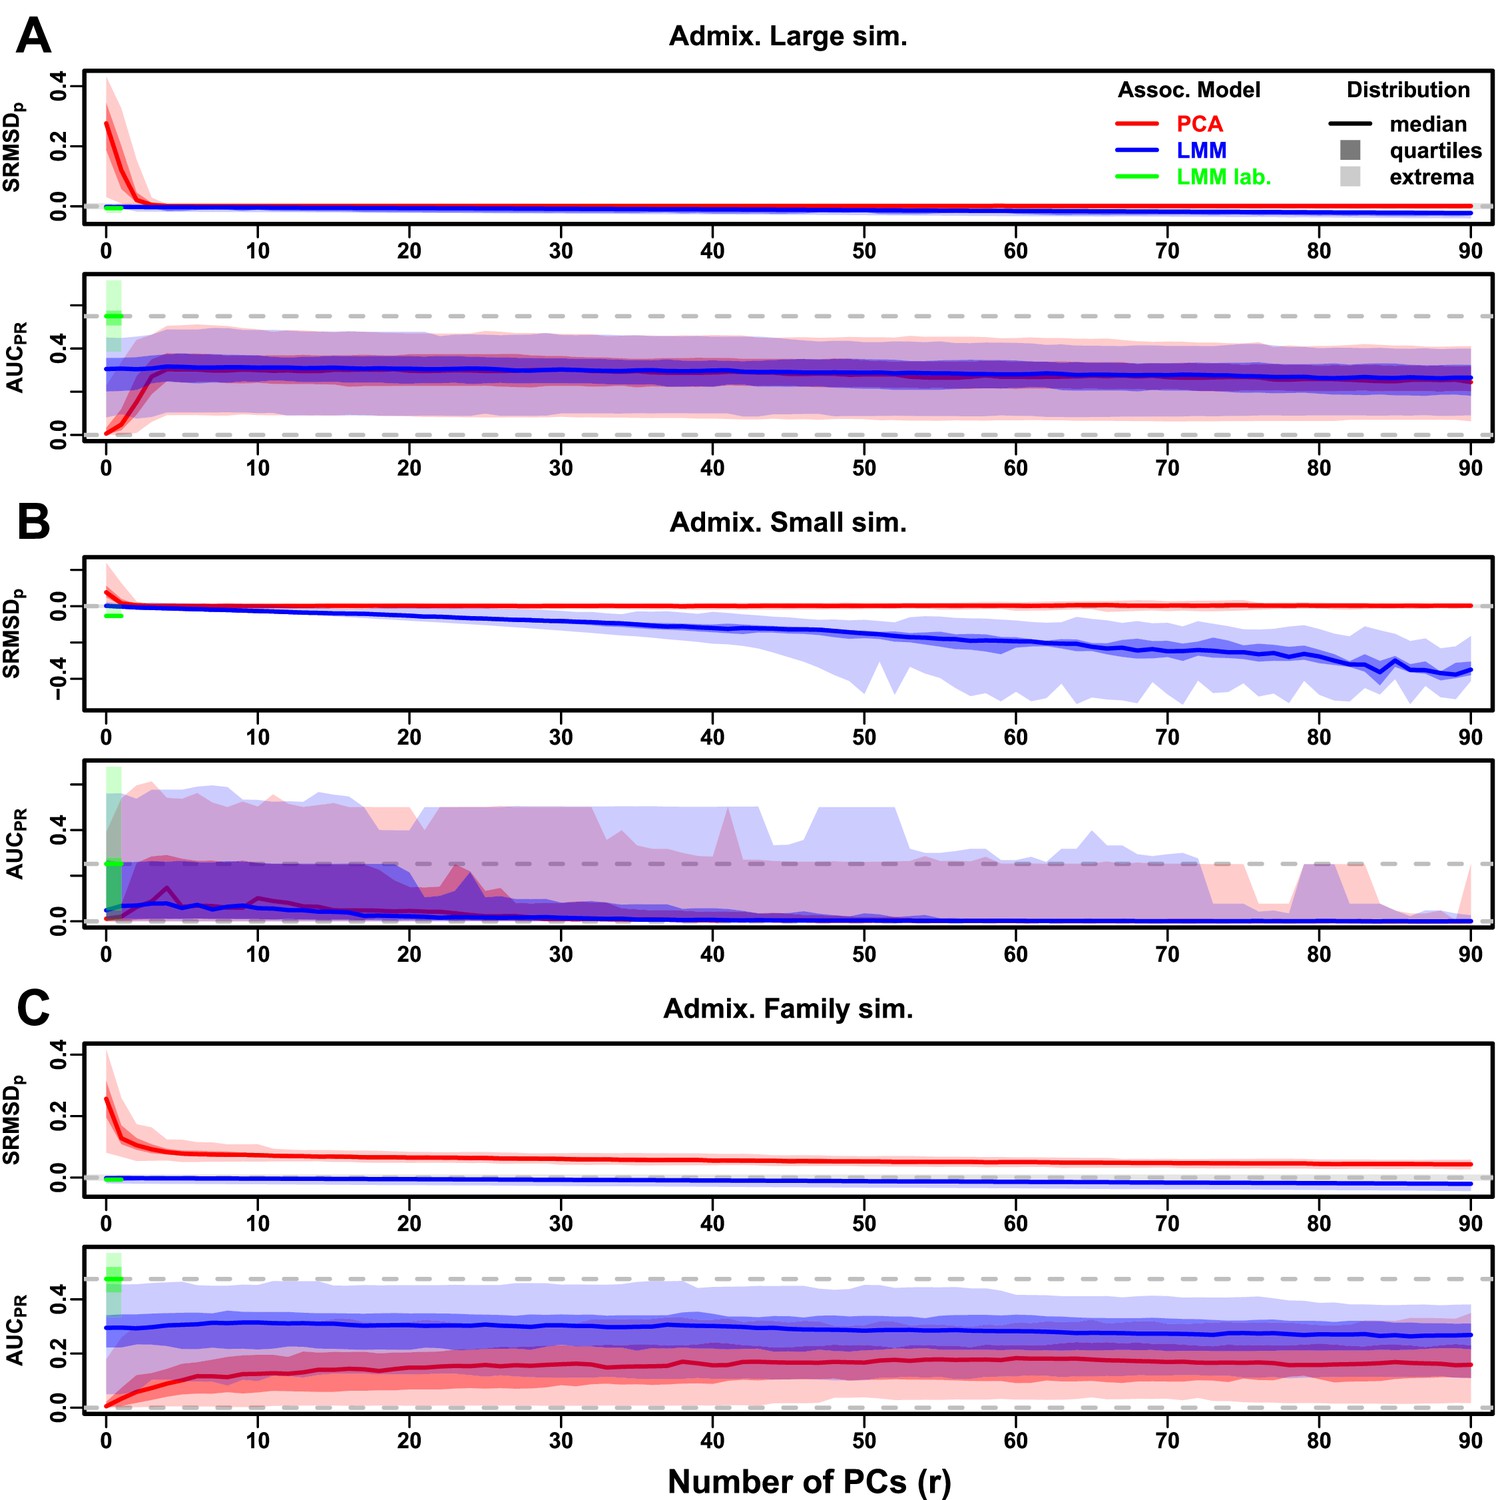
Evaluations in admixture simulations with FES traits, environment.
‘LMM lab.’ was only tested with .
Figure 3—figure supplement 5

Evaluations in admixture simulations with RC traits, environment.
‘LMM lab.’ was only tested with .
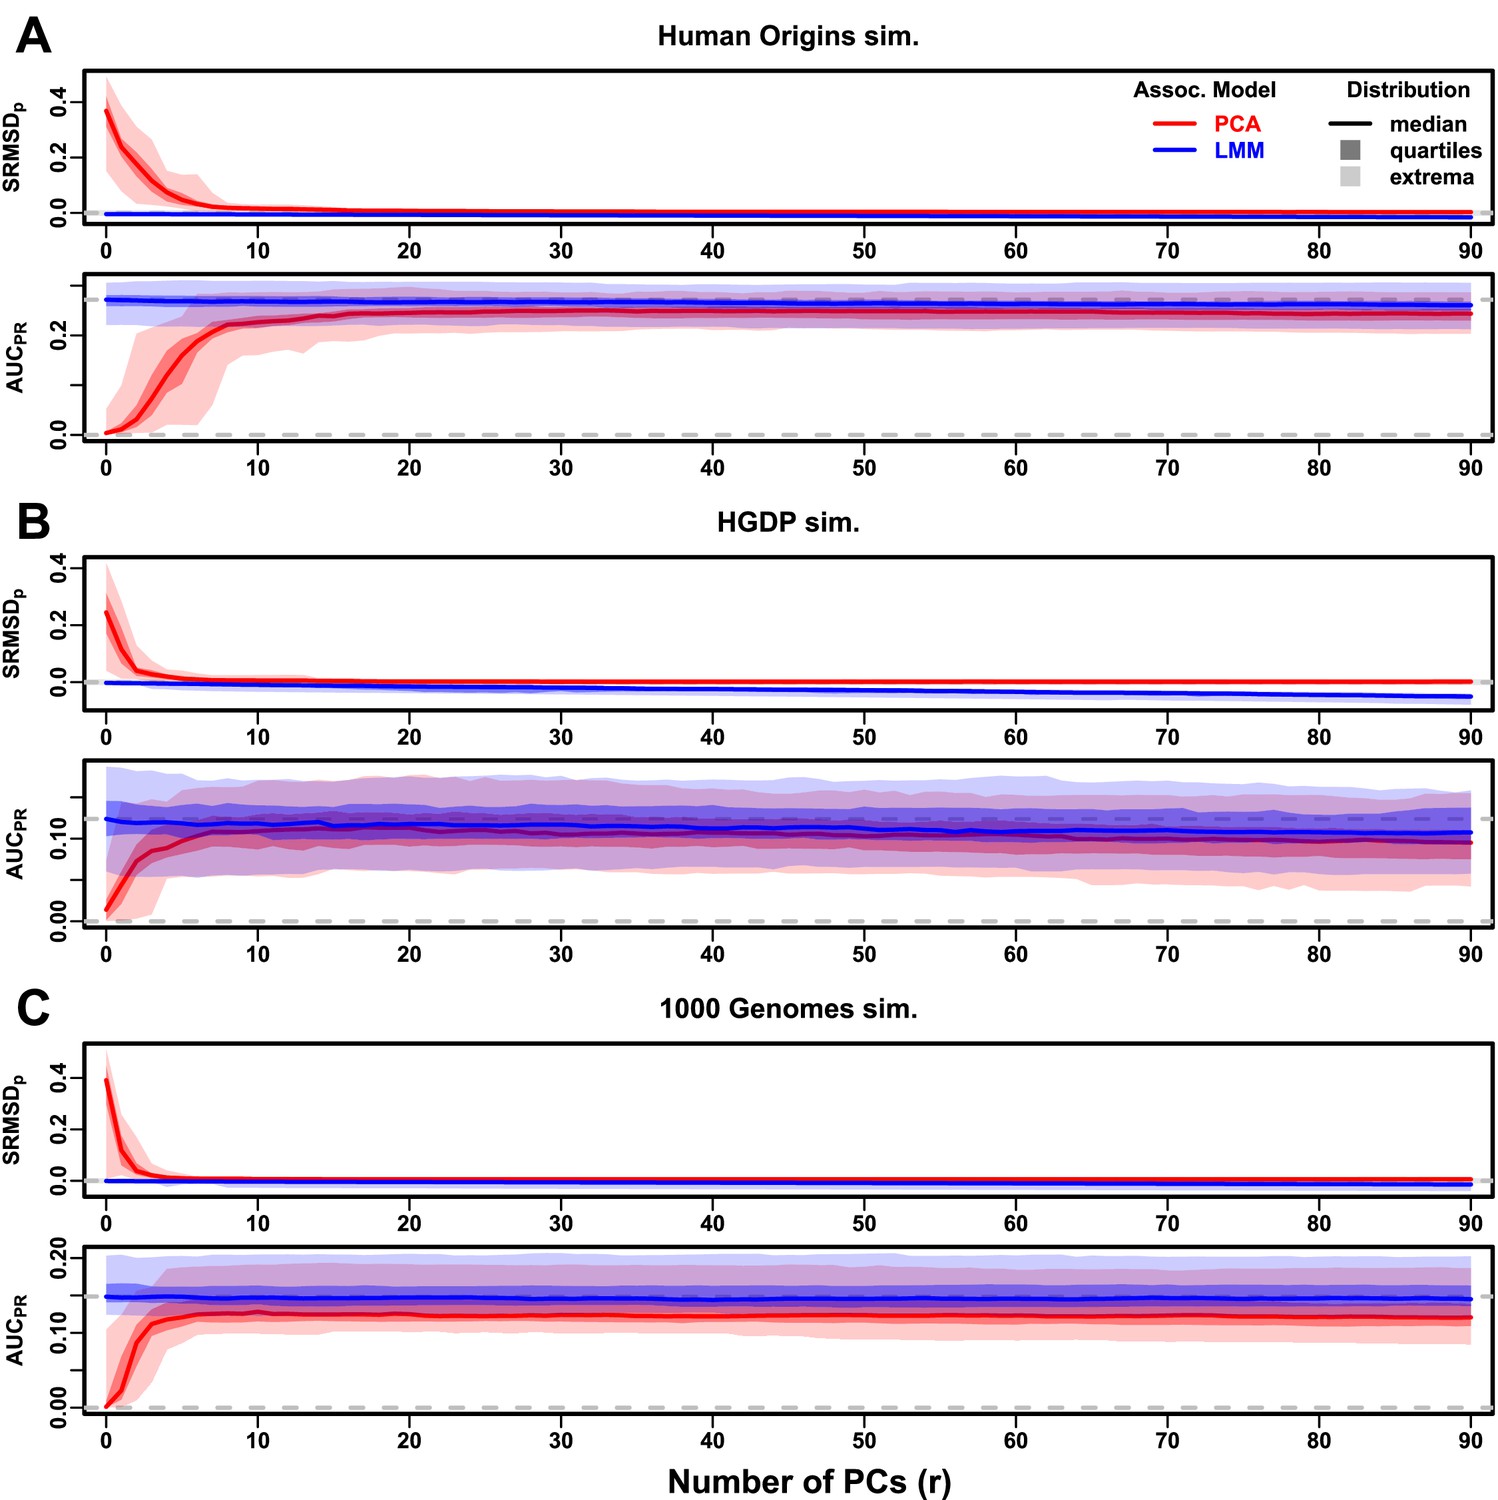
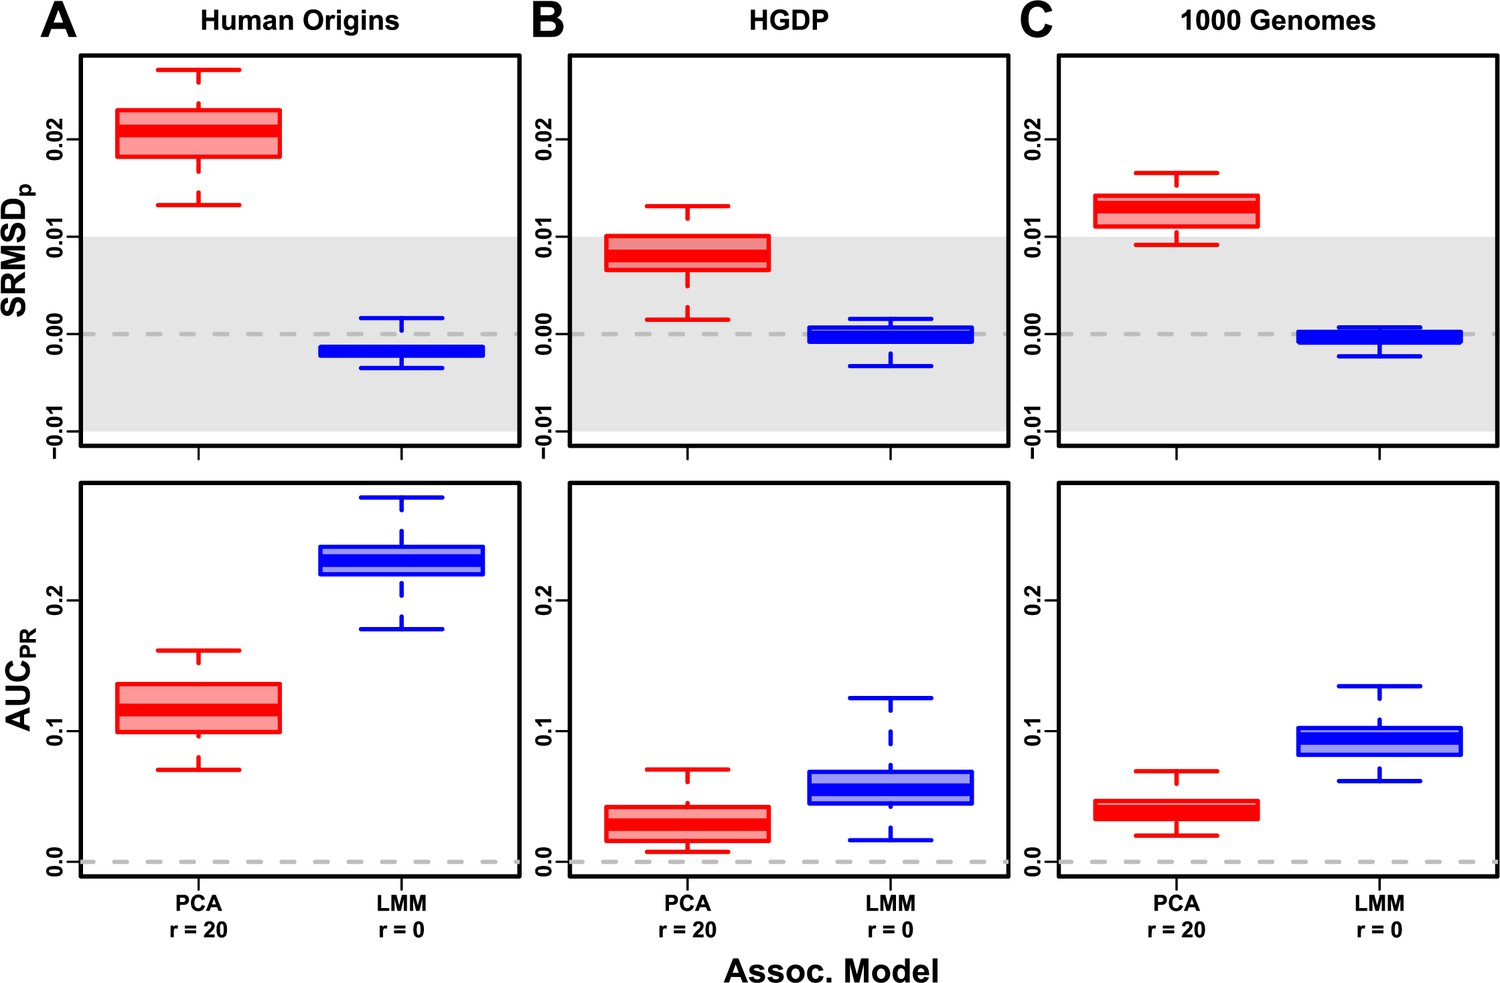
Figure 4 with 5 supplements

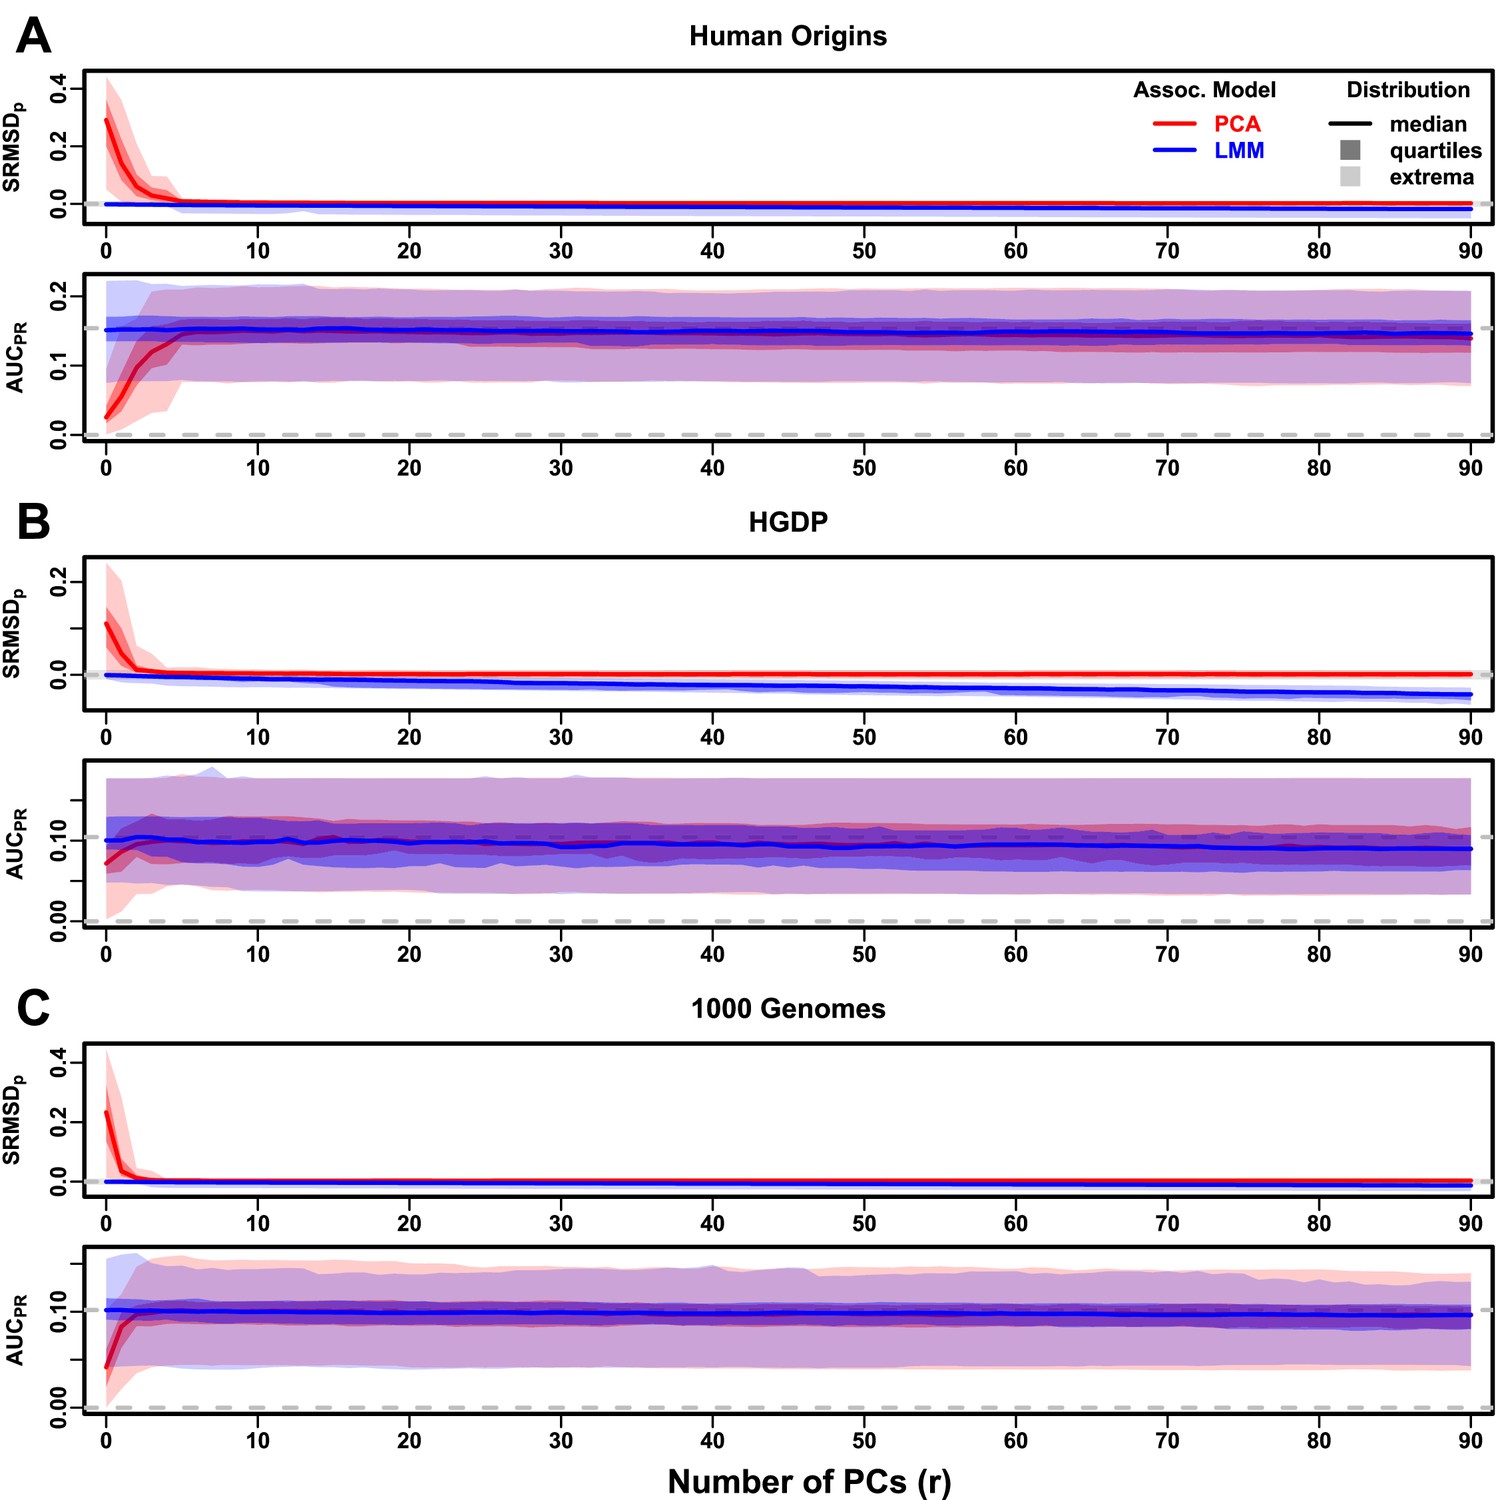
Evaluations in real human genotype datasets with FES traits, high heritability.
Same setup as Figure 3, see that for details. These datasets strongly favor LMM with no PCs over PCA, with distributions that most resemble the family simulation. (A) Human Origins. (B) Human Genome Diversity Panel (HGDP). (C) 1000 Genomes Project.
Figure 4—figure supplement 1

Evaluations in real human genotype datasets with RC traits, high heritability.
Figure 4—figure supplement 2

Evaluations in real human genotype datasets with FES traits, low heritability.
Figure 4—figure supplement 3
Evaluations in real human genotype datasets with RC traits, low heritability.
Figure 4—figure supplement 4

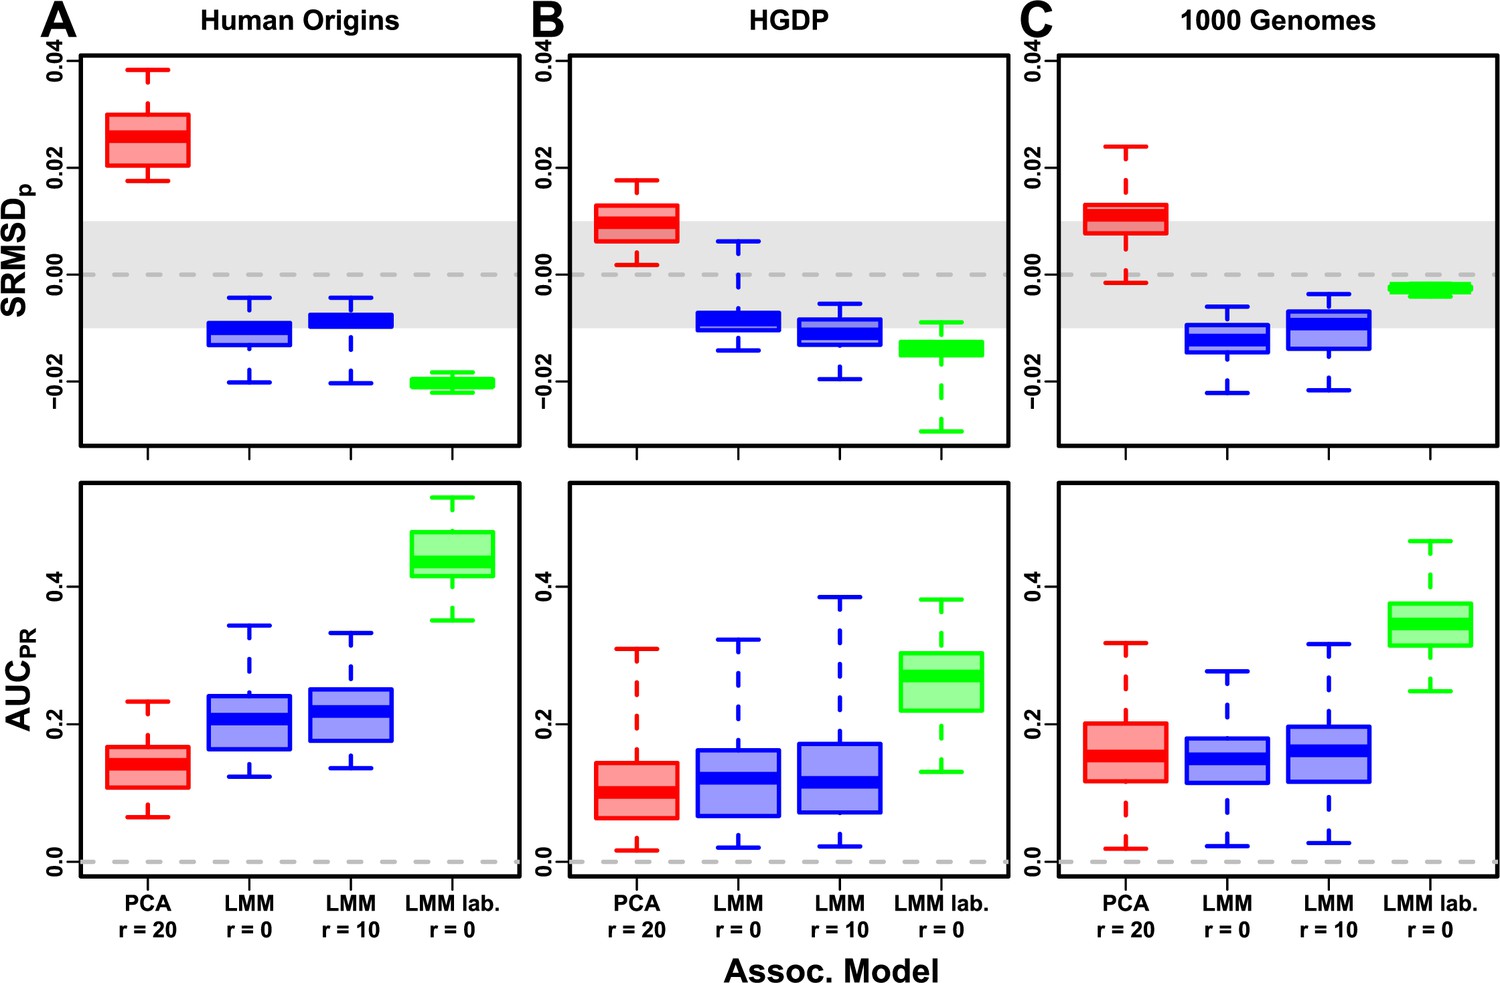
Evaluations in real human genotype datasets with FES traits, environment.
‘LMM lab.’ was only tested with .
Figure 4—figure supplement 5
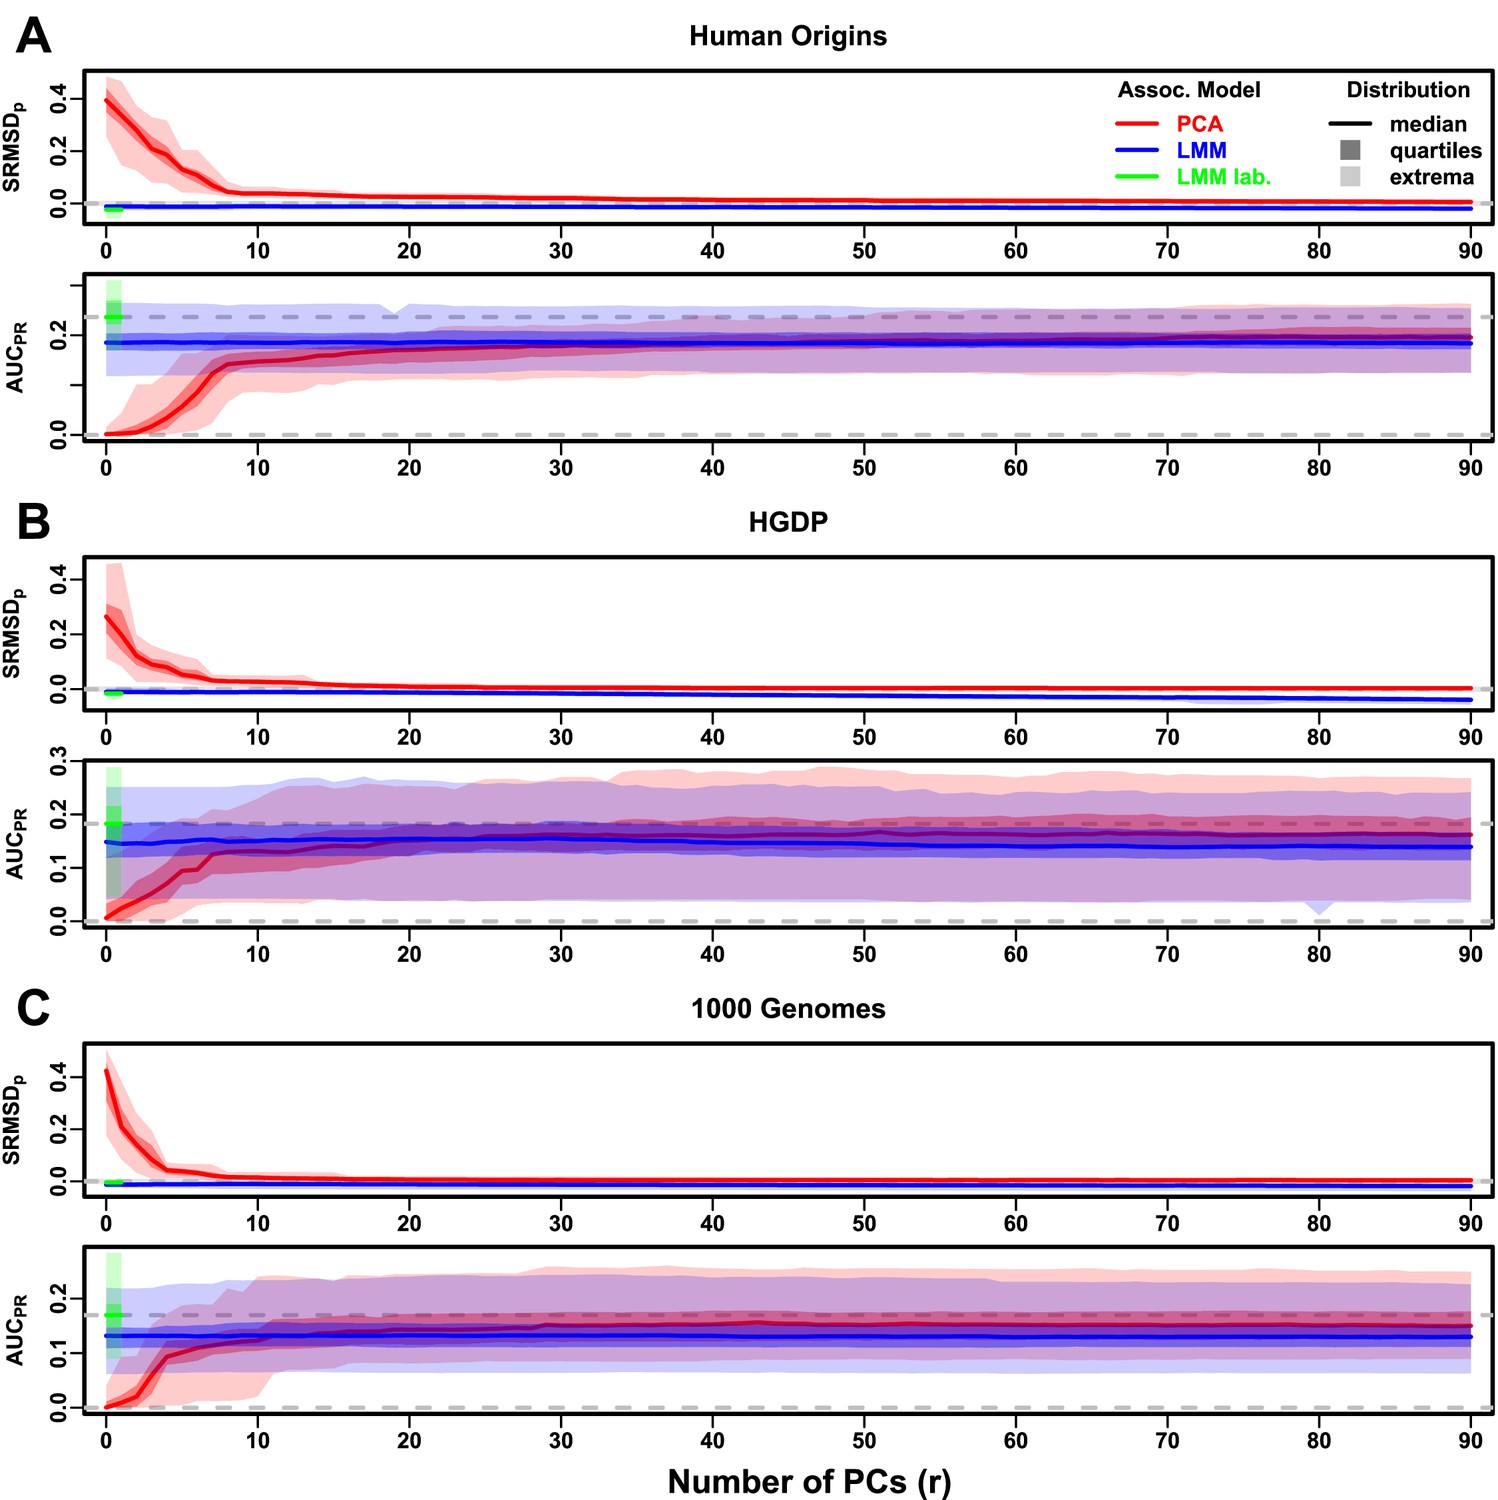
Evaluations in real human genotype datasets with RC traits, environment.
‘LMM lab.’ was only tested with .
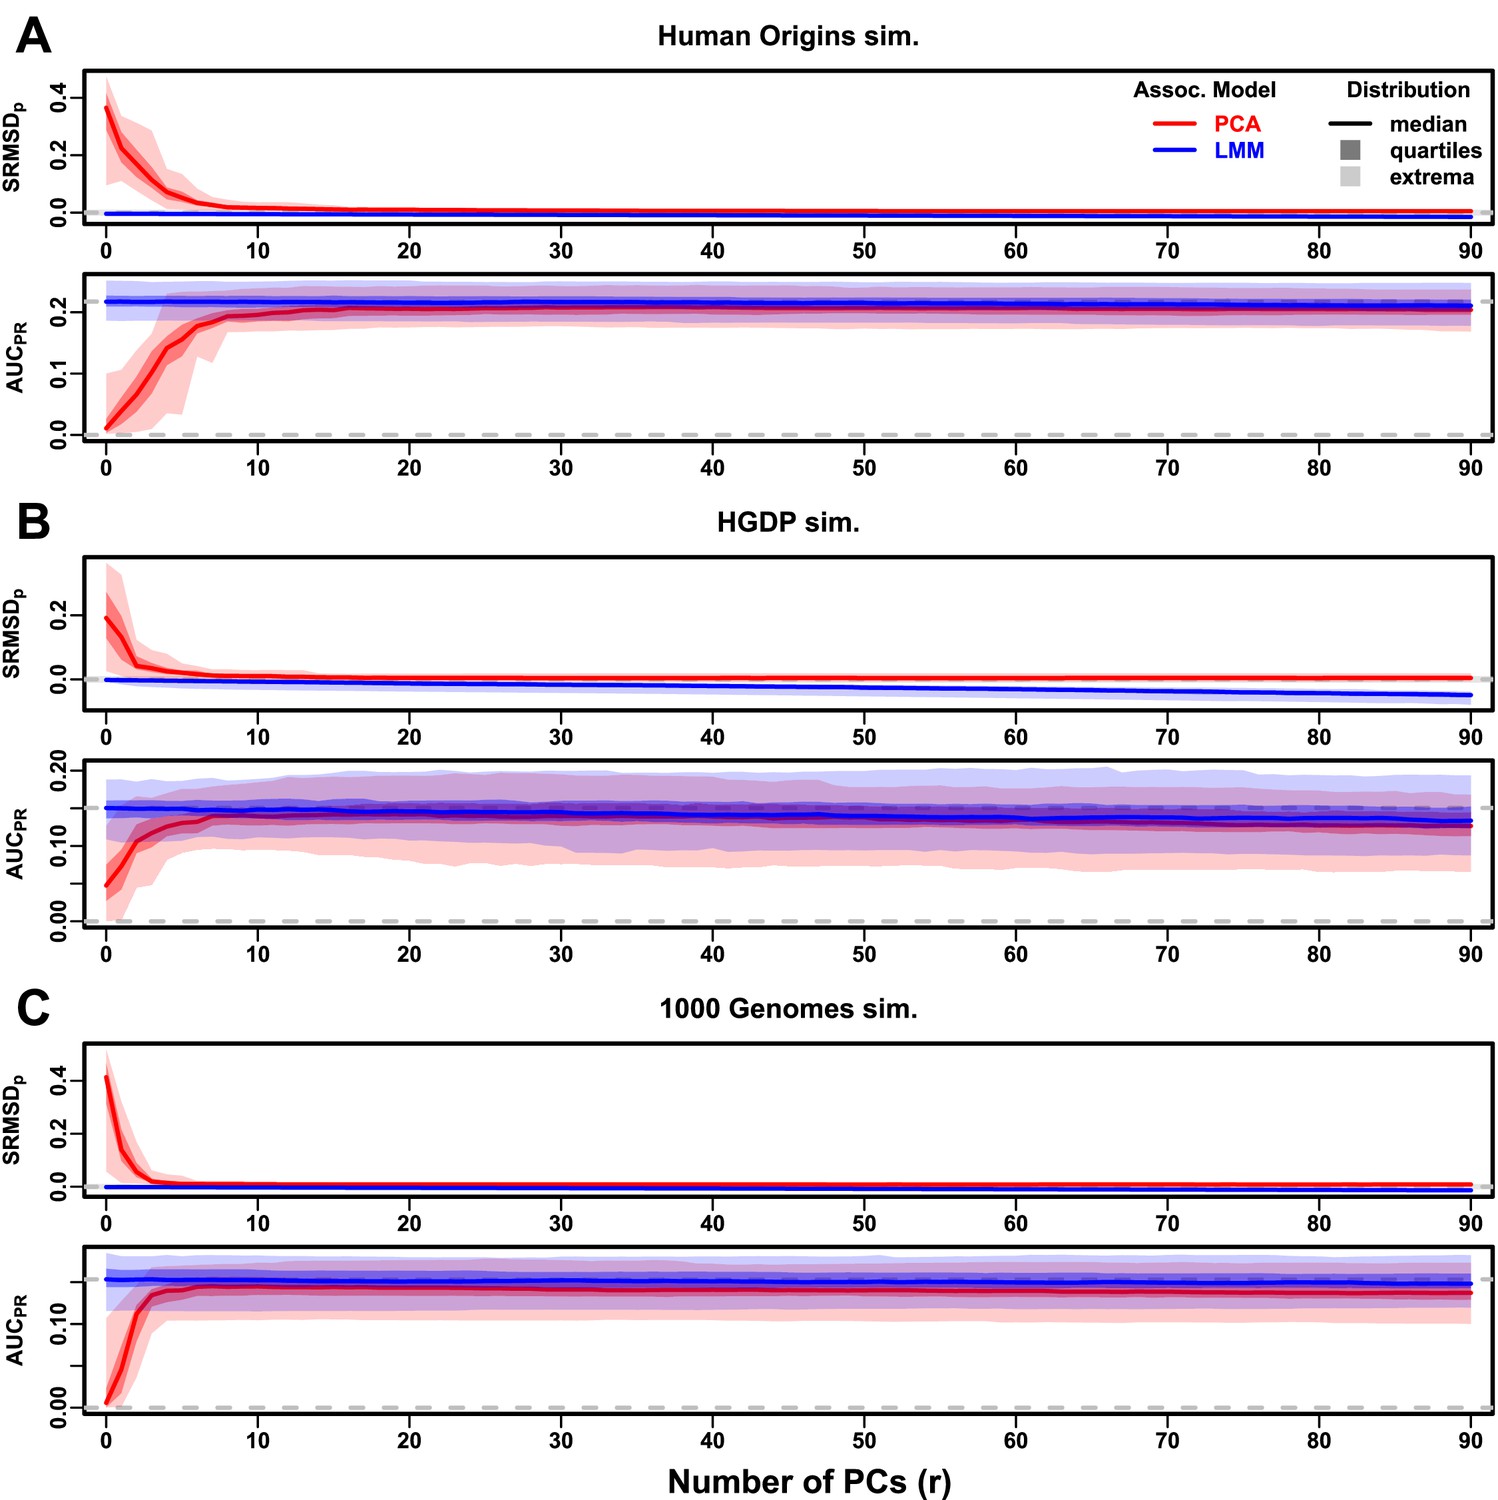
Figure 5 with 1 supplement
Evaluations in subpopulation tree simulations fit to human data with FES traits, high heritability.
Same setup as Figure 3, see that for details. These tree simulations, which exclude family structure by design, do not explain the large gaps in LMM-PCA performance observed in the real data. (A) Human Origins tree simulation. (B) Human Genome Diversity Panel (HGDP) tree simulation. (C) 1000 Genomes Project tree simulation.
Figure 5—figure supplement 1
Evaluations in subpopulation tree simulations fit to human data with RC traits, high heritability.
Figure 6 with 2 supplements
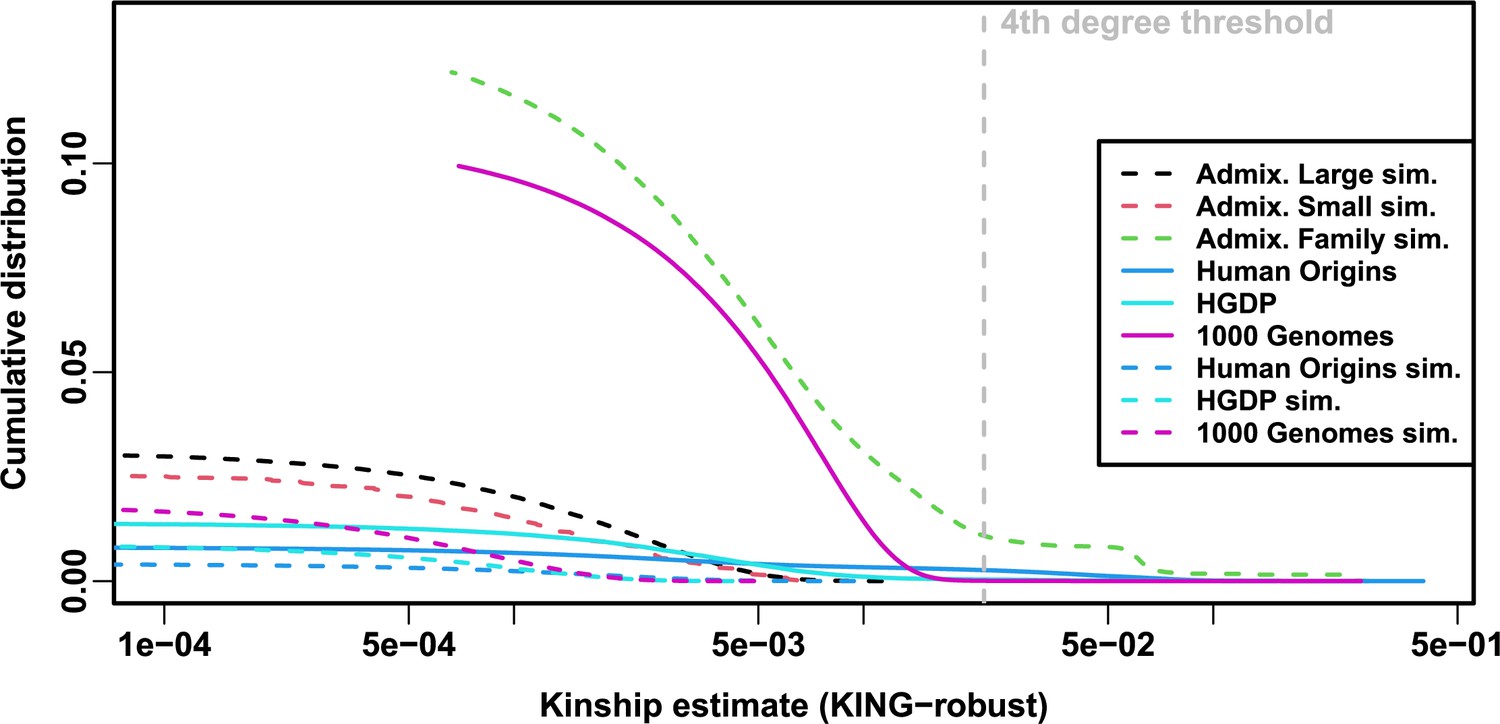
Local kinship distributions.
Curves are complementary cumulative distribution of lower triangular kinship matrix (self kinship excluded) from KING-robust estimator. Note log x-axis; negative estimates are counted but not shown. Most values are below 4th degree relative threshold. Each real dataset has a greater cumulative than its subpopulation tree simulations.
Figure 6—figure supplement 1
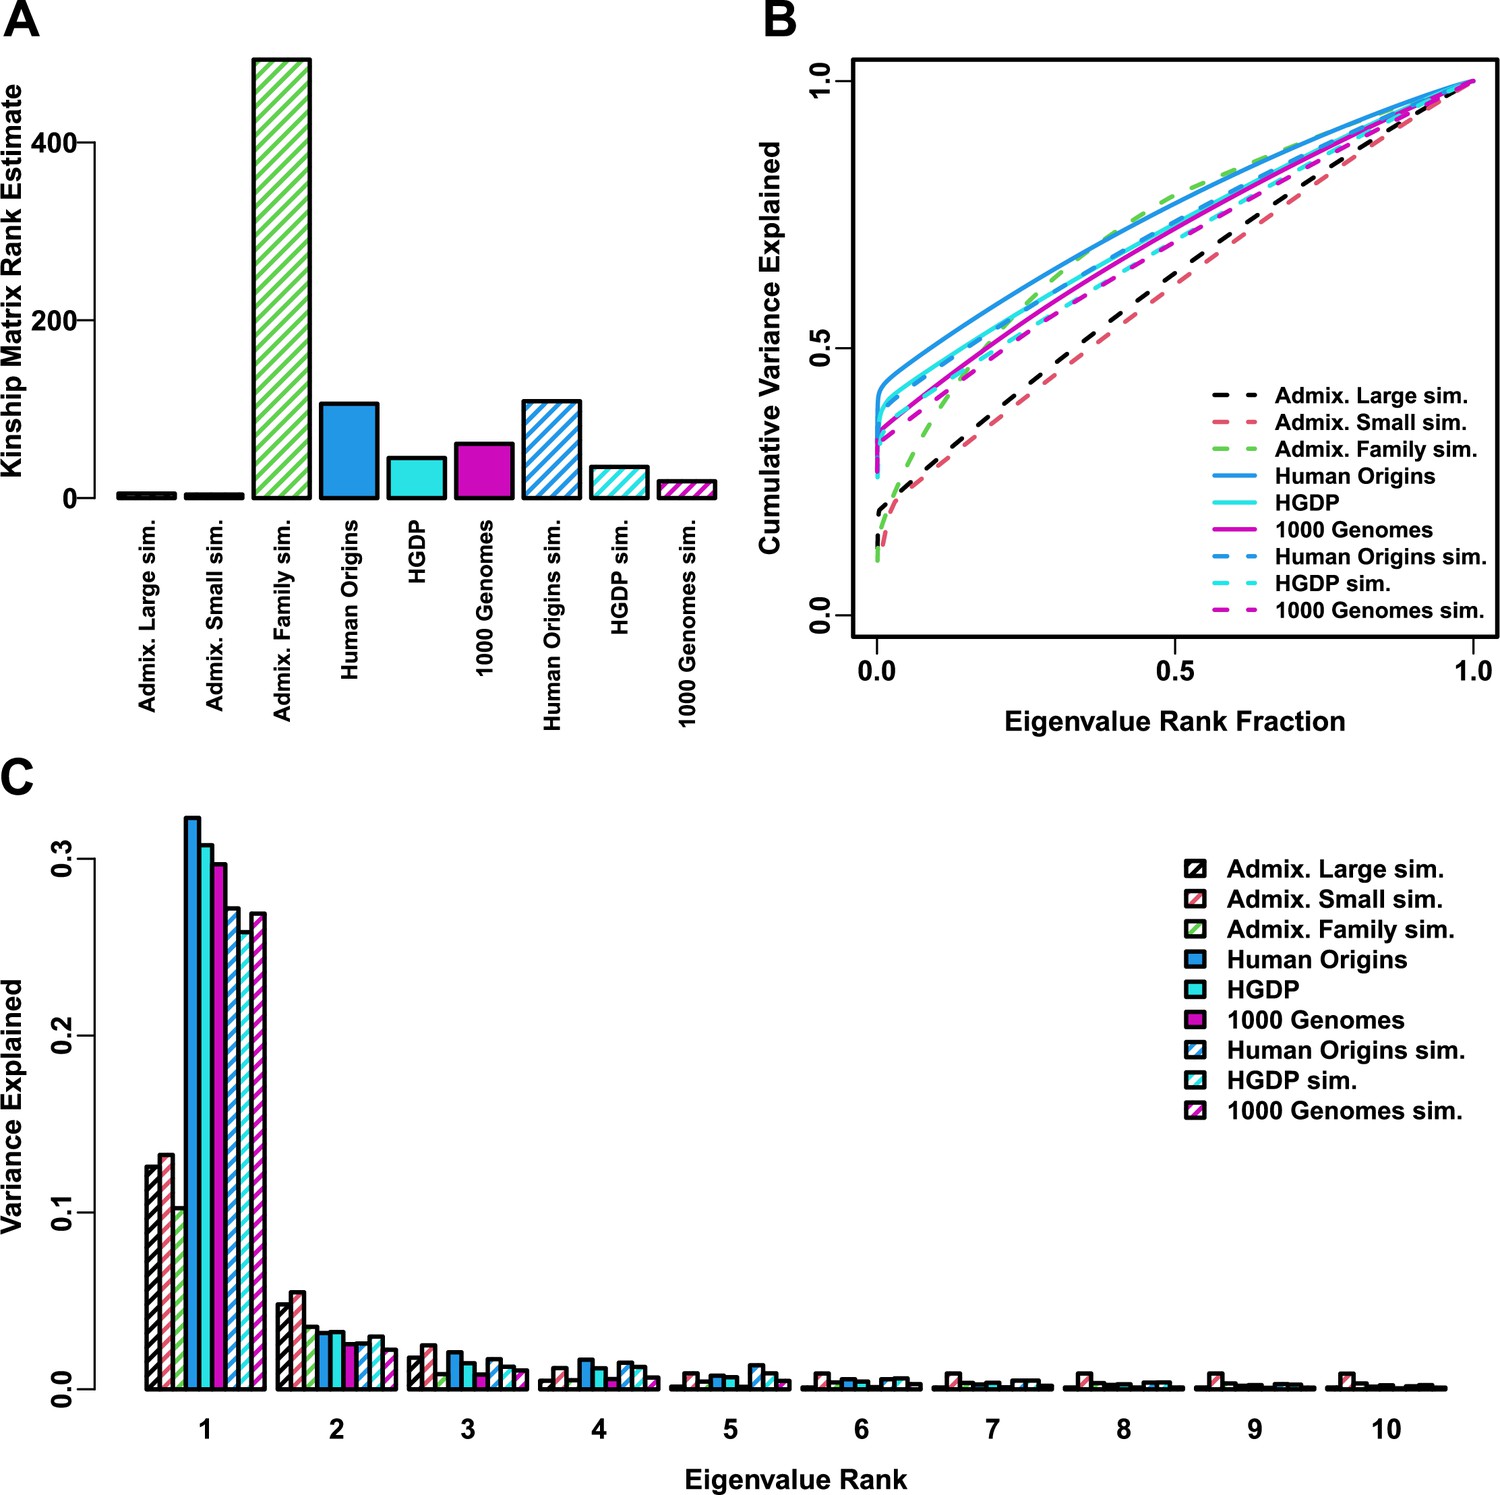
Estimated relatedness dimensions of datasets.
(A) Kinship matrix rank estimated with the Tracy-Widom test with . (B) Cumulative variance explained versus eigenvalue rank fraction. (C) Variance explained by first 10 eigenvalues.
Figure 6—figure supplement 2

Number of PCs significantly associated with traits.
PCs are tested using an ordinary linear regression sequentially, with the th PC tested conditionally on the previous PCs and the intercept. Q-values are estimated from the 90 p-values (one for each PC in a given dataset and replicate) using the R package qvalue assuming (necessary since the default estimates were unreliable for such small numbers of p-values and occasionally produced errors), and an FDR threshold of 0.05 is used to determine the number of significant PCs. Distribution per dataset is over its 50 replicates. Shown are results for FES traits with (the results for RC were very similar, not shown).
Figure 7 with 1 supplement
Evaluation in real datasets excluding 4th degree relatives, FES traits, high heritability.
Each dataset is a column, rows are measures. Boxplot whiskers are extrema over 50 replicates. First row has band marked as gray area.
Figure 7—figure supplement 1

Evaluation in real datasets excluding 4th degree relatives, FES traits, low heritability.
Figure 8 with 1 supplement
Evaluation in real datasets excluding 4th degree relatives, FES traits, environment.
Traits simulated with environment effects, otherwise the same as Figure 7. ‘LMM lab.’ includes as fixed effects true groups from which environment was simulated.
Figure 8—figure supplement 1
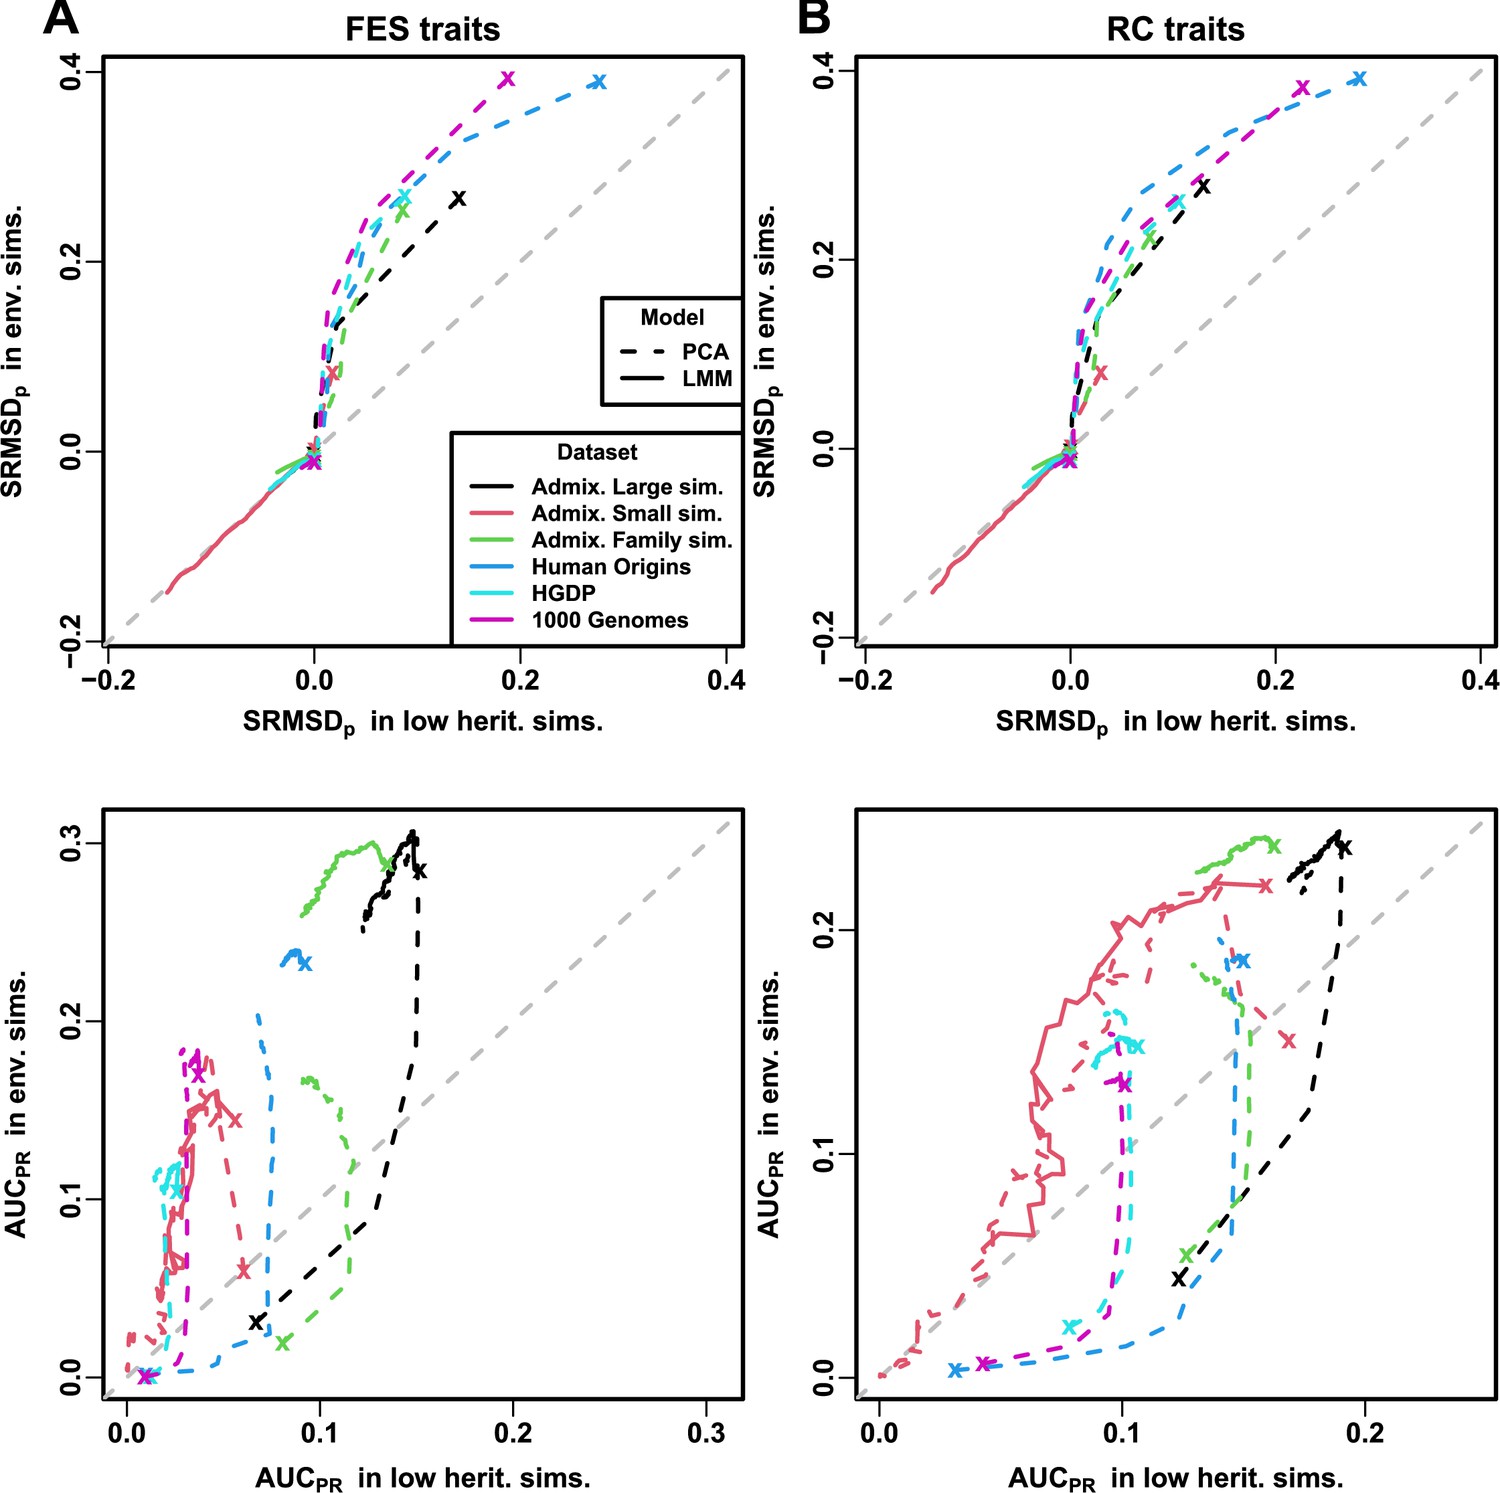
Comparison of performance in low heritability vs environment simulations.
Each curve traces as the number of PCs is increased from (marked with an “x”) until (unmarked end), on one axis is the mean value over replicates of either or , for low heritability simulations on the x-axis and environment simulations on the y-axis. Each curve corresponds to one dataset (color) and association model (solid or dashed line type). Columns: (A) FES and (B) RC traits show similar results. First row shows that for PCA curves (dashed), is higher (worse) in environment simulations for low , but becomes equal in both simulations once is sufficiently large; for LMM curves (solid), is equal in both simulations for all , all datasets. Second row shows that for PCA, is higher (better) in low heritability simulations for low , but becomes higher in environment simulations once is sufficiently large; for LMM, performance is better in environment simulations for all , all datasets.
Tables
Table 1
Previous PCA-LMM evaluations in the literature.
| Sim. Genotypes | General | |||||||
|---|---|---|---|---|---|---|---|---|
| Publication | Type* | † | ‡ | Real § | Trait ¶ | Power | Best | |
| Zhao et al., 2007 | ✓ | Q | ✓ | 8 | LMM | |||
| Zhu and Yu, 2009 | I, A, F | 3, 8 | ≤0.15 | ✓ | Q | ✓ | 1–22 | LMM |
| Astle and Balding, 2009 | I | 3 | 0.10 | CC | ✓ | 10 | Tie | |
| Kang et al., 2010 | ✓ | Both | 2–100 | LMM | ||||
| Price et al., 2010 | I, F | 2 | 0.01 | CC | 1 | Mixed | ||
| Wu et al., 2011 | I, A | 2–4 | 0.01 | CC | ✓ | 10 | Mixed | |
| Liu et al., 2011 | S, A | 2–3 | R | Q | ✓ | 10 | Tie | |
| Sul and Eskin, 2013 | I | 2 | 0.01 | CC | 1 | Tie | ||
| Tucker et al., 2014 | I | 2 | 0.05 | ✓ | Both | ✓ | 5 | Tie |
| Yang et al., 2014 | ✓ | CC | ✓ | 5 | Tie | |||
| Song et al., 2015 | S, A | 2–3 | R | Q | 3 | LMM | ||
| Loh et al., 2015 | ✓ | Q | ✓ | 10 | LMM | |||
| Zhang and Pan, 2015 | ✓ | Q | ✓ | 20–100 | LMM | |||
| Liu et al., 2016 | ✓ | Q | ✓ | 3–6 | LMM | |||
| Sul et al., 2018 | ✓ | Q | 100 | LMM | ||||
| Loh et al., 2018 | ✓ | Both | ✓ | 20 | LMM | |||
| Mbatchou et al., 2021 | ✓ | Both | 1 | LMM | ||||
| This work | A, T, F | 10–243 | ≤0.25 | ✓ | Q | ✓ | 0–90 | LMM |
-
*
Genotype simulation types. I: Independent subpopulations; S: subpopulations (with parameters drawn from real data); A: Admixture; T: Subpopulation Tree; F: Family.
-
†
Model dimension (number of subpopulations or ancestries).
-
‡
R: simulated parameters based on real data, not reported.
-
§
Evaluations using unmodified real genotypes.
-
¶
Q: quantitative; CC: case-control.
Table 2
Features of simulated and real human genotype datasets.
| Dataset | Type | Ind. () | Subpops.* () | Causal loci† () | ‡ | |
|---|---|---|---|---|---|---|
| Admix. Large sim. | Admix. | 100 000 | 1000 | 10 | 100 | 0.1 |
| Admix. Small sim. | Admix. | 100 000 | 100 | 10 | 10 | 0.1 |
| Admix. Family sim. | Admix.+Pedig. | 100 000 | 1000 | 10 | 100 | 0.1 |
| Human Origins | Real | 190 394 | 2922 | 11–243 | 292 | 0.28 |
| HGDP | Real | 771 322 | 929 | 7–54 | 93 | 0.28 |
| 1000 Genomes | Real | 1 111 266 | 2504 | 5–26 | 250 | 0.22 |
| Human Origins sim. | Tree | 190 394 | 2922 | 243 | 292 | 0.23 |
| HGDP sim. | Tree | 771 322 | 929 | 54 | 93 | 0.25 |
| 1000 Genomes sim. | Tree | 1 111 266 | 2504 | 26 | 250 | 0.21 |
-
*
For admixed family, ignores additional model dimension of 20 generation pedigree structure. For real datasets, lower range is continental subpopulations, upper range is number of fine-grained subpopulations.
-
†
to balance power across datasets, shown for only.
-
‡
Model parameter for simulations, estimated value on real datasets.
Table 3
Overview of PCA and LMM evaluations for high heritability simulations.
| LMM vs best | PCA vs LMM | ||||||||
|---|---|---|---|---|---|---|---|---|---|
| Dataset | Metric | Trait* | Cal.† | Best ‡ | P-value § | Best ‡ | Cal.† | P-value § | Best model ¶ |
| Admix. Large sim. | FES | True | 0 | 1 | 12 | True | 0.036 | Tie | |
| Admix. Small sim. | FES | True | 0 | 1 | 4 | True | 0.055 | Tie | |
| Admix. Family sim. | FES | True | 0 | 1 | 90 | False | 3.9e-10* | LMM | |
| Human Origins | FES | True | 0 | 1 | 89 | False | 3.9e-10* | LMM | |
| HGDP | FES | True | 0 | 1 | 87 | True | 4.4e-10* | LMM | |
| 1000 Genomes | FES | True | 0 | 1 | 90 | False | 3.9e-10* | LMM | |
| Human Origins sim. | FES | True | 0 | 1 | 88 | True | 0.017 | Tie | |
| HGDP sim. | FES | True | 0 | 1 | 47 | True | 0.046 | Tie | |
| 1000 Genomes sim. | FES | True | 0 | 1 | 78 | True | 9.6e-10* | LMM | |
| Admix. Large sim. | RC | True | 0 | 1 | 26 | True | 0.11 | Tie | |
| Admix. Small sim. | RC | True | 0 | 1 | 4 | True | 0.00097 | Tie | |
| Admix. Family sim. | RC | True | 0 | 1 | 90 | False | 3.9e-10* | LMM | |
| Human Origins | RC | True | 0 | 1 | 90 | True | 0.00065 | Tie | |
| HGDP | RC | True | 0 | 1 | 37 | True | 1.5e-05* | LMM | |
| 1000 Genomes | RC | True | 0 | 1 | 76 | True | 3.9e-10* | LMM | |
| Human Origins sim. | RC | True | 0 | 1 | 85 | True | 0.14 | Tie | |
| HGDP sim. | RC | True | 0 | 1 | 44 | True | 8.8e-07* | LMM | |
| 1000 Genomes sim. | RC | True | 0 | 1 | 90 | True | 3.9e-10* | LMM | |
| Admix. Large sim. | FES | 0 | 1 | 3 | 5.9e-06* | LMM | |||
| Admix. Small sim. | FES | 0 | 1 | 2 | 0.025 | Tie | |||
| Admix. Family sim. | FES | 1 | 0.35 | 22 | 3.9e-10* | LMM | |||
| Human Origins | FES | 0 | 1 | 34 | 3.9e-10* | LMM | |||
| HGDP | FES | 1 | 0.33 | 16 | 4.4e-10* | LMM | |||
| 1000 Genomes | FES | 1 | 0.11 | 8 | 3.9e-10* | LMM | |||
| Human Origins sim. | FES | 0 | 1 | 36 | 3.9e-10* | LMM | |||
| HGDP sim. | FES | 0 | 1 | 17 | 1.7e-05* | LMM | |||
| 1000 Genomes sim. | FES | 0 | 1 | 10 | 5e-10* | LMM | |||
| Admix. Large sim. | RC | 0 | 1 | 3 | 1.4e-05* | LMM | |||
| Admix. Small sim. | RC | 0 | 1 | 1 | 0.095 | Tie | |||
| Admix. Family sim. | RC | 0 | 1 | 34 | 3.9e-10* | LMM | |||
| Human Origins | RC | 3 | 0.4 | 36 | 9.6e-10* | LMM | |||
| HGDP | RC | 4 | 0.21 | 16 | 0.013 | Tie | |||
| 1000 Genomes | RC | 5 | 0.004 | 9 | 0.00043 | Tie | |||
| Human Origins sim. | RC | 0 | 1 | 37 | 4.1e-10* | LMM | |||
| HGDP sim. | RC | 3 | 0.087 | 17 | 0.0014 | Tie | |||
| 1000 Genomes sim. | RC | 3 | 0.37 | 10 | 8.5e-10* | LMM | |||
-
*
FES: Fixed Effect Sizes, RC: Random Coefficients.
-
†
Calibrated: whether mean over 50 replicates.
-
‡
Value of (number of PCs) with minimum mean or maximum mean .
-
§
Wilcoxon paired 1-tailed test of distributions ( or ) between models in header. Asterisk marks significant value using Bonferroni threshold ( with and is the number of tests in this table).
-
¶
Tie if no significant difference using Bonferroni threshold.
Table 4
Dataset sizes after 4th degree relative filter.
| Dataset | Loci () | Ind. () | Ind. removed (%) |
|---|---|---|---|
| Human Origins | 189 722 | 2636 | 9.8 |
| HGDP | 758 009 | 847 | 8.8 |
| 1000 Genomes | 1 097 415 | 2390 | 4.6 |
Table 5
Overview of PCA and LMM evaluations for low heritability simulations.
| LMM vs best | PCA vs LMM | ||||||||
|---|---|---|---|---|---|---|---|---|---|
| Dataset | Metric | Trait* | Cal.† | Best ‡ | p-value § | Best ‡ | Cal.† | p-value § | Best model ¶ |
| Admix. Large sim. | FES | True | 0 | 1 | 62 | True | 0.00012* | LMM | |
| Admix. Small sim. | FES | True | 0 | 1 | 3 | True | 0.27 | Tie | |
| Admix. Family sim. | FES | True | 0 | 1 | 90 | False | 3.9e-10* | LMM | |
| Human Origins | FES | True | 0 | 1 | 81 | True | 3.9e-10* | LMM | |
| HGDP | FES | True | 0 | 1 | 37 | True | 6.2e-09* | LMM | |
| 1000 Genomes | FES | True | 0 | 1 | 84 | True | 3.9e-10* | LMM | |
| Admix. Large sim. | RC | True | 0 | 1 | 35 | True | 0.00094 | Tie | |
| Admix. Small sim. | RC | True | 0 | 1 | 3 | True | 0.087 | Tie | |
| Admix. Family sim. | RC | True | 0 | 1 | 90 | False | 4.1e-10* | LMM | |
| Human Origins | RC | True | 0 | 1 | 75 | True | 0.00016* | LMM | |
| HGDP | RC | True | 0 | 1 | 23 | True | 1.7e-05* | LMM | |
| 1000 Genomes | RC | True | 0 | 1 | 41 | True | 6.7e-10* | LMM | |
| Admix. Large sim. | FES | 0 | 1 | 3 | 0.11 | Tie | |||
| Admix. Small sim. | FES | 0 | 1 | 0 | 0.58 | Tie | |||
| Admix. Family sim. | FES | 0 | 1 | 7 | 2.2e-06* | LMM | |||
| Human Origins | FES | 0 | 1 | 16 | 8e-10* | LMM | |||
| HGDP | FES | 11 | 0.68 | 6 | 0.0043 | Tie | |||
| 1000 Genomes | FES | 6 | 0.34 | 4 | 2.3e-07* | LMM | |||
| Admix. Large sim. | RC | 0 | 1 | 3 | 0.14 | Tie | |||
| Admix. Small sim. | RC | 0 | 1 | 0 | 0.1 | Tie | |||
| Admix. Family sim. | RC | 0 | 1 | 5 | 1.9e-06* | LMM | |||
| Human Origins | RC | 4 | 0.16 | 12 | 0.003 | Tie | |||
| HGDP | RC | 2 | 0.14 | 5 | 0.14 | Tie | |||
| 1000 Genomes | RC | 0 | 1 | 4 | 0.078 | Tie | |||
-
*
FES: Fixed Effect Sizes, RC: Random Coefficients.
-
†
Calibrated: whether mean over 50 replicates.
-
‡
Value of (number of PCs) with minimum mean or maximum mean .
-
§
Wilcoxon paired 1-tailed test of distributions ( or ) between models in header. Asterisk marks significant value using Bonferroni threshold ( with and is the number of tests in this table).
-
¶
Tie if no significant difference using Bonferroni threshold.
Table 6
Overview of PCA and LMM evaluations for environment simulations.
| LMM vs best | PCA vs LMM | LMM lab. vs PCA/LMM | ||||||||||
|---|---|---|---|---|---|---|---|---|---|---|---|---|
| Dataset | Metric | Trait* | Cal.† | ‡ | p-value § | ‡ | Cal.† | p-value § | Best ¶ | Cal.† | p-value § | Best ¶ |
| Admix. Large sim. | FES | True | 0 | 1 | 83 | True | 0.38 | Tie | True | 1.8e-14* | PCA/LMM | |
| Admix. Small sim. | FES | True | 0 | 1 | 90 | True | 0.001 | Tie | False | 1.4e-14* | PCA/LMM | |
| Admix. Family sim. | FES | True | 4 | 0.18 | 90 | False | 3.9e-10* | LMM | True | 0.066 | LMM/LMM lab. | |
| Human Origins | FES | True | 9 | 3.9e-05* | 90 | False | 1.4e-08* | LMM | False | 3.9e-10* | LMM | |
| HGDP | FES | True | 0 | 1 | 90 | True | 0.0037 | Tie | False | 2.1e-09* | PCA/LMM | |
| 1000 Genomes | FES | False | 8 | 8.8e-08* | 85 | True | 0.053 | Tie | True | 3.9e-10* | LMM lab. | |
| Admix. Large sim. | RC | True | 0 | 1 | 60 | True | 0.033 | Tie | True | 6.3e-10* | PCA/LMM | |
| Admix. Small sim. | RC | True | 0 | 1 | 9 | True | 0.85 | Tie | False | 1.4e-14* | PCA/LMM | |
| Admix. Family sim. | RC | True | 5 | 0.14 | 90 | False | 3.9e-10* | LMM | True | 0.011 | LMM/LMM lab. | |
| Human Origins | RC | False | 9 | 1.1e-08* | 90 | True | 2.3e-07* | PCA | False | 3.9e-10* | PCA | |
| HGDP | RC | True | 0 | 1 | 89 | True | 6.5e-09* | PCA | False | 3.9e-10* | PCA | |
| 1000 Genomes | RC | False | 8 | 1.6e-08* | 88 | True | 4.9e-09* | PCA | True | 0.09 | PCA/LMM lab. | |
| Admix. Large sim. | FES | 4 | 2.4e-06* | 6 | 0.0021 | Tie | 1.8e-15* | LMM lab. | ||||
| Admix. Small sim. | FES | 3 | 0.055 | 4 | 0.033 | Tie | 0.28 | Tie | ||||
| Admix. Family sim. | FES | 12 | 7e-04 | 63 | 3.9e-10* | LMM | 3.9e-10* | LMM lab. | ||||
| Human Origins | FES | 20 | 3.7e-06* | 90 | 1.4e-05* | LMM | 3.9e-10* | LMM lab. | ||||
| HGDP | FES | 12 | 4.3e-06* | 45 | 0.0044 | Tie | 3.9e-10* | LMM lab. | ||||
| 1000 Genomes | FES | 9 | 1.9e-08* | 55 | 0.028 | Tie | 3.9e-10* | LMM lab. | ||||
| Admix. Large sim. | RC | 4 | 0.00085 | 5 | 0.0018 | Tie | 5e-10* | LMM lab. | ||||
| Admix. Small sim. | RC | 2 | 0.13 | 5 | 0.093 | Tie | 0.0028 | Tie | ||||
| Admix. Family sim. | RC | 9 | 0.01 | 86 | 1.7e-09* | LMM | 3.9e-10* | LMM lab. | ||||
| Human Origins | RC | 22 | 0.0039 | 90 | 1e-06* | PCA | 3.9e-10* | LMM lab. | ||||
| HGDP | RC | 19 | 0.0057 | 64 | 2.8e-05* | PCA | 3e-07* | LMM lab. | ||||
| 1000 Genomes | RC | 9 | 8.7e-05* | 87 | 1.2e-09* | PCA | 4.4e-10* | LMM lab. | ||||
-
*
FES: Fixed Effect Sizes, RC: Random Coefficients.
-
†
Calibrated: whether mean over 50 replicates.
-
‡
Value of (number of PCs) with minimum mean or maximum mean .
-
§
Wilcoxon paired 1-tailed test of distributions ( or ) between models in header. Asterisk marks significant value using Bonferroni threshold ( with and is the number of tests in this table).
-
¶
Tie if no significant difference using Bonferroni threshold; in last column, pairwise ties are specified and “Tie” is three-way tie.
Table 7
Variance parameters of trait simulations.
| Trait variance type | |||
|---|---|---|---|
| High heritability | 0.8 | 0.0 | 0.2 |
| Low heritability | 0.3 | 0.0 | 0.7 |
| Environment | 0.3 | 0.5 | 0.2 |
Additional files
Download links
A two-part list of links to download the article, or parts of the article, in various formats.
Downloads (link to download the article as PDF)
Open citations (links to open the citations from this article in various online reference manager services)
Cite this article (links to download the citations from this article in formats compatible with various reference manager tools)
Limitations of principal components in quantitative genetic association models for human studies
eLife 12:e79238.
https://doi.org/10.7554/eLife.79238


