Biosensor-integrated transposon mutagenesis reveals rv0158 as a coordinator of redox homeostasis in Mycobacterium tuberculosis
- Department of Microbiology and Cell Biology, Indian Institute of Science Bangalore, India
- Centre for Infectious Disease Research, Indian Institute of Science Bangalore, India
- National Centre for Biological Sciences, India
- The Institute of Mathematical Sciences, A CI of Homi Bhabha National Institute, India
- Molecular Biophysics Unit, Indian Institute of Science Bangalore, India
- Institute for Stem Cell Science and Regenerative Medicine, India
- Department of Biochemistry, Indian Institute of Science Bangalore, India
Figures
Figure 1 with 3 supplements
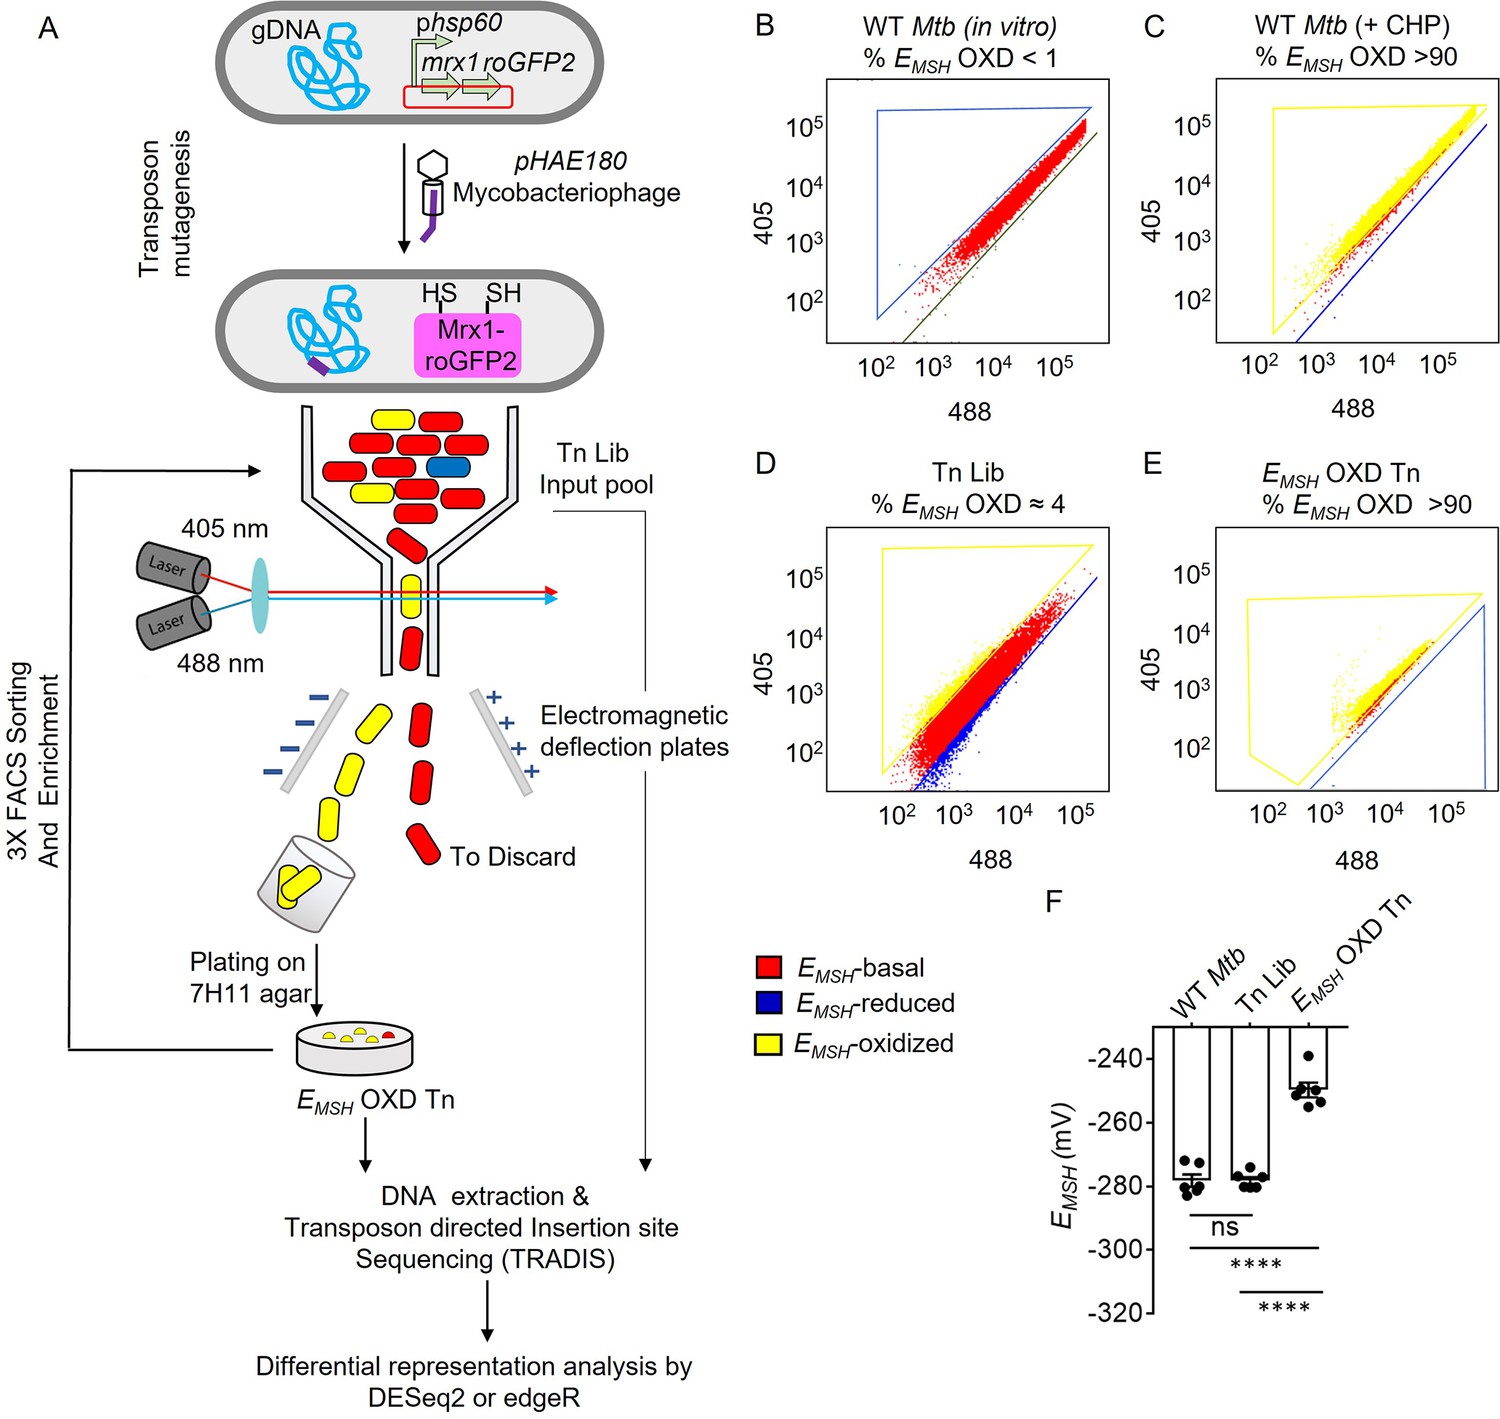
Detection and enrichment of EMSH-oxidized Mtb-Tn mutants under in vitro growing conditions using FACS.
(A) A saturated transposon mutant library in Mtb -roGFP2 was generated using a genetically engineered, temperature-sensitive mycobacteriophage pHAE180. Transposon mutants of Mtb were selected on 7H11 agar containing hygromycin and kanamycin. Genomic DNA was isolated and TraDIS (TnSeq) protocol was utilized to identify the transposon insertion site within the Mtb genome in the library of Mtb-transposon mutants. Mtb and Mtb Tn- Library expressing Mrx1-roGFP2 were grown in 7H9 supplemented with OADC and analyzed by flow-cytometry by exciting with 405 and 488 nm lasers at a constant emission (510 nm). The program BD FACS-Suite software was used to analyze the population distribution of bacteria, and a unique colour represented each population. EMSH-basal, EMSH-reduced, and EMSH-oxidized subpopulations are shown in red, blue, and yellow, respectively. FACS Dot plot of (B) untreated Mtb expressing Mrx1-roGFP2 grown in vitro is shown in red. (C) Mtb cells treated with an oxidant- 10 mM cumene hydroperoxide (CHP) (shown in yellow). (D) Tn-Library (Tn Lib). The subpopulation indicated in blue is the EMSH-reduced population as determined by Mtb cells treated with 20 mM dithiothreitol. (E) The EMSH-oxidized subpopulation (≈ 4%; EMSH OXD) was isolated by sorting, regrown on 7H11 agar, and resorted for three cycles to obtain EMSH-oxidized Tn mutants. 10,000 events per sample were analyzed. (F) The calculated EMSH of WT Mtb, input Tn Lib, and flow-sorted EMSH-oxidized Tn mutants. The data are means ± SEM of two independent experiments (n=6). (p>0.05: ns, p<0.0001: ****, one-way ANOVA with Tukey’s multiple comparisons test).
-
Figure 1—source data 1
FACS dot plots and EMSH numerical values of WT Mtb, input Tn Lib, and flow-sorted EMSH-oxidized Tn mutants.
- https://cdn.elifesciences.org/articles/80218/elife-80218-fig1-data1-v2.zip
Figure 1—figure supplement 1
Flow cytometry gating strategy to sort and enrich EMSH-oxidized Tn mutants from the input Tn-Library (Tn Lib).
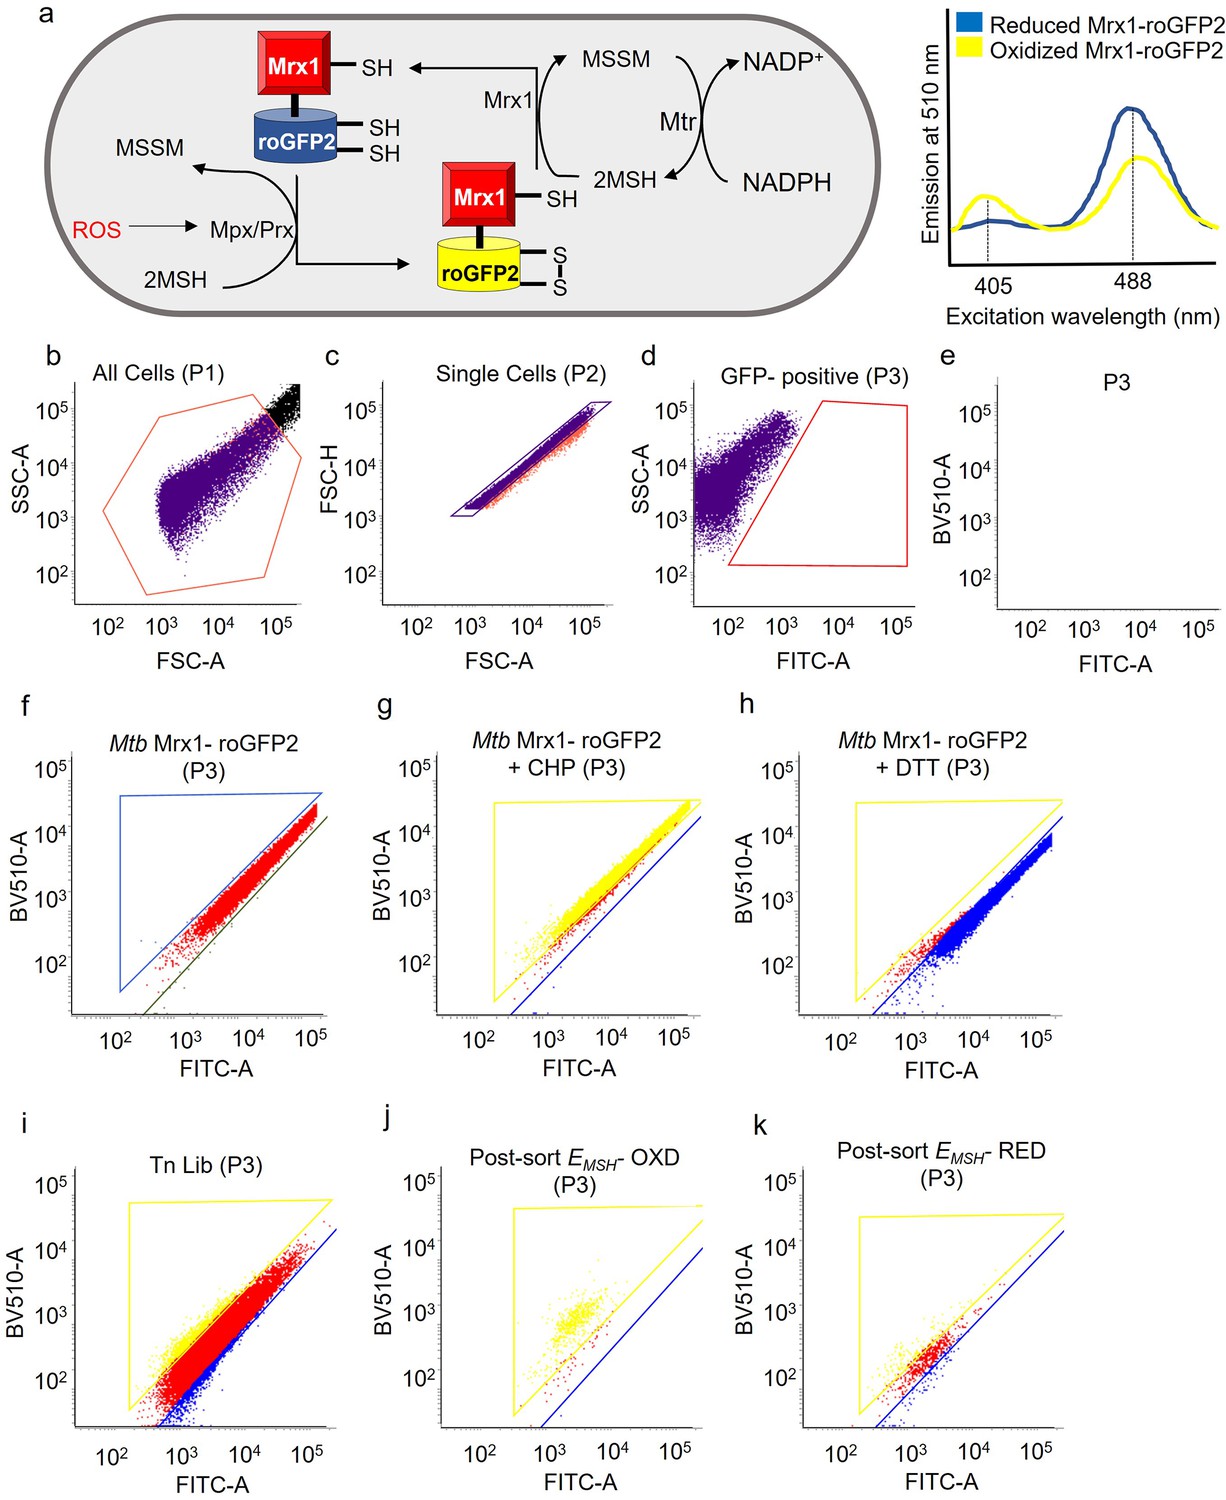
(a) Oxidative stress increases the ratio of oxidized (MSSM) to reduced mycothiol (MSH) via mycothiol-dependent peroxiredoxin (Prx) or peroxidase (Mpx). Oxidation of Mrx1-roGFP2 increases fluorescence intensity for excitation at 405 nm and decreases it for excitation at 488 nm at fixed emission at 510 nm. This ratiometric fluorescence change results in an oxidative shift in EMSH. This reaction is reversible, and once ROS levels deplete, EMSH normalizes predominantly via reduction of MSSM to MSH by NADPH- utilizing Mycothione Reductase (Mtr). (b– e) FACS strategy. FACS dot plot of Mtb without Mrx1-roGFP2 as unstained control. P1 population is all events acquired. P2 are singlets and gated on FSC-A/ FSC-H dot plot. Voltage is set such that unstained cells have median fluorescence Intensity of ≈100 at excitation 405 nm (BV 510) and 488 nm (FITC). P3 are GFP- positive cells. Dot plots of (f) untreated wild-type Mtb expressing Mrx1-roGFP2 (red population) (g) 10 mM cumene hydroperoxide (CHP) treated Mtb. ≈95% population is oxidized, as shown within the yellow gate (EMSH-oxidized). (h) 20 mM dithiothreitol treated Mtb. ≈95% population is reduced, as shown within the blue gate (EMSH-reduced). (i) Input Tn Lib showing 2–5% of EMSH-oxidized and EMSH-reduced transposon mutants. Immediately after sorting, the collected redox-altered cells were reanalyzed to determine sorting- efficiency. Dot plots of (j) post-sorted EMSH-oxidized (EMSH- OXD) cells. Cells were enriched from <5% to>90%. (k) Post-sorted EMSH-reduced (EMSH- RED) Mtb cells.
Figure 1—figure supplement 2
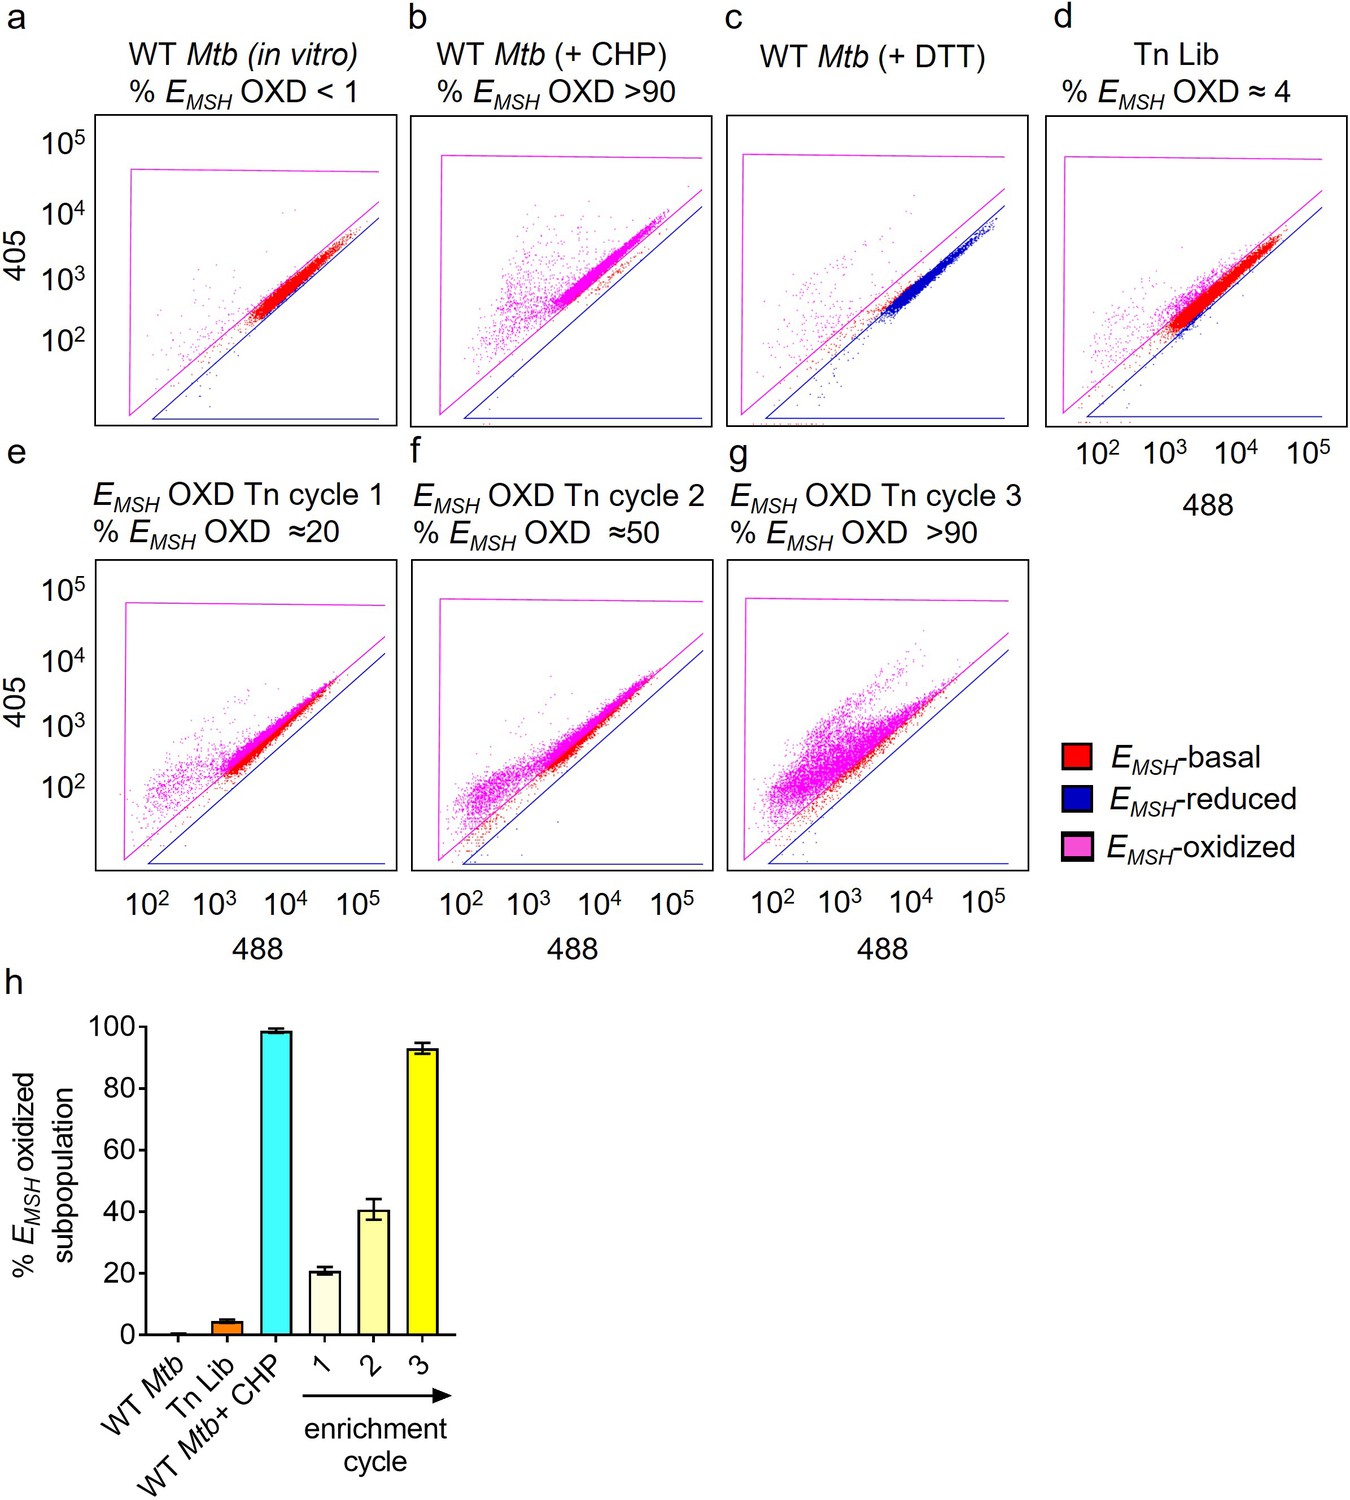
Enriching the EMSH-oxidized Tn mutants from the input Tn-Library (Tn Lib) by repeated cycles of sorting.
FACS Dot plots of (a) untreated wild-type Mtb expressing Mrx1-roGFP2 (red population) (b) 10 mM cumene hydroperoxide (CHP) treated Mtb. ≈95% population is oxidized, as shown within the fuchsia-colored gate (EMSH-oxidized). (c) 20 mM dithiothreitol treated Mtb. (d) Input Tn Lib. The sorted oxidized mutants were plated on 7H11 agar supplemented with OADC. After 4–5 weeks, colonies were pooled, grown under identical conditions, and re-sorted. (e–g) Dot plots of 3 cycles of sorting to demonstrate enrichment of EMSH-oxidized Tn mutants and quantified in (h). Error bars represent standard deviation from the mean (n=3).
-
Figure 1—figure supplement 2—source data 1
Numerical values indicating % population of EMSH-oxidized Tn mutants after each round of sorting by FACS.
- https://cdn.elifesciences.org/articles/80218/elife-80218-fig1-figsupp2-data1-v2.xlsx
Figure 1—figure supplement 3

Accumulation of endogenous ROS inside EMSH-oxidized Mtb-transposon mutant pool under in vitro growing conditions is dissipated by addition of multiple antioxidants, as detected by CellROX Deep Red dye.
Mtb H37Rv cultures and Tn mutant pools were grown to mid-log phase (OD600 nm = 0.4–0.6) An equal number of cells(109) were taken, and (a) ROS were quantified using CellROX Deep Red dye by flow cytometry. Treatment with10 mM cumene hydroperoxide (CHP) for 15 minutes was used as a positive control. (b) Supplementation with a combination of antioxidants- catalase (17.5 U/ml)+thiourea (1 mM)+bipyridyl (250 μM) dissipates eROS generated in EMSH OXD Tn mutant population. Data represent the median fluorescence intensity of the dye. Error bars represent standard deviation from the mean. Data represent at least two independent experiments performed in at least duplicate (n=4). p was determined by one way ANOVA with Tukey’s multiple comparisons test (**** p≤0.0001, ns indicates not significant).
-
Figure 1—figure supplement 3—source data 1
Median fluorescence intensity values of CellROX Deep Red dye in WT Mtb, input Tn Lib, and flow-sorted EMSH-oxidized Tn mutants.
- https://cdn.elifesciences.org/articles/80218/elife-80218-fig1-figsupp3-data1-v2.xlsx
Figure 2
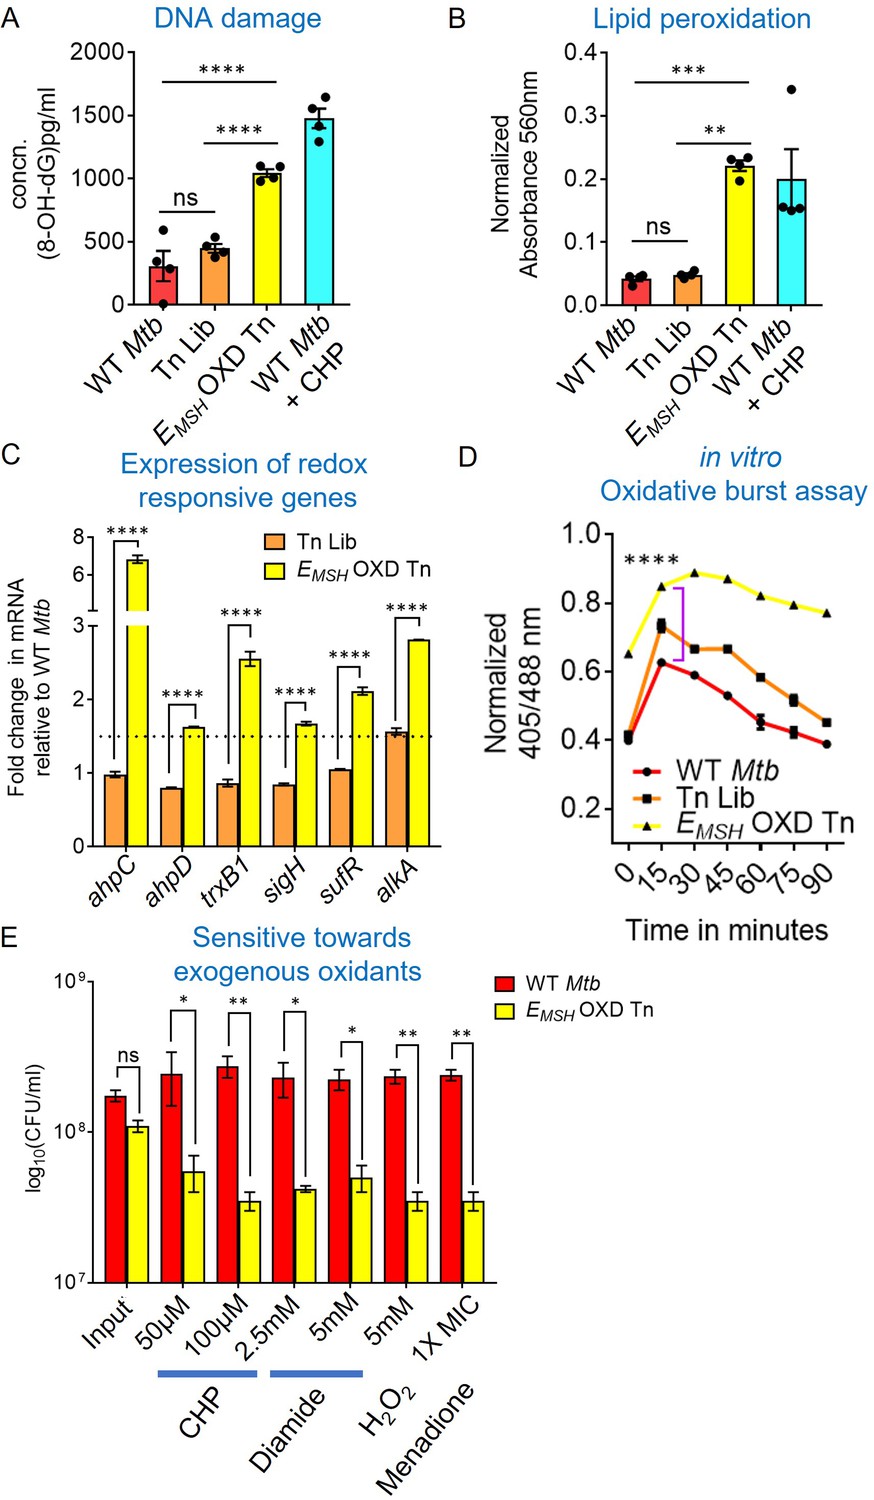
EMSH-oxidized Tn mutants displayed signature of oxidative damage under in vitro growth conditions.
Bacterial cultures were grown to log phase (OD600 nm ≈ 0.6) (A) 8-hydroxy 2-deoxy guanosine, a major product of oxidative DNA damage was quantified using DNA/RNA Oxidative Damage ELISA Kit (Cayman chemicals). (B) Cellular lipid-hydroperoxides generation was measured by FOX2 assay. WT Mtb treated with 500 μM of cumene hydroperoxide (CHP) for 2 hr is used as a positive control. The data are means ± SEM of two independent experiments (n=4). (p>0.05: ns, p<0.01: **, p<0.001: ***, p<0.0001: ****, one-way ANOVA with Tukey’s multiple comparisons test). (C) Realtime-quantitative PCR analysis showing increased basal expression of oxidative stress response genes. 16 S expression was used as a control. The dotted line indicates a 1.5-fold- change (cut-off value). (D) Mtb, Tn-Library (Tn Lib), and EMSH-oxidized Tn-mutants (EMSH-OXD Tn) were treated with a non-bactericidal concentration of CHP (12.5 μM), and the ratiometric sensor response was measured over time. Data representative of two independent experiments done in duplicate. Statistical comparisons are with respect to the WT Mtb. (p<0.0001: ****, unpaired two-tailed Student’s t-test). (E) Log-phase cultures were exposed to oxidants with indicated concentration for 8 hr and plated. CFU was enumerated after 6 weeks. The data (C and E) are means ± SEM of two independent experiments. (p>0.05: ns, p<0.01: **, p<0.0001: ****, two-way ANOVA with Sidak’s multiple comparisons test).
-
Figure 2—source data 1
Numerical values used to plot the graphs in Figure 2A–E.
- https://cdn.elifesciences.org/articles/80218/elife-80218-fig2-data1-v2.xlsx
Figure 3 with 2 supplements
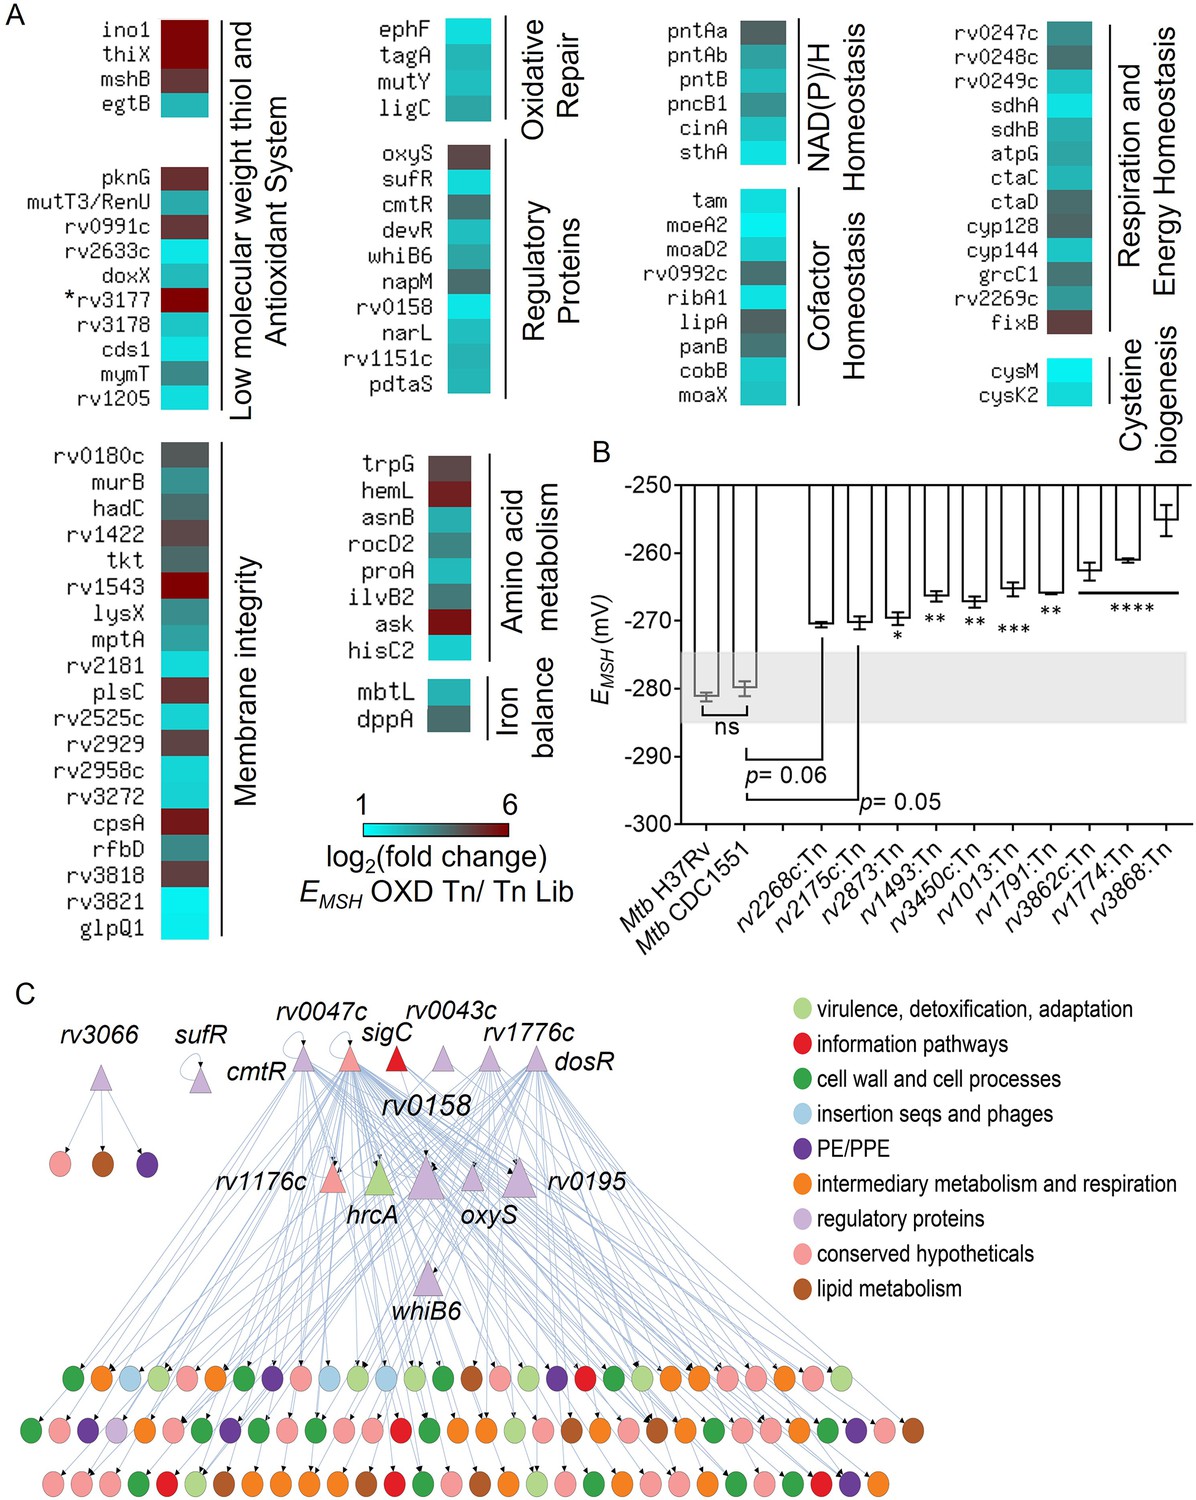
TraDIS analysis reveals determinants of redox homeostasis in Mtb under standard aerobic culture conditions.
(A) Heat map showing genetic factors regulating EMSH of Mtb based on TraDIS analysis. These factors are functionally classified based on the MycoBrowser database and literature studies. The color gradient of the box indicates the log2 fold enrichment of respective genes in the EMSH-oxidized Tn pool compared to the Tn Lib. The color code for the fold change is at the bottom of the second column. Genes are grouped according to function. (The gradient of cyan to red colour indicates increasing log2 fold change values). * rv3177 is 10.02 log2 fold-change enriched. (B) The EMSH of Mtb mutants harboring transposon in the genes identified as part of Mtb redoxosome. The mutants were grown to log phase (OD 600 nm ≈ 0.6) under standard aerobic growth conditions, and EMSH was measured. The light grey area represents basal EMSH. The data are means ± SEM of two independent experiments (n=4). (p>0.05: ns, p<0.05: *, p<0.01: **, p<0.001: ***, p<0.0001: ****, one-way ANOVA with Dunnett’s multiple comparisons test). (C) Hierarchical visualization of the redox-homeostasis network of 107 genes (14 TFs, 93 target genes) and 143 edges. Here, the TFs are shown as triangles, and the target genes are shown as circles. The size of the TFs (triangles) is proportional to their betweenness centrality. The figure was generated using Cytoscape 3.6. The TF Rv0158 in the middle layer has the highest betweenness centrality and, thus, a bottleneck in the redox-homeostasis network.
-
Figure 3—source data 1
EMSH numerical values of Mtb mutants harboring transposon in the genes identified as part of Mtb redoxosome.
- https://cdn.elifesciences.org/articles/80218/elife-80218-fig3-data1-v2.xlsx
Figure 3—figure supplement 1
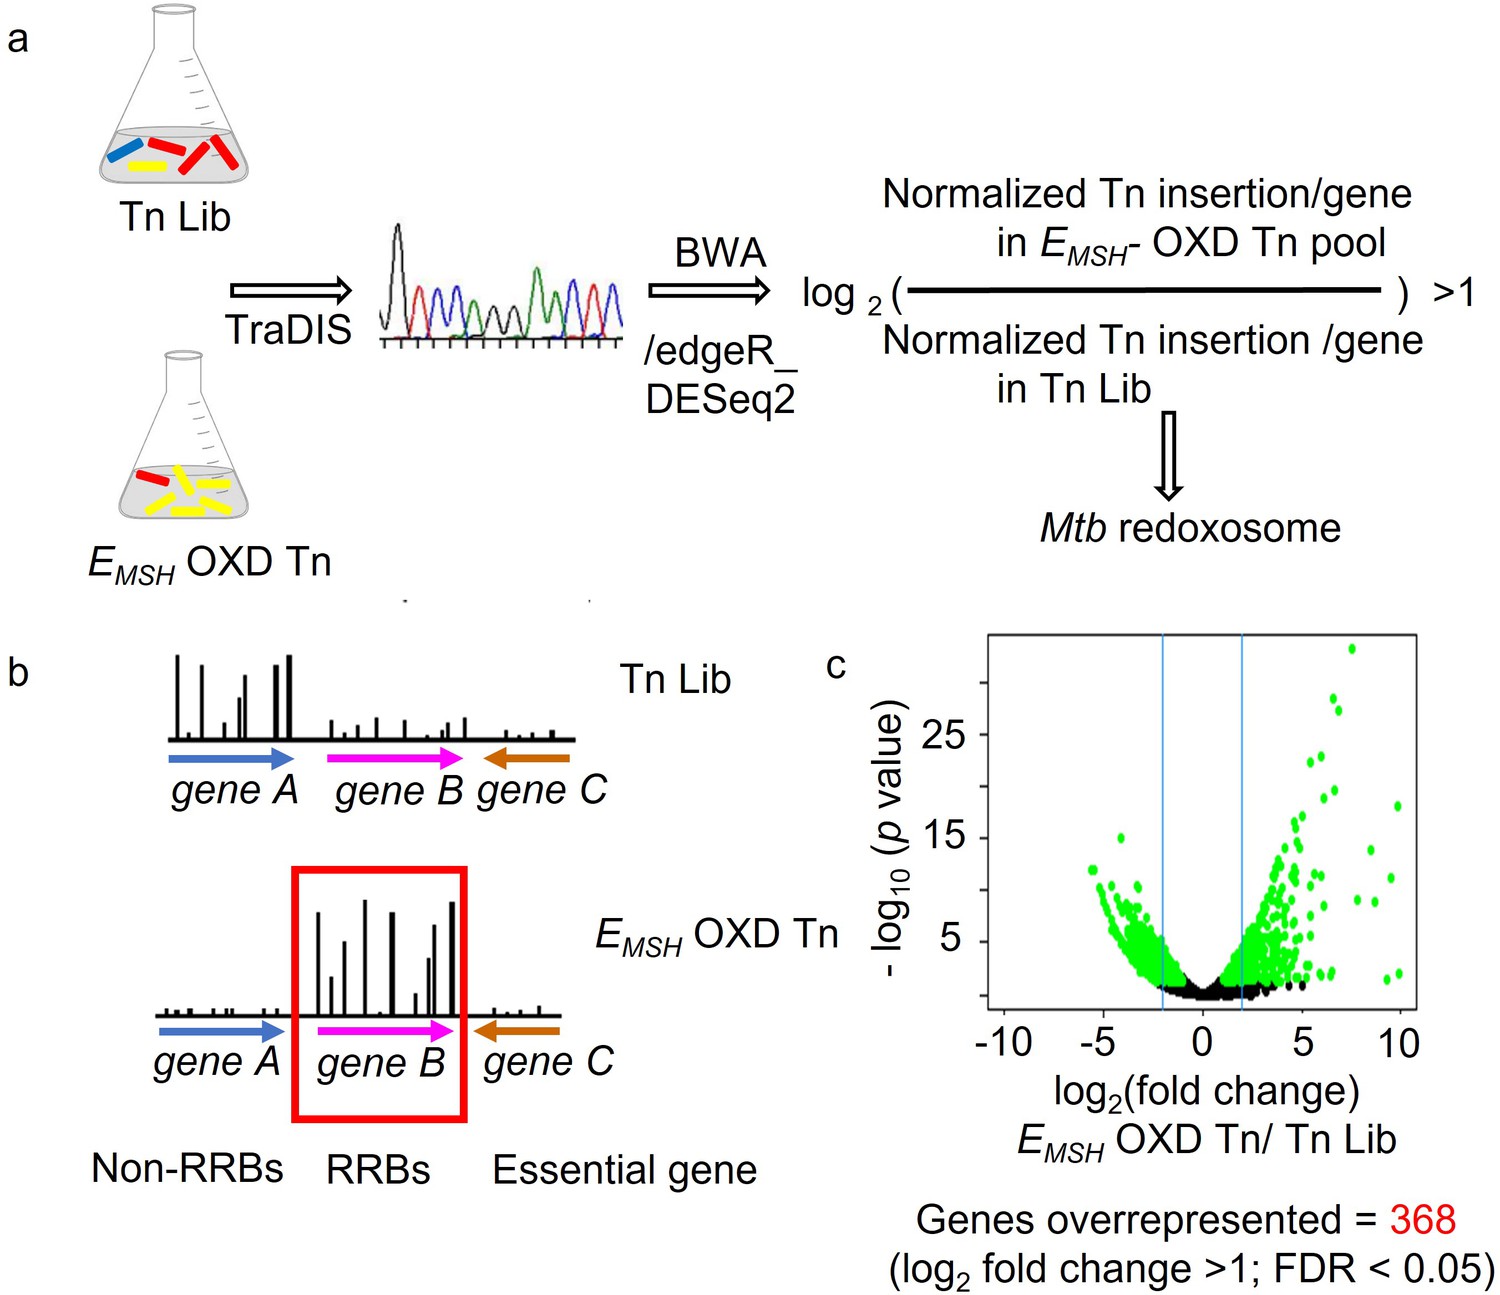
Strategy to identify genes critical for preserving redox balance in Mtb using integrated transposon mutagenesis, FACS, deep Sequencing, and redox biosensor technology.
(a) Genomic DNA was extracted from input pool Tn-Library (Tn Lib) and FACS sorted EMSH- oxidized Tn, as shown in Figure 1A, Figure 1—figure supplement 1. TraDIS (TnSeq) protocol followed by Burrow-Wheeler Aligner (BWA) analysis was utilized to identify the site of mutation (Insertion by Transposon) in the library of Mtb-transposon mutants. Genes with a frequency of transposon insertion overrepresented in EMSH- oxidized Tn over input pool by twofold (p.adj. or FDR at a cut-off <0.05) was defined as Mtb redoxosome (or Regulators of Redox Balance (RRBs)). (b) Genes with no or few transposon insertions in either library are essential. Additionally, genes with no function in maintaining redox balance will not be enriched in EMSH- oxidized Tn, as shown by a low frequency of transposon insertion in this pool (non- RRBs). (c) Volcano plot of differentially represented genes between the EMSH-oxidized Tn and Tn-Library (Tn Lib). Significantly over or under-represented genes in EMSH-oxidized Tn relative to Tn Lib are beyond the cut-off of at least two fold-change as indicated by blue line and determined by DESeq2 and edgeR.
Figure 3—figure supplement 2
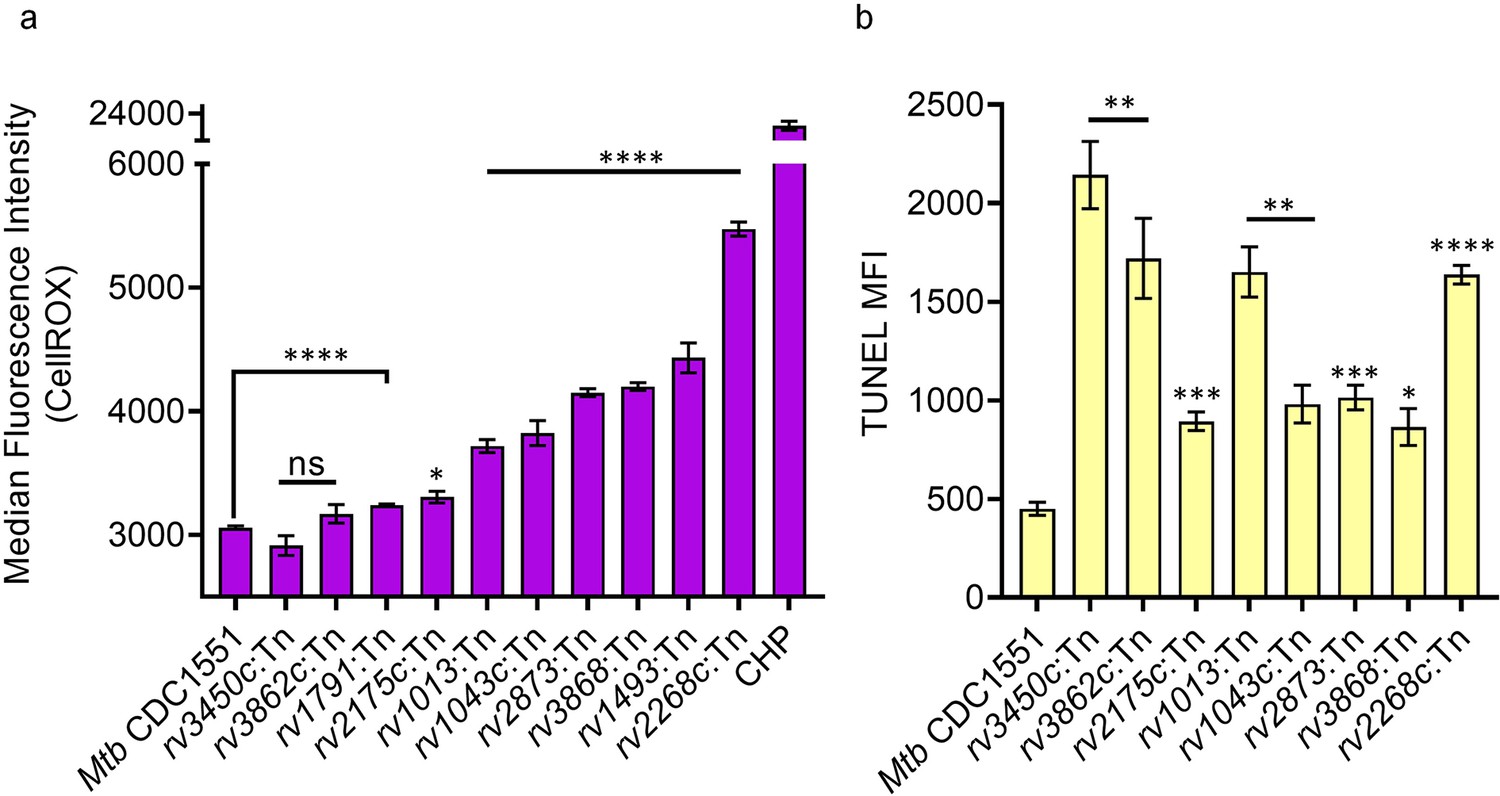
Transposon insertion in the genes of redoxosome resulted in elevated ROS levels and DNA damage in the individual Tn mutants.
(a) ROS were quantified by flow cytometry using CellROX Deep Red dye. Cumene hydroperoxide (CHP; 10 mM) served as a positive control. (b) TUNEL Assay for measuring DNA double-stranded breaks using flow cytometry. Data represent the median fluorescence intensity. Data representative of two independent experiments done in duplicate (n=4). Statistical comparisons are with respect to the WT Mtb CDC 1551. (p>0.05: ns, p<0.01: **, p<0.001: ***, p<0.0001: ****, unpaired two-tailed Student’s t-test with Welch’s correction).
-
Figure 3—figure supplement 2—source data 1
Median Fluorescence Intensity values of CellROX Deep Red dye (quantification of endogenous ROS inside cell) and TMR red- labelled nucleotides (quantification of DNA breaks) in individual Mtb Tn mutants.
- https://cdn.elifesciences.org/articles/80218/elife-80218-fig3-figsupp2-data1-v2.xlsx
Figure 4 with 1 supplement
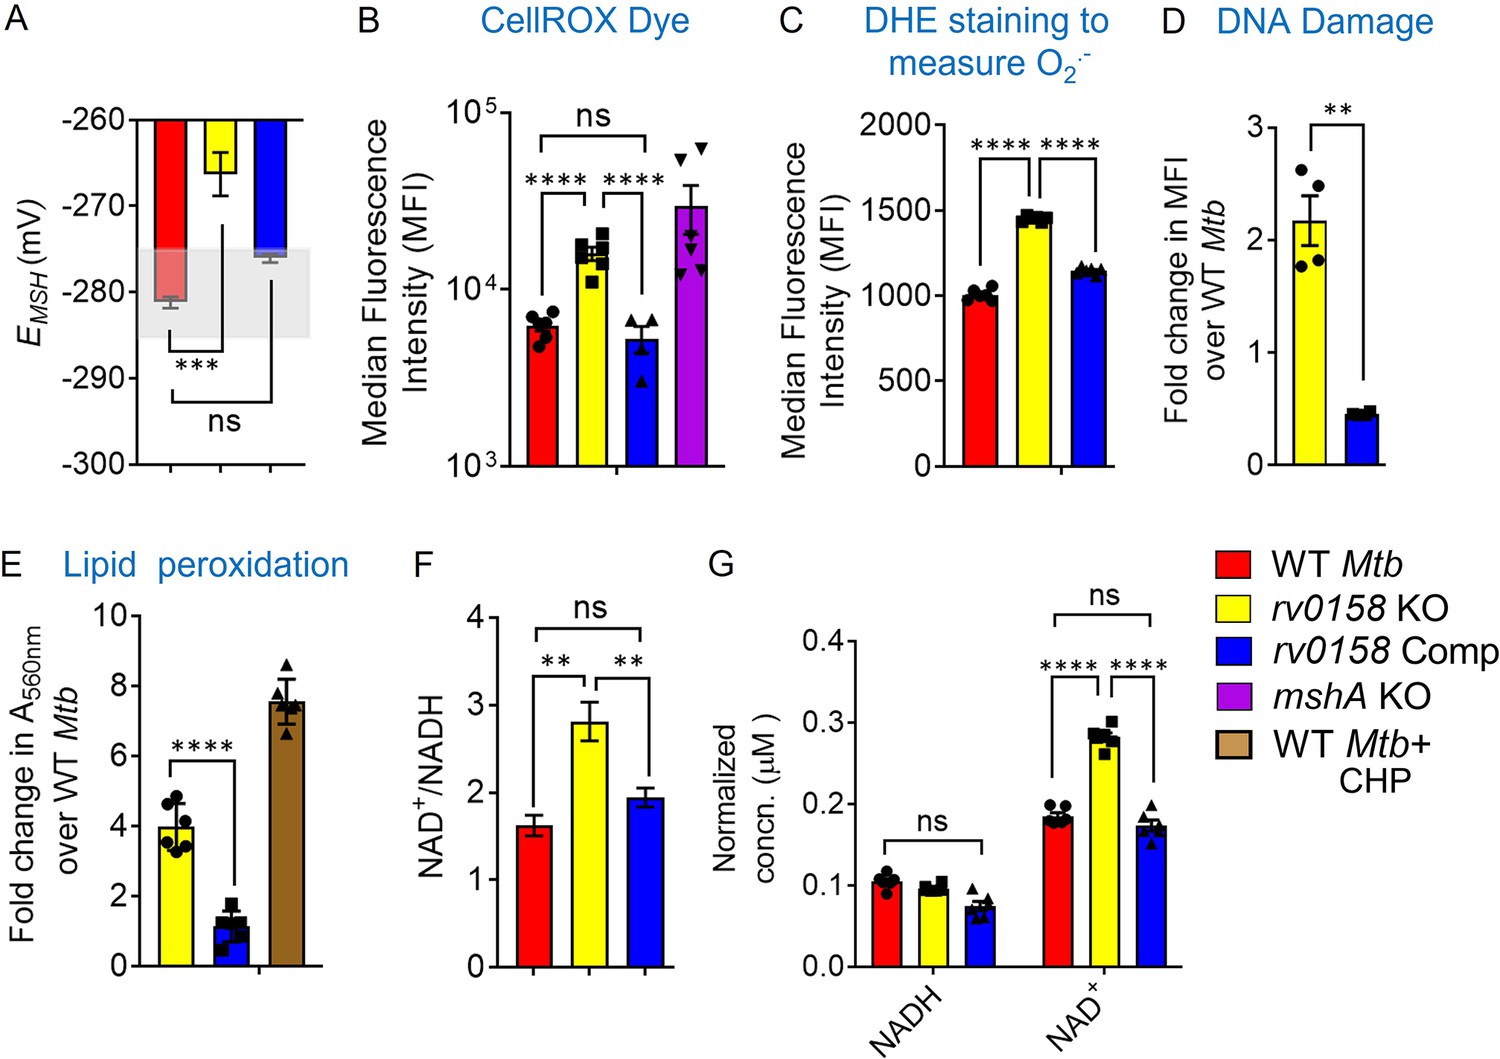
rv0158 KO experiences enhanced eROS, oxidative damage to biomolecules and altered NAD+/NADH during normal aerobic growth.
Bacterial cultures were grown to log phase (OD 600 nm ≈ 0.6) (A) The EMSH of WT Mtb (WT Mtb), rv0158 KO, and rv0158 Comp. The light grey area represents basal EMSH. The data are means ± SEM of two independent experiments (n=4). (p>0.05: ns, p<0.001: ***, one-way ANOVA with Dunnett’s multiple comparisons test). (B, C) eROS and superoxide levels were quantified using FACS by measuring the fluorescence of cell-permeant CellROX Deep Red dye with absorption/emission maxima of ~644/665 nm and Dihydroethidium (Ex/Em: 488 nm/ 560 nm) dye, respectively. Median Fluorescence Intensity (MFI) is plotted. A total of 10,000 events per sample were analyzed. (D) Double-stranded DNA breaks were quantified by TUNEL Assay using Flow-cytometry. Fold change in MFI is plotted. The data are means ± SEM of two independent experiments (n=4). (p<0.05: *, unpaired two-tailed Student’s t-test with Welch’s correction). (E) Cellular lipid-hydroperoxides levels were measured by FOX2 assay, and absorbance at 560 nm is normalized to that of WT Mtb H37Rv. (F) NAD+/NADH ratio (G) pyridine nucleotide levels as estimated by an enzymatic assay using alcohol dehydrogenase and ethanol as enzyme and substrate, respectively. The concentration was normalized to the cell mass. The data are means ± SEM of two independent experiments (n≥4). (For panel other than E, statistical measurement: p>0.05: ns, p<0.05: *, p<0.01: **, p<0.0001: ****, one-way ANOVA with Tukey’s multiple comparisons test).
-
Figure 4—source data 1
Numerical values used to plot the graphs in Figure 4A–G showing perturbed redox state in rv0158 KO Mtb.
- https://cdn.elifesciences.org/articles/80218/elife-80218-fig4-data1-v2.xlsx
Figure 4—figure supplement 1

Graphic illustration of generation of rv0158 knockout Mtb strain.
(a) Schematic illustrating wild-type Mtb rv0158 loci and double crossover recombination event. After the allelic exchange, entire rv0158 ORF in the Mtb genome was replaced by right and left flanking regions of rv0158 along with the loxP-hyg-gfp-loxP cassette. This knock out strain was unmarked by expressing Cre recombinase to remove the hyg-gfp cassette. Color-coded arrows (pink and dark blue) depict primer pairs used to generate upstream and downstream allelic-exchange fragments. Complement strain was generated by introducing the gene under native promoter (cloned in pCV125 plasmid) into unmarked rv0158 KO strain. (b) RNA was isolated from mid-log phase culture of the wild-type Mtb, putative rv0158 KO and complemented clones. rv0158 and 16 S expression were examined by qRT-PCR using gene-specific oligonucleotides, and Rn (Rn is the fluorescence of the reporter dye (SYBR green) normalized by the fluorescence of a passive reference dye; Applied Biosystems ROX Dye) versus PCR cycle number is plotted. Data represent at least two independent experiments performed in at least duplicate.
-
Figure 4—figure supplement 1—source data 1
Raw data plots of qRT- PCR as shown in Figure 4—figure supplement 1b.
- https://cdn.elifesciences.org/articles/80218/elife-80218-fig4-figsupp1-data1-v2.xlsx
Figure 5 with 2 supplements
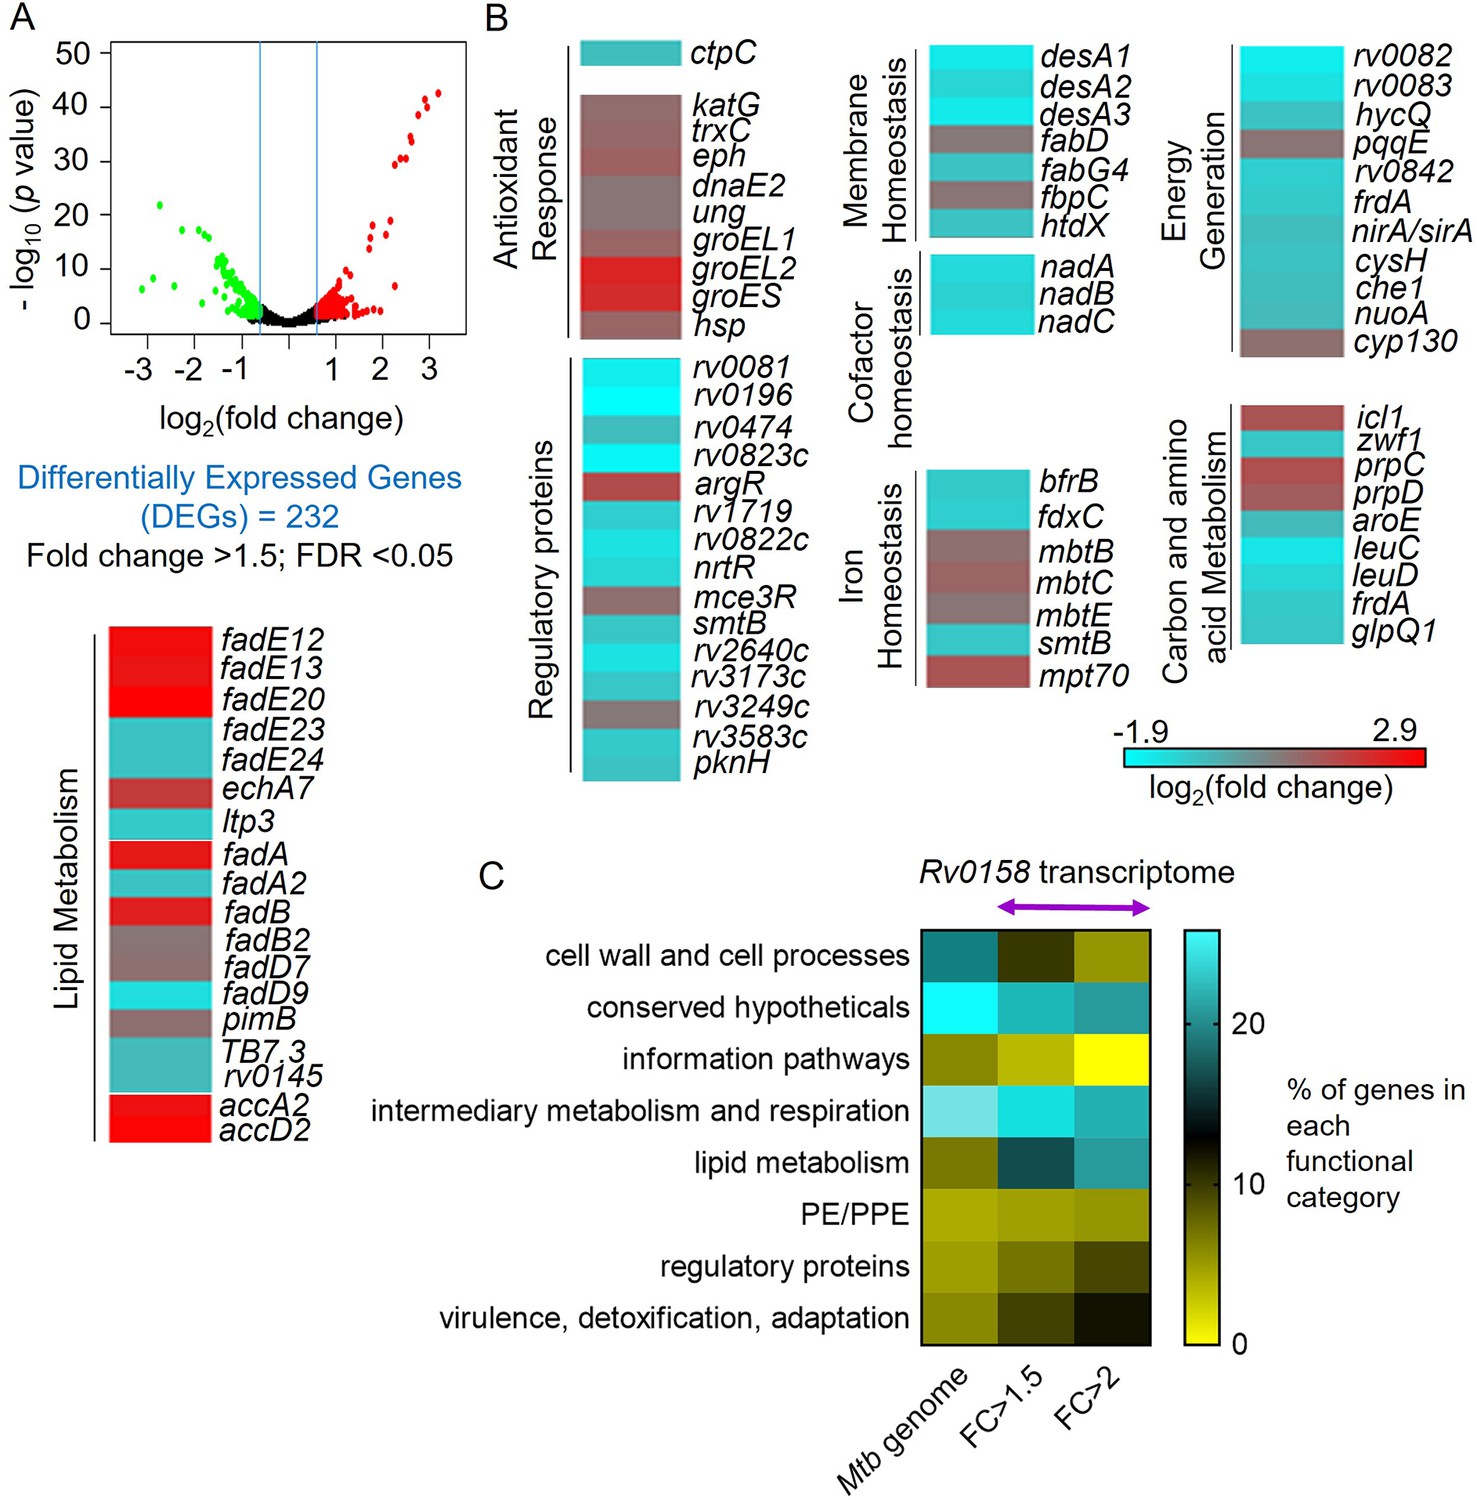
RNA Sequencing analysis reveals that rv0158 presumably regulates lipid metabolism as a mechanism of redox homeostasis.
(A) Volcano plot of differentially expressed genes (absolute fold change >1.5; FDR <0.05) between the WT Mtb and rv0158 KO grown in vitro. (B) Heat-map comparing expression profile in WT and rv0158 KO. The colour code for the fold change is at the bottom of the third column (red: upregulated genes; cyan: down-regulated genes). Genes are grouped according to function. (C) Functional categorization of rv0158-dependent genes in Mtb. The % of genes in each functional category (according to the MycoBrowser database) was determined for the complete Mtb genome and for rv0158 transcriptome with different cut-offs (FC ≥1.5: absolute fold change ≥1.5, FDR <0.05, differentially expressed genes = 232 and FC ≥2: absolute fold change ≥2; FDR <0.05, differentially expressed genes = 77).
-
Figure 5—source data 1
Numerical values of the % of genes in each functional category (according to the MycoBrowser database) of the complete Mtb genome and for rv0158 transcriptome.
- https://cdn.elifesciences.org/articles/80218/elife-80218-fig5-data1-v2.xlsx
Figure 5—figure supplement 1
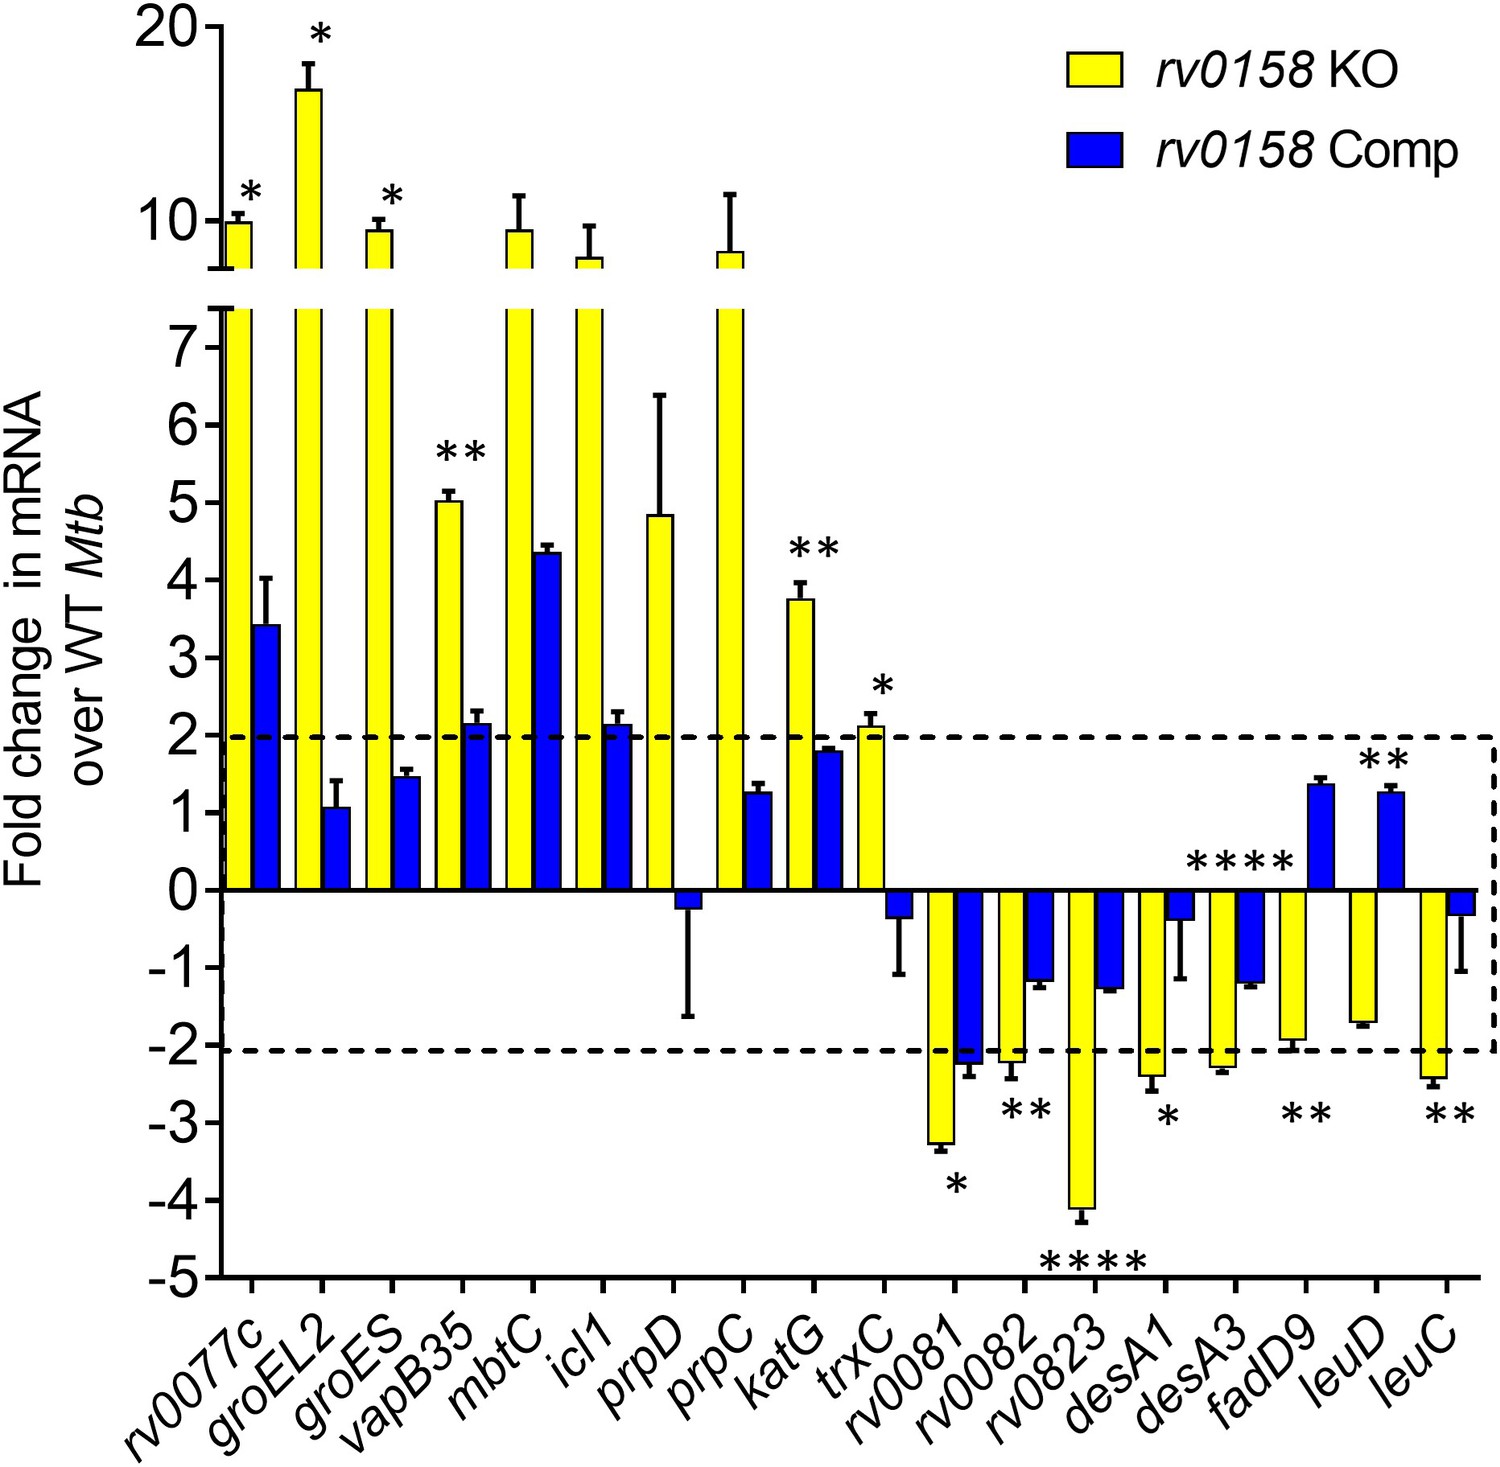
Validation of RNA Sequencing results by measuring the expression of a set of genes in wild-type Mtb, rv0158 KO and complemented strain by quantitative real-time PCR (qRT-PCR) analysis.
RNA was isolated from log-phase bacterial cultures, identical to the protocol with that of RNA Sequencing. 18 genes were randomly selected (10 genes upregulated and 8 genes downregulated in RNA Sequencing), and an SYBR green-based qRT-PCR protocol measured their RNA levels. Error bars represent the standard deviation from the mean. Data representative of two independent experiments. Statistical comparisons are between rv0158 KO and complemented strain. (p>0.05: ns, p<0.05: *, p<0.01: **, p<0.001: ***, p<0.0001: ****, unpaired two-tailed Student’s t-test).
-
Figure 5—figure supplement 1—source data 1
Numerical values indicating fold changes in rv0158- dependent gene expression.
- https://cdn.elifesciences.org/articles/80218/elife-80218-fig5-figsupp1-data1-v2.xlsx
Figure 5—figure supplement 2

Heatmap showing differential gene overlap between rv0158 transcriptome and various stress conditions.
Each column represents the overlap between the rv0158 transcriptome and the particular stress condition (Acidic pH Rohde et al., 2007, H2O2 stress Voskuil et al., 2011, NO stress Voskuil et al., 2011, and hypoxia Rustad et al., 2008). The p-value of the overlap is indicated inside the column for each pair. The colour represents the odds ratio for the overlap. For overlap analysis of differentially expressed genes in rv0158 transcriptome with other stress-induced conditions (log2 fold change >1 or <-1; p<0.01 are considered differentially expressed genes in the indicated stress conditions), GeneOverlap (v1.22.0) package from R (v3.6.3) was used . It uses Fisher’s exact test to find statistical significance by calculating the p-value and the odds ratio for the overlap (p-value <0.01 and an odds ratio of >1 were taken as the significance thresholds; NS indicates not significant). H2O2 and NO stress showed a strong association (odds ratio >3) with the rv0158 transcriptome.
-
Figure 5—figure supplement 2—source data 1
Raw values of differential gene overlap between rv0158 transcriptome and various stress conditions.
- https://cdn.elifesciences.org/articles/80218/elife-80218-fig5-figsupp2-data1-v2.xlsx
Figure 6 with 1 supplement
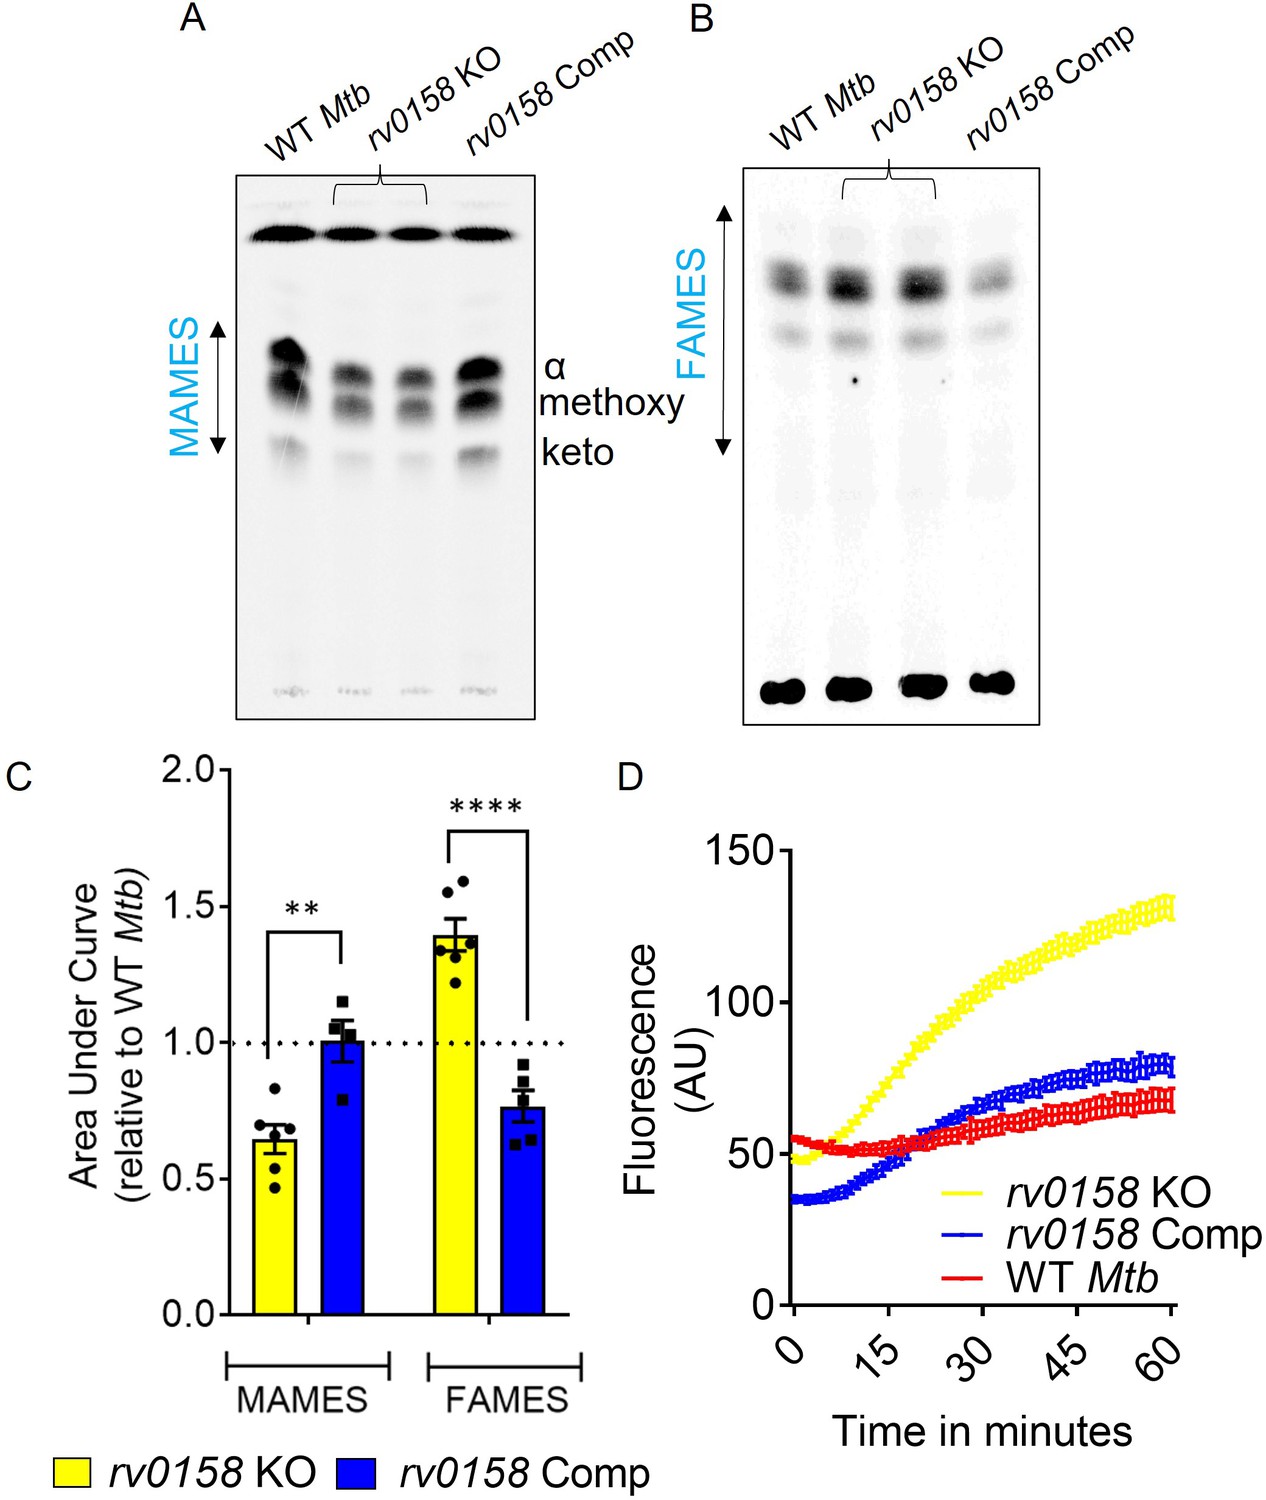
rv0158 deletion impaired mycolic acid biogenesis and increased membrane permeability in Mtb.
WT Mtb, rv0158 KO, and rv0158 Comp were cultured in 7H9+ADS to log phase (OD 600 nm ≈ 0.8), and total lipids were labeled using [1, 2-14C] -sodium-acetate for 24 hr. TLC-autoradiograph analysis of mycolic acids (MAMEs) and fatty acids (FAMEs)- fraction from total lipids was done by loading equal counts (50000 CPM). (A) Normal-phase TLC of MAMEs from bacterial strains was developed using hexane/ethyl acetate (19:1, v/v) solvent system. See Source Data: Figure 6—source data 1 used to generate this figure. ImageJ software (1.53e version) was used to edit the images. (B) Reverse-phase TLCs using acetonitrile/dioxane solvent (1:1, v/v) showing the fatty acid (FAMEs) distribution. See Source Data: Figure 7—source data 1 used to generate this figure. ImageJ software (1.53e version) was used to edit the images. (C) Densitometric analysis by ImageJ software (1.53e version) to quantify changes in MAMEs and FAMES relative to WT levels. The data are means ± SEM of two independent experiments (n≥4). Statistical comparisons are with respect to the WT Mtb. (p<0.01: **, p<0.0001: ****, two-way ANOVA with Sidak’s multiple comparisons test). (D) Ethidium bromide accumulation within Mtb strains grown on glucose as a function of time. Results are representative of three independent experiments performed in quadruplicate.
-
Figure 6—source data 1
Raw files containing TLC images of MAMEs and FAMEs.
- https://cdn.elifesciences.org/articles/80218/elife-80218-fig6-data1-v2.zip
-
Figure 6—source data 2
Numerical values used to plot graphs in Figure 6C and Figure 6D.
- https://cdn.elifesciences.org/articles/80218/elife-80218-fig6-data2-v2.xlsx
Figure 6—figure supplement 1

Increased membrane permeability of rv0158 KO resulted in higher intracellular accumulation of 14C- isoniazid.
Log-phase Mtb cultures (OD600 nm ≈ 0.6) were incubated with [14C]-Isoniazid (ViTrax Inc) at a concentration of 0.5 μCi/mL. After 1 hr of treatment, the intracellular level of isoniazid was determined by bacterial lysis using bead-beating followed by measuring radioactivity. Fold change in count per minute (CPM) relative to wild-type Mtb is plotted. Error bars represent the standard deviation from the mean. Data represent at least three independent experiments performed in at least duplicate (p<0.05: *, unpaired two-tailed Student’s t-test).
-
Figure 6—figure supplement 1—source data 1
Numerical values used to plot bar graph in Figure 6—figure supplement 1.
- https://cdn.elifesciences.org/articles/80218/elife-80218-fig6-figsupp1-data1-v2.xlsx
Figure 7 with 1 supplement
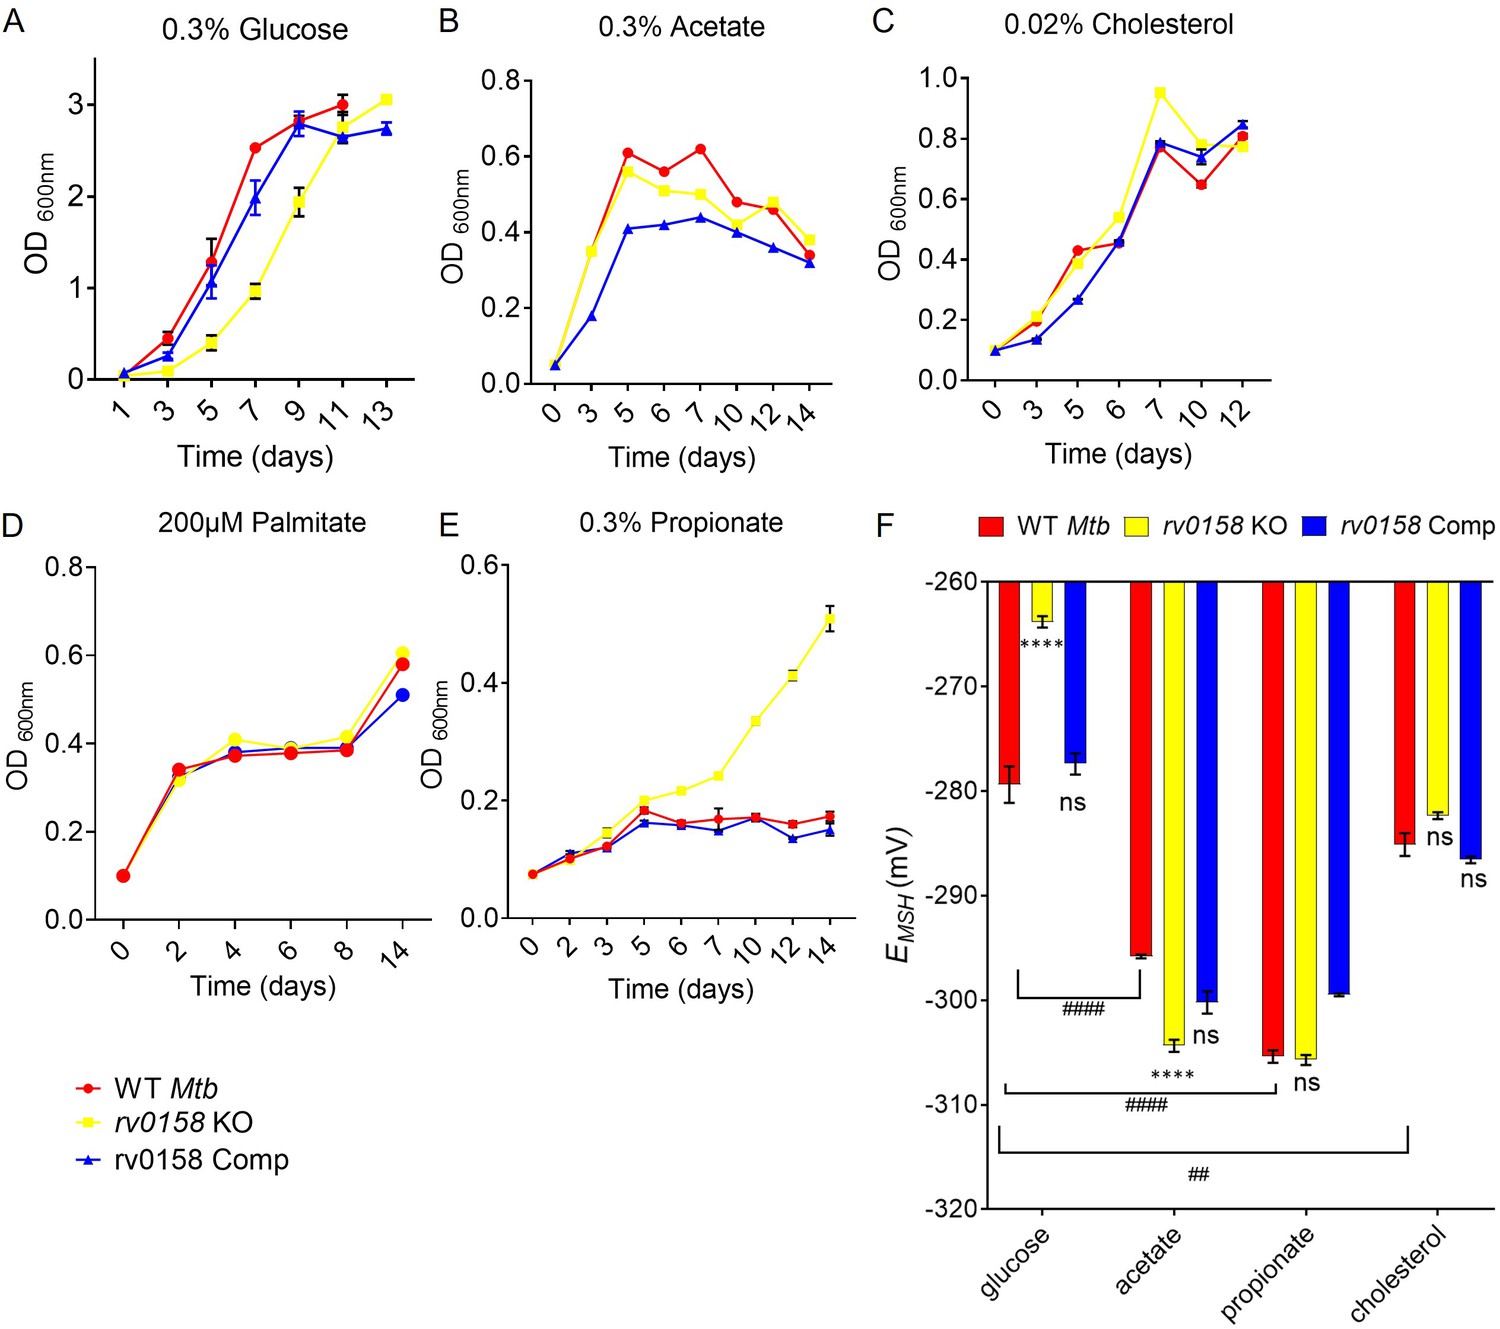
rv0158 deletion improved Mtb growth and intracellular redox state with fatty acids as carbon source.
(A– E) Log-phase cultures of Mtb strains (WT Mtb, rv0158 KO, and rv0158 Comp) were synchronized to OD600=0.1 and grown in 7H9 broth (no glycerol) containing (A) 0.3% D-glucose, (B) 0.3% sodium acetate, (C) 0.02% cholesterol (D) 200 μM palmitate, and (E) 0.3% sodium propionate. Culture turbidity (OD600 nm) was measured at the indicated time points for determining growth kinetics. Results are representative of two independent experiments. (F) C source-dependent changes in the redox state of Mtb is mediated by rv0158. Mtb strains (WT Mtb, rv0158 KO, and rv0158 Comp) were synchronized to OD600 nm = 0.1 and grown in 7H9 broth (no glycerol) containing 0.3% D-glucose or 0.3% sodium acetate or 0.3% sodium propionate or 0.02% cholesterol to log-phase (OD600 nm = 0.5–0.6) and Mrx1-roGFP2 response was measured. The data are means ± SEM of two independent experiments (n=4). p was determined by two-way ANOVA with Tukey’s multiple comparisons test (**** p<0.001, ns indicates not significant: Comparison is performed between KO or Comp strain and WT Mtb; ####: p<0.001: ##: p<0.01, the comparison is performed between WT Mtb grown in different C sources).
-
Figure 7—source data 1
Numerical values used to plot graphs in Figure 7A–F.
- https://cdn.elifesciences.org/articles/80218/elife-80218-fig7-data1-v2.xlsx
Figure 7—figure supplement 1

rv0158 deletion leads to extended lag phase in Mtb.
Log-phase cultures of Mtb strains (Wild-type Mtb (WT Mtb), rv0158 KO, and rv0158 Comp) were synchronized to OD600=0.1 and grown in 7H9+ADS. Growth kinetics as determined by enumerating CFU on indicated time-points. Error bars represent the standard deviation from the mean. Data represent at least two independent experiments performed in duplicate (n=4).
-
Figure 7—figure supplement 1—source data 1
Numerical values used to plot bar graph in Figure 7—figure supplement 1.
- https://cdn.elifesciences.org/articles/80218/elife-80218-fig7-figsupp1-data1-v2.xlsx
Figure 8
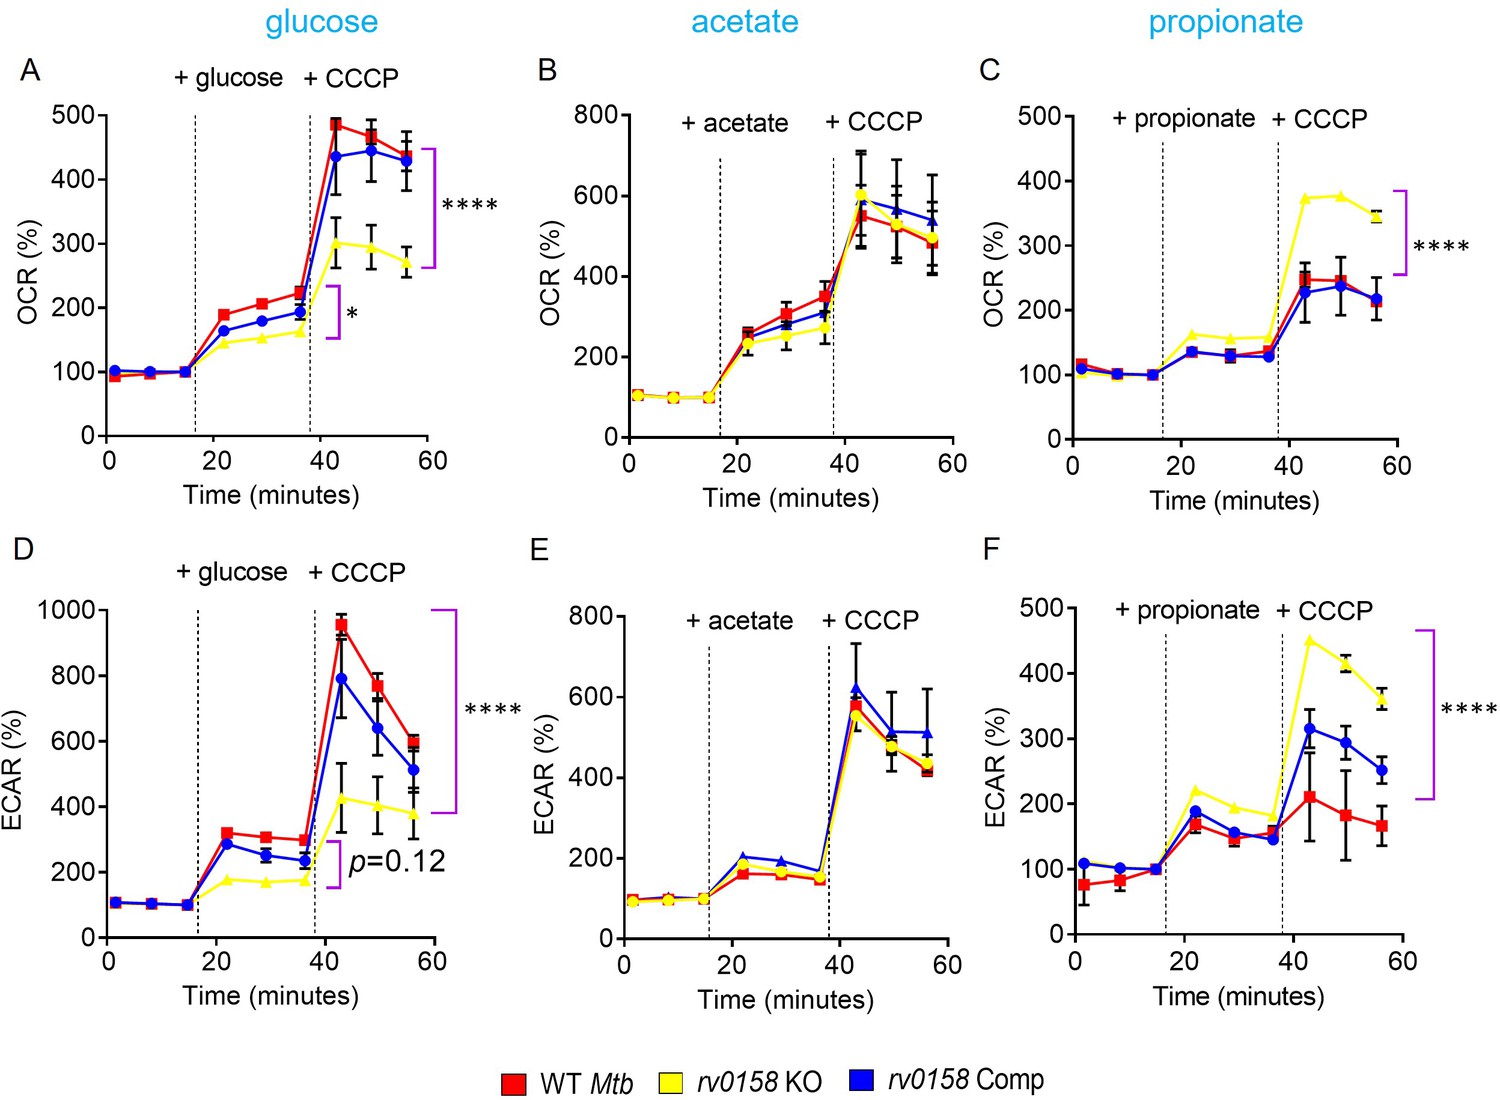
Fatty acid metabolites are better substrates for respiration in rv0158 KO than glucose.
ECAR and OCR were measured using the Agilent Seahorse XFp analyzer. ECAR (mpH/min) is an indicator of H+ production or extracellular acidification due to glycolytic flux and TCA, and OCR (pmol/min) indicates the rate of oxygen consumption, suggesting the rate of electron flux through the Electron Transport Chain during oxidative phosphorylation. %OCR and %ECAR are displayed as a percentage of third baseline OCR and ECAR values, respectively. Log-phase bacterial cultures were starved overnight, 2*106 cells were seeded on each well, and (A– C) %OCR or (D- F) %ECAR profiles of WT Mtb: red, rv0158 KO: yellow and rv0158 Comp: blue were plotted over time. At the indicated times, either 0.3% (final concentration) glucose or 0.3% sodium acetate, or 0.3% sodium propionate (dashed line) was added as the only carbon source, followed by uncoupler- 10 mM CCCP. Results are representative of two independent experiments. The data are means ± SEM. (p-value was calculated with the third data point across groups after the addition of a C source. Another statistical significance was calculated between the first data point obtained across groups after the addition of CCCP; p<0.05: *, p<0.0001: ****, one-way ANOVA with Dunnett’s multiple comparisons test).
-
Figure 8—source data 1
%OCR and %ECAR numerical values of WT Mtb, rv0158 KO, and rv0158 Comp.
- https://cdn.elifesciences.org/articles/80218/elife-80218-fig8-data1-v2.xlsx
Figure 9 with 2 supplements
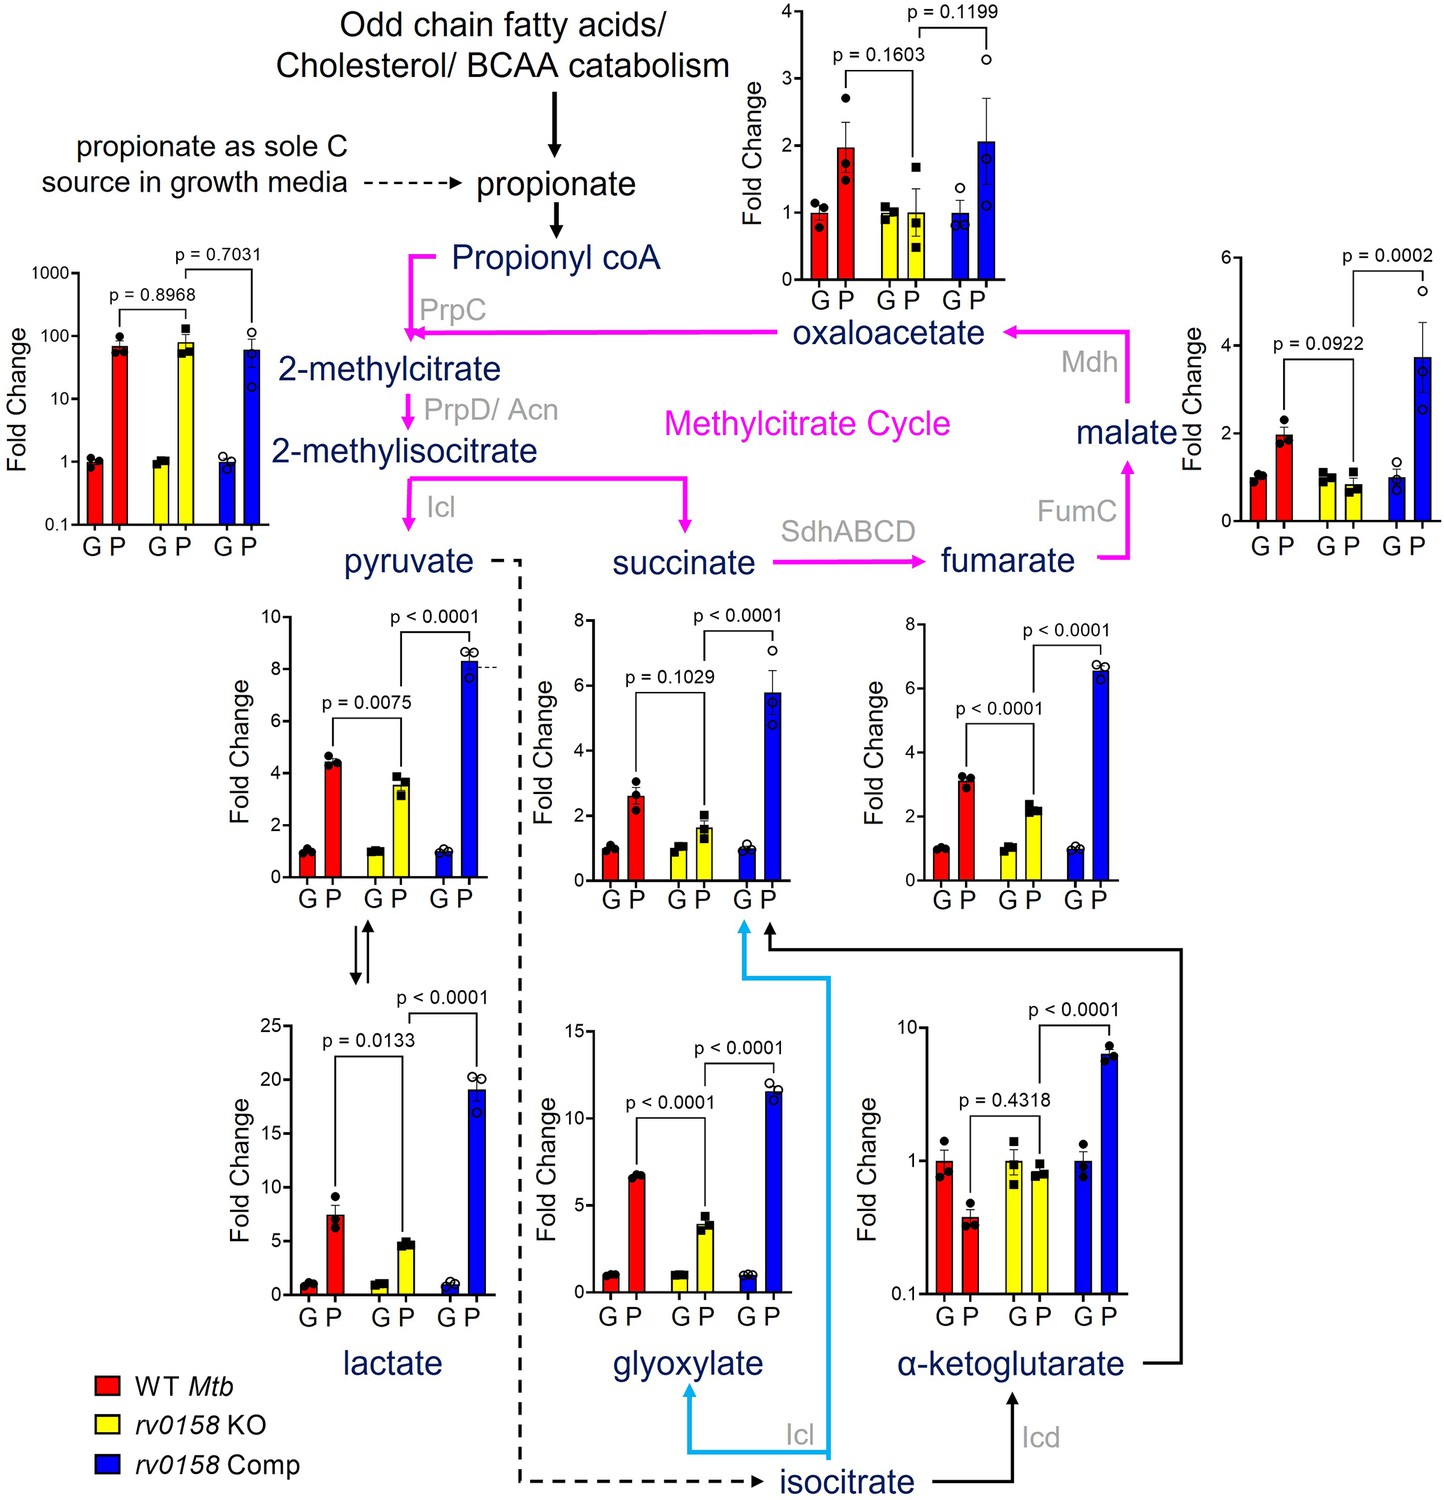
Measurement of steady-state metabolite levels in Mtb strains growing on either glucose or propionate as C source.
Log-phase cultures of Mtb strains (Wild-type Mtb (WT Mtb), rv0158 KO, and rv0158 Comp) were synchronized to OD600=0.1 and grown in 7H9 broth (no glycerol) containing either 0.3% glucose (G) or 0.3% propionate (P) as sole C source. Quantitative LC-MS/MS analysis of metabolic intermediates of Methylcitrate cycle (magenta arrows), glyoxylate shunt (Cyan), and TCA cycle. Data are represented as fold change in metabolite levels under propionate conditions relative to that of growing on glucose as C source. (Abbreviations: PrpC- Methylcitrate synthase PrpC, PrpD/ Acn- Methylcitrate dehydratase PrpD/ Methylaconitase, Icl- Isocitrate lyase, Sdh- Succinate dehydrogenase, FumC- Fumarase C, Mdh- Malate dehydrogenase, Icd- Isocitrate dehydrogenase). The data are means ± SEM of two independent experiments. (Statistical significance was calculated by one-way ANOVA with Tukey’s multiple comparisons test).
-
Figure 9—source data 1
Raw data files used to measure steady-state metabolite levels in Mtb strains.
- https://cdn.elifesciences.org/articles/80218/elife-80218-fig9-data1-v2.zip
Figure 9—figure supplement 1
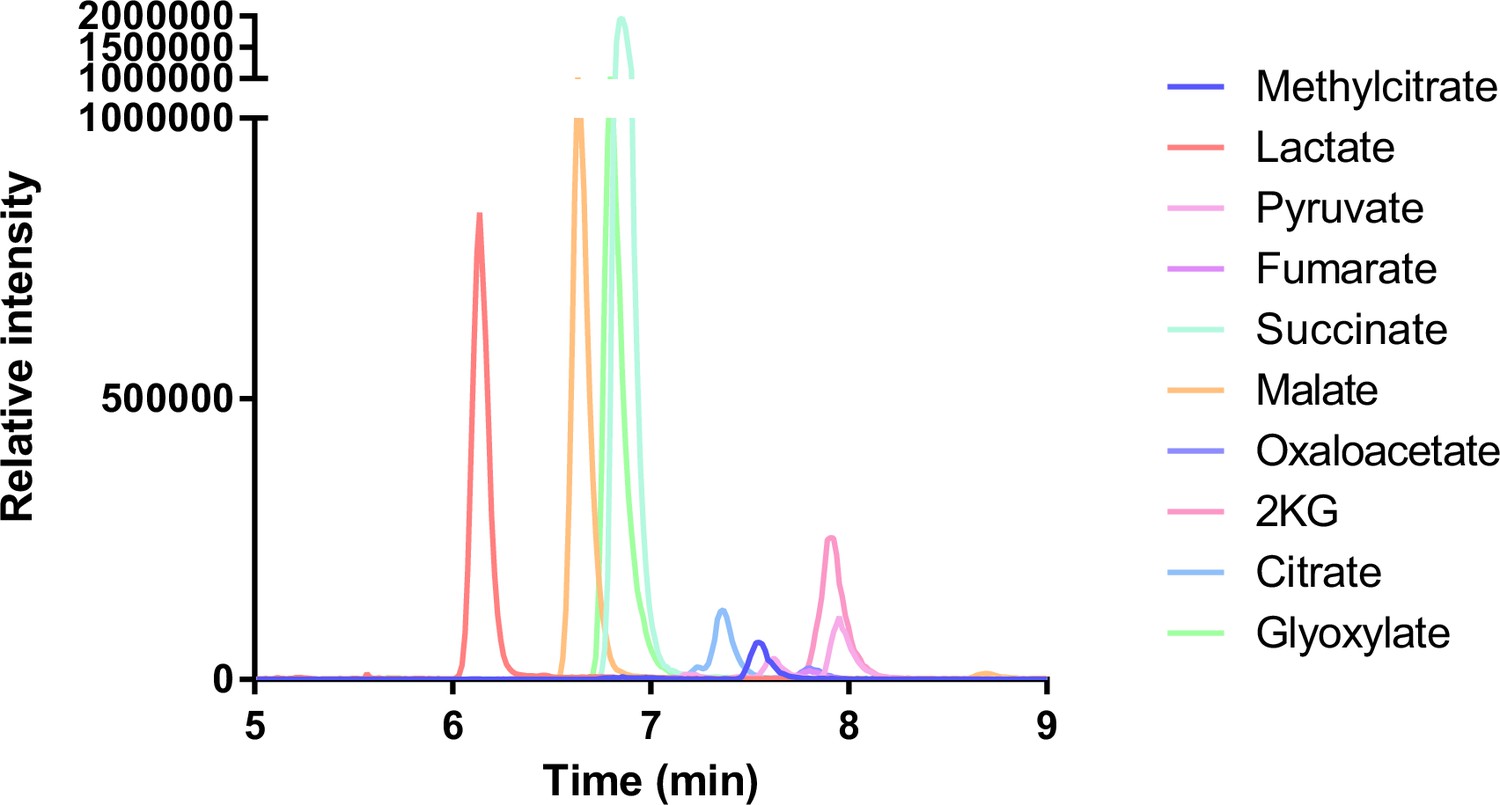
Chromatogram of metabolite standards.
The TCA cycle and glyoxylate cycle metabolite standards were derivatized with OBHA and analysed by LC-MS/MS.
Figure 9—figure supplement 2

Chromatogram of oxaloacetate standard.
Oxaloacetate was derivatized with OBHA and analysed by LC-MS/MS. Oxaloacetate is unstable in aqueous solutions, hence was stabilized by OBHA derivatization to prevent degradation.
Figure 10 with 2 supplements
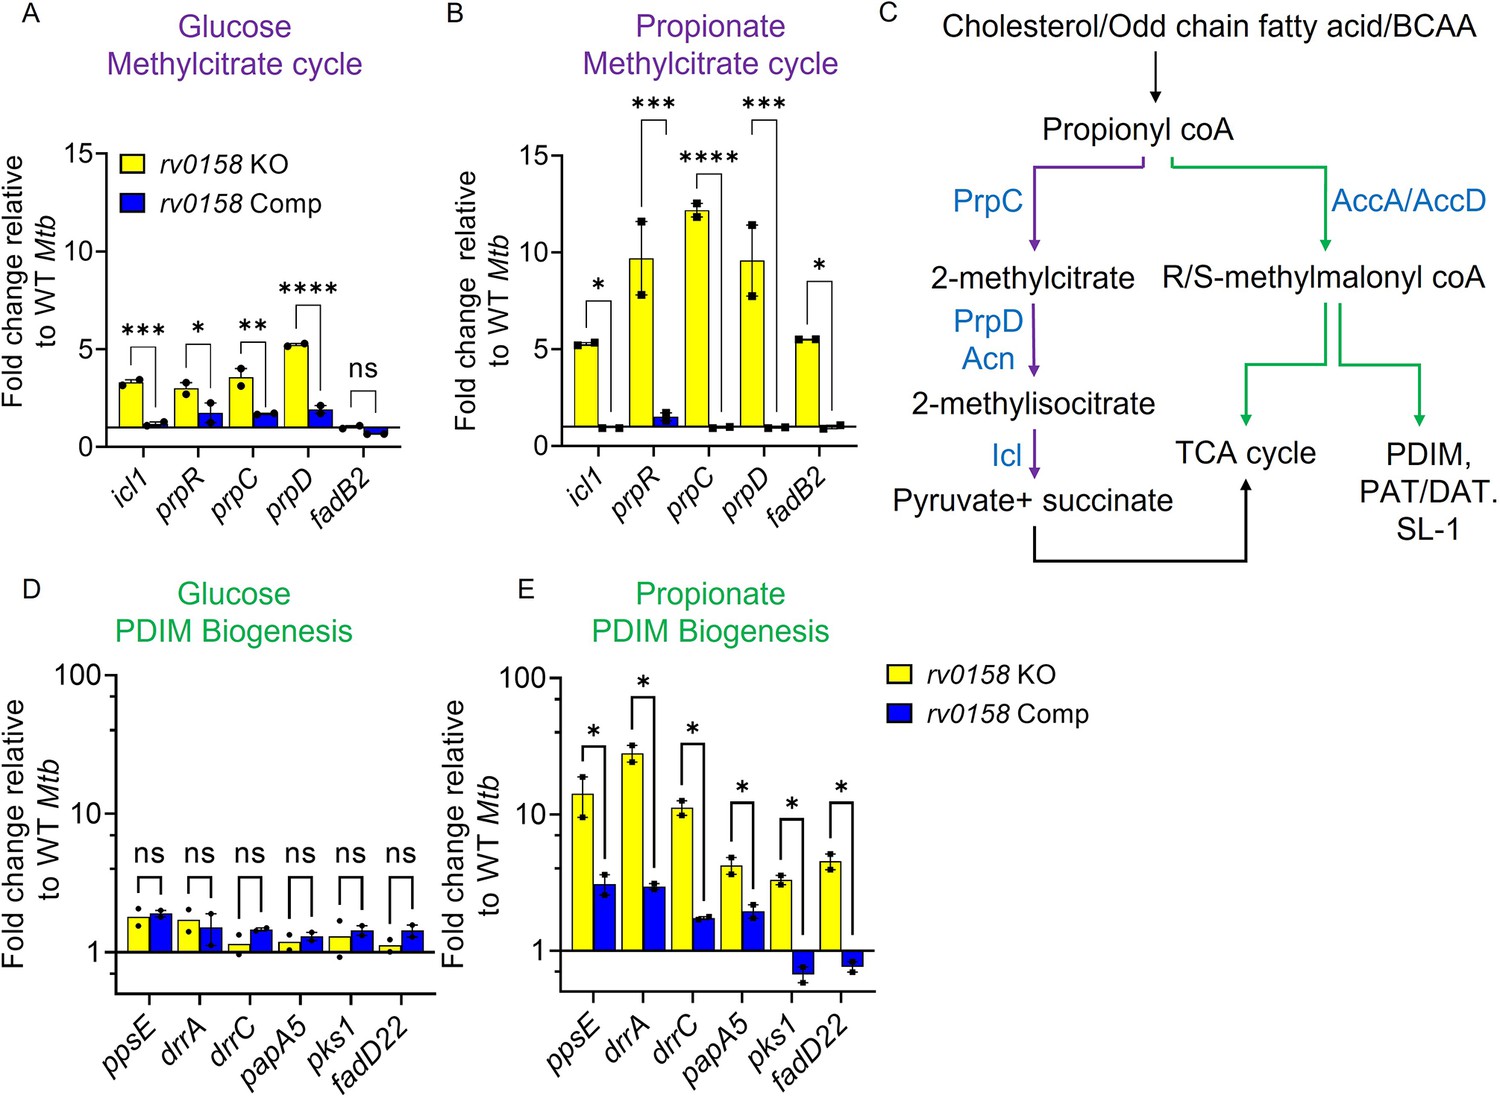
Rv0158 Transcriptional regulator is a negative regulator of genes involved in the methylcitrate cycle and biosynthesis of methyl-branched fatty acids.
Mtb strains (WT Mtb, rv0158 KO, and rv0158 Comp) were synchronized to OD600 nm = 0.1 and grown in 7H9 broth (no glycerol) containing 0.3% D-glucose or 0.3% sodium propionate to log-phase (OD600 nm = 0.5–0.6) and RNA was isolated to perform qRT-PCR. (A, B) C source-dependent change in the RNA levels of genes involved in the methylcitrate cycle and fadB2 of Mtb is mediated by Rv0158, as determined by qRT-PCR. (C) Fates of propionyl coA derived from the catabolism of cholesterol or fatty acids. (Abbreviations: PDIM- Phthiocerol dimycocerosates, SL- sulfolipids, PAT/DAT- polyacyltrehaloses/ diacyltrehaloses, PrpC- Methylcitrate synthase PrpC, PrpD/ Acn- Methylcitrate dehydratase PrpD/ Methylaconitase, Icl- Isocitrate lyase, AccA/ AccD-acetyl-/propionyl-CoA carboxylase alpha chain/ acetyl-/propionyl-CoA carboxylase (beta subunit)). (D, E) C source-dependent change in the RNA levels of genes involved in the biosynthesis of methyl-branched fatty acids of Mtb, is mediated by Rv0158, as determined by qRT-PCR. The data are means ± SEM of two independent experiments. (p>0.05: ns, p<0.05: *, p<0.001: ***, two-way ANOVA with Sidak’s multiple comparisons test).
-
Figure 10—source data 1
Numerical values indicating fold changes in rv0158- dependent expression of genes involved in the methylcitrate cycle and biosynthesis of methyl-branched fatty acids.
- https://cdn.elifesciences.org/articles/80218/elife-80218-fig10-data1-v2.xlsx
Figure 10—figure supplement 1

Biophysical characteristics of Rv0158 protein from Mtb H37Rv.
(a) The sequence alignment between Rv0158 and Rv3557c (KstR2) amino acid sequence was done using ESPript 3.0 (Robert and Gouet, 2014). The characteristic Helix-Turn-Helix (HTH) amino acid sequence in KstR2 protein is indicated in red. (b– d) The hexahistidine-tagged Rv0158 protein was expressed in E. coli BL21 (DE3) and purified from the soluble fraction by immobilized-metal affinity chromatography (see Materials and methods). (b) For gel filtration of protein sample Rv0158 (Ni-NTA eluted), Buffer - 20 mM Tris, pH 7.5, 100 mM NaCl was used in Superdex 75 column using GE AKTA prime plus FPLC system. Gel filtration profile of Rv0158 (red) overlaid with standard (blue) showing Rv0158 (Peak 2) elutes as a homodimer (approximate molecular weight of 54 KDa). SDS PAGE of Rv0158 protein elution fractions further suggests that Rv0158 is a homodimer in solution as a band at approximate monomer molecular weight (27 KDa) is detected upon staining the gel. See Source image: Figure 10—figure supplement 1—source data 1 used to generate this figure. (c) Circular Dichroism (CD) scan spectra of Rv0158 was recorded at 25 °C over the wavelength range from 260 nm to 190 nm. (d) CD melting curve was recorded at 209 nm over the temperature range from 10 °C to 90 °C. (e) In silico analysis of Rv0158 structure using homology modeling. Using the crystal structure of ketosteroid transcriptional regulator KstR2 of Mtb (PDB ID: 4W97), Rv0158 was modelled in homodimer form using homology modeling tool MODELLER version 9.19. The characteristic Helix-Turn-Helix (HTH) structural motif in N-terminal DNA binding region is shown in red. LBD is C-terminal ligand binding domain. This figure is related to the data displayed on Table 2.
-
Figure 10—figure supplement 1—source data 1
Raw data files containing SDS-PAGE gel images as shown in Figure 10—figure supplement 1b.
- https://cdn.elifesciences.org/articles/80218/elife-80218-fig10-figsupp1-data1-v2.zip
-
Figure 10—figure supplement 1—source data 2
Numerical values used to plot graph in Figure 10—figure supplement 1b.
- https://cdn.elifesciences.org/articles/80218/elife-80218-fig10-figsupp1-data2-v2.xls
Figure 10—figure supplement 2

Rv0158 Transcriptional regulator is a negative regulator of genes involved in Methylcitrate cycle and biosynthesis of methyl- branched fatty acids.
Mtb strains (WT Mtb, rv0158 KO, and rv0158 Comp) were synchronized to OD600 nm = 0.1 and grown in 7H9 broth (no glycerol) containing 0.3% D-glucose (G) or 0.3% sodium propionate (P) to log-phase (OD600 nm = 0.5–0.6) and RNA was isolated to perform qRT-PCR. C source-dependent change in the RNA levels of genes involved in (a) Methylcitrate cycle and fadB2 (b) genes involved in biosynthesis of methyl branched fatty acids of Mtb, is mediated by Rv0158, as determined by qRT-PCR. The data are means ± SEM of two independent experiments. (p>0.05: ns, p<0.05: *, p<0.001: ***, p<0.0001: ****, two-way ANOVA with Sidak’s multiple comparisons test).
-
Figure 10—figure supplement 2—source data 1
Numerical values indicating fold changes in rv0158-dependent expression of genes involved in the methylcitrate cycle and biosynthesis of methyl-branched fatty acids.
- https://cdn.elifesciences.org/articles/80218/elife-80218-fig10-figsupp2-data1-v2.csv
Figure 11
Rv0158 Transcriptional regulator binds to the promoter region of genes involved in methylcitrate cycle.
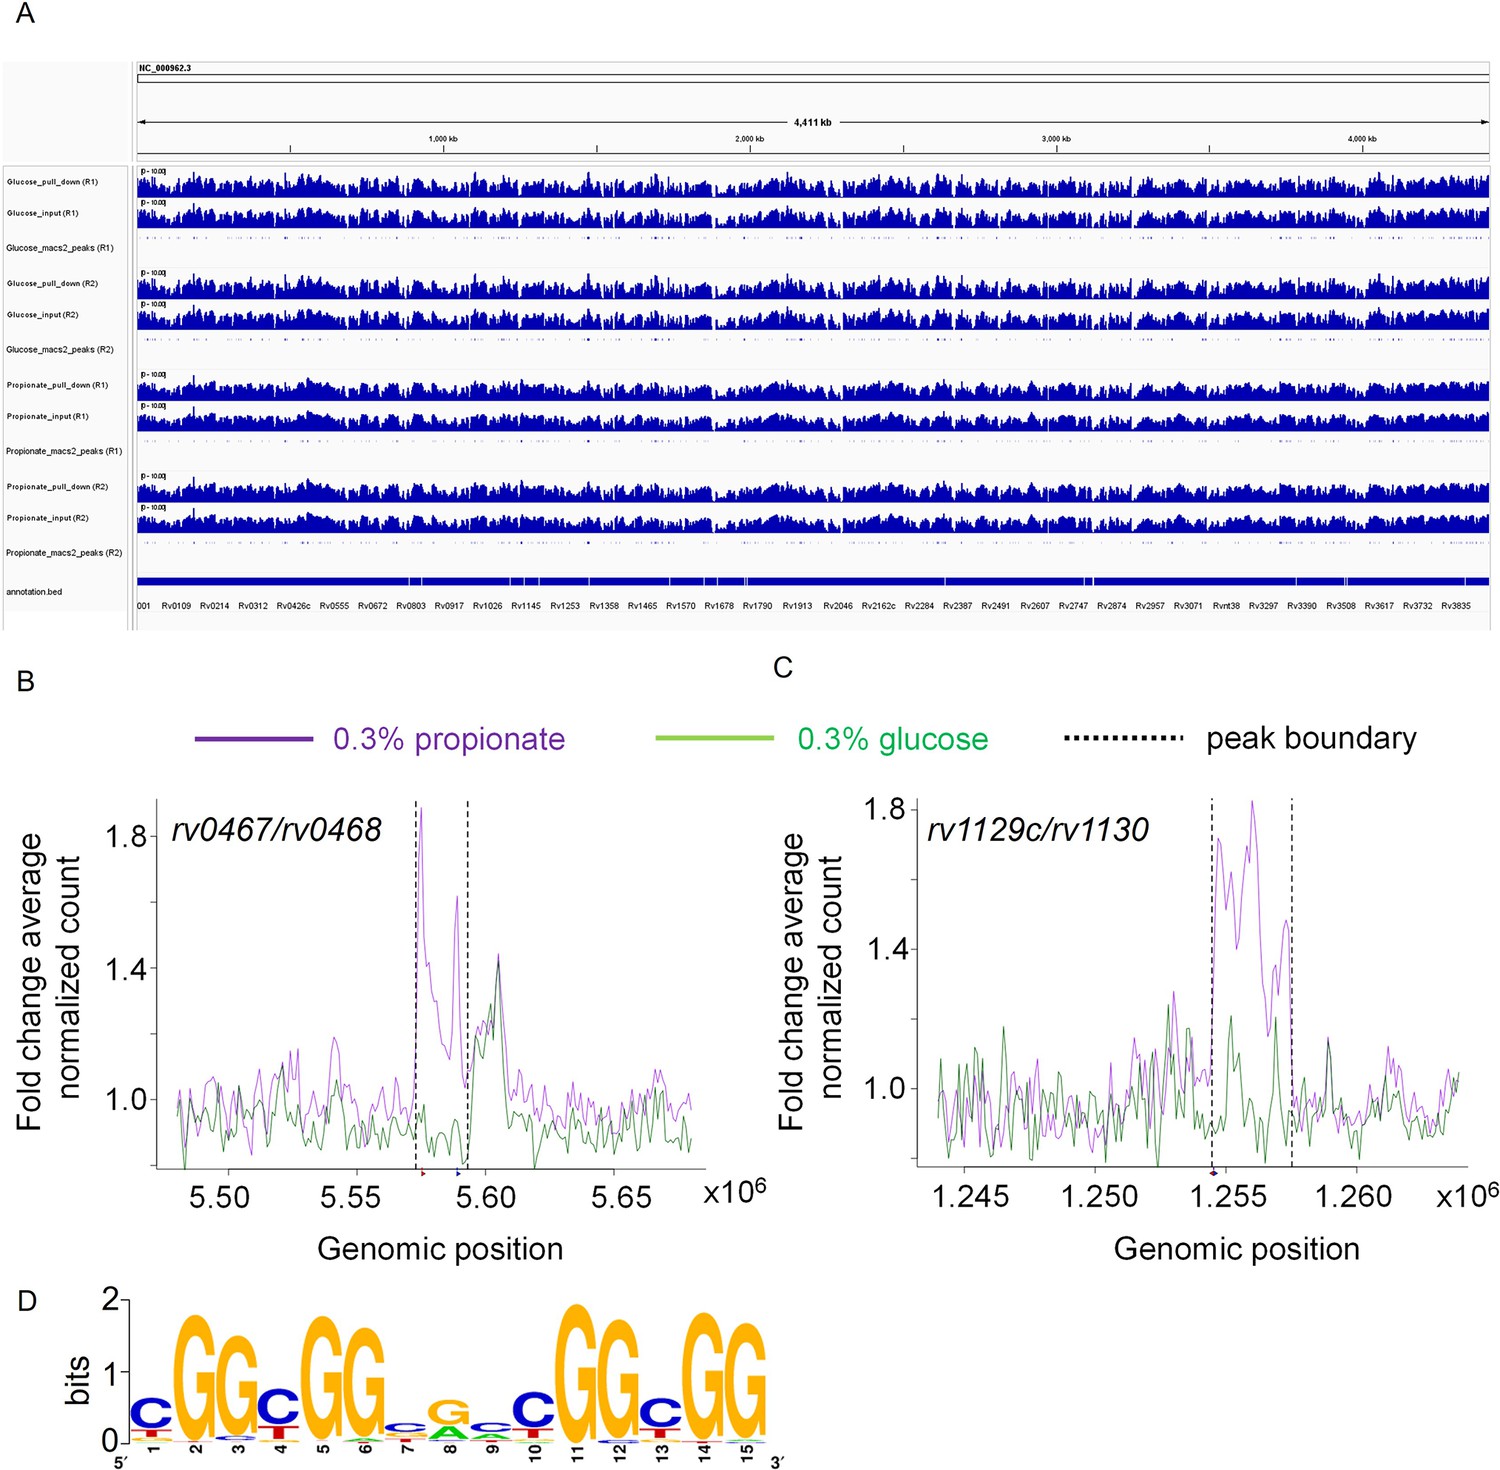
0.3 OD cultures of rv0158 KO-pexCF-rv0158 Mtb, either growing in 0.3% glucose or 0.3% propionate were induced with 12.5 ng/mL of anhydrotetracycline for 24 hr, and DNA- protein binding interactions were determined as mentioned in Material and Methods. (A) A snapshot from integrative genomics viewer (IGV) showing histogram of log-scaled normalised reads (RPGC normalisation) with Mtb H37Rv genome (Accession no.- NC_000962.3) as reference. Horizontal axis shows genomic positions on the reference genome with the bottommost horizontal panel representing genes with positions obtained from the.gff file. Each horizontal panel represents histogram of mapped reads (bin size of 100 base pairs) in pull down sample which is followed by the input sample (without the pull down) and is followed by the representation of peak regions predicted by the macs2. (B and C) Line plot representing the distribution of fold change of average normalised reads (CPM) with respect to the genomic position of (B) rv0467/rv0468 peak and (C) rv1129c/rv1130 peak on the X-axis. The purple and green lines represent the propionate and glucose sample conditions. The normalised data (CPM) from both the replicates were averaged and a ratio of averaged normalised data of the pull-down to that of the input samples was calculated for the plot. The q values associated with the peaks are 9.9 *10–64 for rv0467/rv0468 peak and 3.4* 10–108 for rv1129c/rv1130 peak, respectively. (D) Consensus sequence of Rv0158 binding motif as obtained from MEME-ChIP (e value = 2.6*10–109).
-
Figure 11—source data 1
Snapshots from IGV showing histogram of log-scaled normalised reads (RPGC normalisation) with NC_000962.3 (Mtb H37Rv) as reference genome.
Horizontal axis shows genomic positions on the reference genome with the bottommost horizontal panel representing genes with positions obtained from the.gff file. Each horizontal panel represents histogram of mapped reads (bin size of 100 base pairs) in pull down sample which is followed by the input sample (without the pull down) and is followed by the representation of peak regions predicted by the macs2.
- https://cdn.elifesciences.org/articles/80218/elife-80218-fig11-data1-v2.zip
Figure 12 with 2 supplements
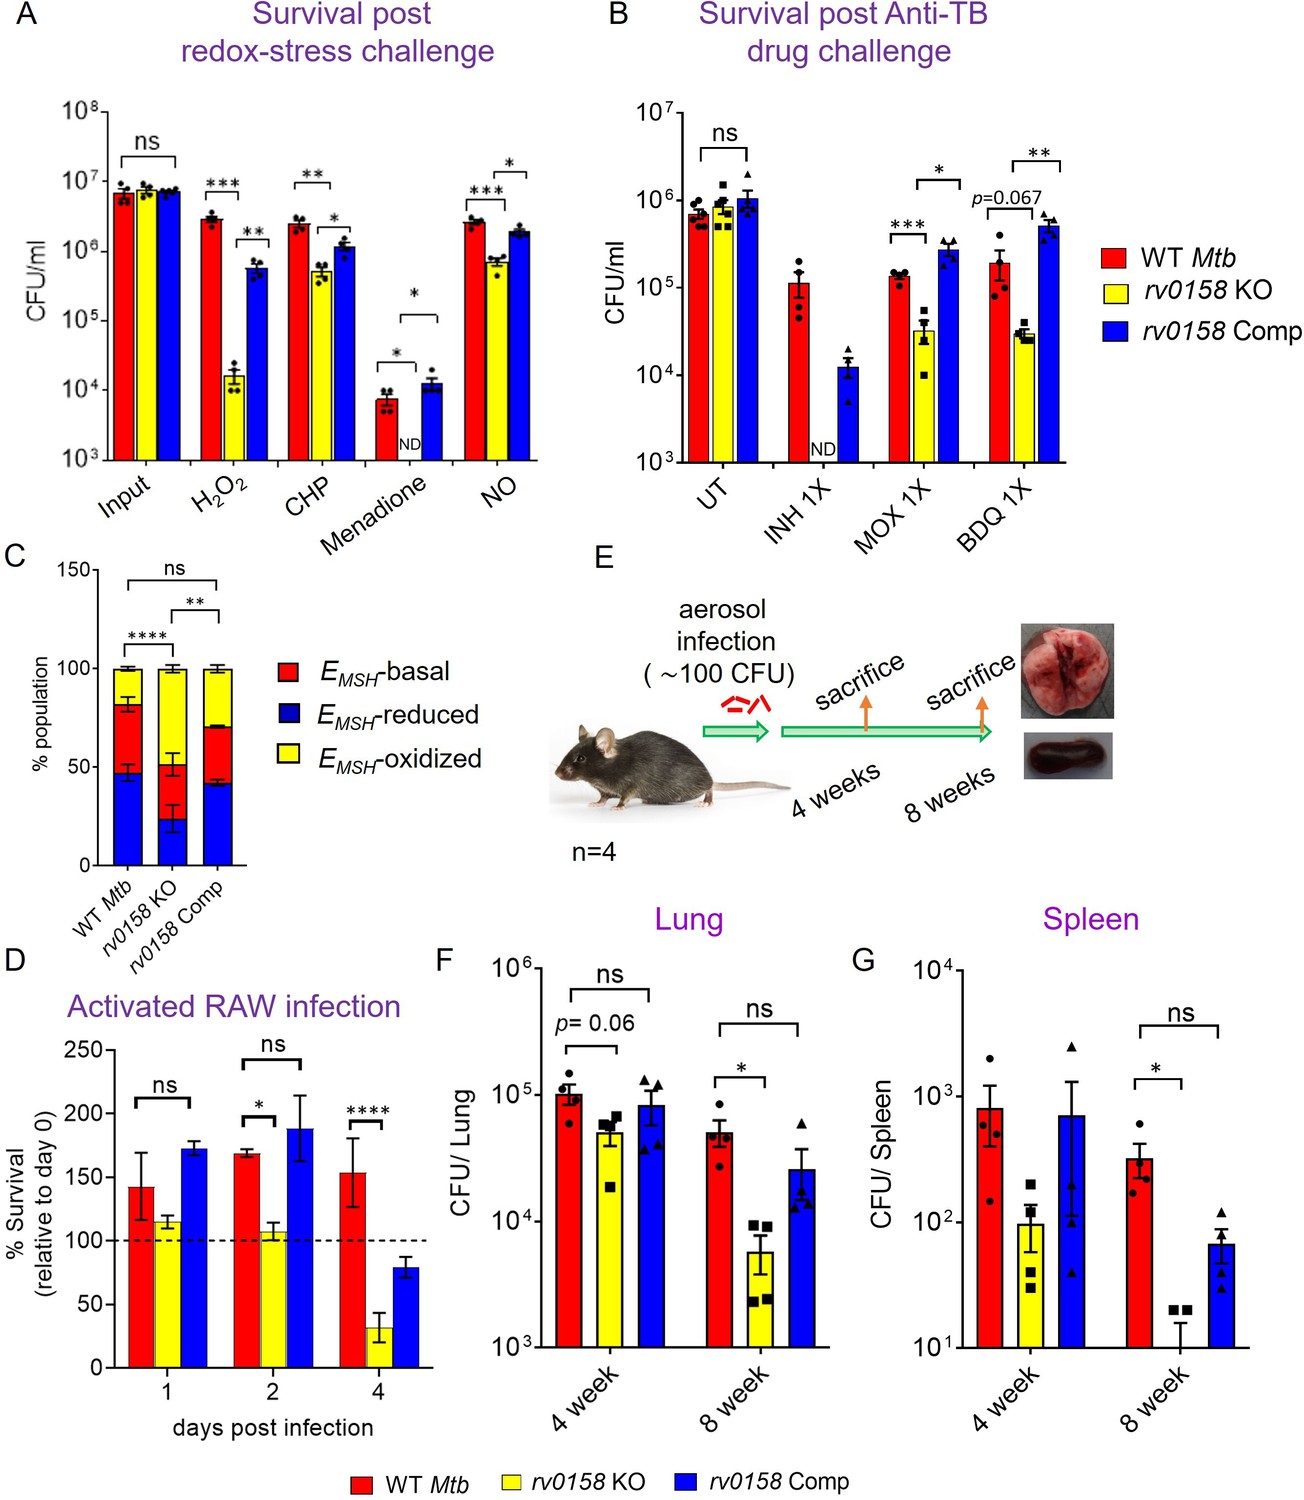
Mtb requires rv0158 to counteract exogenous redox stress, anti- TB drugs, and to survive inside macrophages and mice.
(A) Log-phase Mtb cultures were exposed to diverse oxidants (H2O2=5 mM; CHP = 100 μM; menadione = 0.5 mM; DETA-NO=1 mM) for 8 hours and plated. CFU was determined after 5–6 weeks. (B) Viability of bacterial strains was plotted after treatment with isoniazid (INH; 1 X MIC = 0.06 μg/ mL), moxifloxacin (MOXI; 1 X MIC = 0.125 μg/ mL), and bedaquiline (BDQ; 1 X MIC = 0.6 μg/ mL) for 5 days. Bar-graph represents survival (CFUs) of WT Mtb, rv0158 KO, and complemented strain. (ND- bacterial colonies not detected at the dilutions plated). (C, D) rv0158 KO Mtb is attenuated inside activated macrophages. IFN-γ- and LPS-treated (activated) RAW 264.7 macrophages were infected with Mrx1-roGFP2 expressing WT Mtb, rv0158 KO, and rv0158 Comp at an MOI of 10. At 48 hr post-infection, (C) 10,000 infected macrophages were analyzed by flow-cytometry, intramycobacterial EMSH was measured, and the percentage of bacilli in each redox subpopulation EMSH-oxidized (yellow), EMSH-basal (red), and EMSH-reduced (blue) was determined and plotted as a stacked bar graph as described in Materials and methods. Statistical comparison was performed between EMSH-oxidized fractions of Mtb strains. (D) Intramacrophage survival was monitored by enumerating CFU at 24-, 48-, and 96- hr post-infection. The data are means ± SEM of two independent experiments (n=4). p was determined by two-way ANOVA with Tukey’s multiple comparisons test (p>0.05: ns, p<0.05: *, p<0.0001: ****). (E– G) rv0158 is required for Mtb survival and persistence in mice. (E) Experimental design. C57BL/6 J mice were given a low-dose aerosol challenge (≈100 bacilli) with WT Mtb, rv0158 KO, and rv0158 Comp and assessed for survival in (F) lungs and (G) spleen at 4- and 8 weeks post-infection. Data shown are mean ± SEM from 4 mice per group. (p>0.05: ns, p<0.05: *, unpaired two-tailed Student’s t-test with Welch’s correction).
-
Figure 12—source data 1
Numerical values used to plot graphs in Figure 12A–G.
- https://cdn.elifesciences.org/articles/80218/elife-80218-fig12-data1-v2.xlsx
Figure 12—figure supplement 1
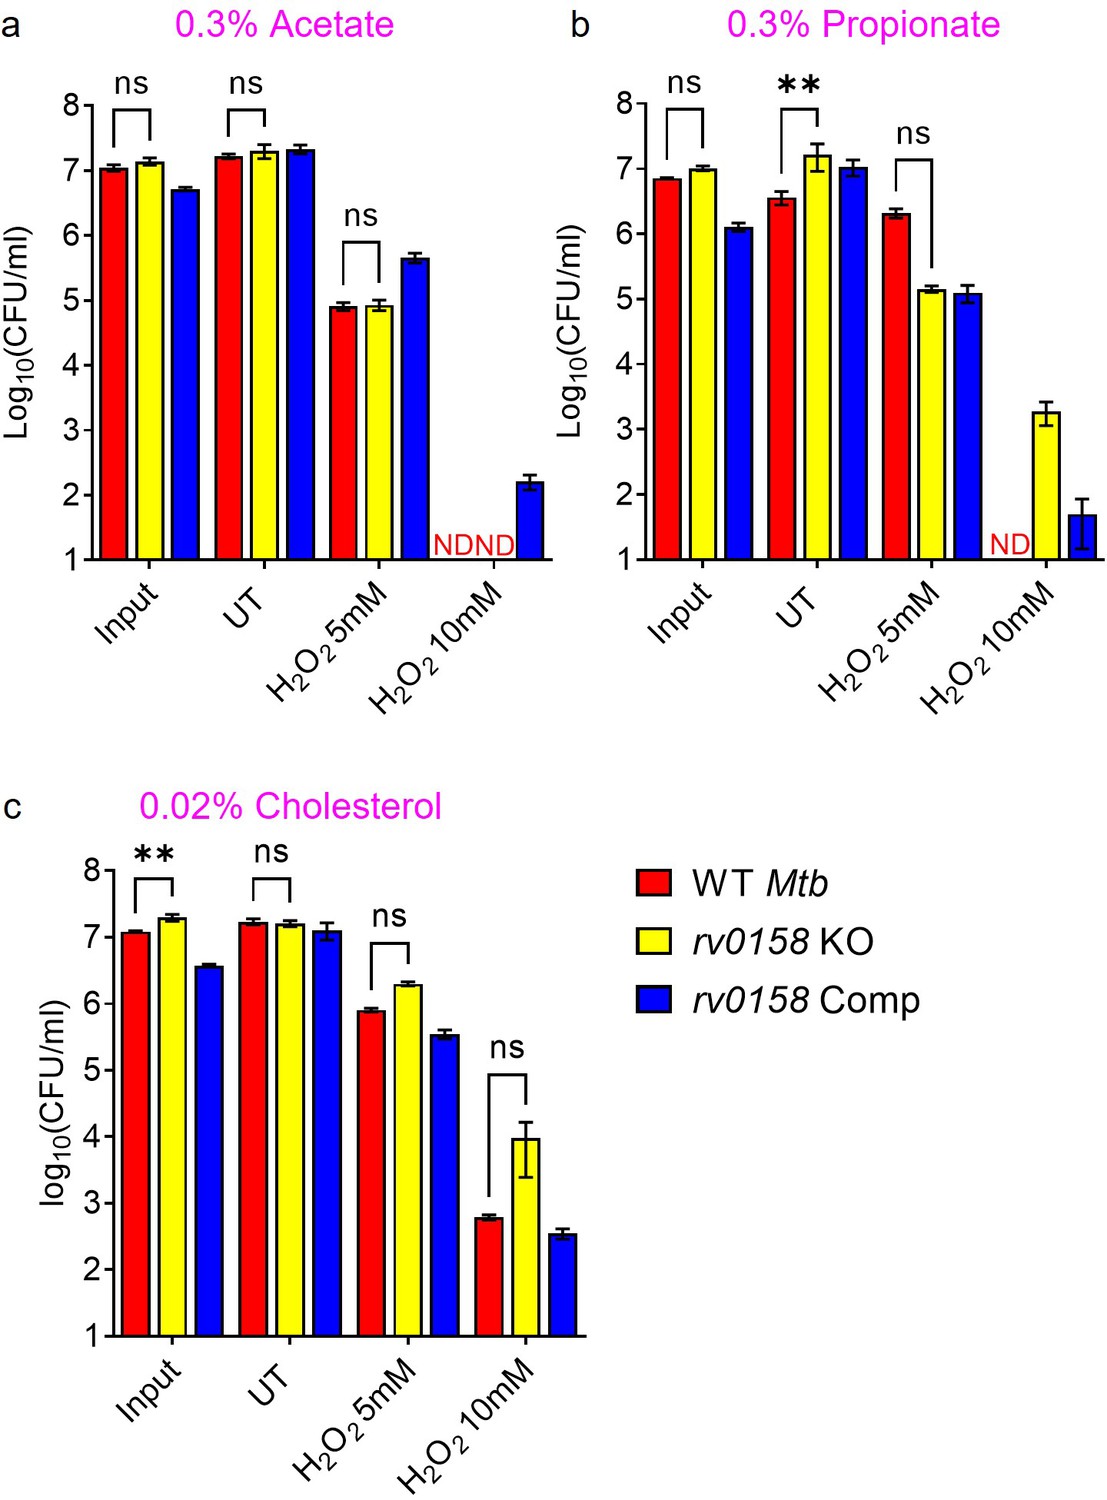
Fatty acids as C source improves tolerance of rv0158 KO Mtb against exogenous redox stress.
Log-phase cultures of Mtb strains (Wild-type Mtb (WT Mtb), rv0158 KO, and rv0158 Comp) were synchronized to OD600=0.1 and grown for 24 hr in 7H9 broth (no glycerol) containing (a) 0.3% sodium acetate and (b) 0.3% sodium propionate and (c) 0.02% cholesterol. Mtb cultures were then exposed to H2O2=5 mM and 10 mM for 24 hr and plated. CFU was determined after 5–6 weeks. Results are representative of two independent experiments performed in duplicate. The data are means ± SEM of two independent experiments (n=4). ND indicates colonies not detected at the dilutions plated. p was determined by two-way ANOVA with Dunnett’s multiple comparisons test (p>0.05, ns indicates not significant, p<0.01: **).
-
Figure 12—figure supplement 1—source data 1
Numerical values used to plot graph in Figure 12—figure supplement 1.
- https://cdn.elifesciences.org/articles/80218/elife-80218-fig12-figsupp1-data1-v2.xlsx
Figure 12—figure supplement 2
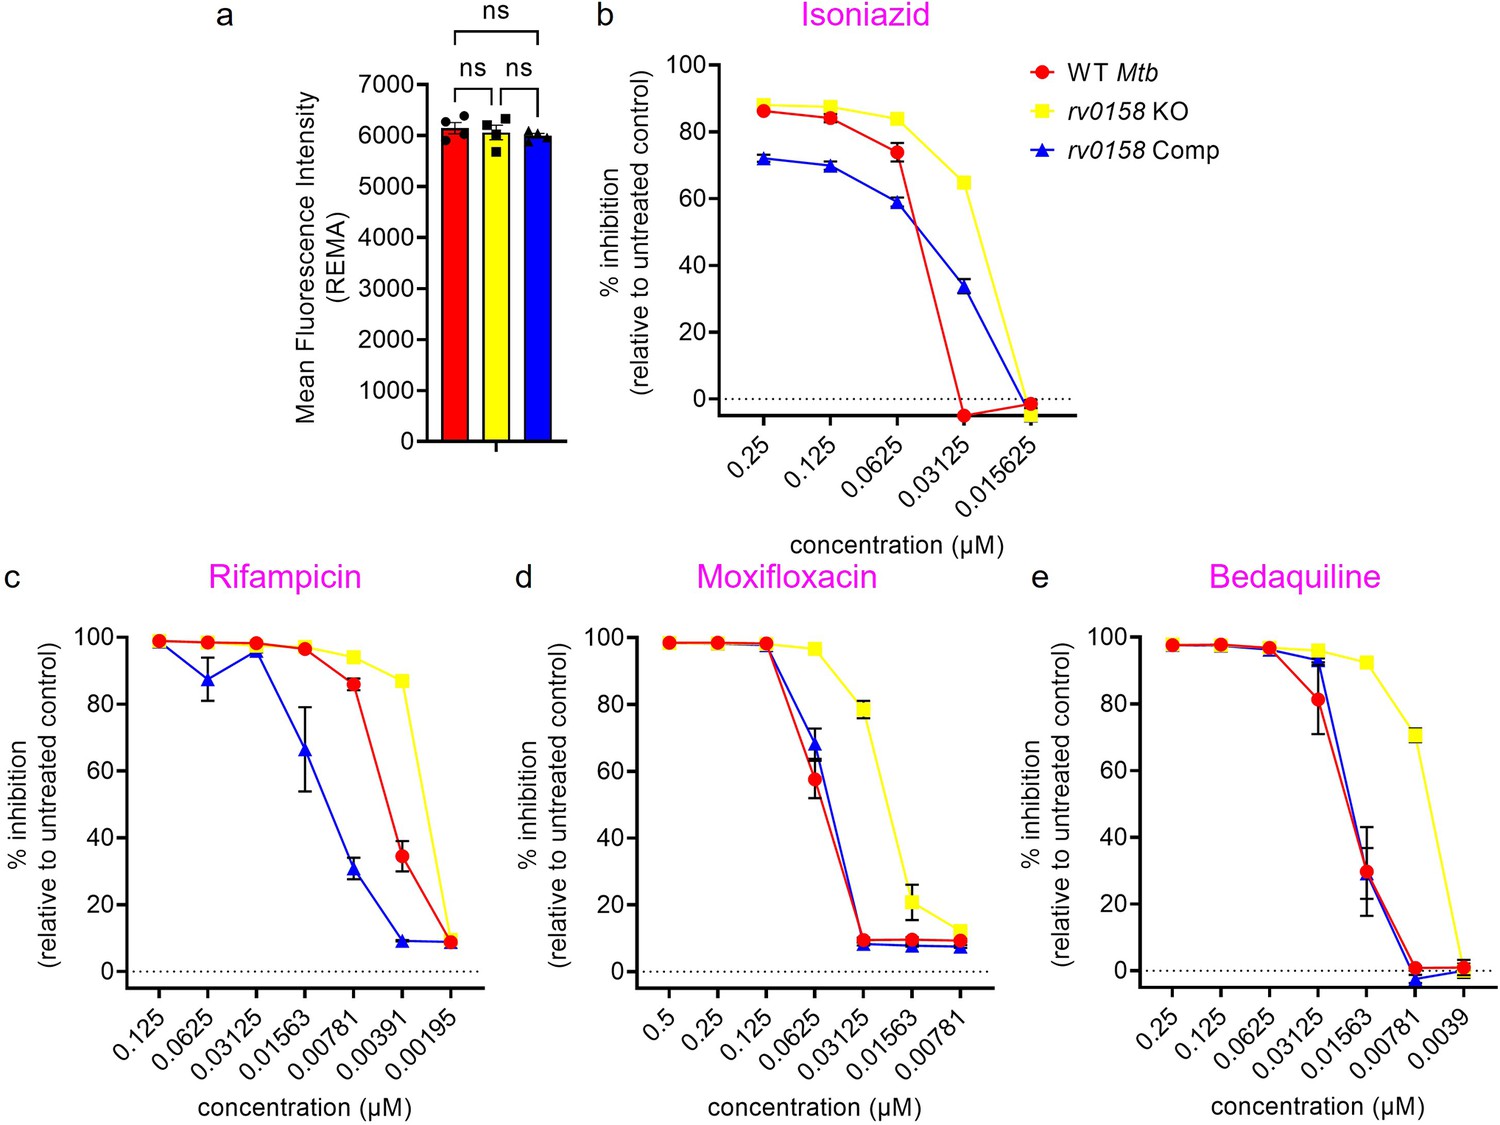
Dose response curves of isoniazid, rifampicin, moxifloxacin, and bedaquiline against rv0158 KO Mtb, as determined by REMA.
(a) Mean fluorescence intensity values of reduced resazurin (resorufin) generated by untreated Mtb strains after 5 days of incubation in 96-well plate. Results are representative of two independent experiments performed in duplicate. The data are means ± SEM of two independent experiments (n=4). p was determined by two-way ANOVA with Tukey’s multiple comparisons test (p>0.05, ns indicates not significant). (b–d) % inhibition of growth or metabolism induced by anti-TB drugs as determined by REMA. Results are representative of two independent experiments performed in duplicate. The data are means ± SEM of two independent experiments.
-
Figure 12—figure supplement 2—source data 1
Numerical values used to plot graph in Figure 12—figure supplement 2.
- https://cdn.elifesciences.org/articles/80218/elife-80218-fig12-figsupp2-data1-v2.xlsx
Tables
Table 1
List of redox-related proteins in Mtb which are either membrane bound or secreted out into periplasm/ extracellular space.
| Protein/small MW thiols | Rv ID | References | ||
|---|---|---|---|---|
| 1 | KatG | Rv1908c | Antioxidant enzyme | Braunstein et al., 2003; Tucci et al., 2020 |
| 2 | SodA | Rv3846 | Braunstein et al., 2003, Vargas-Romero et al., 2016, Tucci et al., 2020 | |
| 3 | AhpC | Rv2428 | Nieto R et al., 2016, Tucci et al., 2020 | |
| 4 | Tpx | Rv1932 | Probable thiol peroxidase | Tucci et al., 2020 |
| 5 | TrxB2 | Rv3913 | Thioredoxin reductase | Wong et al., 2018 |
| 6 | TrxC | Rv3914 | Thioredoxin | Wong et al., 2018, Tucci et al., 2020 |
| 7 | Rv0526 | Possible thioredoxin | Ke et al., 2018 | |
| 8 | ThiX | Rv0816 | Probable thioredoxin | Ke et al., 2018 |
| 9 | Ergothioneine | Sao Emani et al., 2013 |
Table 2
Binding affinities of small molecule lipid metabolites with Rv0158 protein, as determined by microscale thermophoresis (MST).
| SL. No | Name of molecule | Kd |
|---|---|---|
| 1. | CoA | n.b. |
| 2. | Acetyl-CoA | n.b. |
| 3. | Propionyl-CoA | n.b. |
| 4. | Malonyl-CoA | 2.4±1 µM |
| 5. | Methylmalonyl-CoA | 0.9±0.3 µM |
| 6. | Decanoyl-CoA | 6.4±1.2 µM |
| 7. | C12-CoA | 1.1±0.6 µM |
| 8. | C16-CoA | 1.8±0.5 µM |
| 9. | C18-CoA | 2.8±0.8 µM |
-
n.b.- No Binding.
-
Table 2—source data 1
Raw data files and Microscale Thermophoresis profiles indicating binding of different small molecules with His- tagged Rv0158 protein.
- https://cdn.elifesciences.org/articles/80218/elife-80218-table2-data1-v2.zip
Table 3
Rv0158 contributes to the intrinsic resistance of Mtb to anti-TB drugs.
Resazurin Microtiter assay to determine the minimum inhibitory concentration (MIC values) of first-line (Isoniazid and Rifampicin) and second-line (Bedaquiline and Moxifloxacin) anti-TB drugs.
| Strain | MIC90/Day5 in µg/mL | |||
|---|---|---|---|---|
| Moxifloxacin | Bedaquiline | Isoniazid* | Rifampicin | |
| WT Mtb | 0.12 | 0.03–0.06 | 0.06 | 0.0156 |
| rv0158 KO | 0.06 | 0.0156 | 0.03 | 0.0078 |
| rv0158 Comp | 0.12 | 0.03 | 0.06 | 0.0313 |
-
*
MIC determined visually by observing the change of colour from blue to pink.
Key resources table
| Reagent type (species) or resource | Designation | Source or reference | Identifiers | Additional information |
|---|---|---|---|---|
| Strain, strain background (Mycobacterium smegmatis) | Mycobacterium smegmatis mc2155 (Msm) | Dr. Kanury V.S. Rao (International Centre for Genetic Engineering and Biotechnology, New Delhi, India). | ||
| Strain, strain background (Mycobacterium tuberculosis) | Mycobacterium tuberculosis H37Rv (Mtb) | Dr. Kanury V.S. Rao (International Centre for Genetic Engineering and Biotechnology, New Delhi, India). | ||
| Recombinant DNA reagent | pMV762-Mrx1-roGFP2 (plasmid) | This paper; Bhaskar et al., 2014 | This plasmid can be obtained by sending a request to Dr. Amit Singh. | |
| Strain, strain background (mycobacteriophage) | pHAE180 mycobacterio- phage | Dr. Vinay Nandicoori (National Institute of Immunology, New Delhi, India) | ||
| Strain, strain background (Mycobacterium tuberculosis) | Mtb H37Rv mshA KO | Prof. William R. Jacobs Jr (Albert Einstein College of Medicine, New York, USA). | ||
| Strain, strain background (Mycobacterium tuberculosis) | Mtb CDC 1551 | BEI resources | ||
| Strain, strain background (Mycobacterium tuberculosis) | Mtb CDC1551 transposon mutants | BEI resources | ||
| Commercial assay or kit | DNA/RNA oxidative damage ELISA kit | Cayman Chemical | cat. no.- 589320 | |
| Other | CellROX Deep Red | Invitrogen | cat. no. C10422 | Final con-centration- 5 μM. See materials and methods (ROS quantification by CellROX Deep Red dye) |
| Other | [1, 2–14 C] sodium acetate | https://britatom.gov.in/ | product code- LCC34 | Final con-centration- 50 µCi. See materials and methods (Quantification of fatty acids and mycolic acids in Mtb strains) |
| Software, algorithm | GraphPad Prism | GraphPad Software (https://www.graphpad.com) | RRID:SCR_002798 | |
| Software, algorithm | ImageJ | ImageJ (http://imagej.nih.gov/ij/) | RRID:SCR_003070 | |
| Software, algorithm | Wave Desktop | Agilent Technologies | RRID:SCR_014526 |
Additional files
-
Supplementary file 1
TnSeq summary table.
- https://cdn.elifesciences.org/articles/80218/elife-80218-supp1-v2.xlsx
-
Supplementary file 2
List of genes that constitutes Mtb redoxosome.
- https://cdn.elifesciences.org/articles/80218/elife-80218-supp2-v2.xlsx
-
Supplementary file 3
List of previous studies that discuss about potential function of Mtb redoxosome- genes.
- https://cdn.elifesciences.org/articles/80218/elife-80218-supp3-v2.xlsx
-
Supplementary file 4
List of differentially expressed genes in untreated rv0158 KO Mtb and rv0158 Comp relative to untreated wild-type Mtb.
- https://cdn.elifesciences.org/articles/80218/elife-80218-supp4-v2.xlsx
-
Supplementary file 5
Binding sites of Rv0158 protein in Mtb genome.
- https://cdn.elifesciences.org/articles/80218/elife-80218-supp5-v2.xlsx
-
Supplementary file 6
Binding motifs for other TFs (PrpR, PhoP, RamB, and GlnR) known to regulate propionate metabolism in the regulatory regions of genes bound by Rv0158.
The distance between the Rv0158 motif and motifs of other TFs is also indicated.
- https://cdn.elifesciences.org/articles/80218/elife-80218-supp6-v2.xlsx
-
Supplementary file 7
Transposon mutants of Mtb CDC 1551 were collected from BEI Resources used in this study.
- https://cdn.elifesciences.org/articles/80218/elife-80218-supp7-v2.xlsx
-
Supplementary file 8
DNA oligonucleotides (Primers) used in this study.
- https://cdn.elifesciences.org/articles/80218/elife-80218-supp8-v2.xlsx
-
MDAR checklist
- https://cdn.elifesciences.org/articles/80218/elife-80218-mdarchecklist1-v2.docx
Download links
A two-part list of links to download the article, or parts of the article, in various formats.
Downloads (link to download the article as PDF)
Open citations (links to open the citations from this article in various online reference manager services)
Cite this article (links to download the citations from this article in formats compatible with various reference manager tools)
Biosensor-integrated transposon mutagenesis reveals rv0158 as a coordinator of redox homeostasis in Mycobacterium tuberculosis
eLife 12:e80218.
https://doi.org/10.7554/eLife.80218


