Targeting RNA:protein interactions with an integrative approach leads to the identification of potent YBX1 inhibitors
- Université Paris-Saclay, INSERM U1204, Univ Evry, Structure-Activité des Biomolécules Normales et Pathologiques (SABNP), France
- SYNSIGHT, France
Figures
Figure 1 with 2 supplements
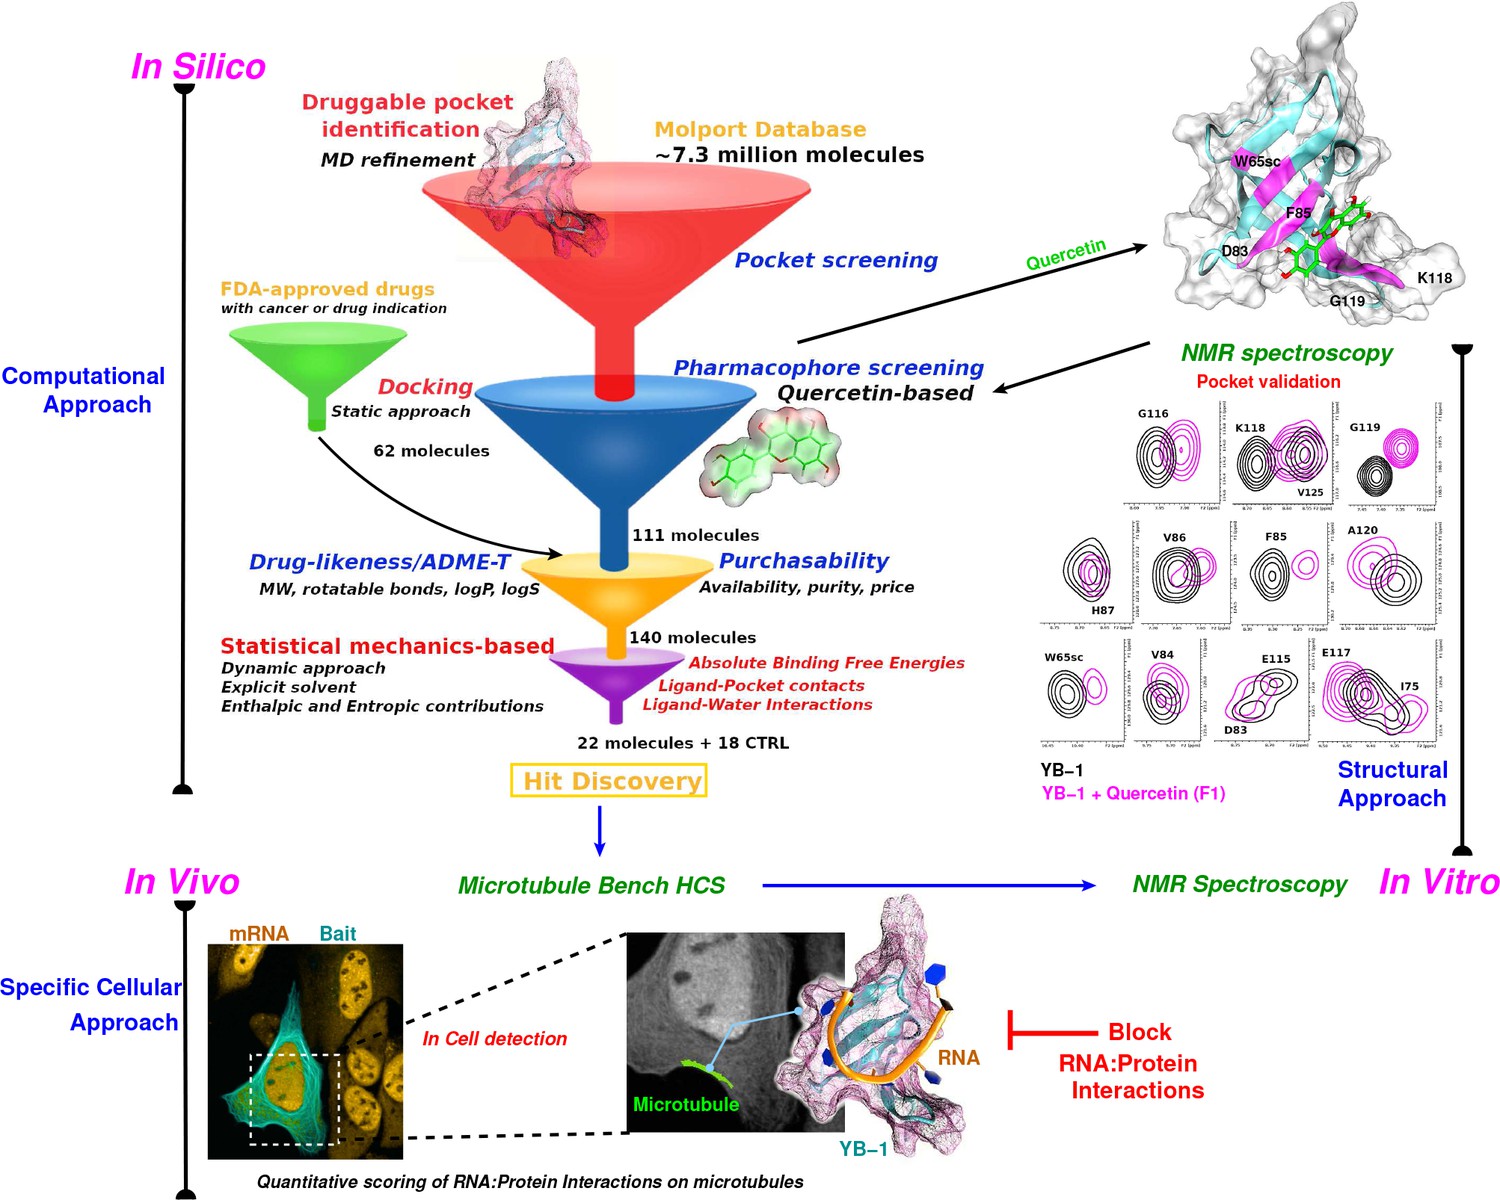
Schematic representation of an integrative approach for screening RPI inhibitors.
This approach combines information from three data sources: computational (in silico, top left), cellular (in vivo, bottom), and structural (in vitro, top right). Blue arrows indicate the data flow. In silico: Starting by a large-scale computational approach that uses Docking (static approach), Molecular Dynamics and Free Energy Simulations (dynamic approach), using a computational model to virtually screen large libraries of small molecules (here, Molport and FDA-approved drugs) with the prior knowledge of a validated pocket and where several filters are used to reduce the selection to the most pertinent ligands that are then proposed as hits to be tested experimentally. Filters are represented as funnels. In vivo: In cell validation of the efficiency of the proposed hits in blocking RPIs with the MT Bench assay. This technology can quantify RPIs at the single cell level by using microtubule filaments as intracellular nanoplatforms (lower left inset, the bait, here YB-1, is shown in cyan and mRNA in orange). Lower right inset: enlarged view on mRNAs (orange) brought on microtubules using YB-1 as bait (cartoon representation: YB-1 in dark cyan with a violet surface mesh is complexed with RNA (orange ribbon)). In vitro: Experimental validation of binding the target pocket using solution NMR spectroscopy. A zoom in on pocket residue signals in a 2D 1H-15N-SOFAST-HMQC of YB-1 alone (black) and in the presence of Quercetin F1 (magenta). The top right 3D structure shows the binding of Quercetin (green stick) to YB-1 (cartoon representation in cyan combined with a transparent surface). Residues showing chemical shifts upon F1 binding are colored in magenta and depict what we identified as the Quercetin-pocket.
Figure 1—figure supplement 1
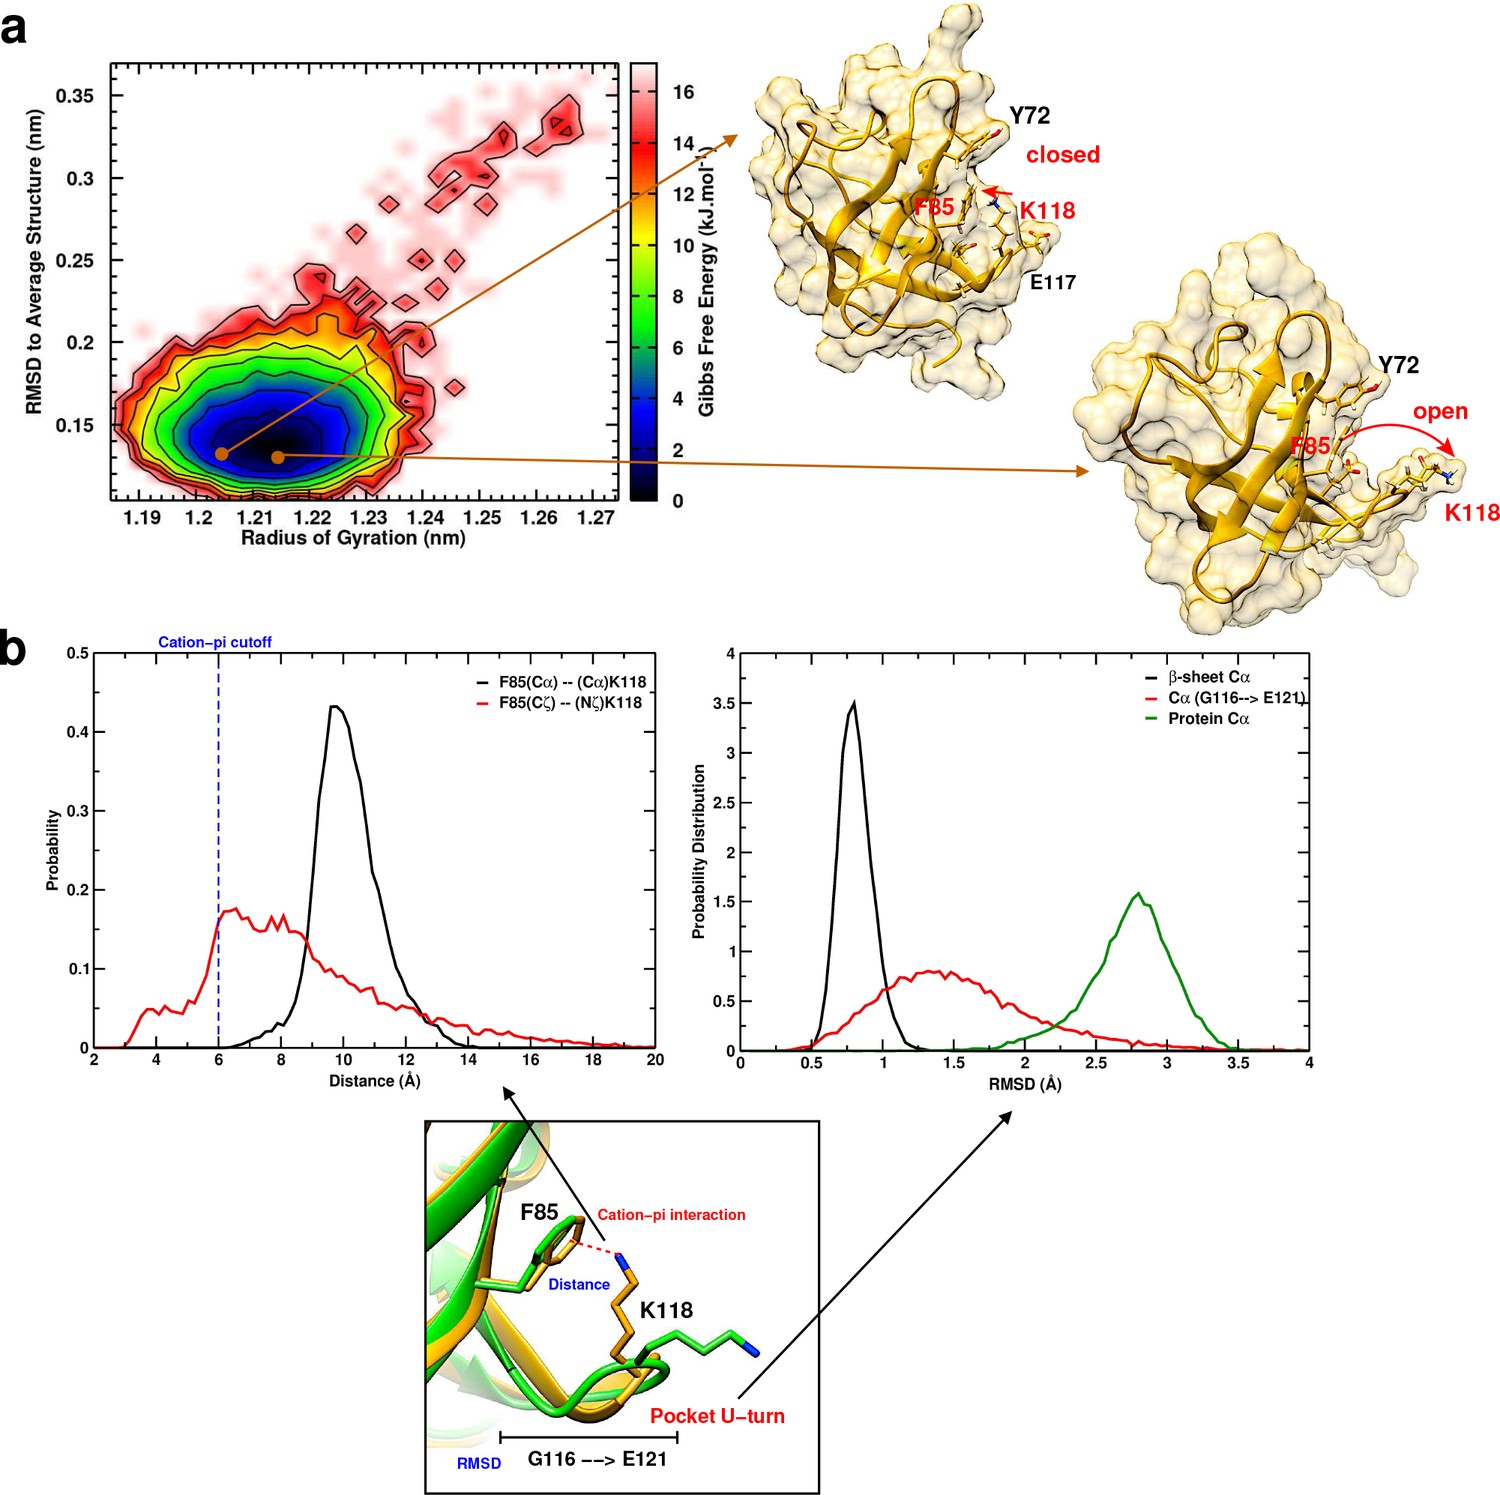
Conformational study of YB-1 in its unbound/free form using MD simulations.
Conformational study of YB-1 in its unbound/free form using MD simulations. (a) Free energy landscape (FEL) of unbound YB-1 computed from 200 ns of MD. FEL is represented using two structural reaction coordinates: the radius of gyration of the system and the RMSD with respect to the average structure. The zero energy is at 0 kJ.mol– 1 and corresponds to the lowest energy conformational state. Two different conformational states of the Quercetin-pocket are sampled: a closed state, where F85 and K118 side chains are interacting (upper structure), and an open state where K118 is away from F85 (bottom structure). The red arrows indicate the moving direction of K118 side chain relative to F85. (b) Probability distribution of the cation-π interaction distance (left panel) and of the pocket RMSD (right panel) extracted from the 200 ns MD simulation. Left panel: The distance was monitored between Cα of F85 and K118 (black plot) and between F85(Cγ) and K118(Nζ) (red plot). The blue dashed line indicates the distance cutoff of a cation-π interaction. Right panel: The RMSD was calculated on the Cα atoms of the protein (green), the β-sheet (black) and the U-turn (red).
Figure 1—figure supplement 2
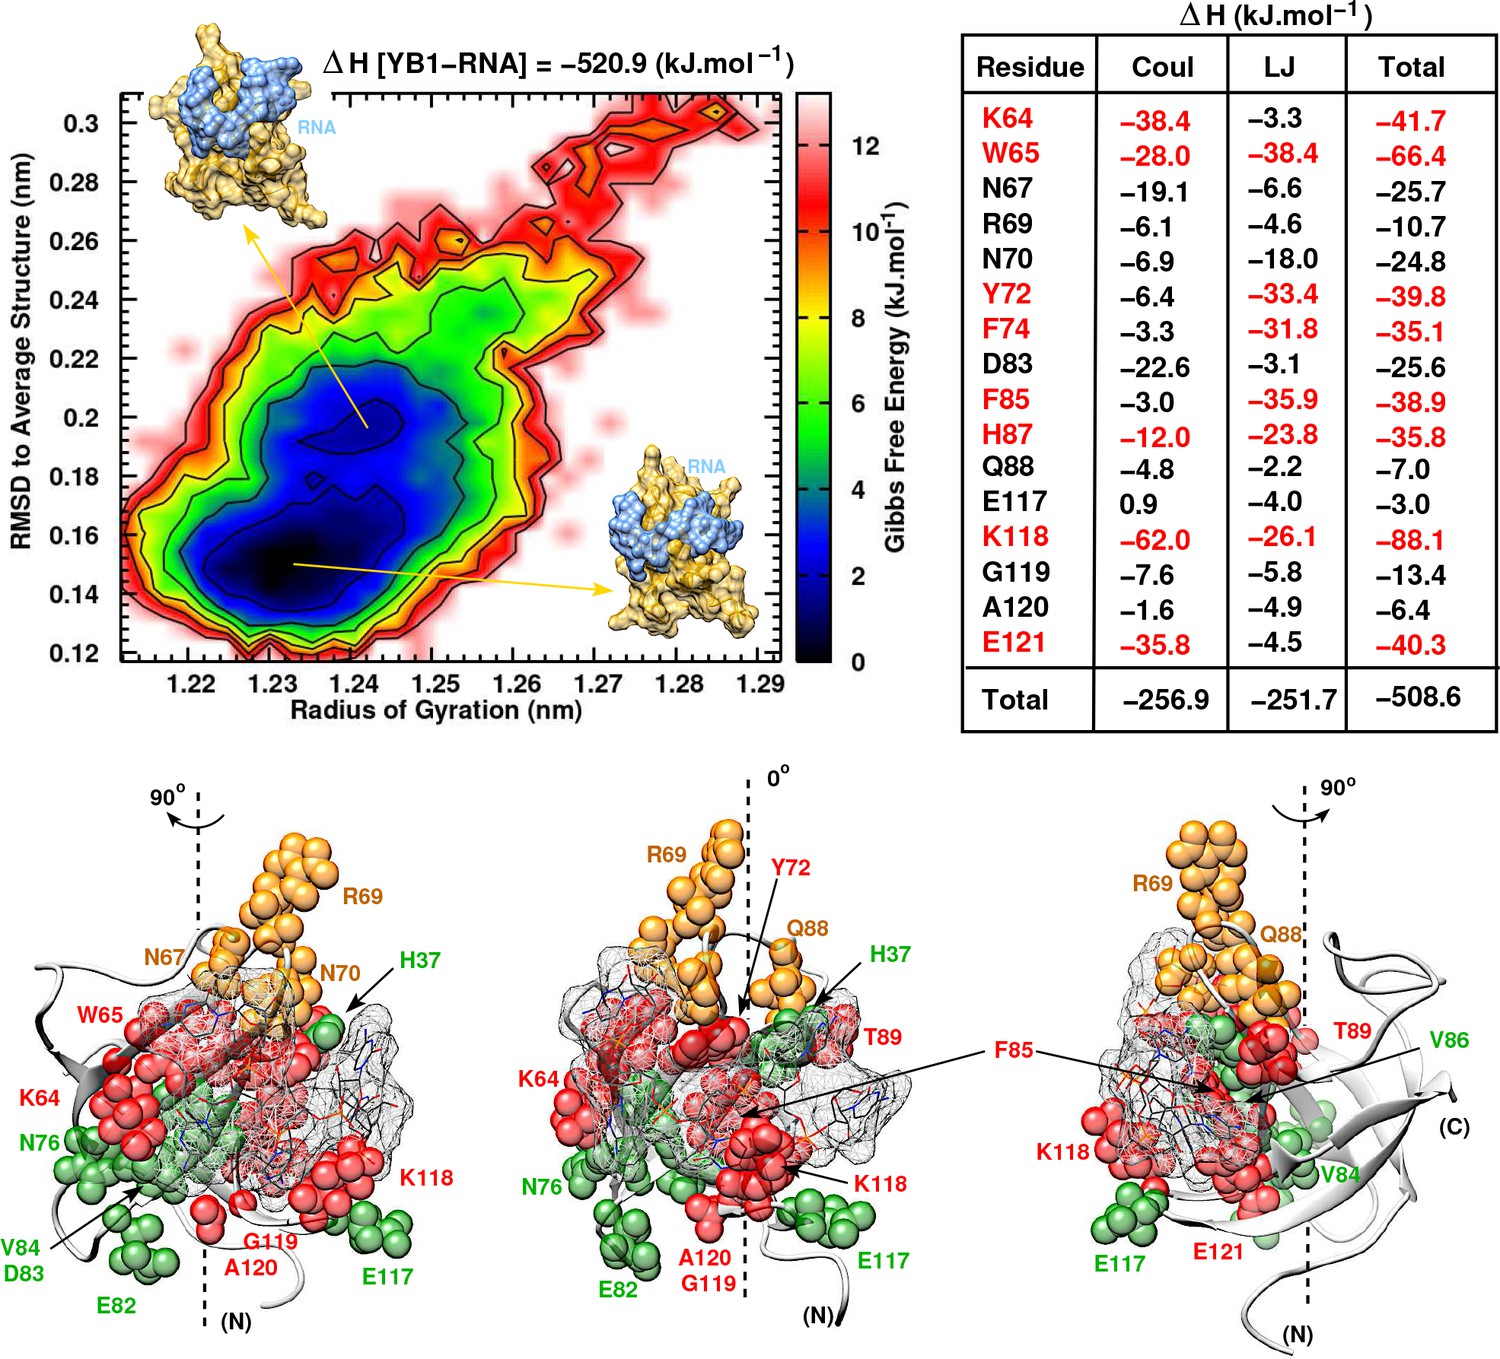
Structural and energetic study of YB-1:RNA (C5) complex using MD simulations.
Structural and energetic study of YB-1:RNA (C5) complex using MD simulations. (a) 2D Free energy landscape built from 200 ns MD simulation. The insets show two structures extracted from the two observed wells, where the conformational surface of the complex is represented (Protein in tan; RNA in light blue). The YB-1:RNA interaction energy (ΔH[YB1-RNA]) is also indicated. (b) Interaction energy contribution (ΔH) of the residues implicated in the binding, along with its Coulomb (Coul) and Lennard-Jones (LJ) contributions, averaged over 200 ns of MD simulation with variant of fluctuations being ±1.8 kJ.mol– 1. The most contributing residues are marked in red. (c) 3D representation of the zero-energy complex. The protein is represented in light grey cartoon, RNA in sticks and highlighted with a mesh surface. Residues implicated in the binding and showing significant CSPs in 2D 1H-15N-SOFAST-HMQC NMR spectrum are represented in spheres: residues with high interaction energy and/or high CSPs are in red, intermediate (green), lower (orange). (N) and (C) indicate the N-and C-terminal, respectively.
Figure 2
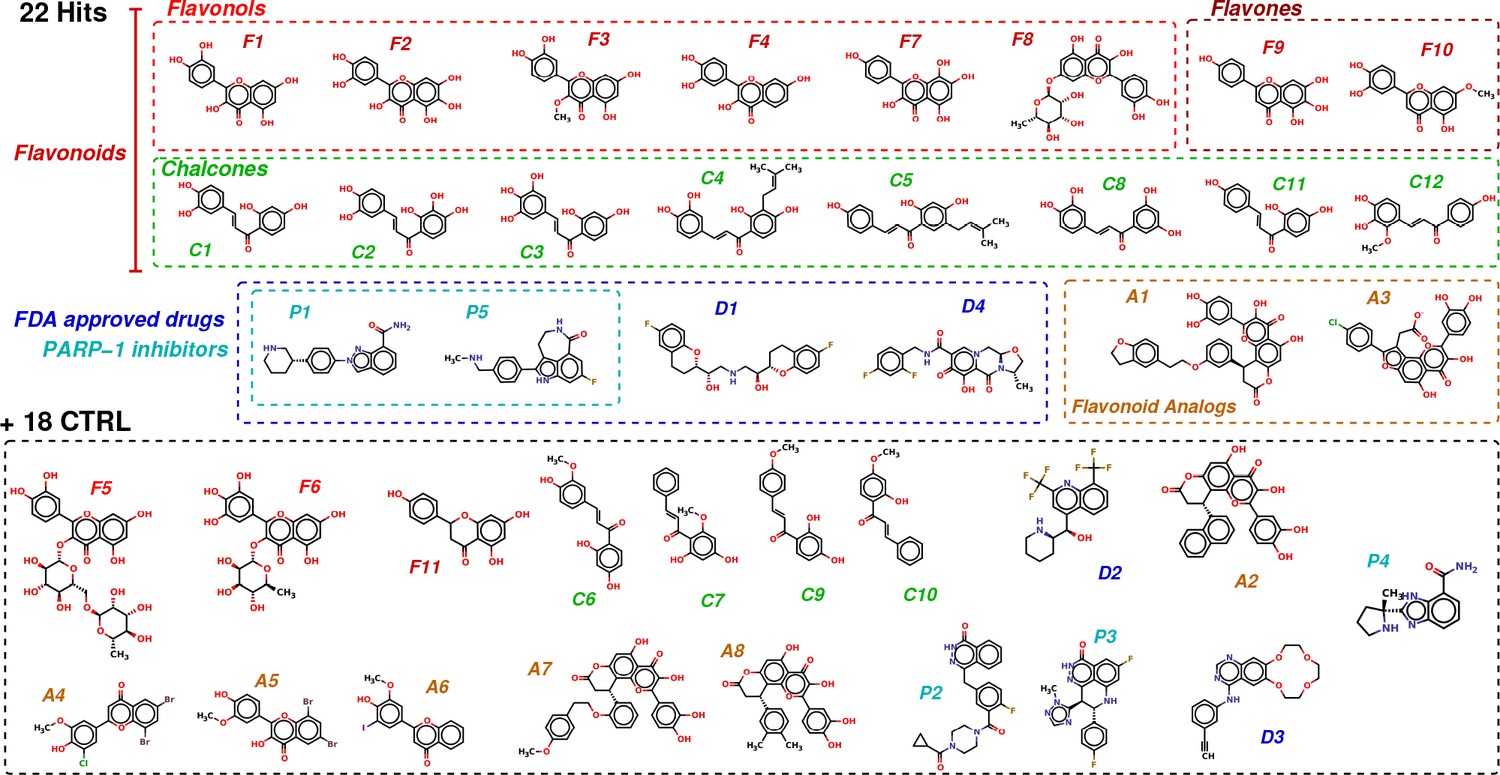
Chemical structures of the selected 40 molecules separated into 22 potential hits and 18 CTRL.
Colored dashed boxes assemble hits by subclass and the black dashed box regroups the 18 CTRL. Labels and colored boxes are color coded as function of the family classification: Flavonoids (red) are divided into Flavonols (light red), Flavones (dark red) and Chalcones (green); Flavonoid Analogs in orange, FDA-approved drugs (blue) of which PARP-1 inhibitors (cyan).
-
Figure 2—source data 1
Classification of the 40 molecules selected using the computational approach.
The scoring function and the free energy of binding from ABFE simulations used to identify potential hits are reported, along with the average pocket <CSP > from NMR and the average <mRNA enrichment slope >from MT bench assay. The structures of the molecules are illustrated in Figure 2. Confirmed hits in vitro and/or in vivo are emphasized using a bold font and a color code: red for hits confirmed in vitro and in vivo, black for in vitro only, green for in vivo only and blue for a negative control that was found potent in vivo but not in vitro. Errors on the computed range from 0.34 to 0.97 kcal.mol– 1.
- https://cdn.elifesciences.org/articles/80387/elife-80387-fig2-data1-v2.docx
Figure 3 with 4 supplements
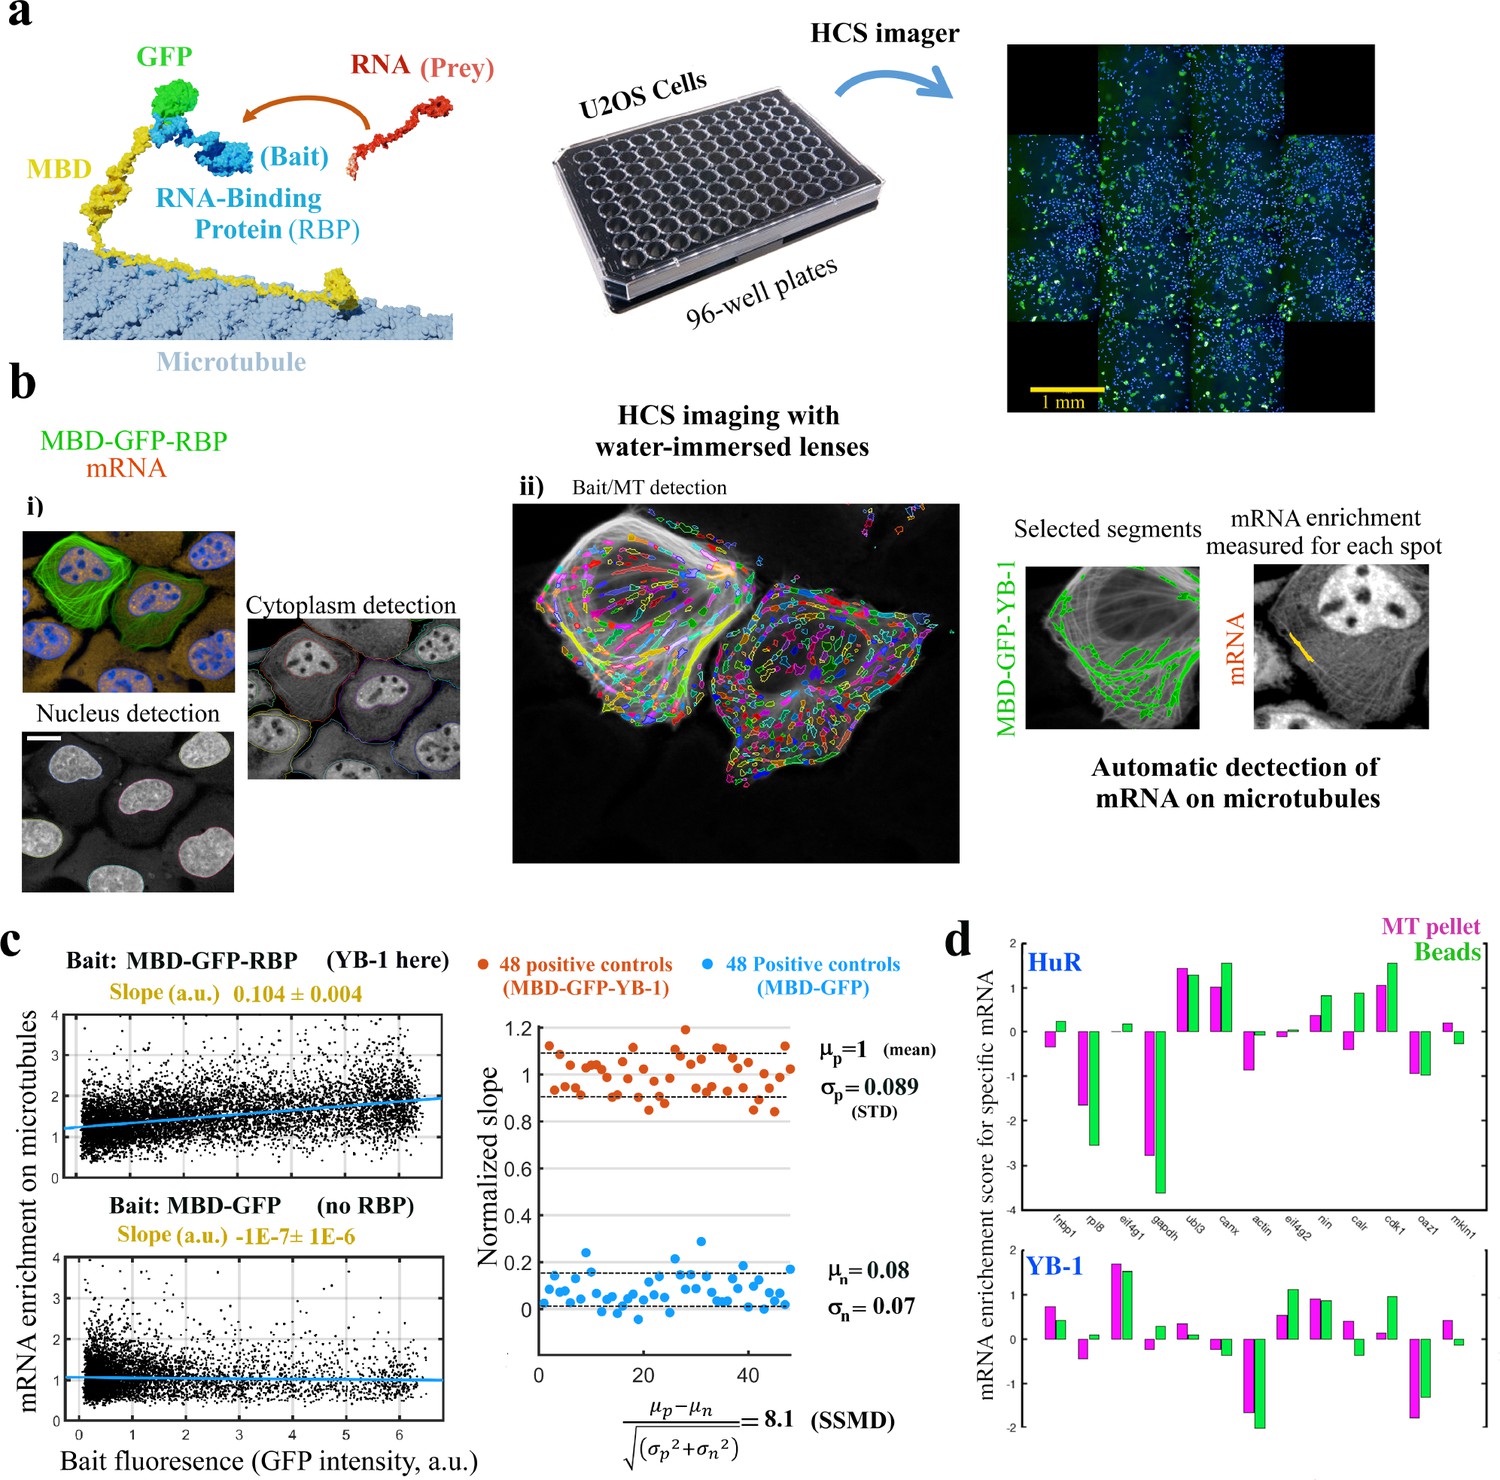
MT bench assay scores mRPIs in cells in a 96-well plate.
(a) Left panel: Schematic view of the MT bench technology. A GFP-labeled RBP fused to MBD (Microtubule-Binding domain, yellow) was brought to microtubules in U2OS cells to attract endogenous mRNAs (in red) on the microtubule network (grey). Middle panel: Image of a 96-well plates seeded with U2OS cells. Right panel: Image of a single well processed by HCS imager showing the expression of MDP-GFP-YB-1 in U2OS cells (green). (b) U2OS cells expressing MBD-GFP-YB-1 (bait in green, GFP). mRNAs in red (in situ hybridization, poly(dT) probe). Nuclei in blue (DAPI). The images were obtained with an HCS imager (40 x, water immersed objective operating in confocal mode). (i) DAPI and the red channel (mRNA) were used to detect automatically the nuclei and cytoplasm, respectively. (ii) Using HARMONY “find spots” procedure, elongated spots along the microtubules were detected using the green channel (the bait, RBP). Spots were selected owing to their width-to-length ratio (<0.22) and their enrichment in GFP (YB-1). Scale bar: 20 μm. (c) Left panels: The enrichment of mRNAs in single selected spots (spot/cytoplasm intensity ratio, red channel) and spot bait intensity on microtubules (green channel) show a linear relationship when YB-1 was used as bait. The slope of the regression line reflects the affinity of an RBP for mRNAs. A large number of cells can be analyzed by HCS (>500 cells well with in average 10–50 spots per cell). Slopes from linear regression were measured for each well with a 95% confidence interval. Right panel: SSMD value estimated by measuring the normalized slopes in 48 negative controls (MBD-GFP used as bait) and 48 positive controls (YB-1 was used as bait). The SSMD value is 8.1 for a 96-well plate. Spot data from all wells are shown in Figure 3—figure supplement 2.3a. (d) Bar diagram representing the enrichments of 13 different mRNAs measured by RT-PCR after two different purification procedures, co-sedimentation (MT pellet) and immunoprecipitation (Beads), and for 2 different RBPs, YB-1 and HuR; the purification procedures are illustrated in Figure 3—figure supplement 2.3, data and correlation analysis are provided in Appendix 5—table 5 for 3 RBPs (YB-1, HuR, and FUS). (continued).
Figure 3—figure supplement 1
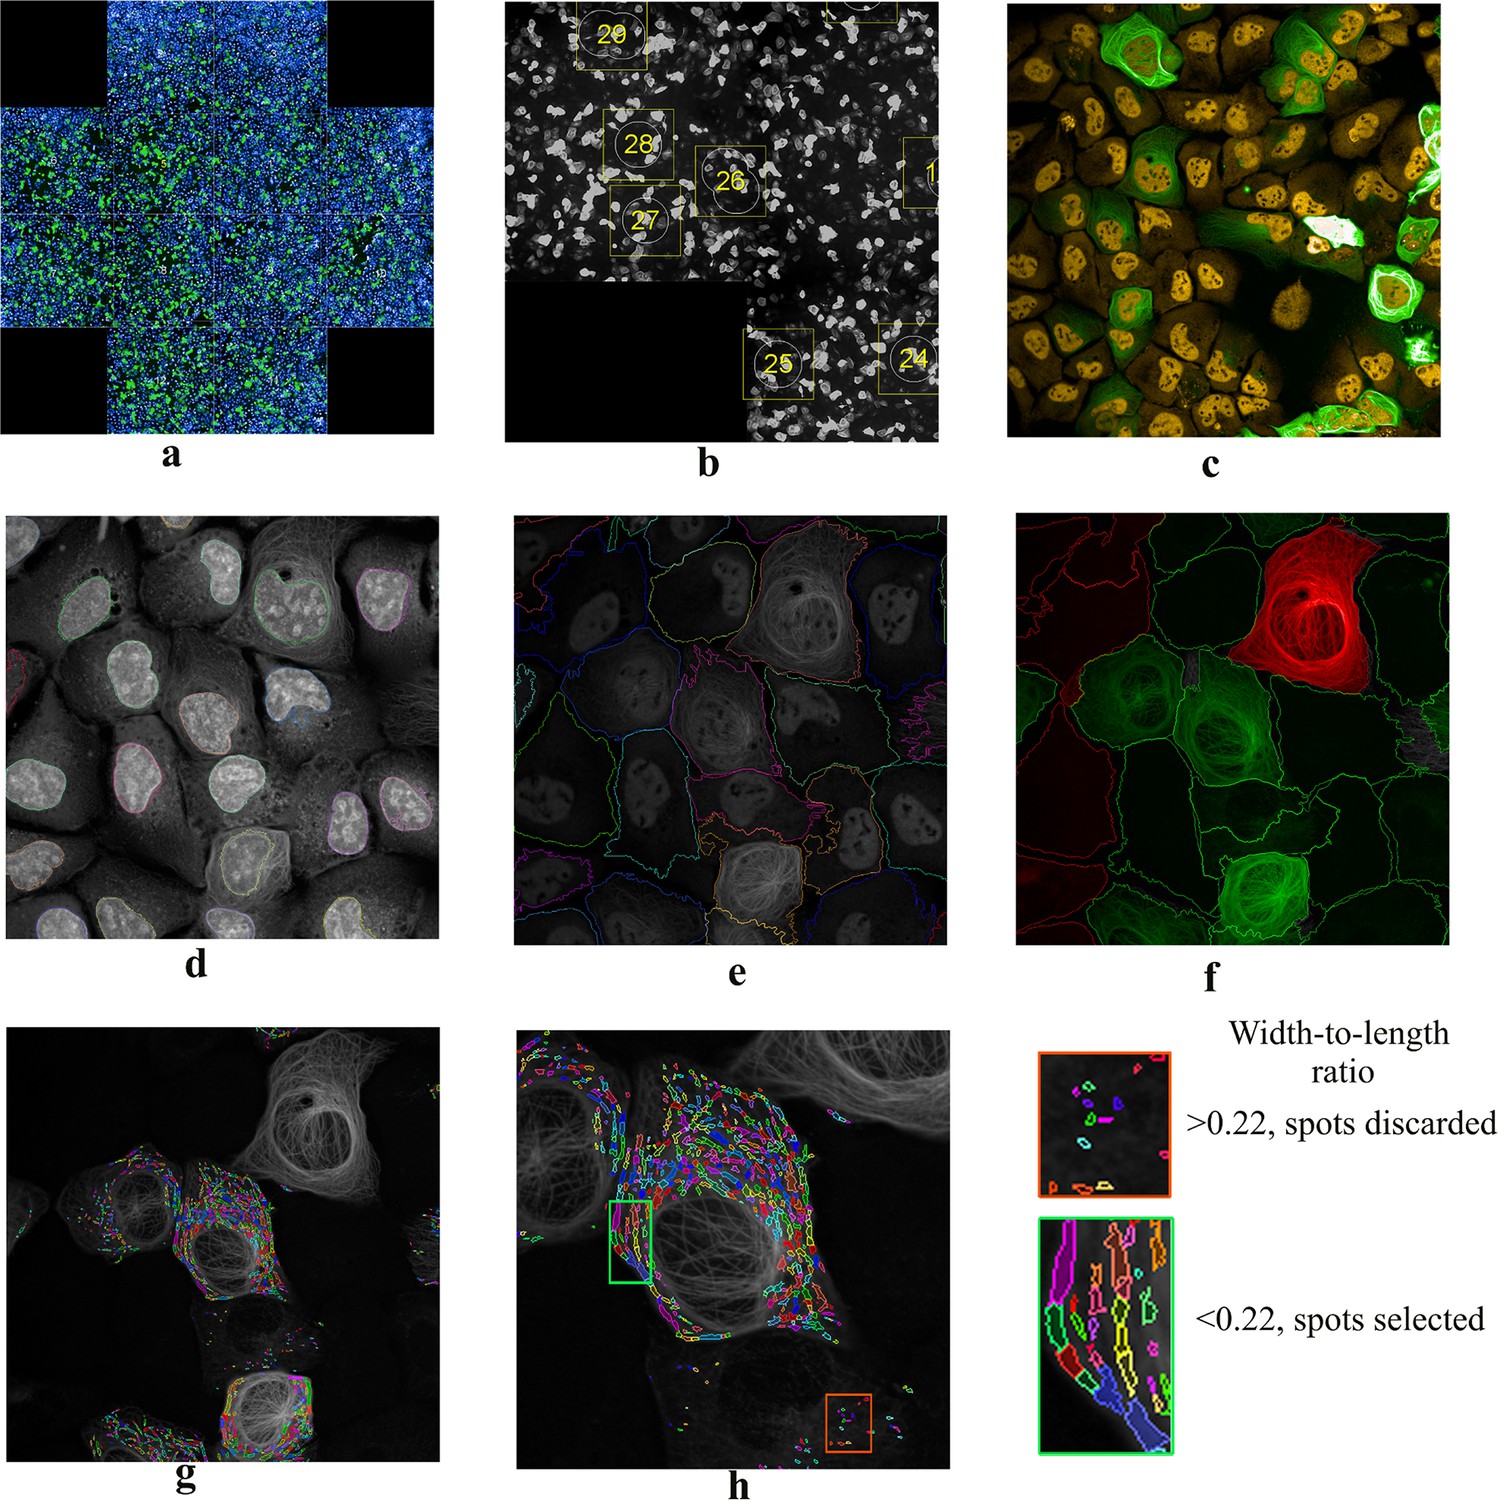
Image analysis process to quantify mRPIs in cells.
Image analysis process to quantify mRPIs in cells. (a) Image of a single well in a 96-well plate showing the expression of MDP-GFP-YB-1 (geen) in U2OS cells at low magnification (juxtaposed images obtained with a 10 x objective). (b) Automatic selection of smaller areas displaying several MBP-GFP-expressing cells with the HARMONY software. (c) High-resolution image of one of the selected areas (green, MBP-GFP-RBP; red, mRNA (poly(dT) probe); blue, DAPI). Images obtained with a 10 x water-immersed objective. (d) Automatic detection of nuclei using HARMONY and the DAPI signal. (e) For each nucleus, the cytoplasm was delineated using the mRNA signal (green). (f) Cells expressing MDP-GFP-YB-1 at low level (low signal to noise ratio) or at a too high level (saturation) were discarded (cell shown in red here). (g) The find spot analysis procedure of the HARMONY software was used for an automatic detection of a microtubule segment using the MBD-GFP-RBP signal in green. (h) To detect microtubule segments and discard putative aberrant structures (aggregates, noise, cell debris, etc.) in each spot, the width-to-length ratio was measured. Only spots with a ratio <0.22 were selected to measure the relative enrichment of mRNA versus bait expression.
Figure 3—figure supplement 2
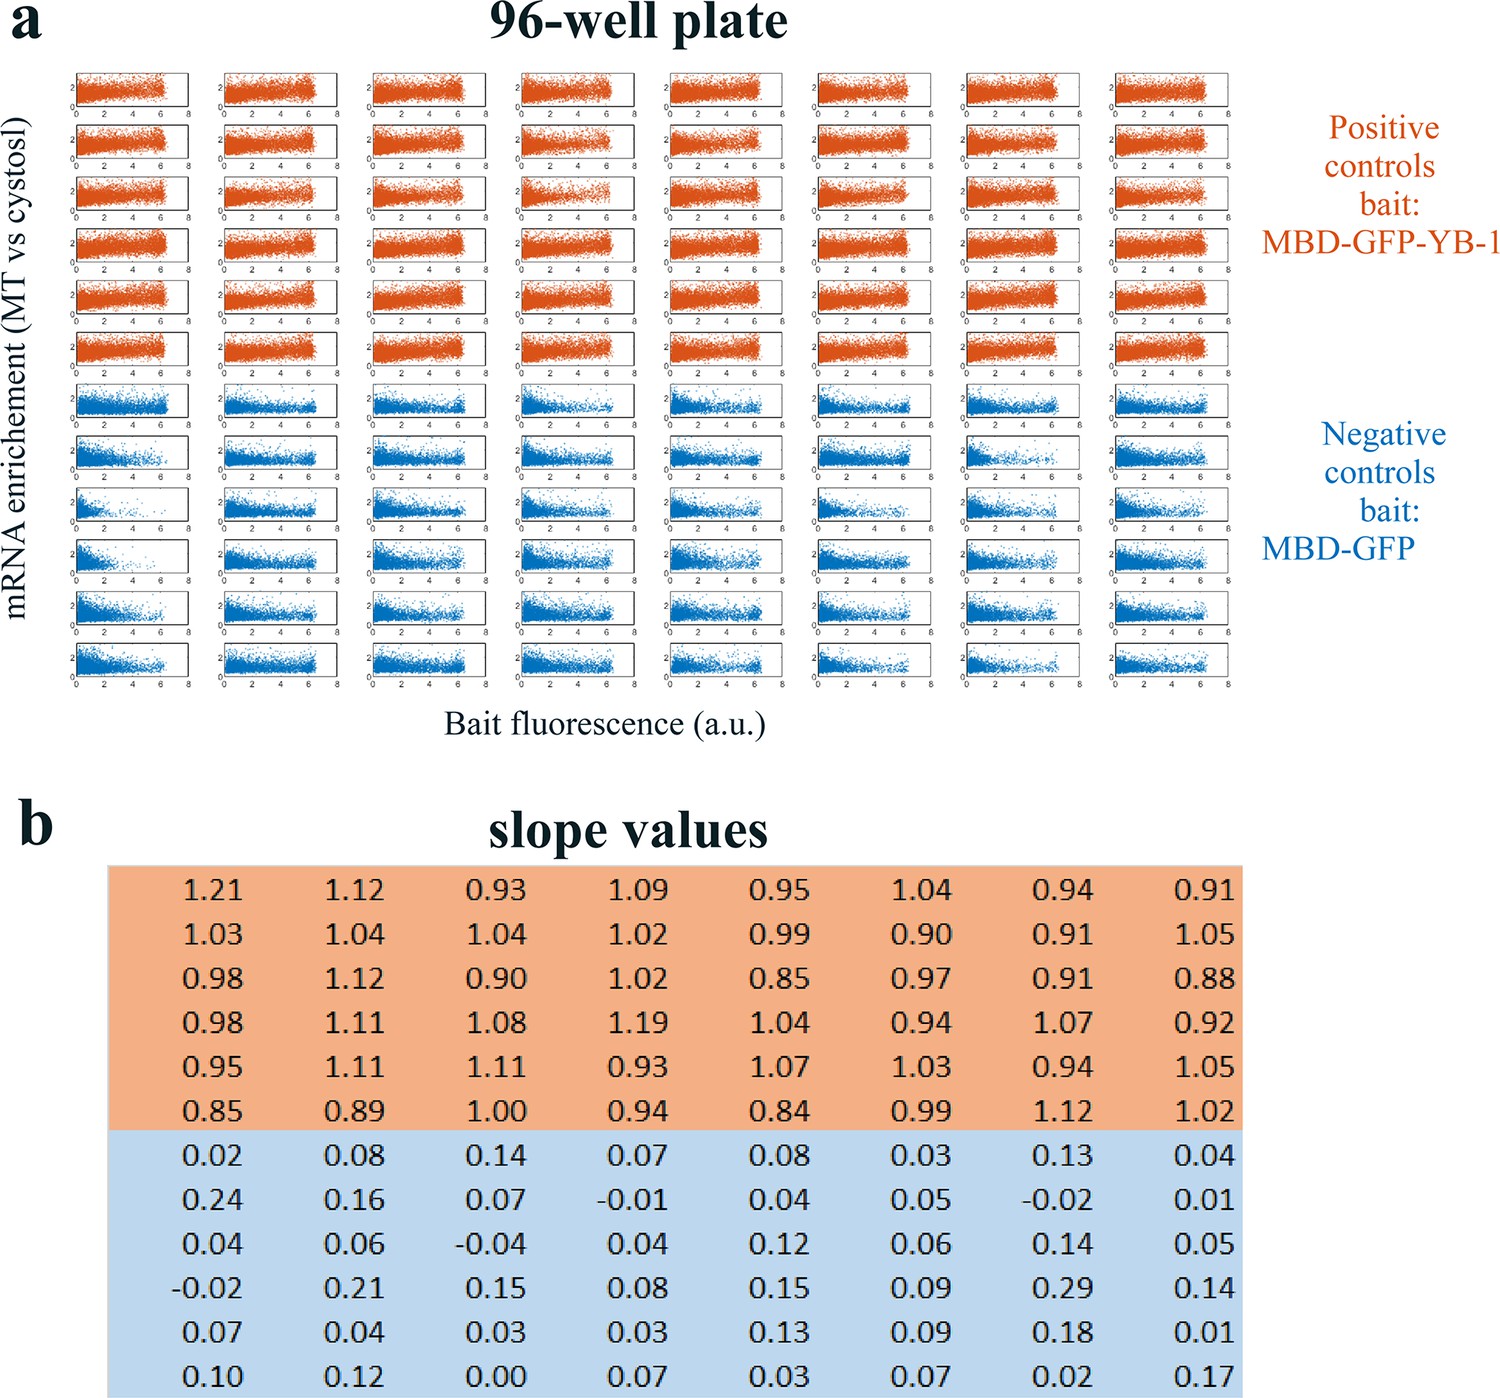
Quality assessment of the MT bench cell assay.
Quality assessment of the MT bench cell assay. (a) Correlation plots of mRNA enrichment versus GFP fluorescence in all 96 wells of a 96-well plate setting. The 48 positive (orange) and negative (blue) controls correspond to MBD-GFP-YB-1 and MBD-GFP, respectively. (b) Slope values well. The slope value is measured with 95% confidence bounds and found an accuracy of about ±5%. The data are homogenous for most wells.
-
Figure 3—figure supplement 2—source data 1
Slope of mRNA enrichement on MTs versus bait fluorescence in selected spots for Figure 3—figure supplement 2.3b.
- https://cdn.elifesciences.org/articles/80387/elife-80387-fig3-figsupp2-data1-v2.xlsx
Figure 3—figure supplement 3
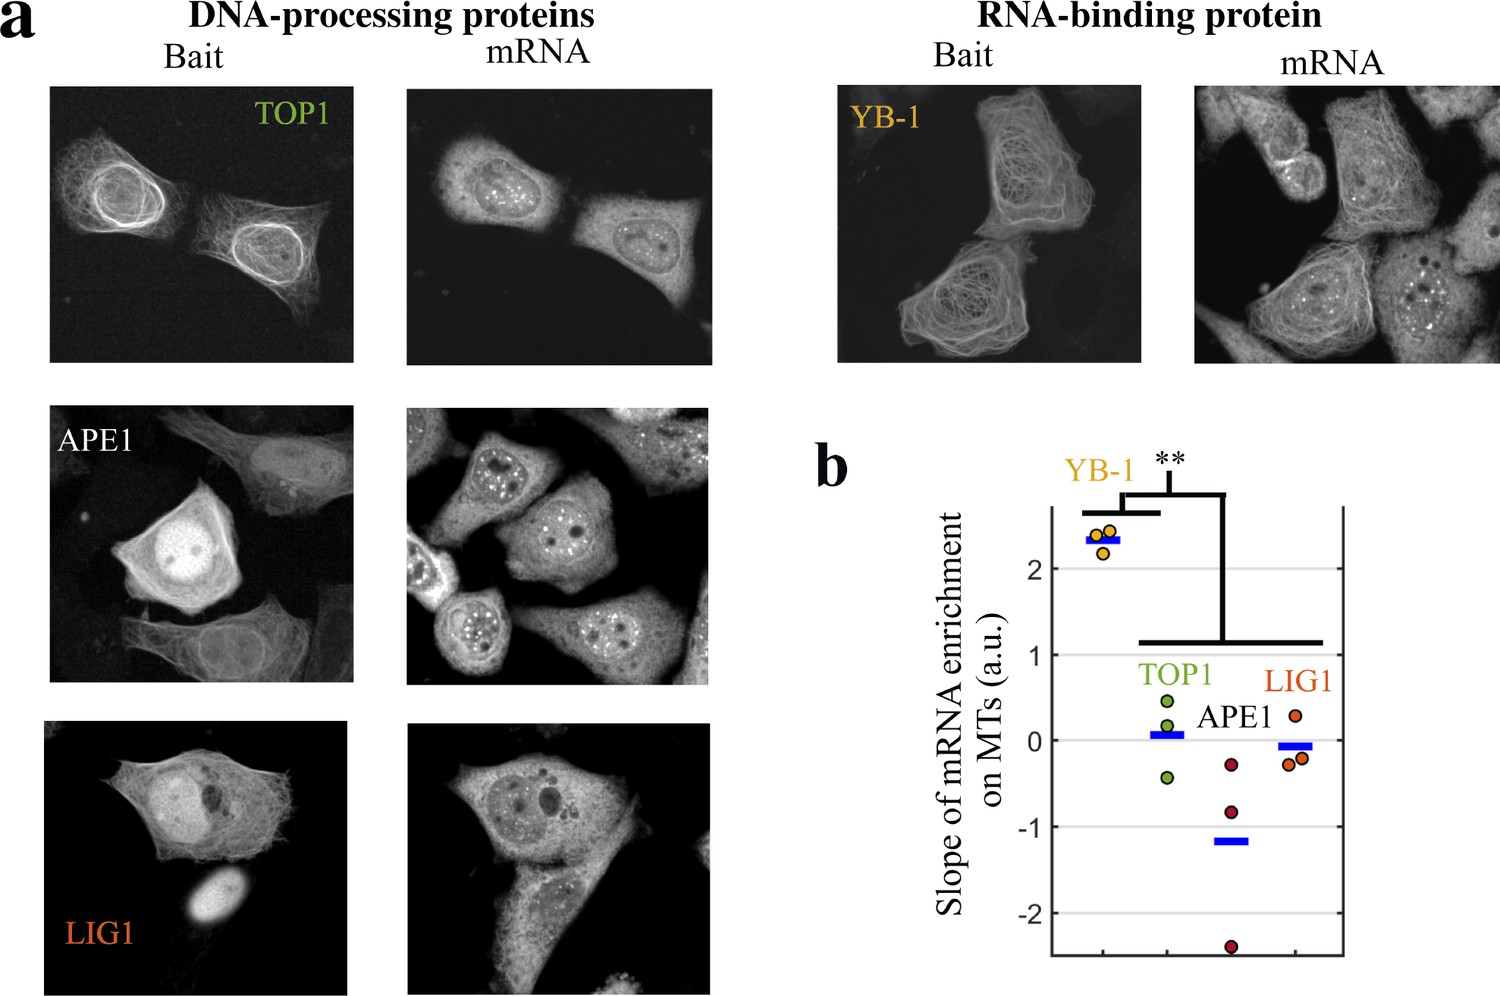
DNA-binding proteins do not bring mRNAs on MTs when used as baits.
mRNA- but not DNA-binding proteins bring mRNAs on MTs when used as baits. (a) Representative cell images after indicated treatments when DNA-binding or RNA-binding proteins were used as baits. Left: Bait’s fluorescence (GFP). Right: endogenous mRNA ( hybridization with cy3-labelled poly(T) probes). (b) Slope of the mRNA enrichment versus bait fluorescence in selected spots (see Figure 3c for details). We note that YB-1, but not DNA-binding proteins (APE1, LIG1 and TOP1), brings mRNAs on MTs. **, -test with two tails. Each dot represents a different well (n=3 samples).
Figure 3—figure supplement 4
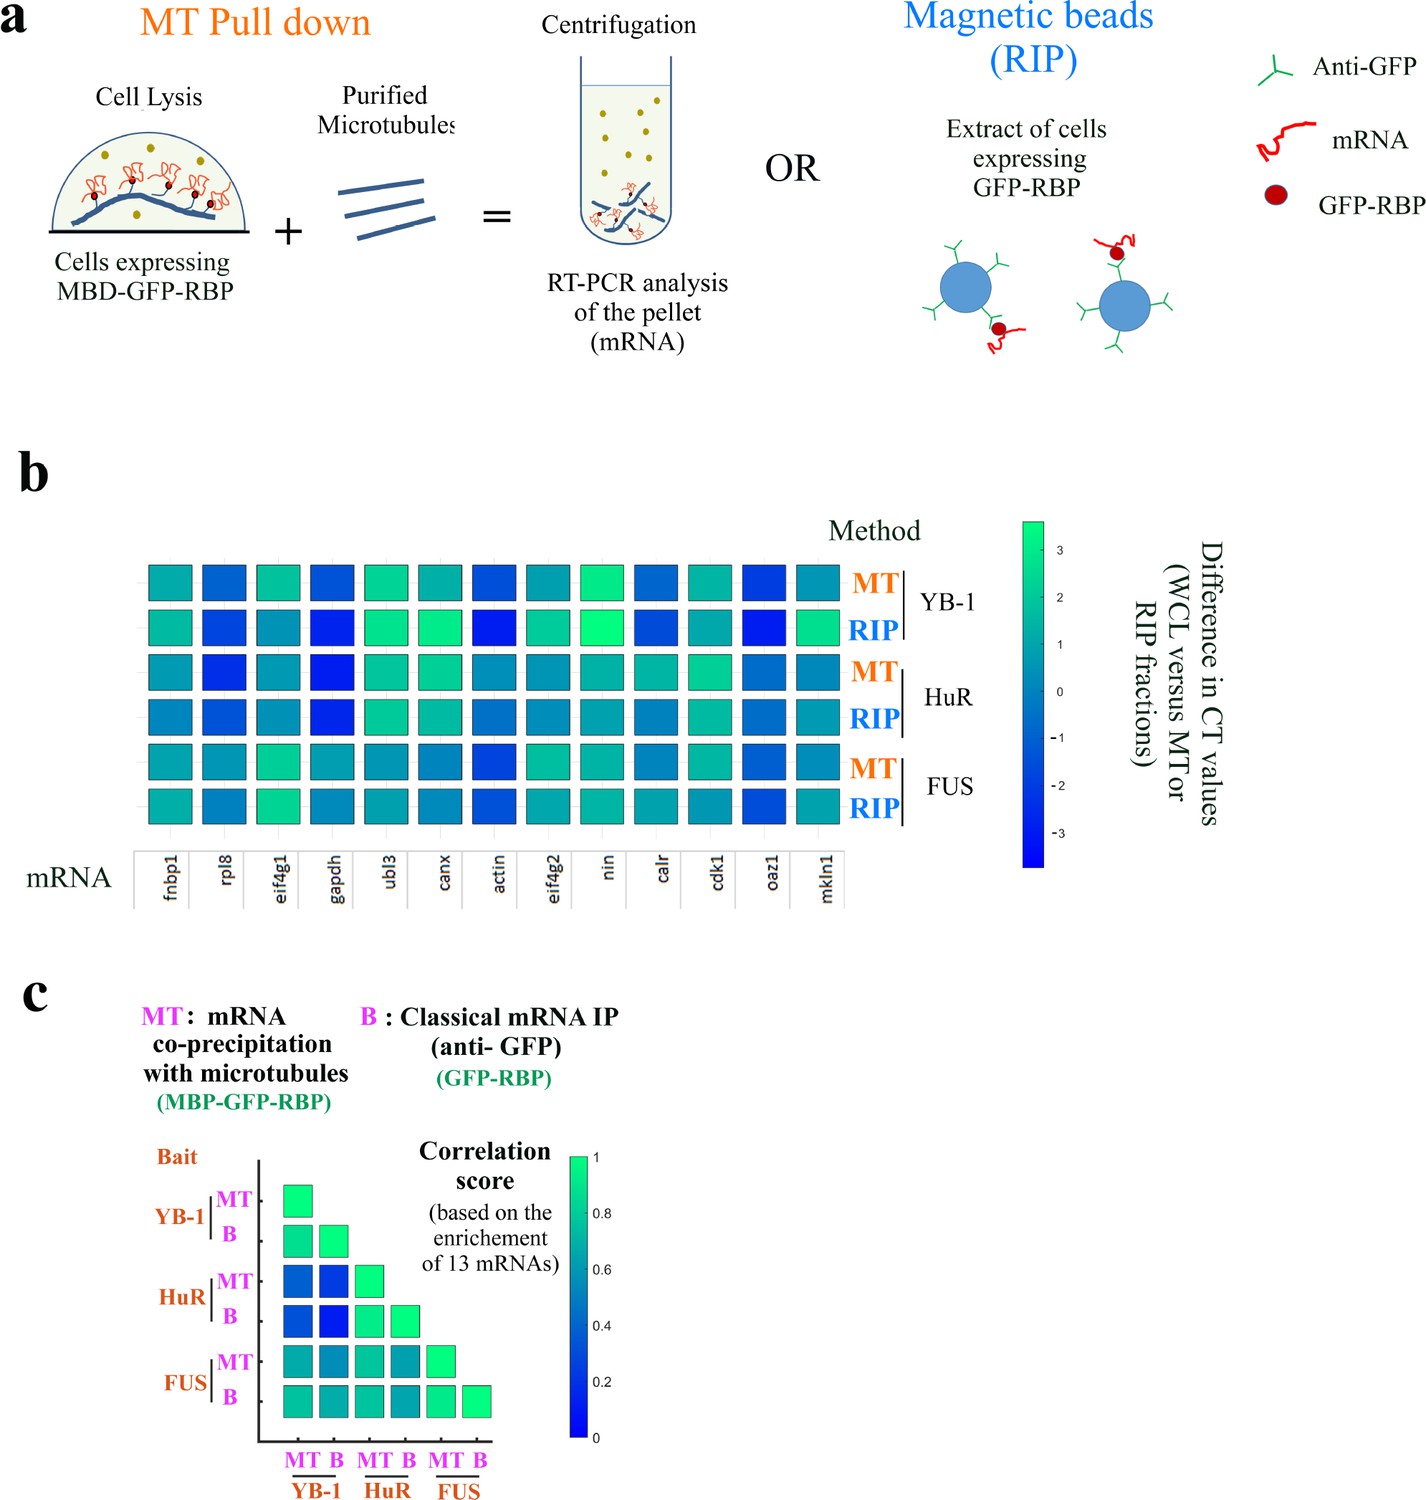
The mRNAs brought onto microtubules by MBD-GFP-RBP are RBP-specific.
The mRNAs brought onto microtubules by MBD-GFP-RBP are RBP-specific. (a) Schematic representation of the two mRNAs purification procedure. mRNAs were either purified from extracts of HEK293T cells expressing MBB-GFP-RBP by addition of sheep-brain microtubules and centrifugation or by magnetic beads with anti-GFP antibodies from extracts of HEK293T cells expressing MBB-GFP-RBP. (b) RT-PCR analysis of 13 mRNAs isolated in the microtubule pellet (MT) or via anti-GFP-coated magnetic beads (RIP) for indicated baits (YB-1, HuR, and FUS). The differences in CT (cycle threshold) values are reported in Appendix 5—table 5. MT: MT pull down. RIP: RNA-binding protein Immunoprecipitation. Scale bar: Differences in CT values recorded between the WCL (Whole cell lysate) and the RIP or MT fraction.(c) Correlation analysis of mRNA enrichments from (b).
Figure 4

Hits identified with the MT bench assay target selectively mRNA:YB-1 interactions.
(a) Normalized mRNA enrichment slope measured with MT bench in U2OS cells expressing YB-1 as bait after 4 hr exposure to the selected 40 molecules at 10 μM. The slope of the mRNA enrichment on MT versus bait expression was measured in quadruplet in two 96-well plates (20 molecules plate). Each plot represents a plate; negative controls (grey), non-significant (n.s.) putative hits (green), significant hits (magenta), DMSO control (red), GFP control (blue). Compounds were selected as significant hits (magenta) when according to a paired -test relative to DMSO controls. (b) The specificity of the molecules to YB-1 in (a) was tested against two other RBP baits, HuR and FUS. Left panel: five negative controls (blue, red) and five significant hits (magenta), from (a) were selected and ordered on the -axis according to their efficiency to affect mRNA:YB-1 interactions according to (a). Their interaction score is shown on the -axis. The blue line represents the decreasing slope with 95% confidence intervals. Middle and right panels: five negative controls and five significant hits for YB-1, from (a), tested against HuR and FUS, respectively. The same ordering of compounds in -axis from the left panel was used and a non-significant slope was measured (n.s.). No significant hit was detected for both RBPs. P1 and C8 are labeled in all three panels. (c) Images representing the expression and localization of 3 different RBPs used as bait (MBP-GFP-RBP) and a negative control (MDB-GFP) in U2OS cells. The 3 baits used here are HuR (top right panel), YB-1 (lower left panel), and FUS (lower right panel). All the RBP baits tested were successfully detected on MTs (green) and efficiently brought mRNAs onto MTs (orange).
-
Figure 4—source data 1
Normalized slope values for Figure 4b.
- https://cdn.elifesciences.org/articles/80387/elife-80387-fig4-data1-v2.xlsx
Figure 5 with 1 supplement
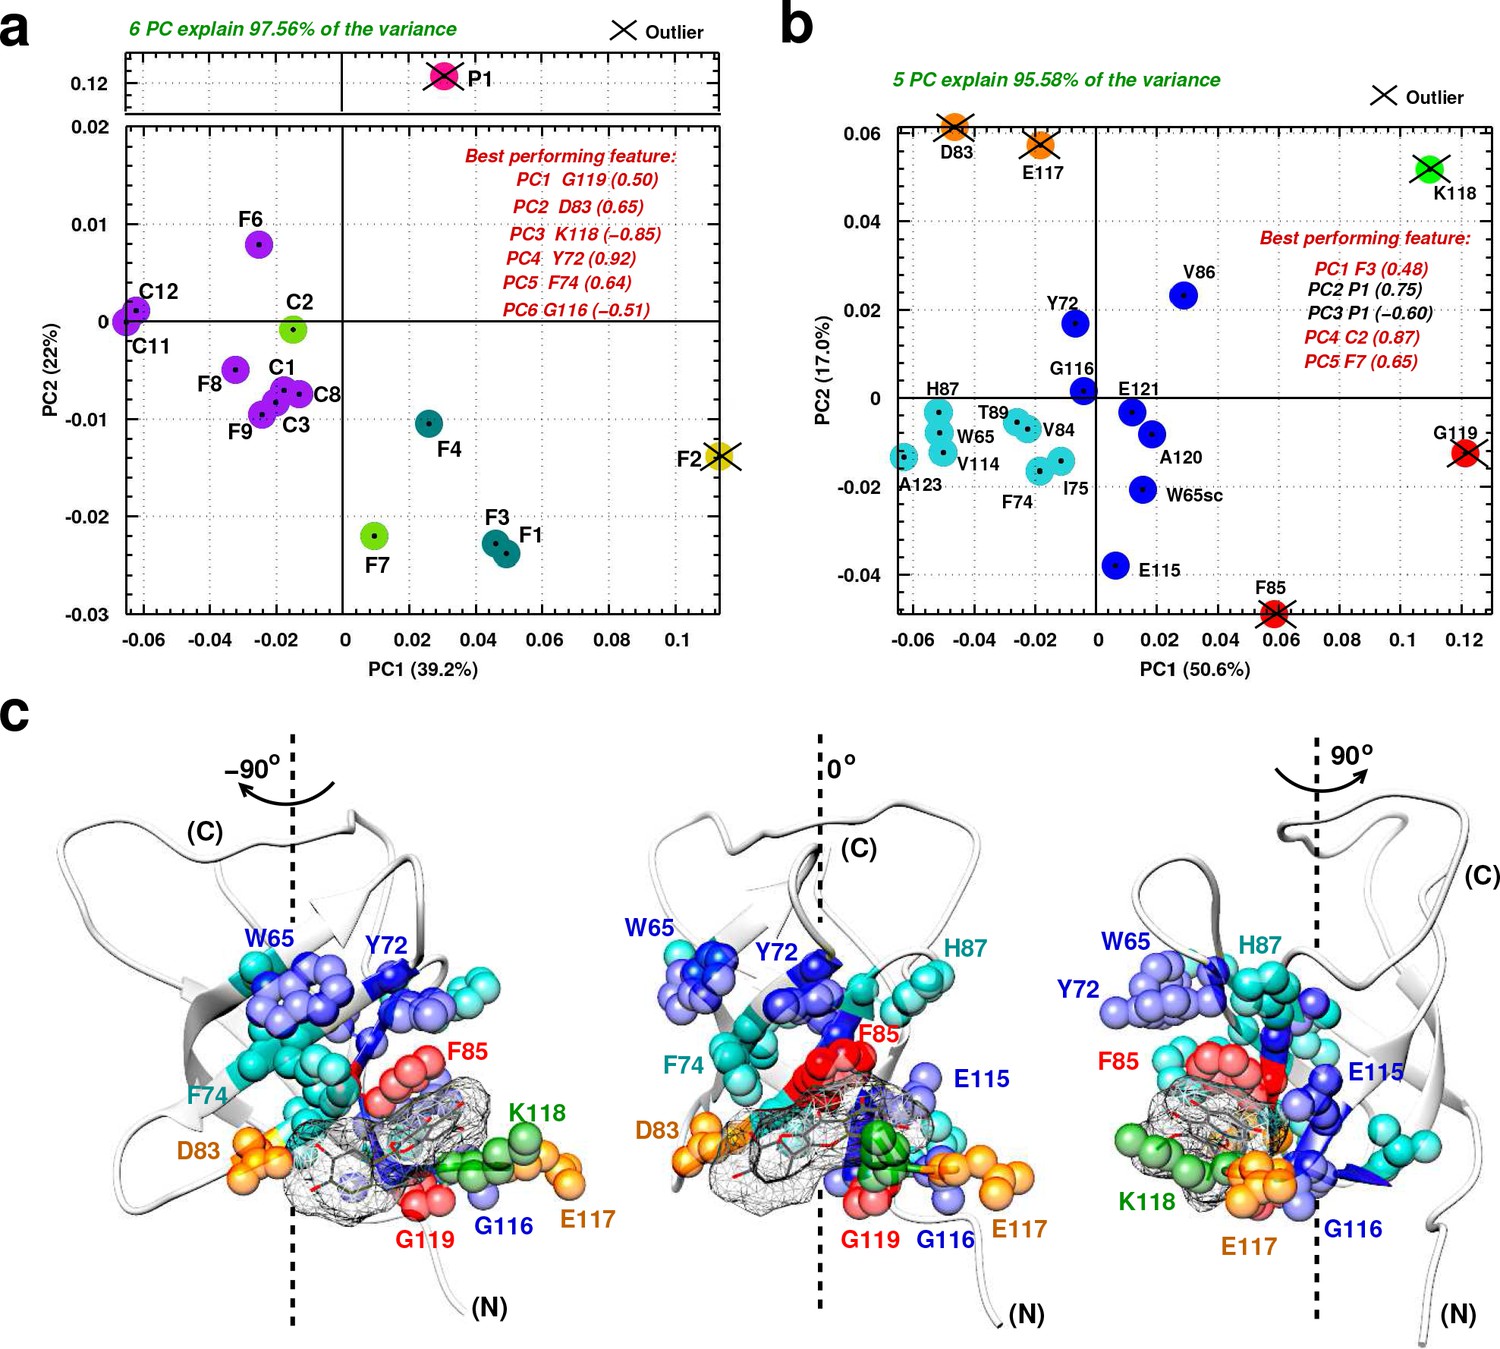
Principal component analysis of ligand-induced CSPs from 1H-15N NMR spectra of 15N-labeled YB-1.
(a, b) A 2D scatter plot of PCA results obtained on matrix , where = [15 ligands x 20 residues], and its transpose [20 residues x 15 ligands]. The scatter plot shows PCA projected vectors for different ligands (a) and residues (b) on the first and second PC dimension (PC1 and PC2). Different colors indicate five clusters found for the 6 (a) and 5 (b) PCs by cluster analysis. The best performing features by PC with absolute highest loading are also listed. Outliers based on SPE and Hoteling’s T2 tests are also indicated. (c) Projection of PCA results on the 3D structure of a YB-1:Ligand complex. The protein is represented in light grey cartoon; the ligand (here F3, taken as an example) in dark grey sticks and a mesh surface. Residues showing significant loadings from PCA are represented in spheres and colored based on the colors of the clusters formed in (b). (N) and (C) indicate the N-and C-terminal, respectively.
Figure 5—figure supplement 1
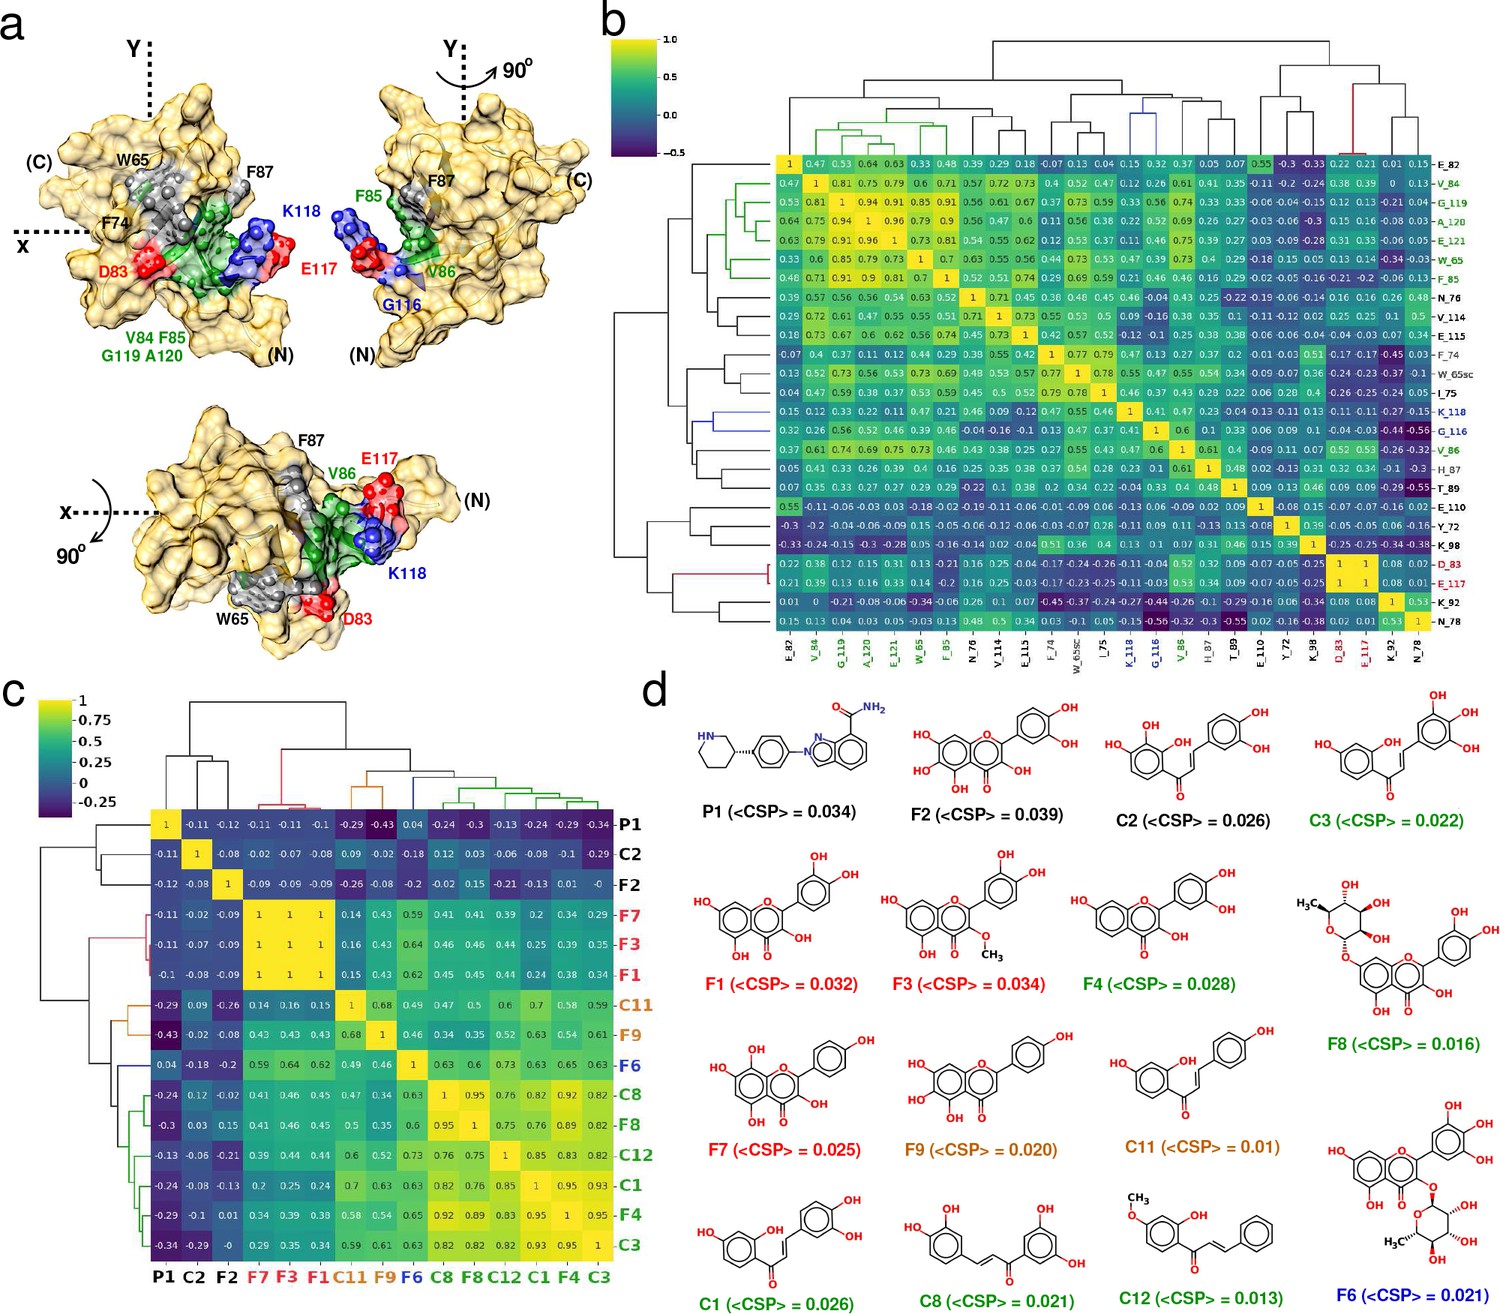
Correlation-matrix-based hierarchical clustering of NMR ligand-induced CSPs.
Correlation-matrix-based hierarchical clustering of NMR ligand-induced CSPs. (a) 3D surface representation of YB-1 structure; emphasis on the Quercetin-pocket. (N) and (C) indicate the N-and C-terminal, respectively. The color coding of the pocket residues is that of the clusters formed in (b). (b) and (c) Correlation heatmaps of matrices and , respectively, arranged according to hierarchical clustering. The dendrograms illustrate the relationship between features. Labels are color-coded by clusters. (d) Chemical structures of the 15 ligands that bind the quercetin-pocket along with the estimated average <CSP > . Colored labels are those of the clusters identified in (c).
Figure 6 with 3 supplements
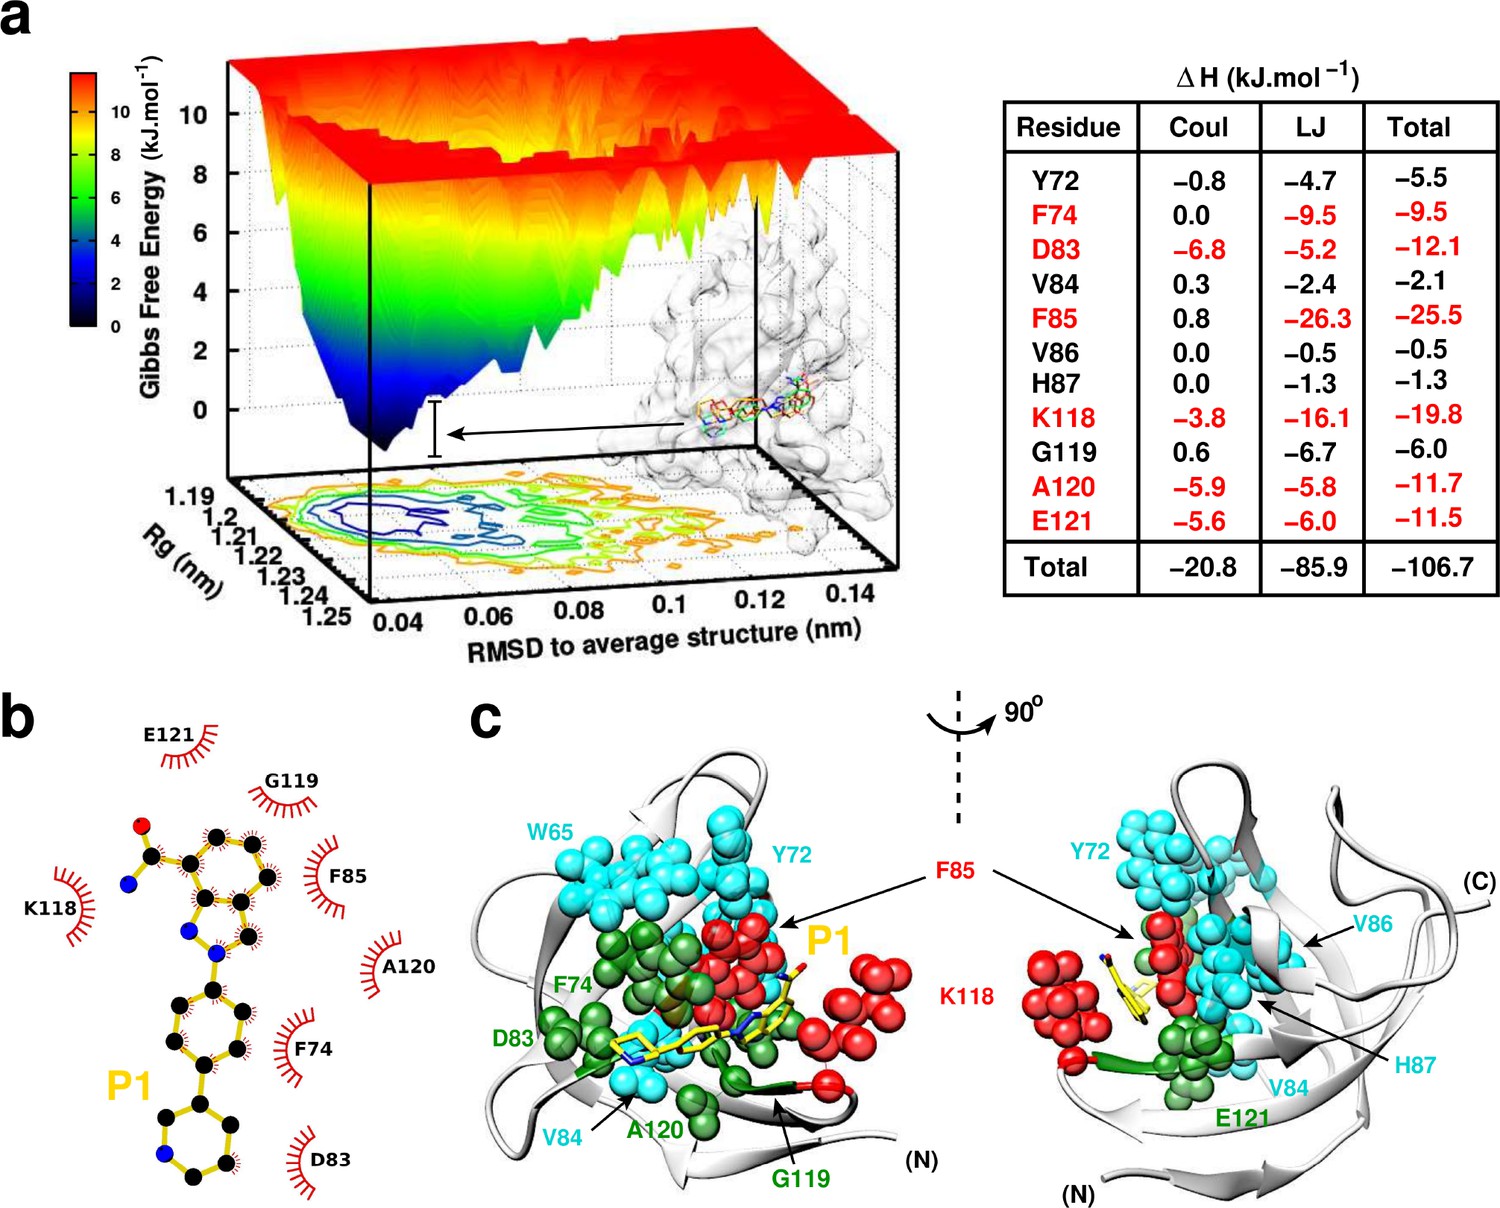
P1:YB-1 binding mode assessed by MD simulations.
(a) Left panel: Free Energy Landscape (FEL) of P1 in complex with YB-1 computed from 200 ns MD simulations. FEL is represented using two structural reaction coordinates: the radius of gyration of the system and the root mean square deviation (RMSD) with respect to the average structure. The zero energy is at 0 kJ.mol−1 and corresponds to the most stable conformational states. The free energy scale highlights energy differences (0–12 kJ.mol– 1) relative to the global minimum. Radius of gyration and RMSD values are reported in nm. The 3D representation shows ‘valleys’ of low-free energy corresponding to the metastable conformational states of the system, and ‘hills’ account for the energetic barriers connecting these states. The free energy surface is also projected as a 2D ‘contour plot’ on - and -axis. The inset shows an overlay of several conformational states sampled from two low energy wells (indicated by black arrows); the protein is shown as transparent light grey surface. Right panel: Interaction energy contribution (ΔH) of the residues implicated in the binding, along with its Coulomb (Coul) and Lennard-Jones (LJ) contributions, averaged over 200 ns of MD simulation with variant of fluctuations being ±1.6 kJ.mol– 1. The most contributing residues are marked in red. (b) 2D interaction diagram between P1 (gold) and YB-1 residues. (c) 3D representation of the zero-energy complex. The protein is represented in light grey cartoon, P1 in gold sticks. Residues implicated in the binding and showing significant CSP in NMR 2D 1H-15N-SOFAST-HMQC spectrum (Figure 7—figure supplement 1, top left panel) are represented in spheres: residues with high interaction energy and/or high CSPs are in red, intermediate (green), lower (cyan). (N) and (C) indicate the N- and C-terminal, respectively.
Figure 6—figure supplement 1
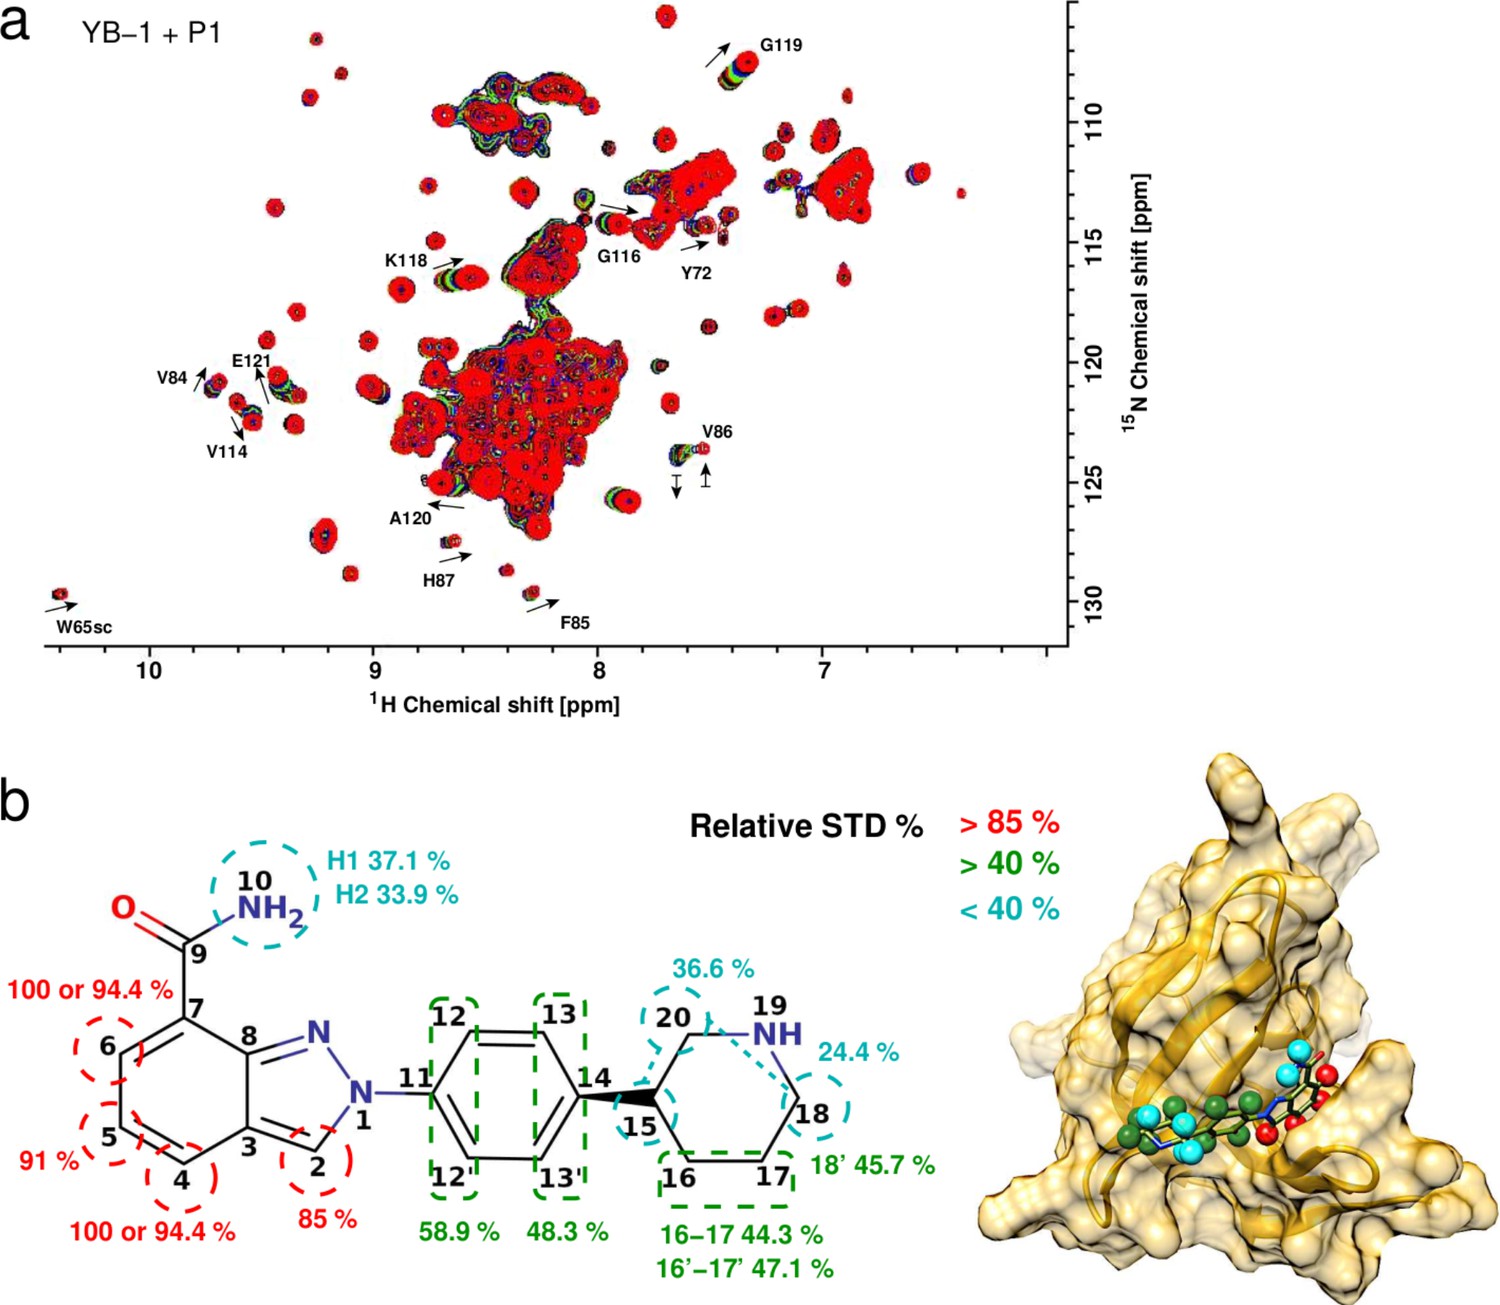
NMR investigation of P1 binding to YB-1.
NMR investigation of P1 binding to YB-1. (a) Overlays of 2D 1H-15N-SOFAST-HMQC spectrum monitoring 15N-labelled YB-1 (50 μM) being titrated with P1. Increasing [P1] corresponds to color changes from black (free protein) to red (1:20 ratio). Black arrows indicate the shift direction of the peaks during the titration process for residues in fast exchange: peaks move smoothly from free to bound. Only specific pocket residues are indicated. For residue V86, up and down arrows illustrate the slow exchange regime: the free peak decreases in intensity (down arrow) as the bound peak (up arrow) increases. (b) STD-NMR analysis of P1. The epitope mapping is highlighted on the chemical structure of P1 (left) and on the 3D representation of YB-1:P1 complex (right). Relative STD percentages are conveyed by color code: red dashes indicate the most intense signals over 85% (including the most intense STD signal 100%), green dashes over 40%, and cyan under 40% relative to the most intense STD signal. YB-1 is represented as gold cartoon and surface. P1 is depicted in olive sticks and H atoms with STD signals in spheres.
Figure 6—figure supplement 2
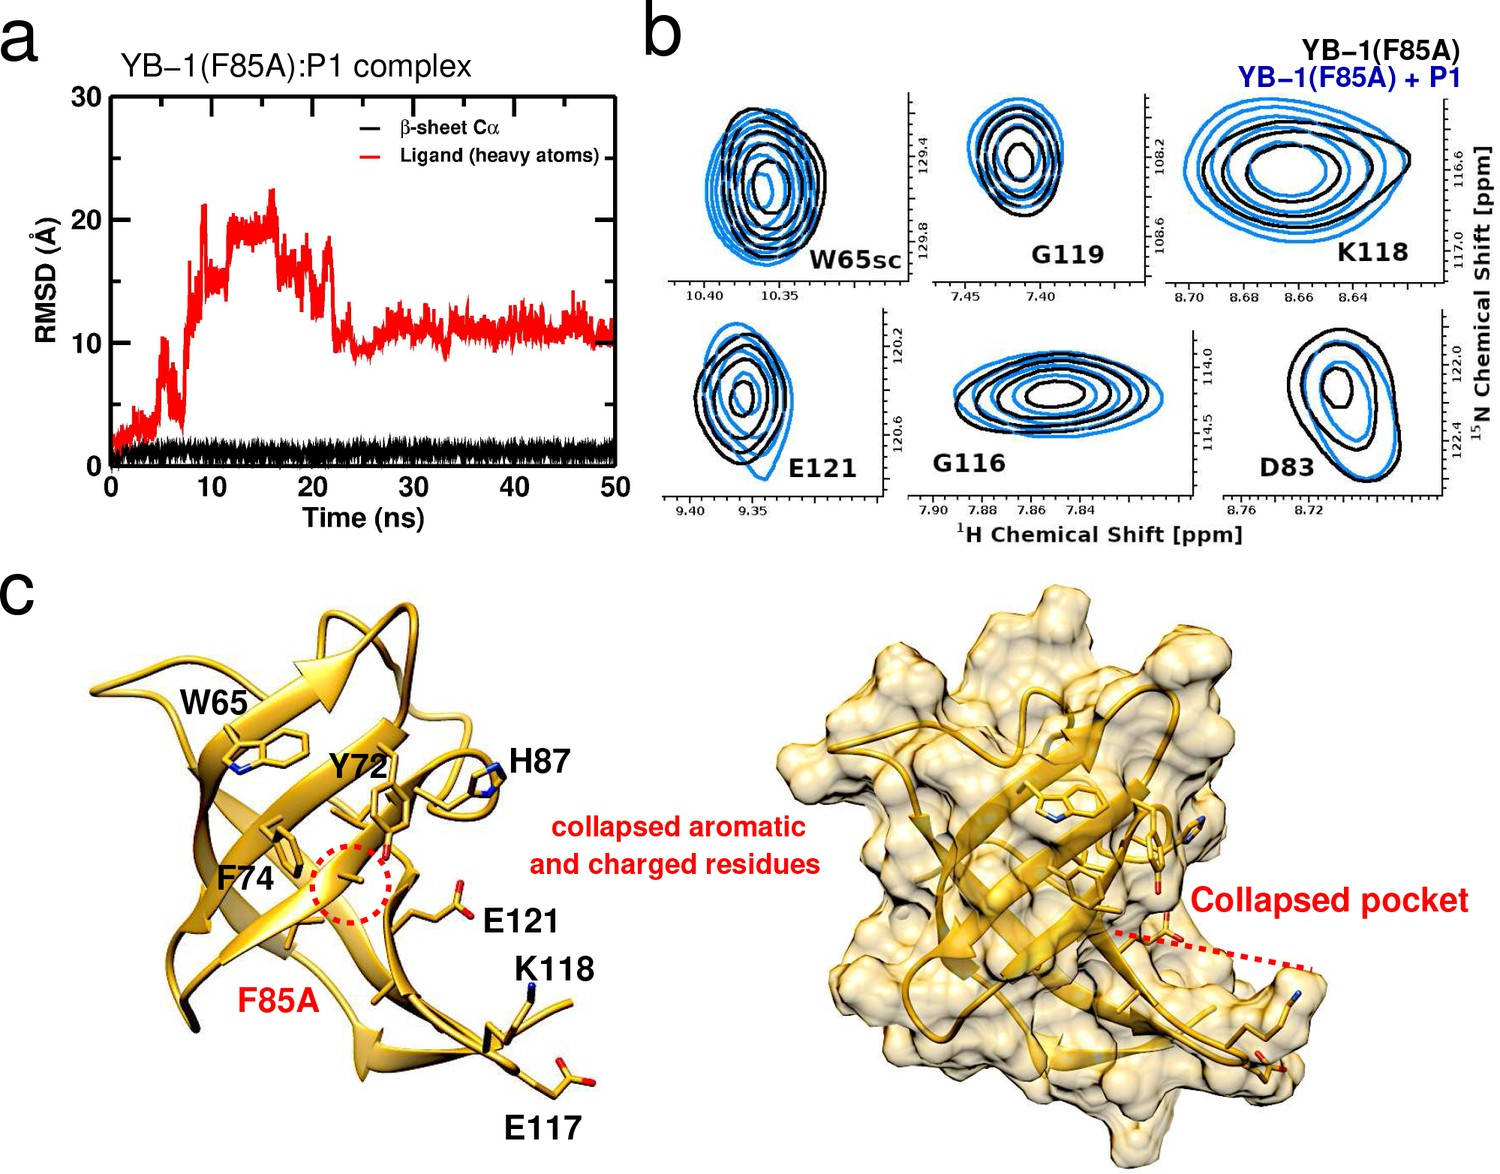
Mapping the effect of F85A mutation on P1 binding to YB-1 by MD and NMR Mapping the effect of F85A mutation on P1 binding to YB-1 by MD and NMR.
(a) Root mean square deviation (RMSD) of atomic positions measured along 50 ns of MD simulation of the YB-1(F85A):P1 complex, for the backbone of YB-1(F85A) (black) and P1 heavy atoms (red). The protein structure is stable across the simulation, while the ligand leaves the binding site after 1 ns. (b) Zoom on pocket residues from 2D 1H-15N-SOFAST-HMQC spectra of YB-1(F85A) in the absence (black) and presence (blue) of P1. (c) YB-1(F85A) structural analysis by MD simulations. 3D structure extracted from the simulation shows, compared to WT (Figure 1—figure supplement 1), a different side chain structural rearrangement of aromatic and polar residue following F85A mutation. The residues in question are labeled and the F85A mutation is indicated by a dashed red circle. The surface representation on the right hand-side emphasizes the collapsing pocket (indicated by a red dashed line).
Figure 6—figure supplement 3
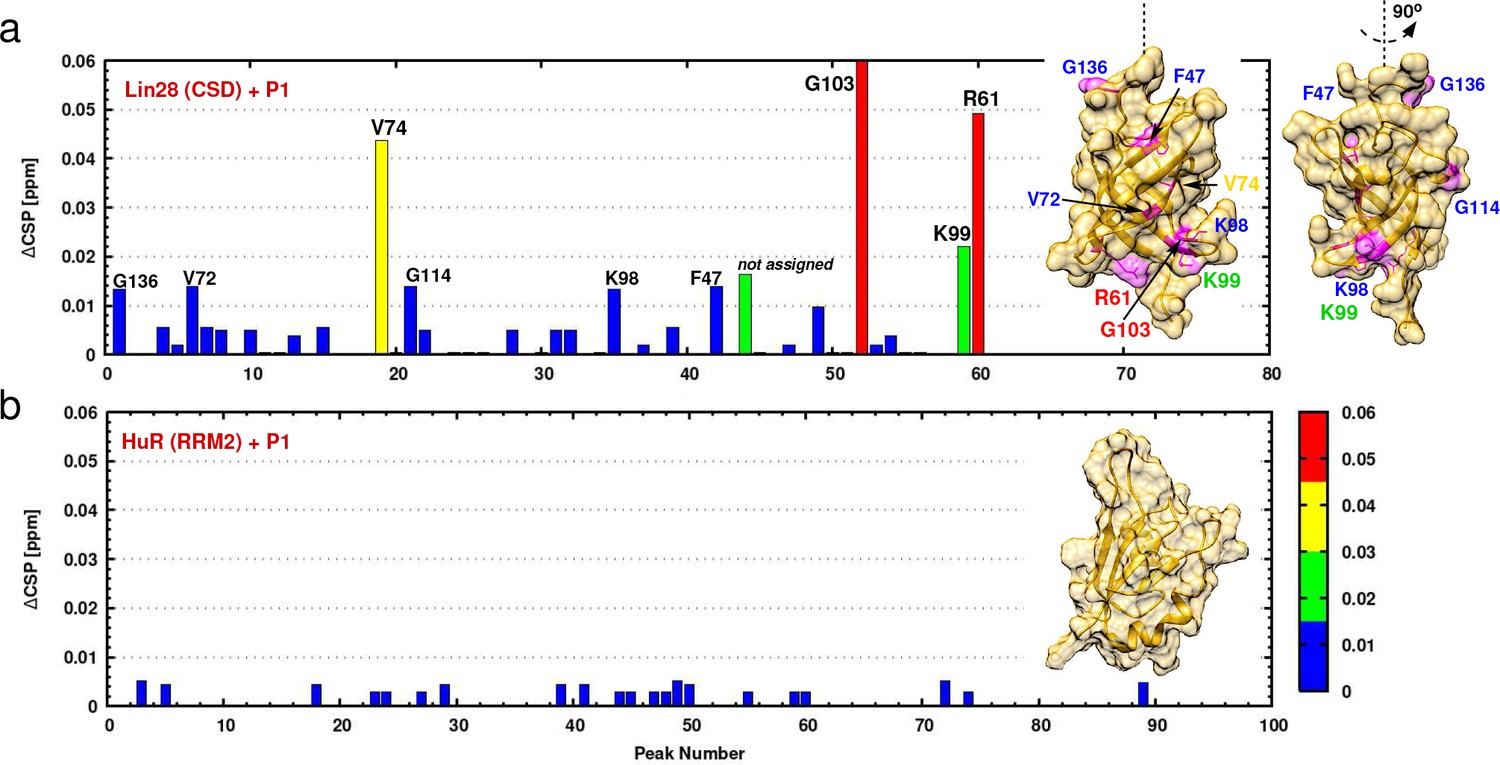
NMR investigation of P1 binding to LIN28(CSD) and HuR(RRM2).
Normalized chemical shift changes of the 1H-15N NMR spectra of 15N-labeled CSD of LIN28 (a) and 15N-labeled RRM2 of HuR (b) in the presence of P1. The color code of ΔCSP for both panels is indicated on the right-hand side of panel (b). Peak numbers are ordered with respect to their 1H ppm value. The insets show the 3D structures of each of the studied proteins. For LIN28, in panel (a), residues representing a significant CSP are highlighted in magenta and labeled with the same color code as the corresponding ΔCSPs. Only peaks showing significant ΔCSPs were assigned. LIN28(CSD) resonance assignments were taken from the data kindly provided by the laboratory of Dr. Piotr Sliz, Harvard Medical School, USA. FDA-approved P1 binds YB-1(CSD) with a Kd of 6M in silico and in vitro.
Figure 7 with 2 supplements
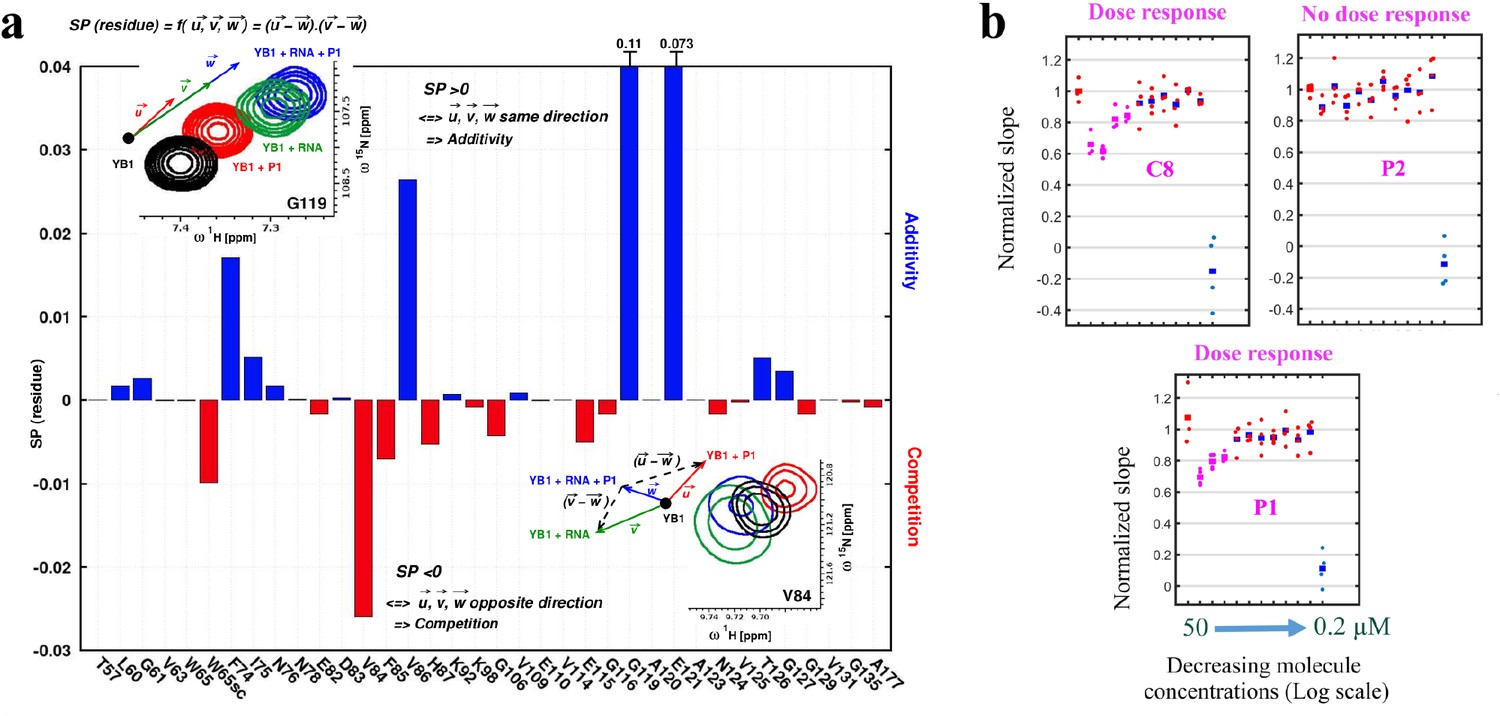
P1 interferes with RNA:YB-1 interactions in vitro and in cells.
(a) Histogram showing the competitive behavior of P1 using calculated based on CSPs extracted from 1H-15N-SOFAST-HMQC spectra of 15N-labeled YB-1 in the absence and/or presence of P1 and 5-nt long poly(C) RNA. The insets show a zoom-in on residue V84 (exhibiting competition) and G119 (exhibiting additivity) from overlaid NMR spectra of YB-1 alone (black) and in the presence of: P1 (red), RNA (green), and both P1 + RNA (blue); an illustration of the associated displacement vectors , and (same color code as NMR), relative to YB-1 alone (large black dot), and the pair vectors ( - ) and ( - ) (black dashed arrows) on which the scalar product was calculated are also indicated. (b) Dose response plots of P1, C8, and P2 in U2OS cells expressing YB-1 as bait (MT bench) following 4 hr exposure at decreasing concentrations from 50 to 0.2 μM (quadruplicate in 96-well plate).
-
Figure 7—source data 1
Normalized slope values for Figure 7b.
- https://cdn.elifesciences.org/articles/80387/elife-80387-fig7-data1-v2.xlsx
Figure 7—figure supplement 1
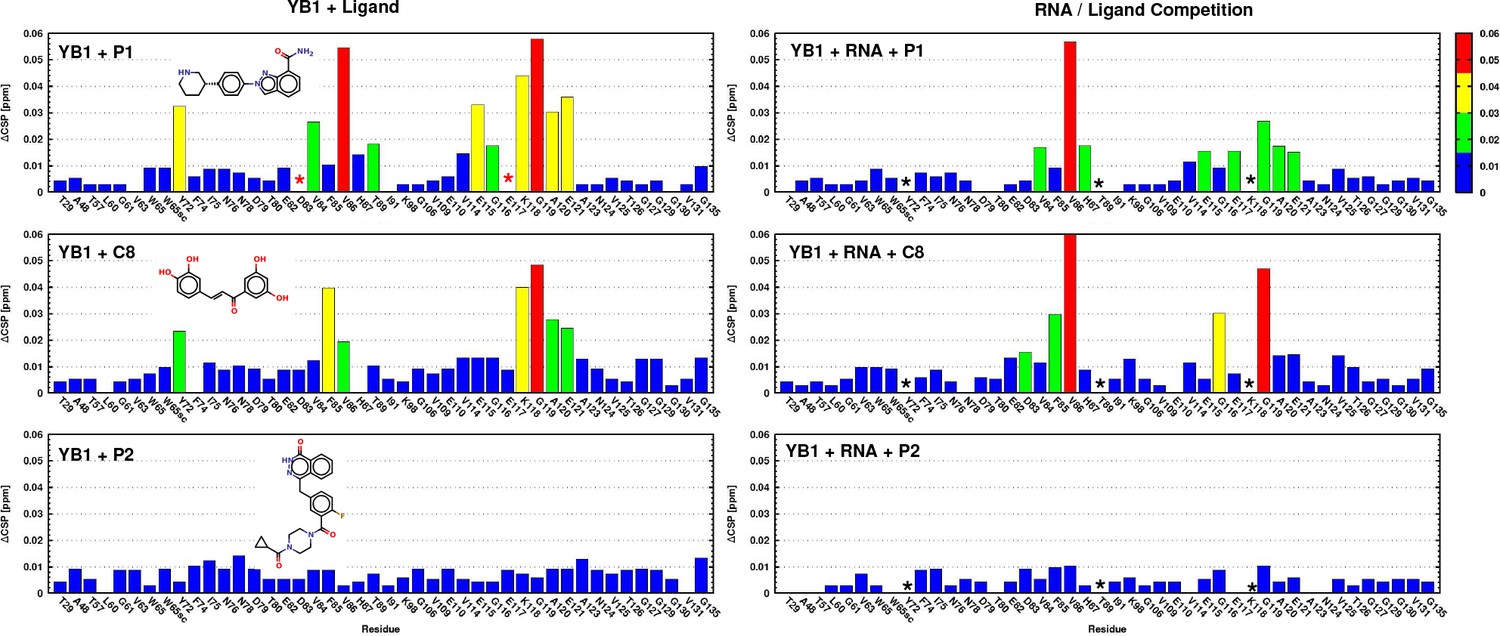
Mapping Ligand/RNA competition on binding YB-1 using NMR.
Mapping Ligand/RNA competition on binding YB-1 using NMR. Histograms show normalized chemical shift changes of the 1H-15N NMR spectra of 15N-labeled YB-1 in the absence (left panels) and in the presence of 5-nt long poly(C) RNA (right panels), while in the presence of P1 (upper panels), C8 (middle panels), and P2 (lower panels). The color code of CSP is indicated on the top right-hand side. The insets show the chemical structures of the tested molecules P1, C8, and P2. Red and black asterisks indicate disappearing residues in the presence of P1 and RNA, respectively.
Figure 7—figure supplement 2
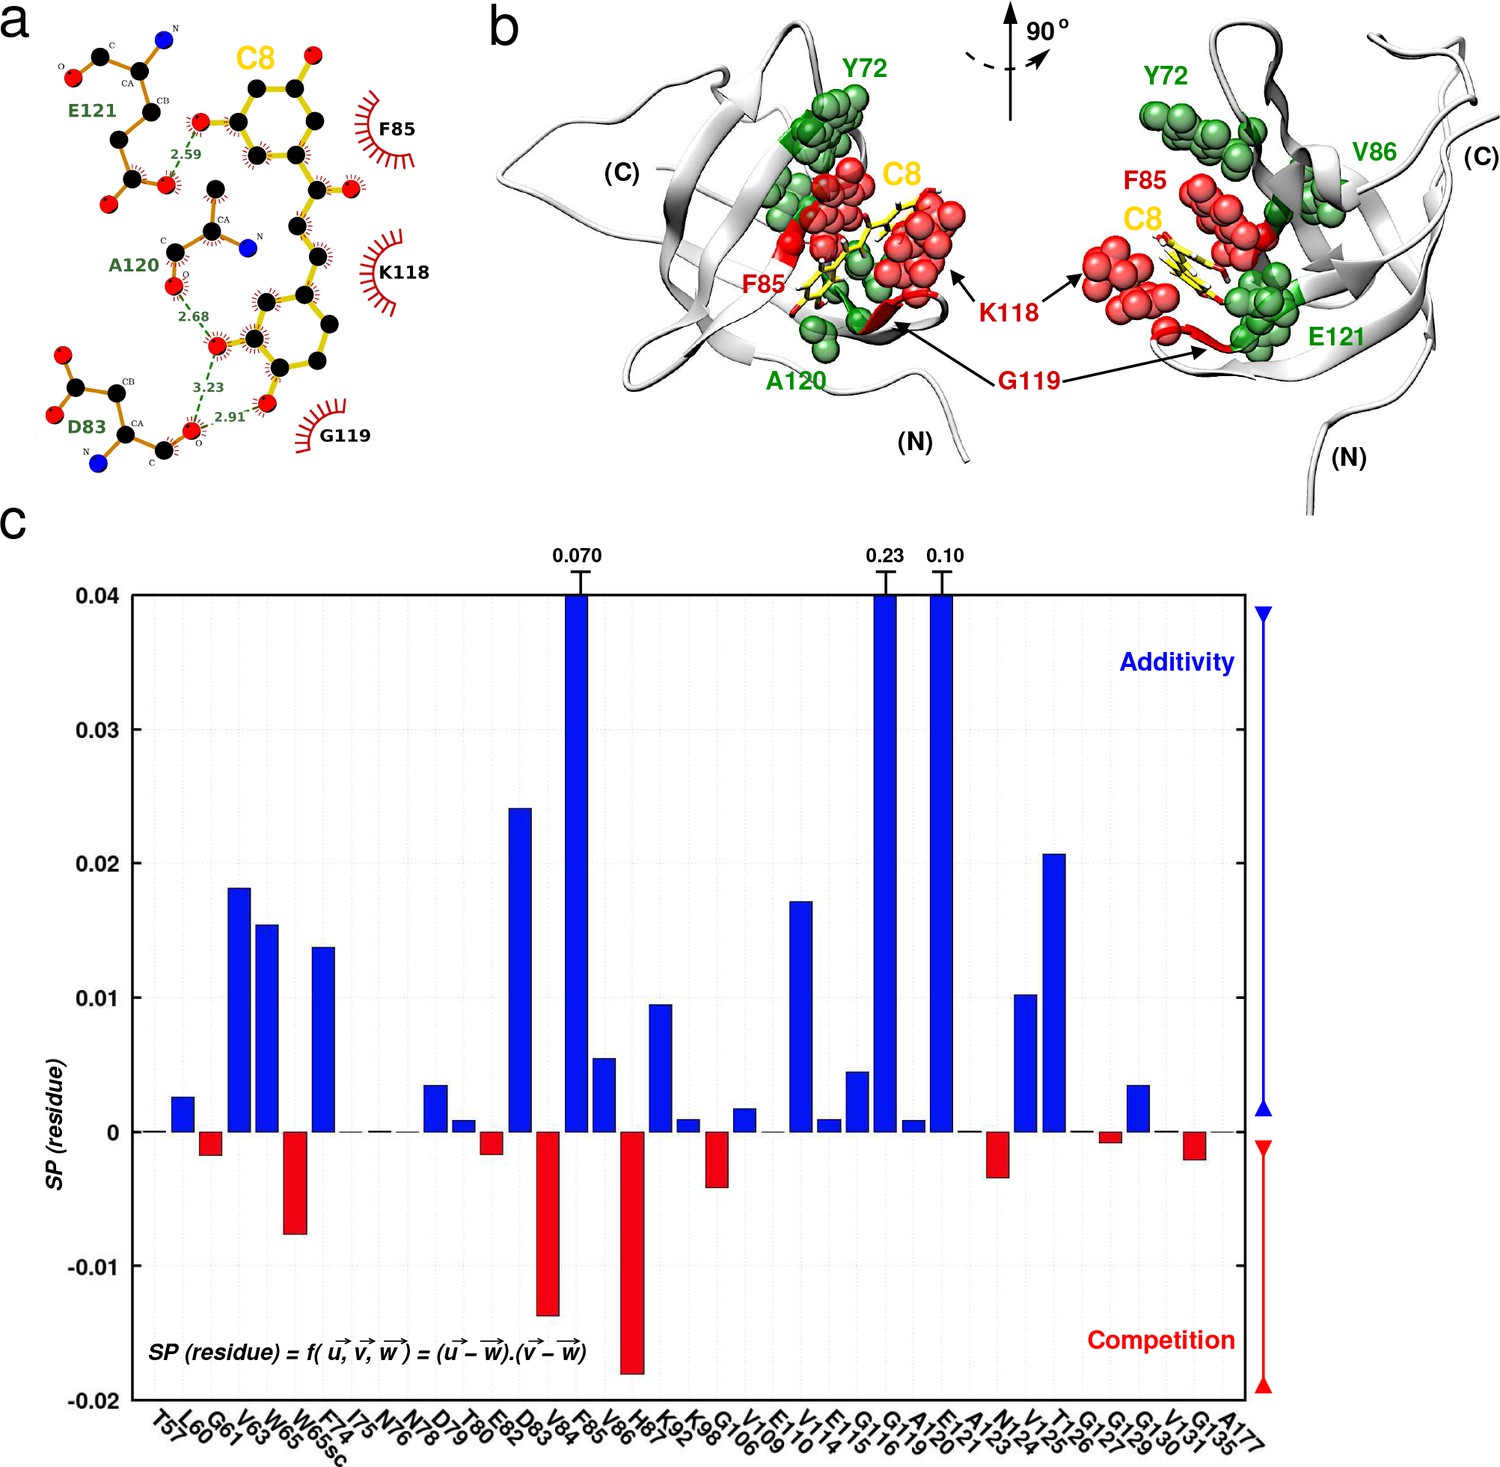
Investigating C8 binding to YB-1 in the presence of RNA by MD and NMR.
Investigating C8 binding to YB-1 in the presence of RNA by MD and NMR. (a) 2D interaction diagram between C8 (gold) and YB-1. (b) 3D representation of the YB-1:C8 complex. The structure used in both representations (2D and 3D) is of the zero-energy complex obtained from 200 ns MD simulations. The protein is represented in light grey cartoon, C8 in gold sticks. Residues implicated in the binding and showing significant CSPs in NMR are represented with spheres: residues with high and intermediate CSPs are in red, and green respectively (see Figure 7—figure supplement 1 for CSP values). (c) Histogram showing the scalar product of pair displacement vectors calculated for each residue based on CSPs extracted from 1H-15N NMR spectra of 15N-labeled YB-1 in the absence and/or absence of C8 and/or C5 RNA. means that vectors , and move in the same direction, and thus an additive effect is observed in the NMR spectra. means that vectors , and move in the opposite direction, and thus a competitive effect is observed.
Figure 8 with 5 supplements
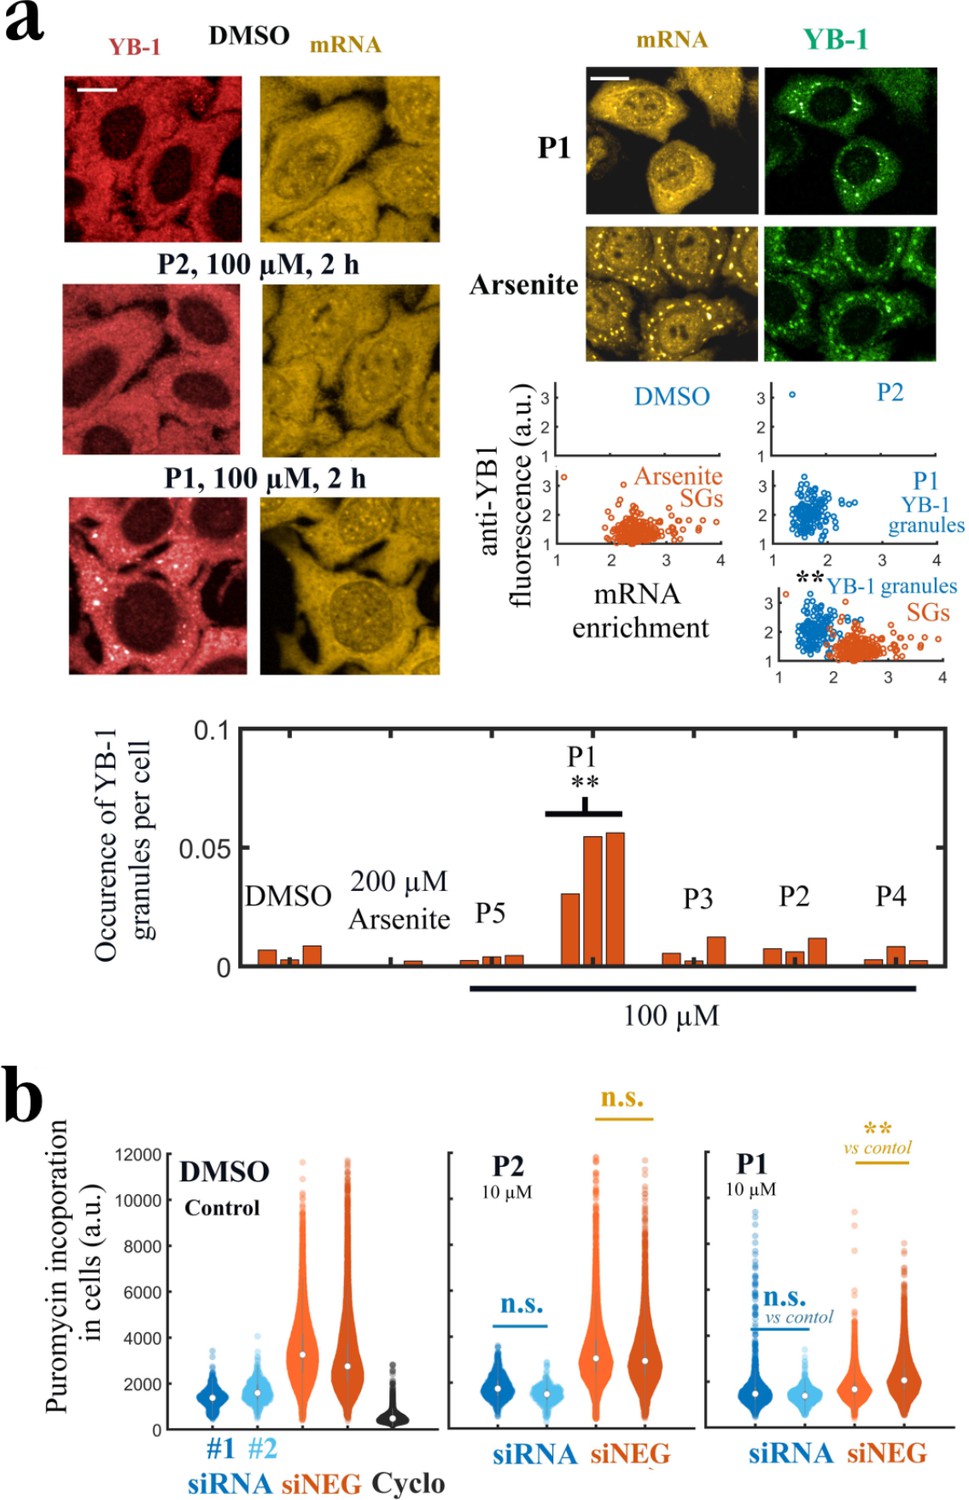
P1 alters cellular YB-1 functions in HeLa cells independently of PARP activity.
(a) YB-1 distribution in cells exposed to P1. Upper left panels: HeLa cells treated with P1 and P2 at 100 μM for 2 hr. Upper right panels: Images of cells exposed to P1 and Arsenite. The corresponding scatter plots indicate a difference in mRNA-enrichment of stress granules (Arsenite, orange scatter plot) and YB-1 granules (P1, blue scatter plot). Lower panel: Occurrence of YB-1-rich granules in cells exposed to indicated treatment for 2 hr. **, <0.01; -test with two tails (triplicates). Scale bars: 20 μm. (b) HeLa cells pretreated with two different siRNAs to decrease endogenous YB-1 levels or siNEG (negative control), and then exposed to indicated molecules (10 μM, 2 h) followed by a brief exposure to puromycin before fixation to estimate global mRNA transition at the single cell level. **, <0.01; -test with two tails.
Figure 8—figure supplement 1
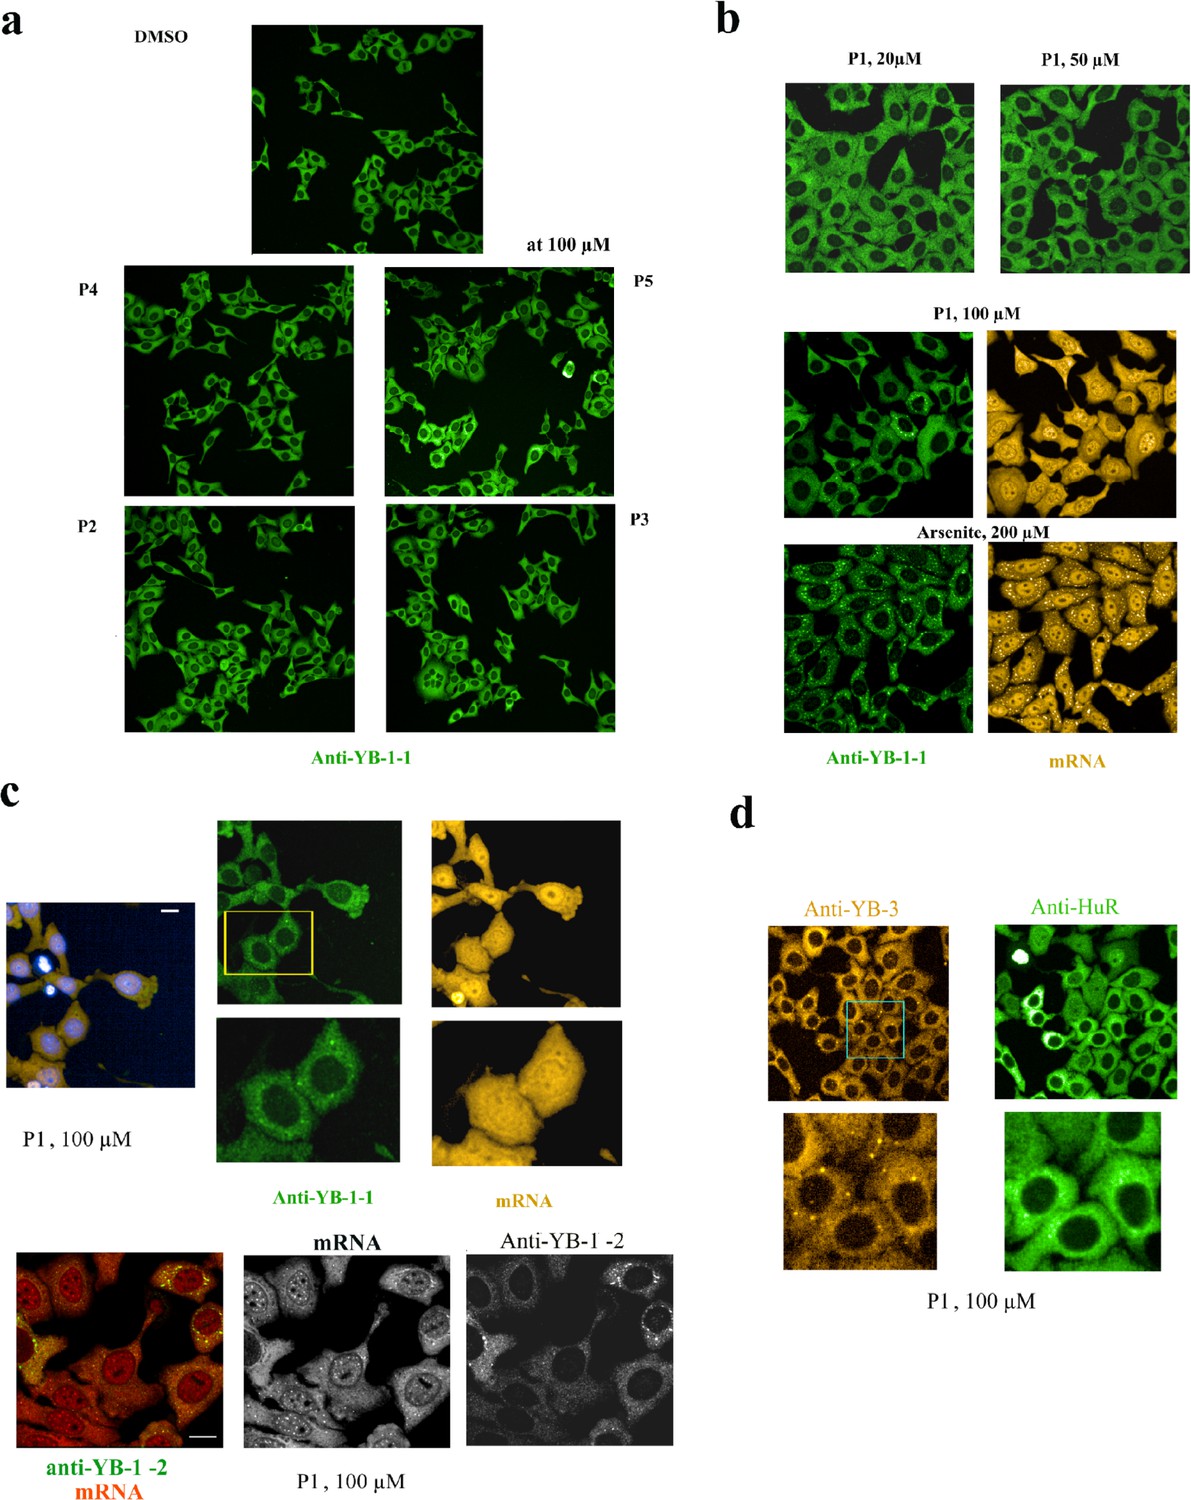
Cytoplasmic YB-1-rich granules in HeLa cells at high P1 concentrations (≥20 μM).
Cytoplasmic YB-1-rich granules in HeLa cells at high P1 concentrations (≥20 μM). (a) Representative images of HeLa cells exposed to PARP-1 inhibitors (P4, P5, P2, P3 at 100 μM) during 2 hr. No YB-1-rich granules are observed. (b) Representative images of HeLa cells exposed to P1 (at 20, 50, and 100 μM) or Arsenite (at 200 μM) for 2 hr at indicated concentrations. P1 and Arsenite lead to the appearance of YB-1-rich granules (fluorescent dots). The critical P1 concentration to observe the appearance of YB-1-rich granules under experimental condition is 50 μM. In Arsenite-treated cells, YB-1-rich granules are stress granules (lower left panel) owing to their highly enriched non-polysomal mRNA (lower right panel). On the other hand, YB-1-rich granules detected in P1-treated cells (middle left panel) were poorly enriched in mRNA (middle right panel). (c) The YB-1-rich granules of P1-treated cells can be observed with two different YB-1 antibodies (anti-YB-1–1 and anti-YB-1–2). Green, YB-1; orange/red, mRNA. (d) same as (c) with anti-YB-3 and anti-HuR antibodies. Note the marked presence of YB-3 in the cytoplasmic granules.
Figure 8—figure supplement 2
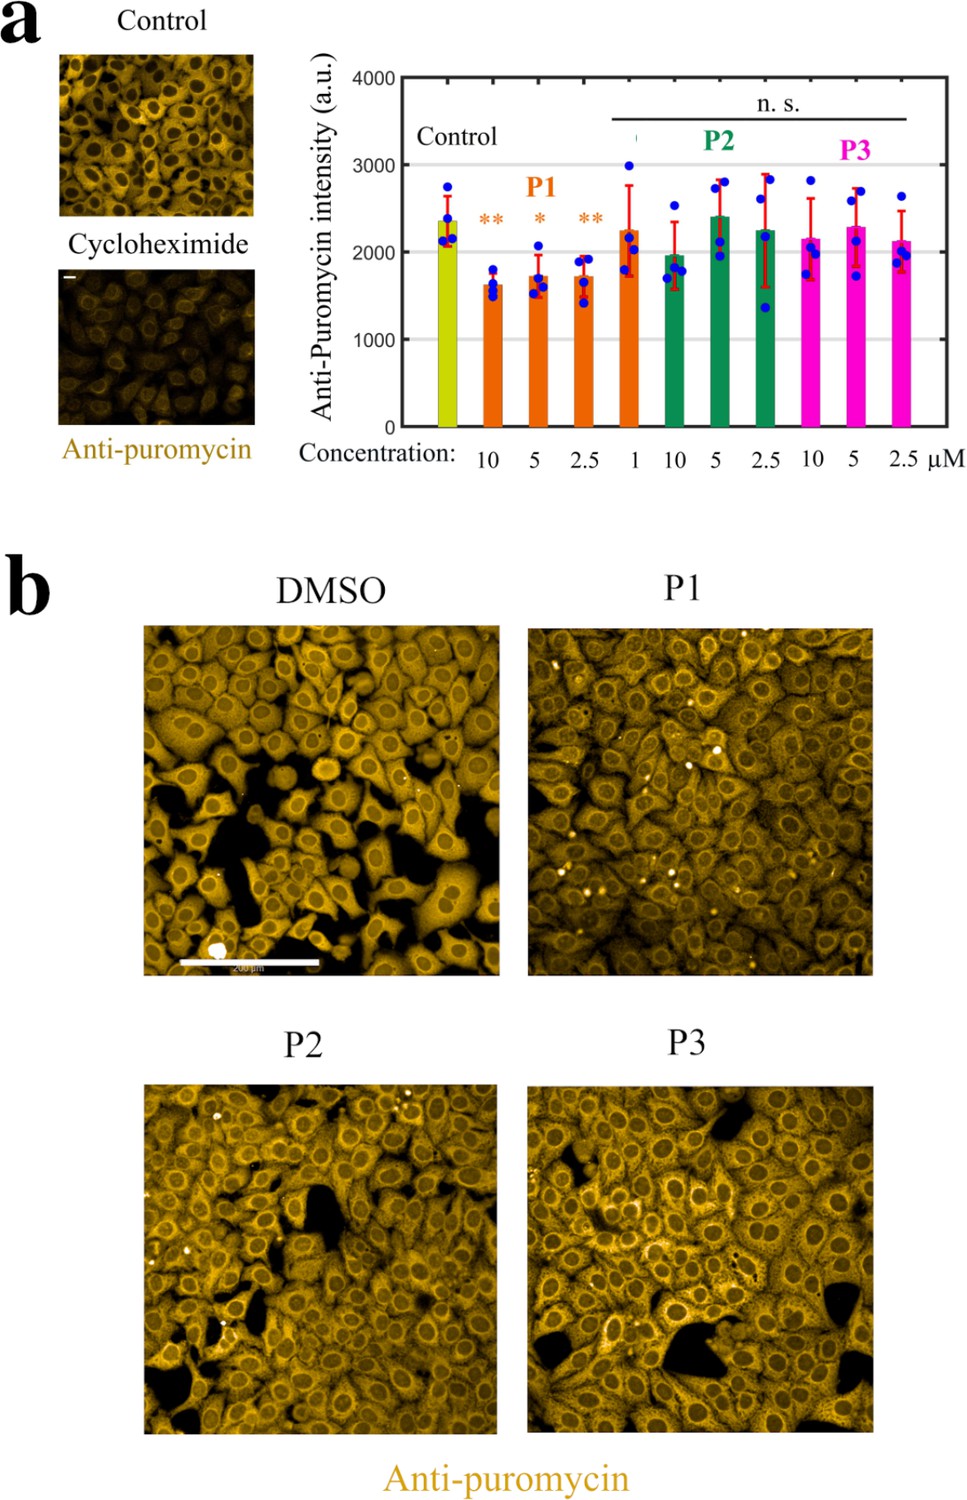
Monitoring puromycin incorporation in HeLa cells.
Monitoring puromycin incorporation in HeLa cells. (a) Left panel: Cycloheximide (Cyclo, 10 μg.ml−1, 1 h), a translation inhibitor, prevents puromycin incorporation. Right panel: Histogram showing the efficiency of puromycin incorporation after indicated treatment for 2 hr. **, P<0.01; *, P<0.05; n.s., non-significant; -test with two tails (n=4 samples condition). (b) Anti-puromycin fluorescence images of HeLa cells exposed to 10 μM of DMSO, P1, P2, and P3 for 2 hr; these cells were briefly exposed to puromycin 10 min prior to fixation.
Figure 8—figure supplement 3
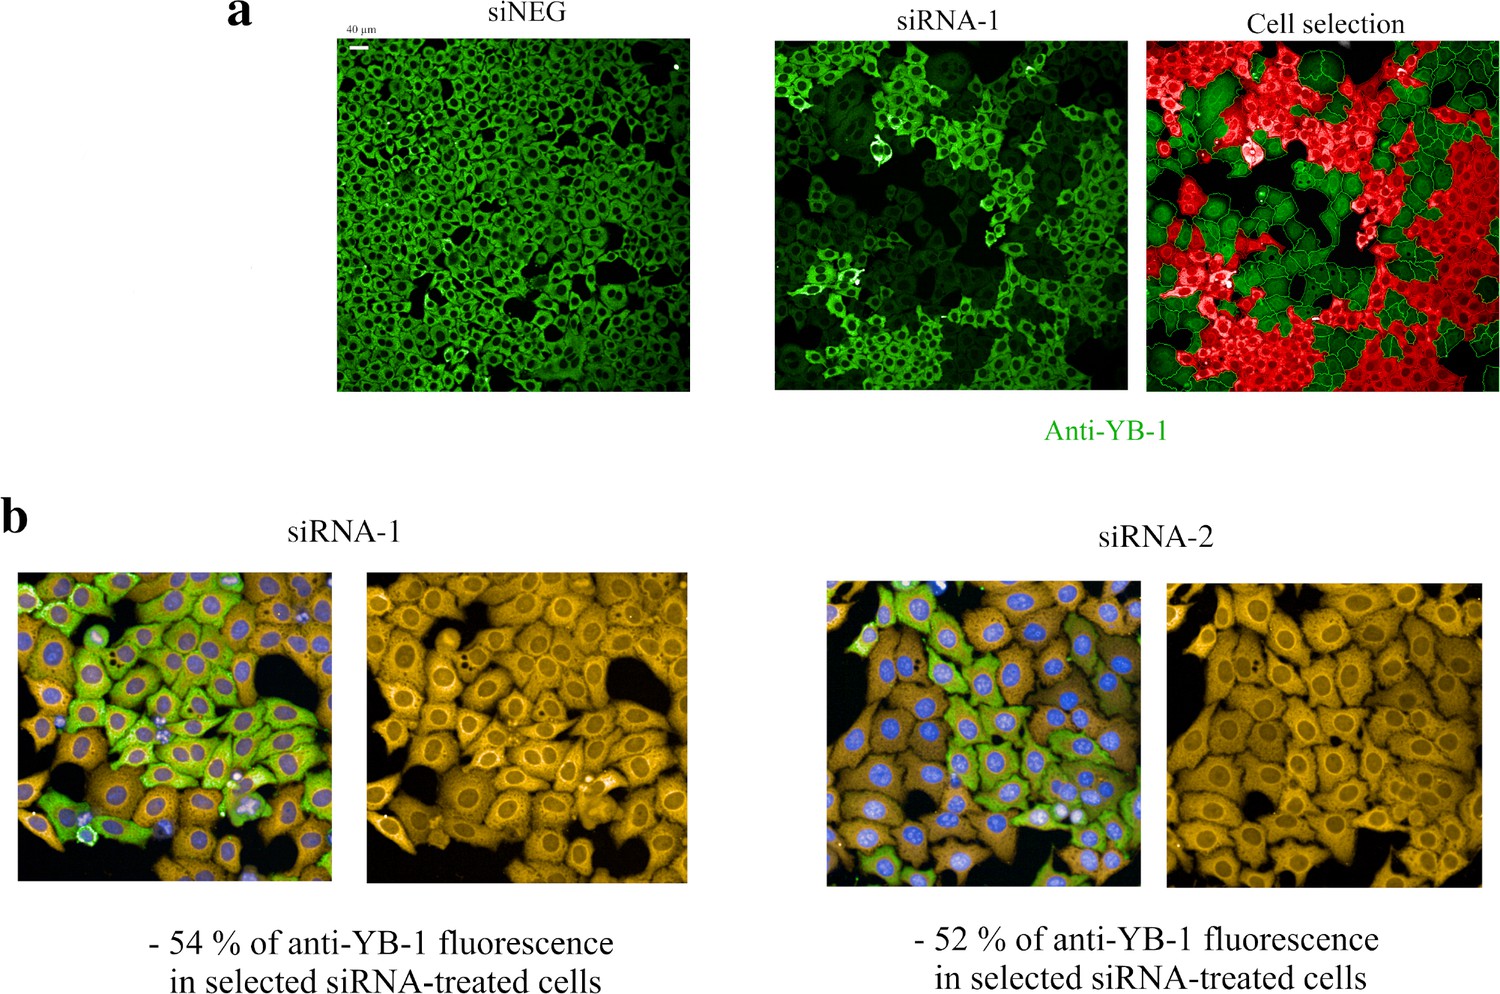
Detection of puromycin incorporation in HeLa cells.
Detection of puromycin incorporation in HeLa cells. (a) Anti-fluorescence images of HeLa cells after treatment with a negative control (siNEG, upper panel) or treatment with siRNA targeting YB-1 transcripts (siRNA-1, lower left panel). Under our experimental conditions, siRNAs lead to the appearance of clusters of HeLa cells expressing low levels of YB-1 that coexists with clusters of HeLa cells expressing normal levels of YB-1 (dim green vs fluorescent green in the lower left panel). Using the HARMONY software, we measured the mean intensity of anti-YB-1 fluorescence in the cytoplasm and selected only cells expressing YB-1 at a low level for further analysis of the puromycin incorporation level (green, lower right panel; red cells are cells expressing normal levels of YB-1 and thus were not selected). (b) Representative HeLa images obtained to measure the incorporation of puromycin in siRNA-treated cells. The two siRNAs used in this study (siRNA-1 and –2) decreased the expression level of YB-1 to a significant extent.
Figure 8—figure supplement 4
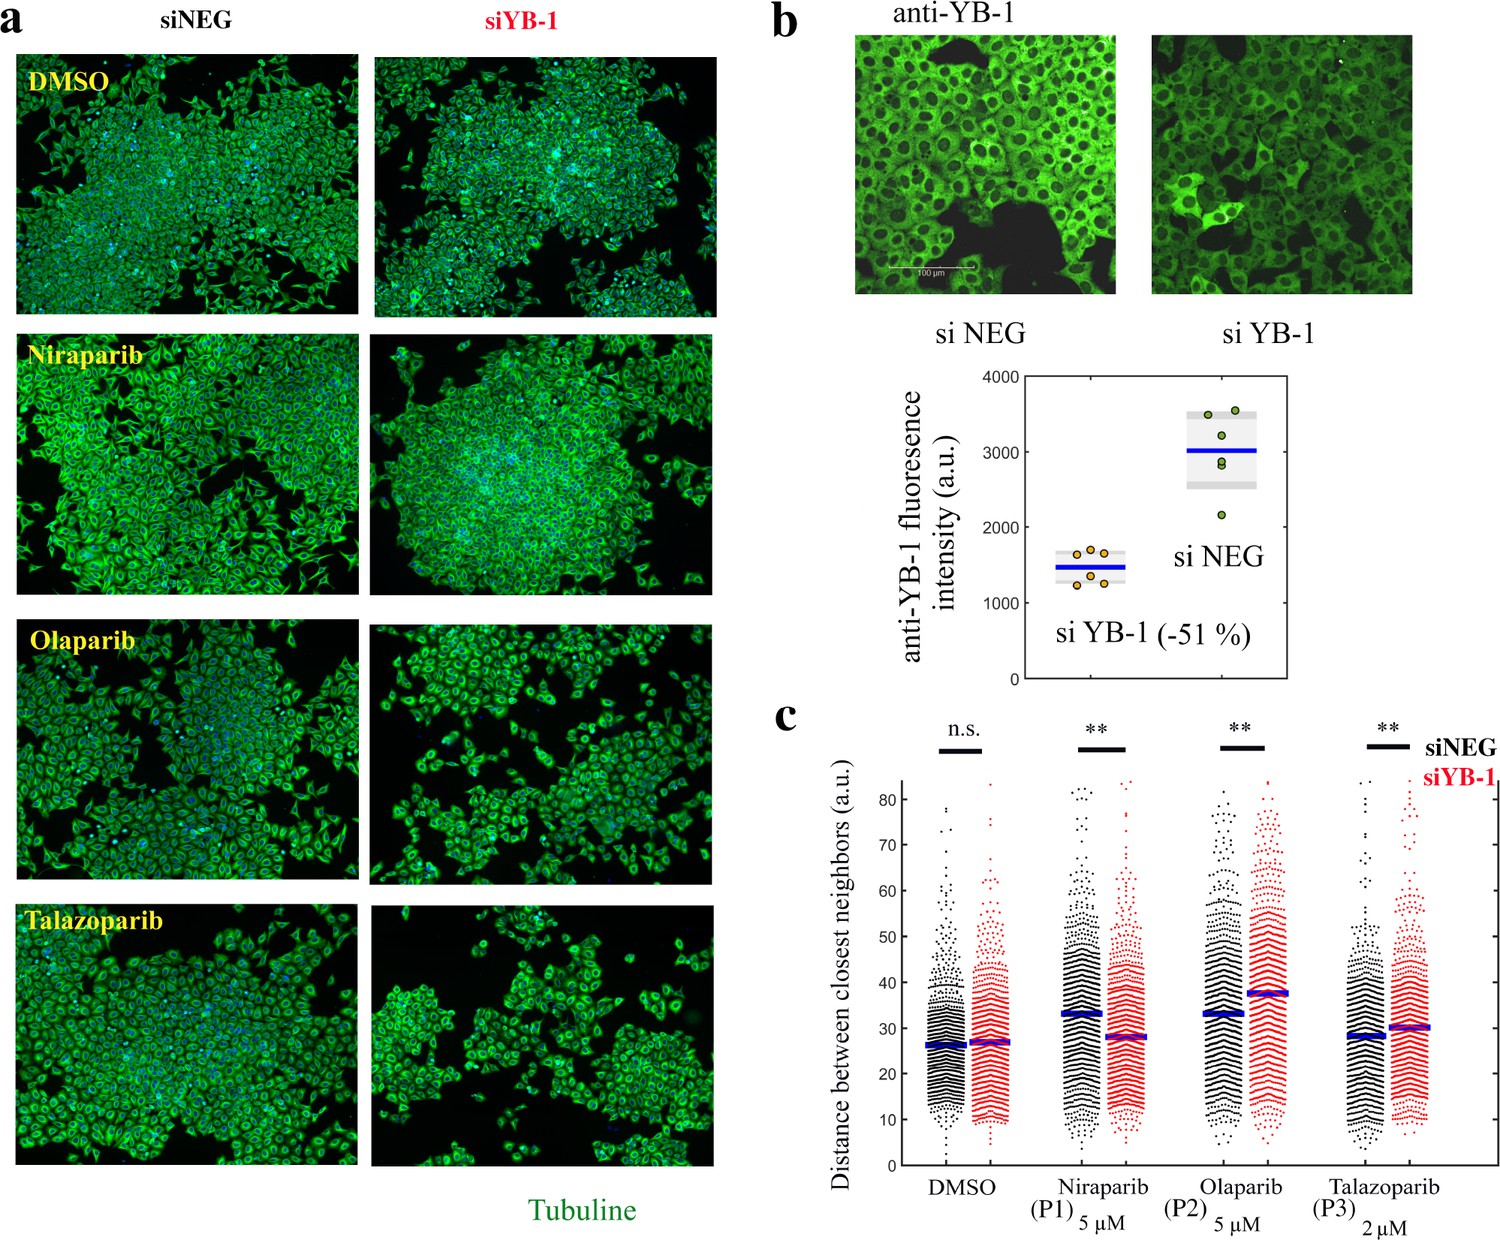
P1 increases the separation distance between cells when comparing YB-1-rich with YB-1-poor HeLa cells.
(a) Representative cell images after indicated treatments for 48 hr (staining: anti-tubulin). (b) Analysis of YB-1 level in HeLa cells after treatment with siRNA-1 or siNEG. siRNA treatment, under such conditions, allows to significantly repress YB-1 expression in most cells (c) Automatic measurement of the distance between closest neighbors at the single-cell level after indicated treatments. ; two-tailed t-test.
-
Figure 8—figure supplement 4—source data 1
Anti-YB-1 fluorescence intensity values for Figure 8—figure supplement 4b.
- https://cdn.elifesciences.org/articles/80387/elife-80387-fig8-figsupp4-data1-v2.xlsx
-
Figure 8—figure supplement 4—source data 2
Data points of the calculated distance between closest neighbors for Figure 8—figure supplement 4c.
- https://cdn.elifesciences.org/articles/80387/elife-80387-fig8-figsupp4-data2-v2.xlsx
Figure 8—figure supplement 5
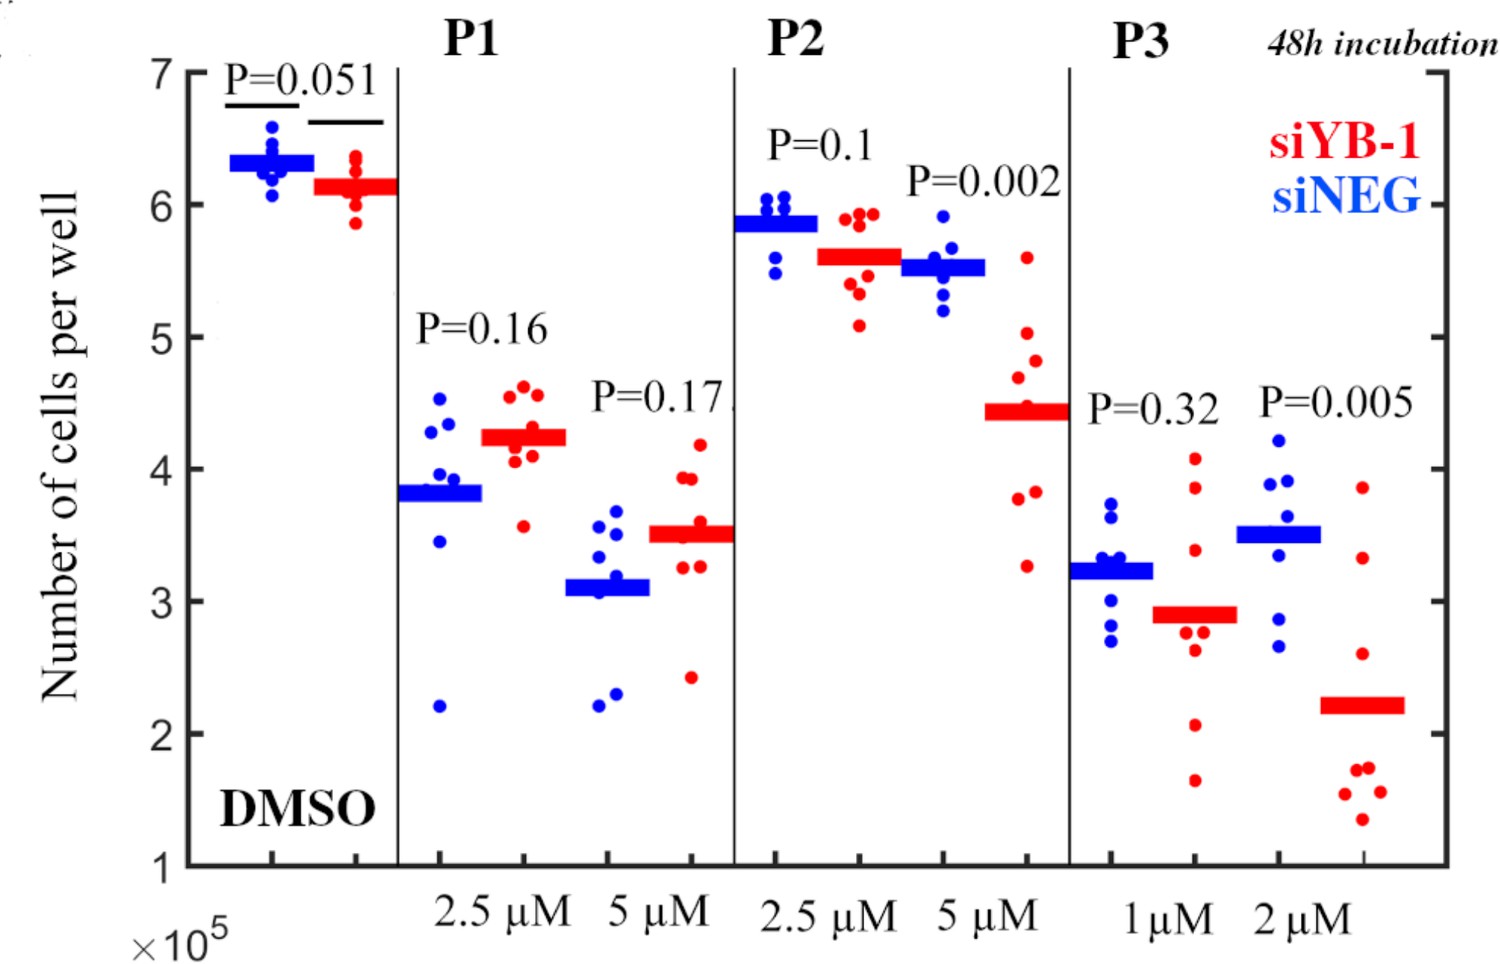
Compared to other PARP-1 inhibitors, P1 further decreases the number of cells well in YB-1 rich cells.
Number of cells well after indicated treatment (48 hr) for siRNA- or siNEG-treated cells (siRNA-1). -test with two tails (octuplates). siNEG vs siYB-1.
-
Figure 8—figure supplement 5—source data 1
Number of cells per well data points for Figure 8—figure supplement 5.
- https://cdn.elifesciences.org/articles/80387/elife-80387-fig8-figsupp5-data1-v2.xlsx
Appendix 1—figure 1
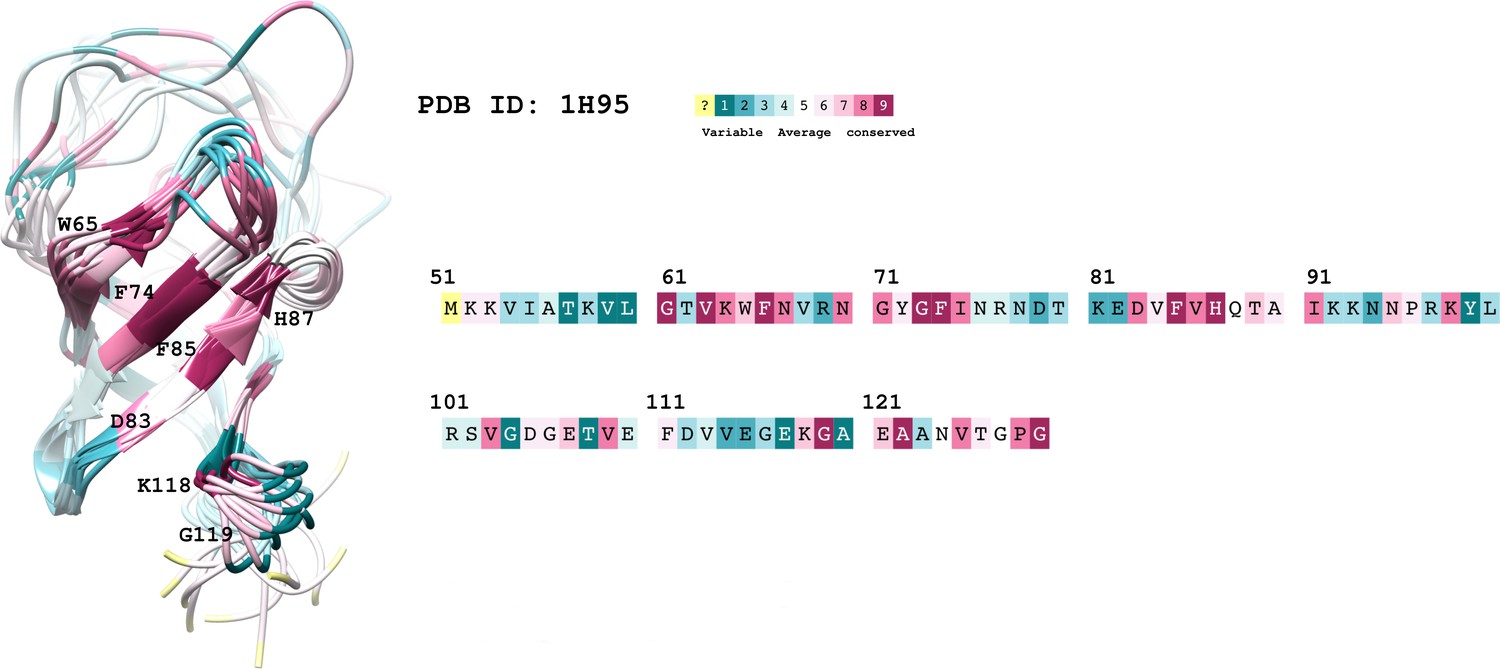
The conservation coloring profile from the ConSurf-DB repository, mapped onto the protein.
The conservation coloring scale is shown on the top right conservation score varies from 1 to 9, where 1 corresponds to maximal variability and 9 to maximal conservation; "?" indicates insufficient data. Only highly conserved residues of interest are labeled on the 3D structure.
Appendix 5—figure 1

Isothermal Titration Calorimetry measurements of YB-1/P1 binding.
(a) ITC raw data for titration of P1 into YB-1 in aqueous buffer solution. (b) Enthalpograms retrieved from (a). The solid line represents the fit to a single-site binding model.
Tables
Appendix 5—table 1
ITC measurements of YB1/P1 complex.
| [Ligand] (M) | [YB-1] (M) | N | Kd (M) | ΔH (kcal.mol— 1) | ΔG (kcal.mol— 1) | -TΔS (K.kcal.mol— 1) | Red. | |
|---|---|---|---|---|---|---|---|---|
| P1 | 200.10-6 | 14.10-6 | 1.54 ±3.9x10⁻² | 5.84x10⁻⁹± 674 × 10-9 | –98.1 ± 4.61 | –7.14 | 91.00 | 0.47 |
-
Appendix 5—table 1—source data 1
ITC raw and fitted data obtained from P1 binding to YB-1.
(see legends of Appendix 5—figure 1 and Appendix 5—table 1).
- https://cdn.elifesciences.org/articles/80387/elife-80387-app5-table1-data1-v2.xlsx
Appendix 5—table 2
Thermodynamics of P1 binding to YB-1 obtained from ABFE simulations and ITC experiments.
Comparison of P1/YB-1 binding free energies (ΔG) and their respective enthalpic (ΔH) and entropic (ΔS) contributions from ITC and computations. ΔS was calculated according to ΔG = ΔH - TΔS at 298 K; units are in kcal.mol−1.
| (kcal.mol— 1) | (kcal.mol— 1) | -T (K.kcal.mol— 1) | |
|---|---|---|---|
| ITC | –7.14± 0.47 | –98.10± 4.61 | 91.00 |
| ABFE | –7.24± 0.52 | –28.62± 1.62 | 21.38 |
Appendix 5—table 3
Supplier list and compound IDs of the 40 tested molecules.
| Compound | Traditional name | Compound ID | Supplier |
|---|---|---|---|
| F1 | Quercetin | MolPort-001-740-557 | MolPort |
| F2 | Quercetagetin | MolPort-006-147-776 | MolPort |
| F3 | 3-O-methylquercetin | 90081 | SigmaAldrich |
| F4 | Fisetin | MolPort-000-882-130 | MolPort |
| F5 | Rutin | MolPort-001-740-246 | MolPort |
| F6 | myricitrin | 91255 | SigmaAldrich |
| F7 | Herbacetin | MolPort-019-998-217 | MolPort |
| F8 | Vincetoxicoside B | MolPort-035-758-036 | MolPort |
| F9 | Scutellarien | MolPort-003-724-680 | MolPort |
| F10 | Luteolin-7-methylether | MolPort-001-740-950 | MolPort |
| F11 | Naringenin | MolPort-000-861-091 | MolPort |
| C1 | Butein | MolPort-006-111-425 | MolPort |
| C2 | Okanin | FO66168 | CarboSynth |
| C3 | Robtein | Amb22172818 | Ambinter |
| C4 | Chorilifol B | MolPort-039-338-845 | MolPort |
| C5 | Bavachalcone | FB145210 | CarboSynth |
| C6 | homobutein | FM65711 | CarboSynth |
| C7 | Cardamonin | FC66017 | CarboSynth |
| C8 | 3’,3,4,5’-tetrahydroxychalcone | FC66017 | CarboSynth |
| C9 | 2’,4’-dihydroxy-4-methoxychalcone | MolPort-000-662-842 | MolPort |
| C10 | 2’-hydroxy-4’-methoxychalcone | MolPort-000-779-850 | MolPort |
| C11 | 2’,4,4’-trihydroxychalcone | MolPort-001-741-660 | MolPort |
| C12 | Lichochalcone B | MolPort-046-594-311 | MolPort |
| A1 | 10–3-[2-(2,3-dihydro-1-benzofuran-5-yl)ethoxy]phenyl-2-(3,4-dihydroxyphenyl)–3,5-dihydroxy-9H,10H-pyrano[2,3 h]chromene-4,8-dione | MolPort-035-700-332 | MolPort |
| A2 | 2-(3,4-dihydroxyphenyl)–3,5-dihydroxy-10-(naphthalen-1-yl)–9 H,10H-pyrano[2,3 h]chromene-4,8-dione | MolPort-029-885-579 | MolPort |
| A3 | [8-(4-chlorophenyl)–2-(3,4-dihydroxyphenyl)–3,5-dihydroxy-4-oxofuro[2,3 h]chromen-9-yl]acetic acid | MolPort-044-544-604 | MolPort |
| A4 | 2-(3,4-dihydroxyphenyl)–3,5-dihydroxy-10–2-[2-(4-methoxyphenyl)ethoxy]phenyl-9H,10H-pyrano[2,3 h]chromene-4,8-dione | MolPort-035-699-845 | MolPort |
| A5 | 2-(3,4-dihydroxyphenyl)–3,5-dihydroxy-10-isopropyl-9H,10H-pyrano[2,3 h]chromene-4,8-dione | MolPort-029-886-488 | MolPort |
| A6 | 6,8-dibromo-2-(3-chloro-4-hydroxy-5-methoxyphenyl)chromen-4-one | MolPort-008-821-914 | MolPort |
| A7 | 6,8-dibromo-3-hydroxy-2-(4-hydroxy-3-methoxyphenyl)chromen-4-one | MolPort-023-282-651 | MolPort |
| A8 | 2-(4-hydroxy-3-iodo-5-methoxyphenyl)chromen-4-one | MolPort-002-521-806 | MolPort |
| P1 | Niraparib | MolPort-023-219-142 | MolPort |
| P2 | Olaparib | MolPort-009-679-395 | MolPort |
| P3 | Talazoparib | MolPort-028-600-028 | MolPort |
| P4 | Veliparib | MolPort-016-633-168 | MolPort |
| P5 | Rucaparib | MolPort-028-744-762 | MolPort |
| D1 | Nebivolol | MolPort-015-163-751 | MolPort |
| D2 | Mefloquine | MolPort-006-170-692 | MolPort |
| D3 | Icotinib | MolPort-039-139-676 | MolPort |
| D4 | Cabotegravir | MolPort-035-944-338 | MolPort |
Appendix 5—table 4
Primers used for RT-PCR analysis.
Sequences are from 5’ to 3’.
| Forward | Backward | |
|---|---|---|
| canx | GCAACCACTTCCCTTCCAT | TCCGCCTCTCTCTTTACTGC |
| calr | TGTCAAAGATGGTGCCAGAC | ACAACCCCGAGTATTCTCCC |
| oaz1 | TACAGCAGTGGAGGGAGACC | GGATAAACCCAGCGCCAC |
| rpl8 | AGATGGGTTTGTCAATTCGG | CAAGAAGACCCGTGTGAAGC |
| eif4g1 | CCCAACTGTAGAAGGCATCC | CTCCAGGCCCTTGTAGTGAC |
| fnbp1 | GCATGAAGTTATCTCCGAGAACA | CGGCCATCGTGAAAGTTTGAT |
| nin | GGAGGAACTCACCGACCTTTG | CGTCCGTAACGCTTCCCAC |
| cdkal1 | GGGACTGAGTATCATTGGGGT | CCAAGCCGCCTTCCATTATC |
| mkln1 | AGCCACGATGGAGTCAAATCA | TGGCACTAGGACCATTCTCTTT |
| eif4g2 | AATCGCACTCTCCACTTTGG | GCTGCTGAGTTCTCGGTGA |
| ubl3 | TGACAATTGGCCAATGGACTG | GCCACCAAATGCATCACTGT |
| actin | CATGTACGTTGCTATCCAGGC | CTCCTTAATGTCACGCACGAT |
| gapdh | CCTCCTGCACCACCAACTGCTTA | GTGATGGCATGGACTGTGGTCAT |
Appendix 5—table 5
RT-PCR analysis of 13 mRNAs isolated via MT bench pull-down or via magnetic beads RIP and for 3 different RBPs (YB-1, HuR, and FUS).
| MT bench | IP (beads) | |||||
|---|---|---|---|---|---|---|
| mRNA\ Bait | YB-1 | HuR | FUS | YB-1 | HuR | FUS |
| fnbp1 | 0.733 | –0.339 | 1.032 | 0.429 | 0.227 | 0.641 |
| rpl8 | –0.436 | –1.647 | –1.976 | 0.098 | –2.546 | –1.232 |
| eif4g1 | 1.697 | 0.009 | 0.024 | 1.527 | 0.176 | 1.258 |
| gapdh | –0.228 | –2.772 | –2.834 | 0.294 | –3.616 | –1.609 |
| ubl3 | 0.356 | 1.439 | 2.073 | 0.094 | 1.297 | 1.658 |
| canx | –0.227 | 1.013 | 2.286 | –0.367 | 1.555 | 0.770 |
| actin | –1.661 | –0.855 | –3.051 | –2.007 | –0.074 | –1.716 |
| eif4g2 | 0.546 | –0.118 | 1.458 | 1.117 | 0.037 | 0.324 |
| nin | 0.906 | 0.371 | 2.806 | 0.859 | 0.824 | 2.259 |
| calr | 0.403 | –0.405 | –1.801 | –0.357 | 0.893 | –1.163 |
| cdk1 | 0.137 | 1.050 | 0.569 | 0.954 | 1.558 | 0.896 |
| oaz1 | –1.783 | –0.940 | –3.758 | –1.310 | –0.976 | –2.189 |
| mkln1 | 0.418 | 0.196 | 1.974 | –0.127 | –0.256 | 0.103 |
Additional files
-
MDAR checklist
- https://cdn.elifesciences.org/articles/80387/elife-80387-mdarchecklist1-v2.pdf
-
Appendix 5—table 1—source data 1
ITC raw and fitted data obtained from P1 binding to YB-1.
(see legends of Appendix 5—figure 1 and Appendix 5—table 1).
- https://cdn.elifesciences.org/articles/80387/elife-80387-app5-table1-data1-v2.xlsx
Download links
A two-part list of links to download the article, or parts of the article, in various formats.
Downloads (link to download the article as PDF)
Open citations (links to open the citations from this article in various online reference manager services)
Cite this article (links to download the citations from this article in formats compatible with various reference manager tools)
Targeting RNA:protein interactions with an integrative approach leads to the identification of potent YBX1 inhibitors
eLife 12:e80387.
https://doi.org/10.7554/eLife.80387


