High-throughput profiling of sequence recognition by tyrosine kinases and SH2 domains using bacterial peptide display
- Department of Chemistry, Columbia University, United States
- Department of Biological Sciences, Columbia University, United States
Figures
Figure 1 with 3 supplements
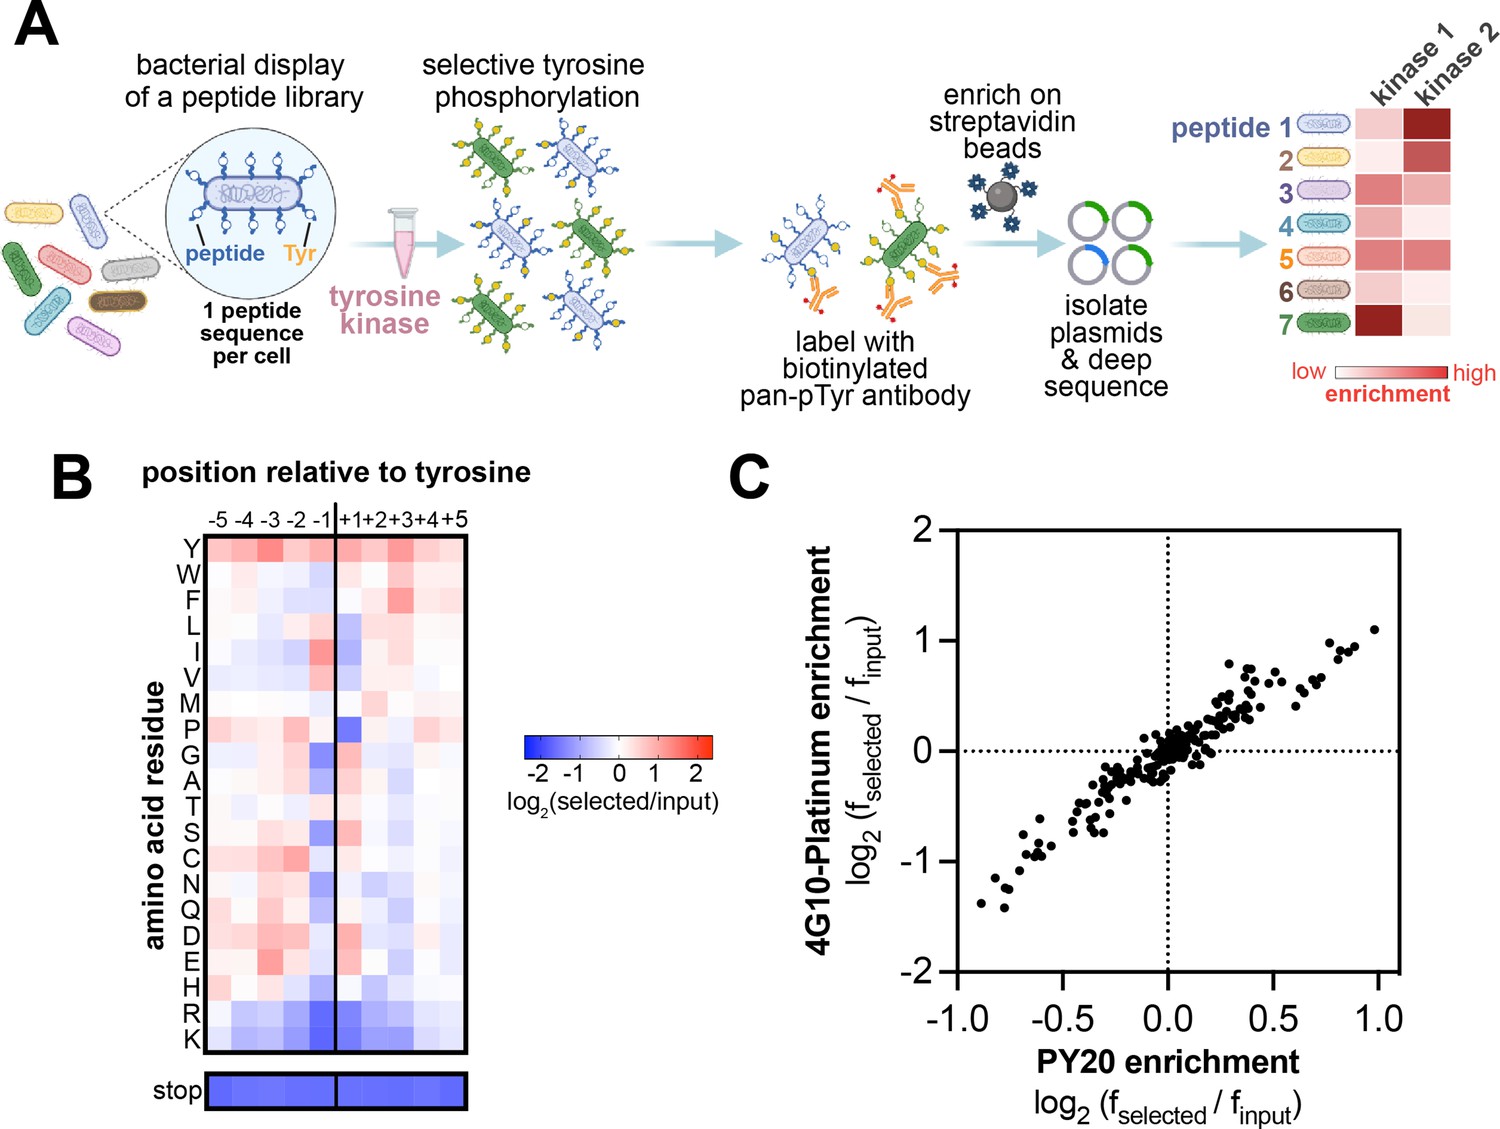
High-throughput profiling of tyrosine kinase substrate specificity using bacterial peptide display.
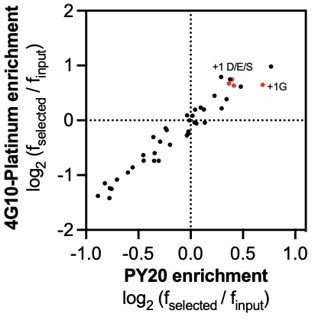
(A) Schematic representation of the workflow for kinase specificity profiling. (B) Heatmap depicting the specificity of the c-Src kinase domain, measured using the X5-Y-X5 library. Enrichment scores were log2-transformed and are displayed on a color scale from blue (disfavored sequence features, negative value), to white (neutral sequence features, near zero value), to red (favored sequence features, positive value). Values in the heatmap are the average of three replicates. (C) Correlation between position-specific amino acid enrichments from screens with the 4G10 Platinum and PY20 biotinylated pan-phosphotyrosine antibodies.
Figure 1—figure supplement 1
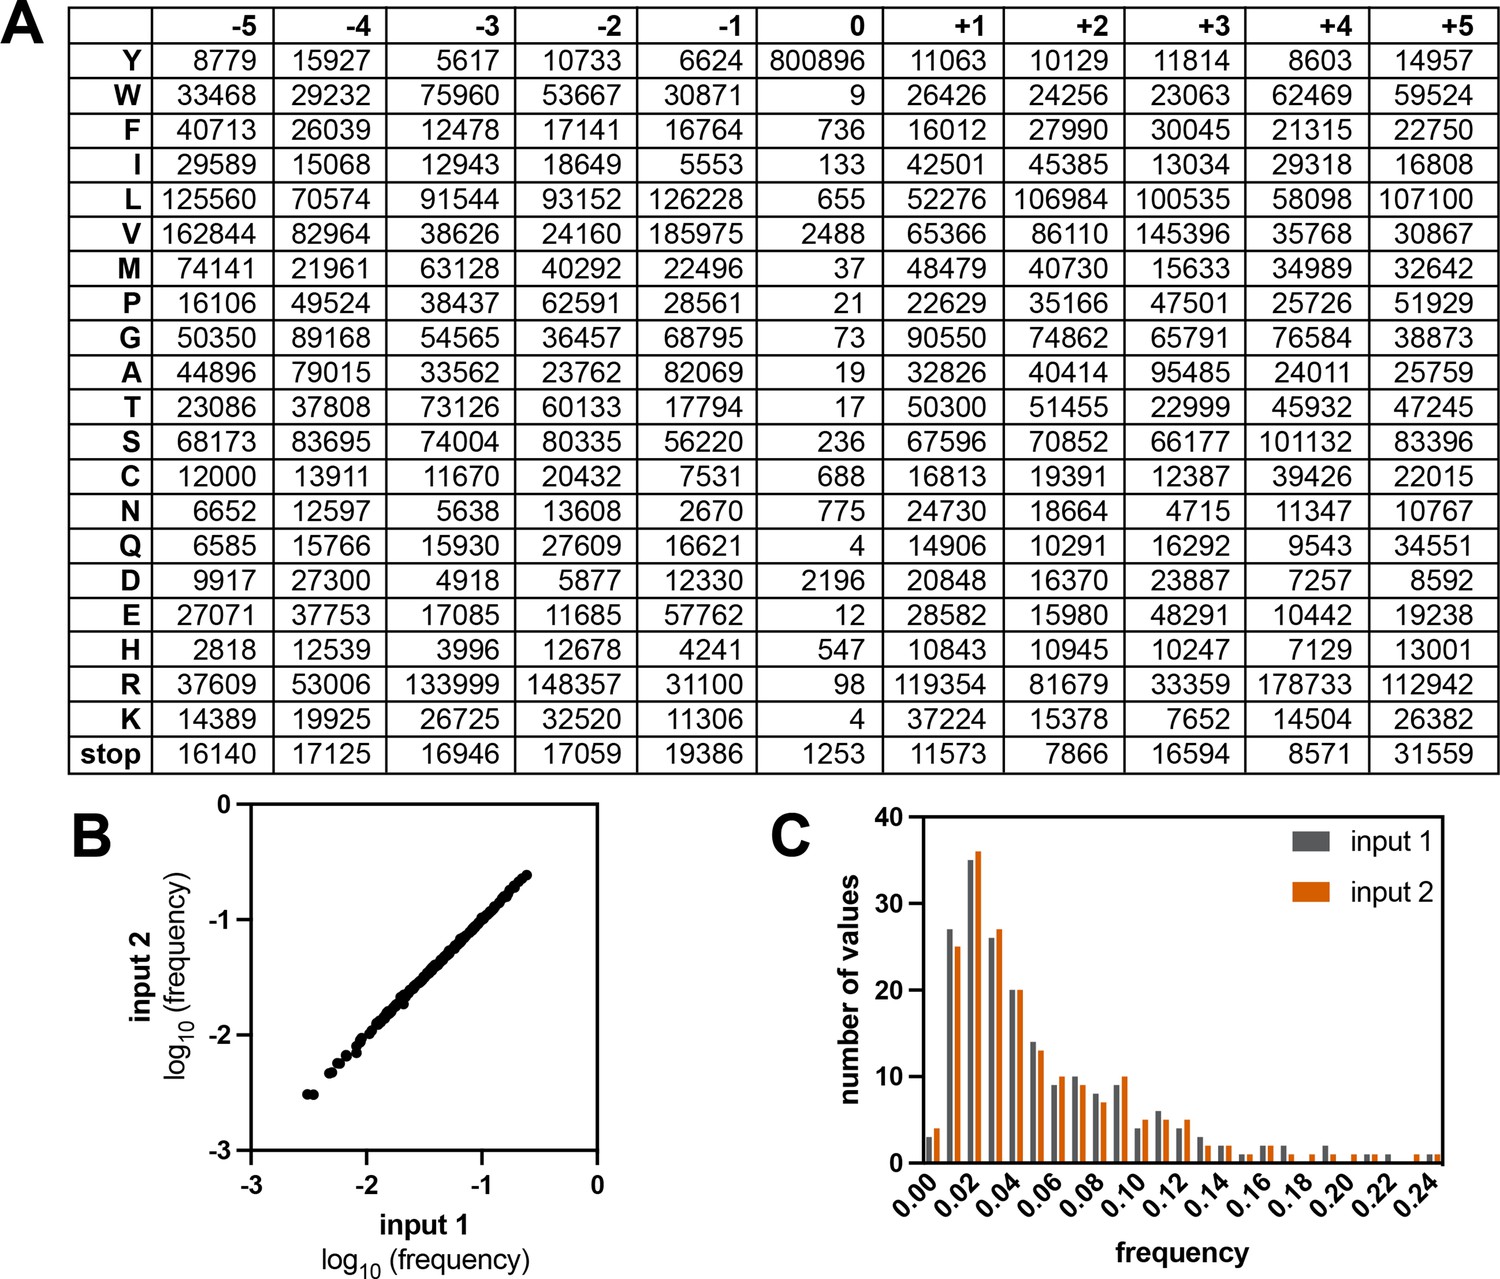
Composition of the X5-Y-X5 library.
(A) Table showing the read counts for all amino acids and the stop codon across all positions in the strep-tagged X5-Y-X5 library, from one sequencing run with an unselected (input) library. (B) Correlation of amino acid frequencies at each position from two replicates of the input library. (C) Distribution of frequencies from two replicates of the input library.
-
Figure 1—figure supplement 1—source data 1
Counts table corresponding to one sequence run from an input X5-Y-X5 library.
- https://cdn.elifesciences.org/articles/82345/elife-82345-fig1-figsupp1-data1-v2.xlsx
Figure 1—figure supplement 2
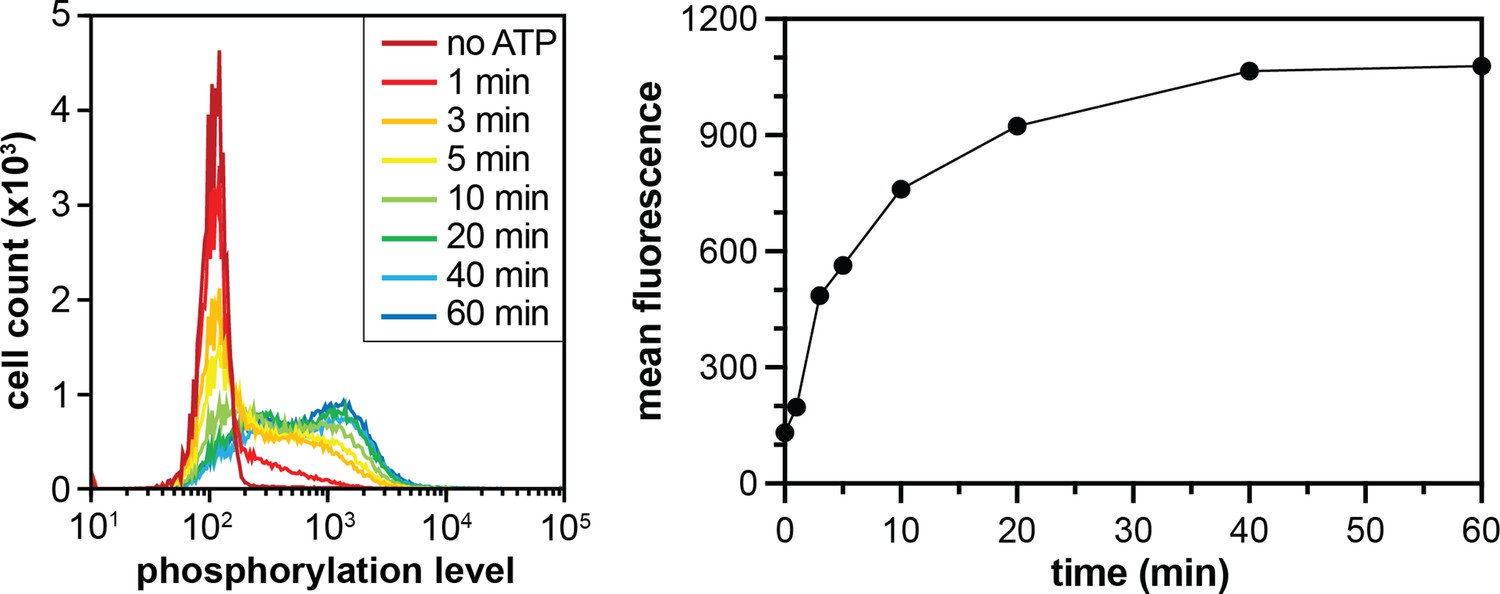
Phosphorylation of the X5-Y-X5 library by c-Src.
Flow cytometry analysis monitoring the distribution of phosphotyrosine levels over time (left). The mean fluorescence intensities, which represent phosphorylation levels, plotted as a function of time (right).
Figure 1—figure supplement 3
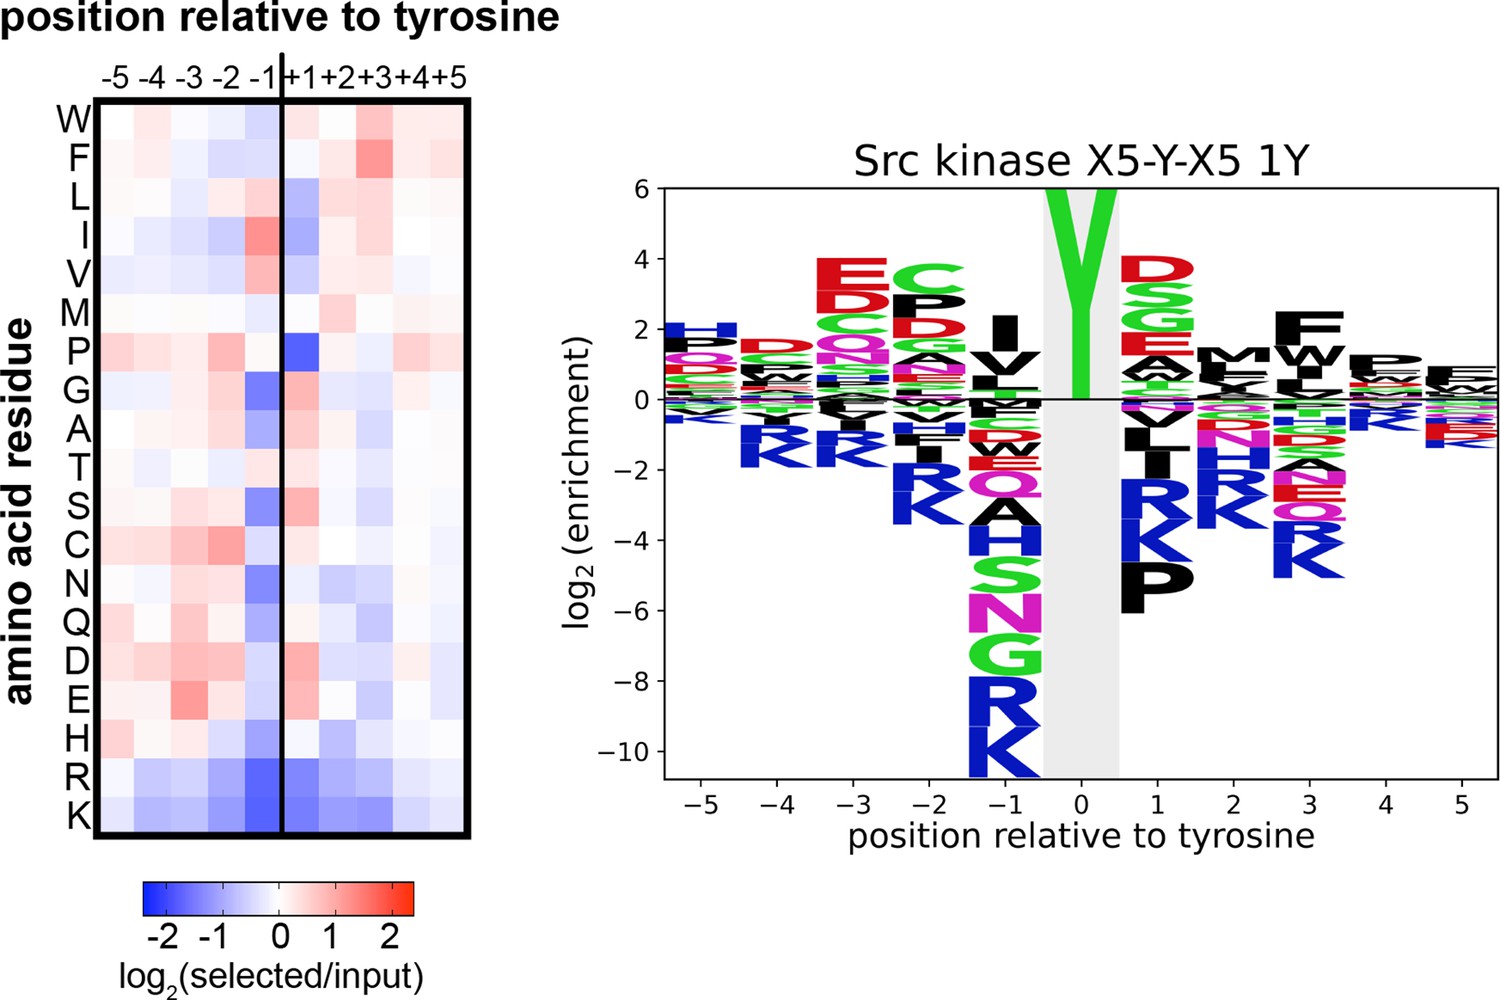
Heatmap and logo depicting the specificity of the c-Src kinase domain, measured using the X5-Y-X5 library.
Only peptides with one central tyrosine were considered in this analysis. Enrichment scores were log2-transformed and are displayed on a color scale from blue (disfavored sequence features, negative value), to white (neutral sequence features, near zero value), to red (favored sequence features, positive value). The same values were used to plot the heatmap and the sequence logo. The height for the central ‘Y’ in the sequence logo is an arbitrary value, chosen for optimal visualization of other features. Values are the average of three replicates.
Figure 2 with 2 supplements
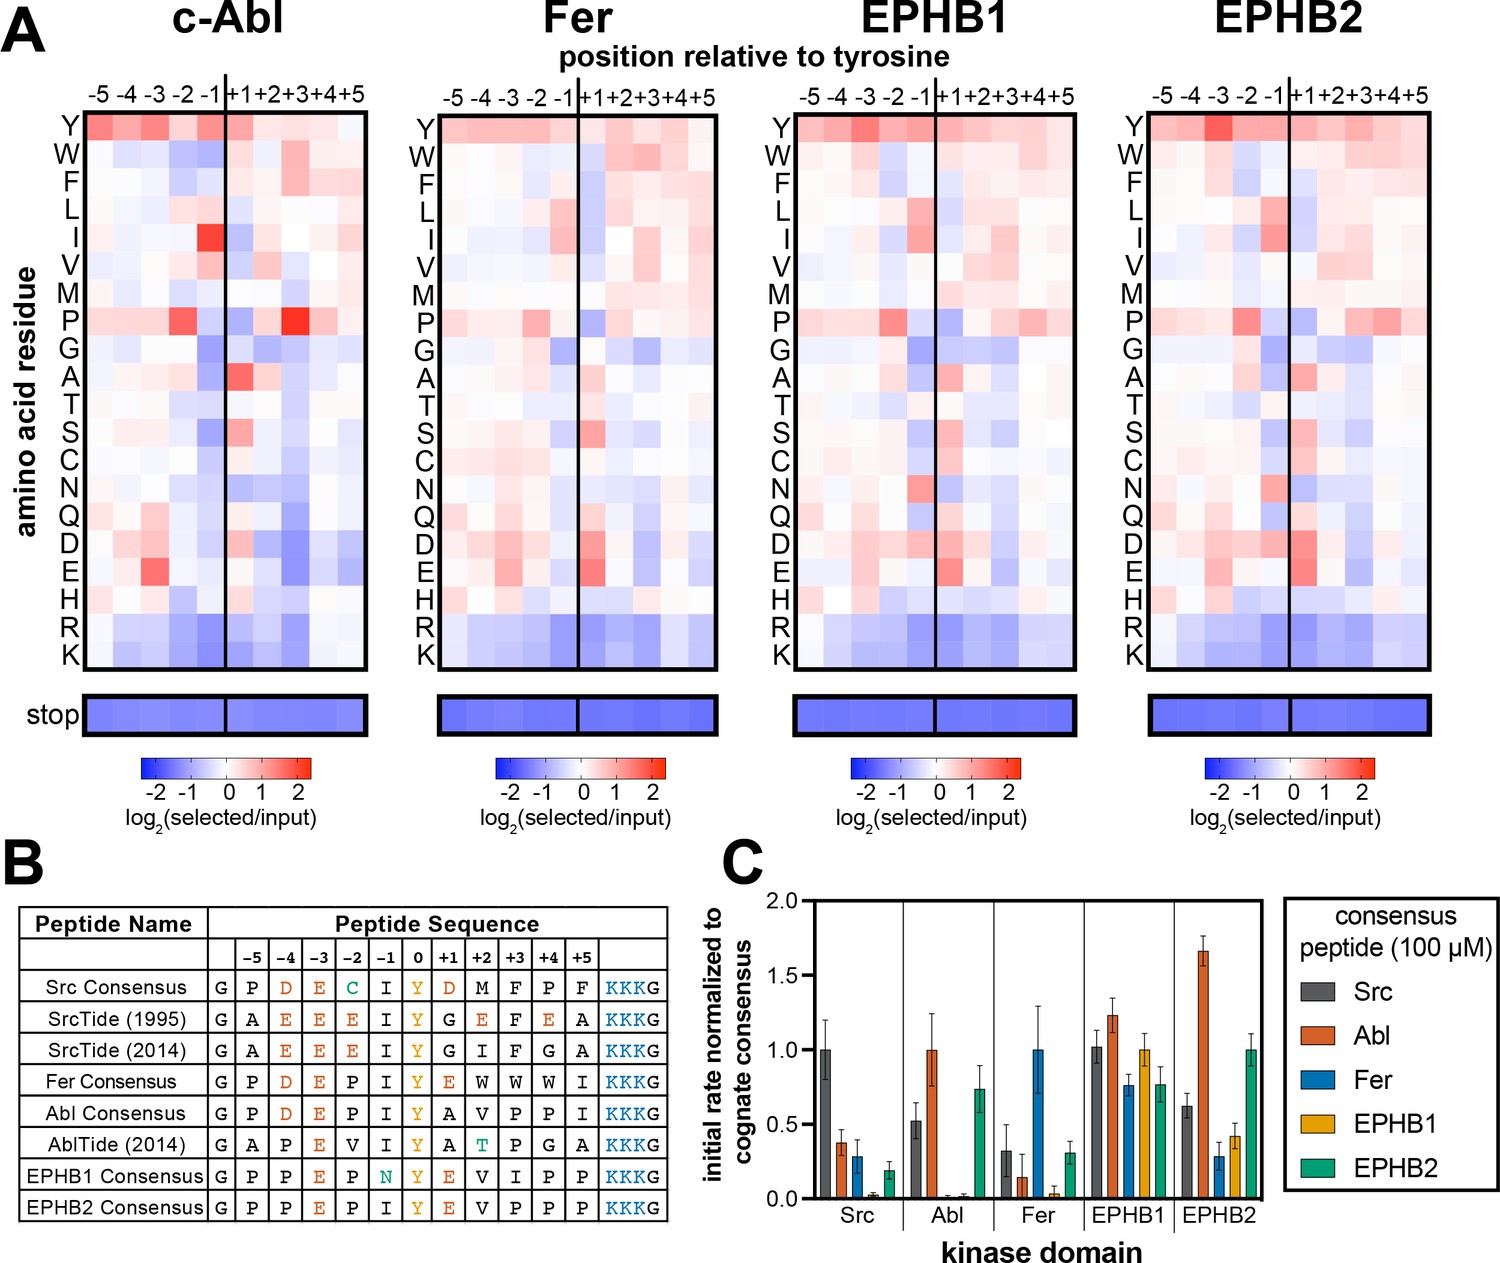
Specificity profiling of tyrosine kinases using the X5-Y-X5 library.
(A) Heatmaps depicting the specificities of c-Abl, Fer, EPHB1, and EPHB2. Enrichment scores were log2-transformed and are displayed on a color scale from blue (disfavored sequence features, negative value), to white (neutral sequence features, near zero value), to red (favored sequence features, positive value). Values in the heatmaps are the average of three replicates. (B) Sequences of consensus peptides identified through X5-Y-X5 screens, compared with previously reported SrcTide and AblTide sequences. (C) Phosphorylation kinetics of five consensus peptides against five kinases. Initial rates were normalized to the rate of the cognate consensus peptide. All peptides were used at a concentration of 100 μM, and the kinases were used at a concentration of 10–50 nM. Error bars represent the standard deviation from at least three measurements.
-
Figure 2—source data 1
Position-specific amino acid enrichment matrices from the tyrosine kinase X5-Y-X5 library screens.
Matrices calculated with and without inclusion of multi-tyrosine sequences are provided.
- https://cdn.elifesciences.org/articles/82345/elife-82345-fig2-data1-v2.xlsx
Figure 2—figure supplement 1
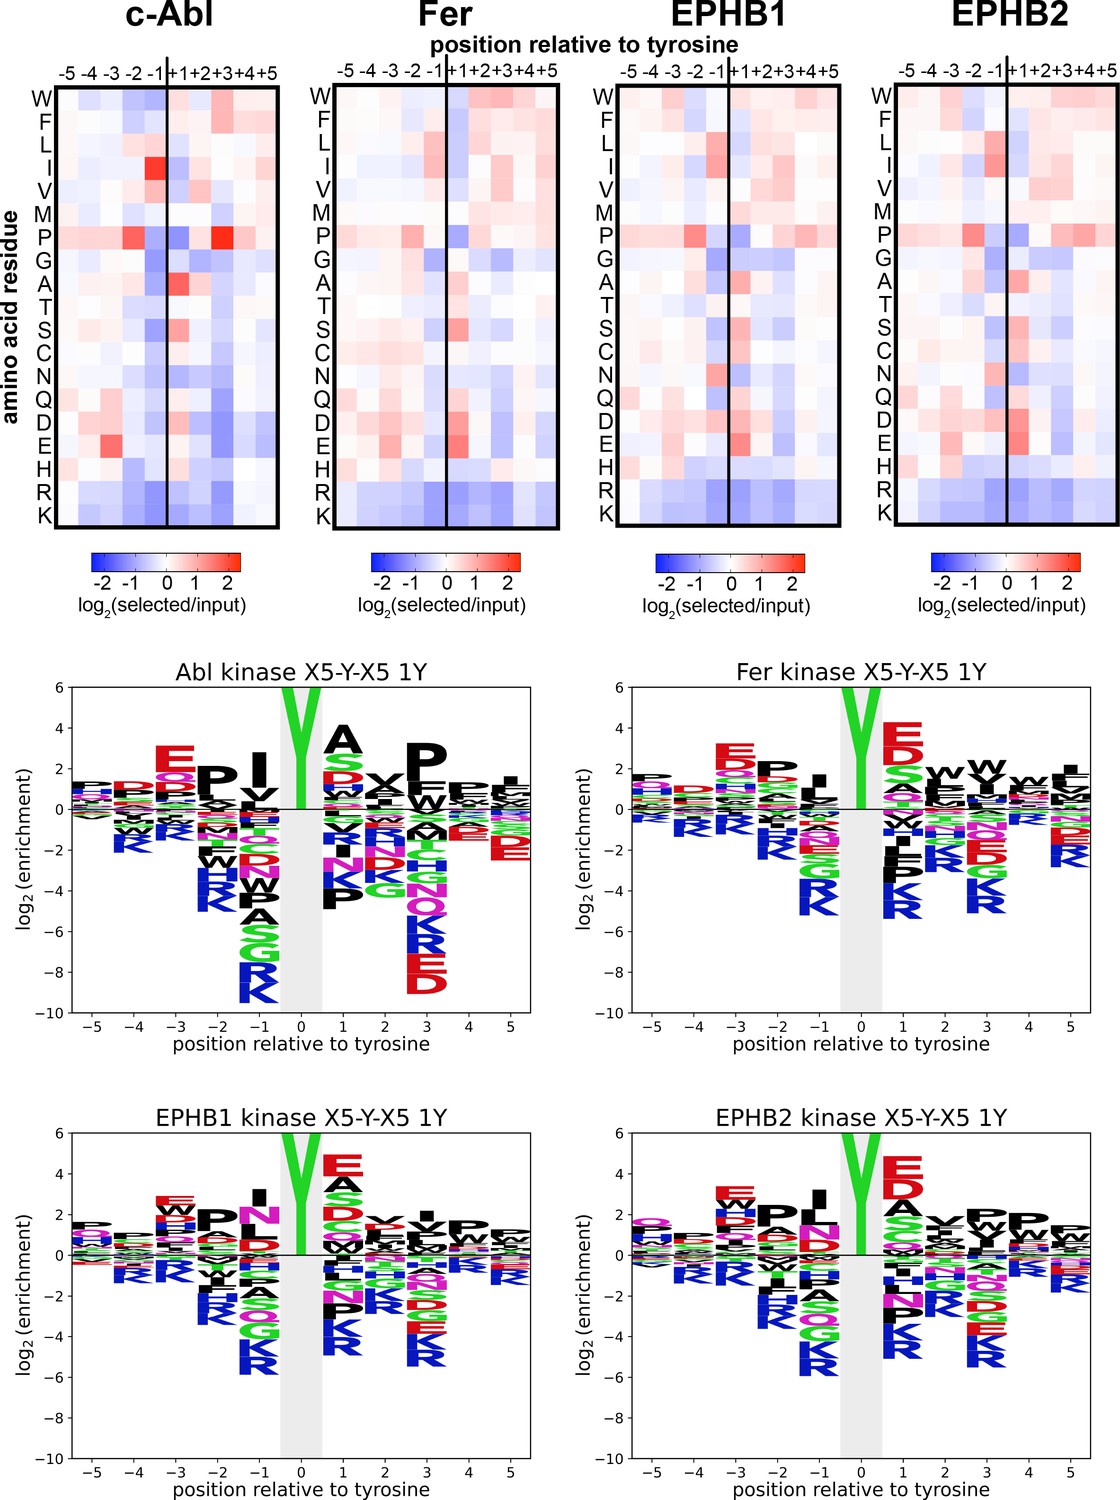
Heatmaps and logos depicting the specificities of c-Abl, Fer, EPHB1, and EPHB2.
Only peptides with one central tyrosine were considered in this analysis. Enrichment scores were log2-transformed and are displayed on a color scale from blue (disfavored sequence features, negative value), to white (neutral sequence features, near zero value), to red (favored sequence features, positive value). The same values were used to plot the heatmaps and the sequence logos. The height for the central ‘Y’ in the sequence logos is an arbitrary value, chosen for optimal visualization of other features. Values are the average of three replicates.
Figure 2—figure supplement 2
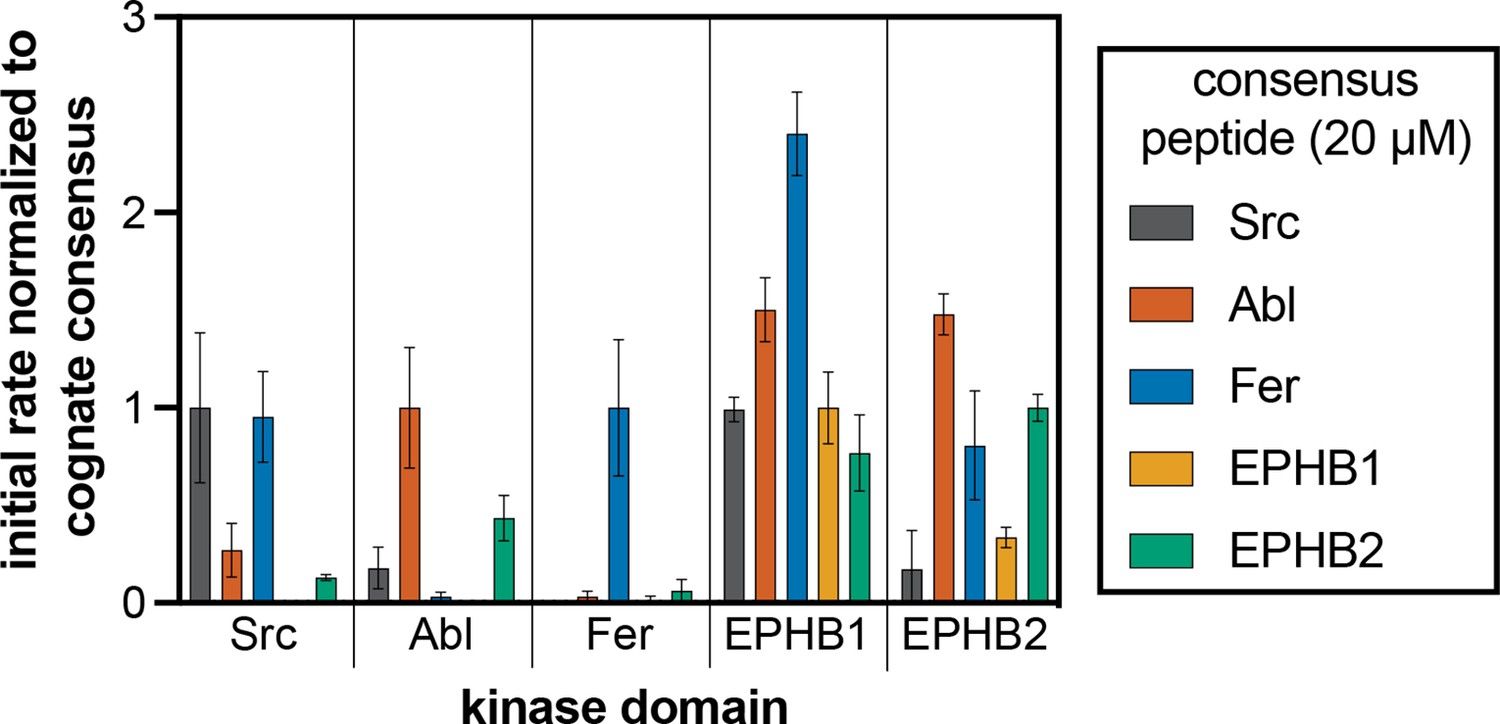
Phosphorylation kinetics of five consensus peptides against five kinases.
Initial rates measured for each kinase were normalized to the rate of the corresponding consensus peptide. All peptides were used at a concentration of 20 μM, and the kinases were used at a concentration of 10–50 nM. Error bars represent the standard deviation from at least three measurements.
Figure 3 with 1 supplement
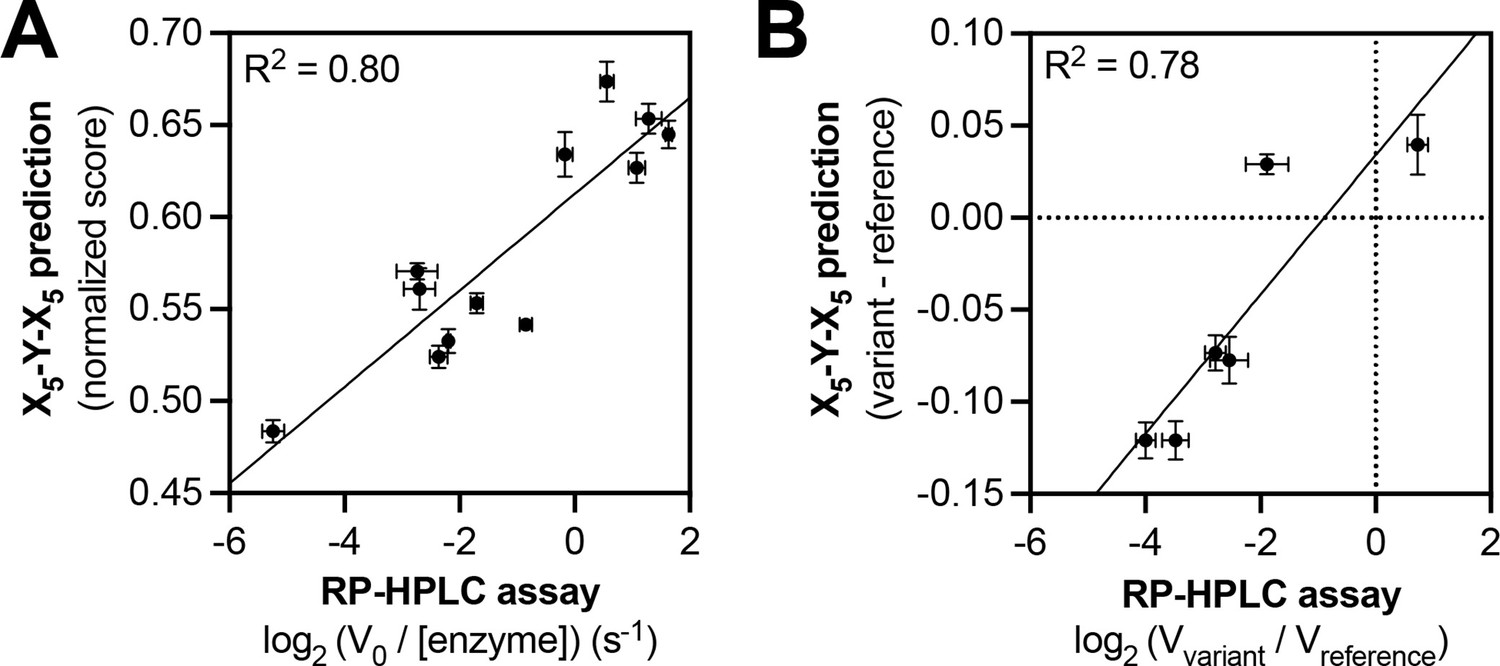
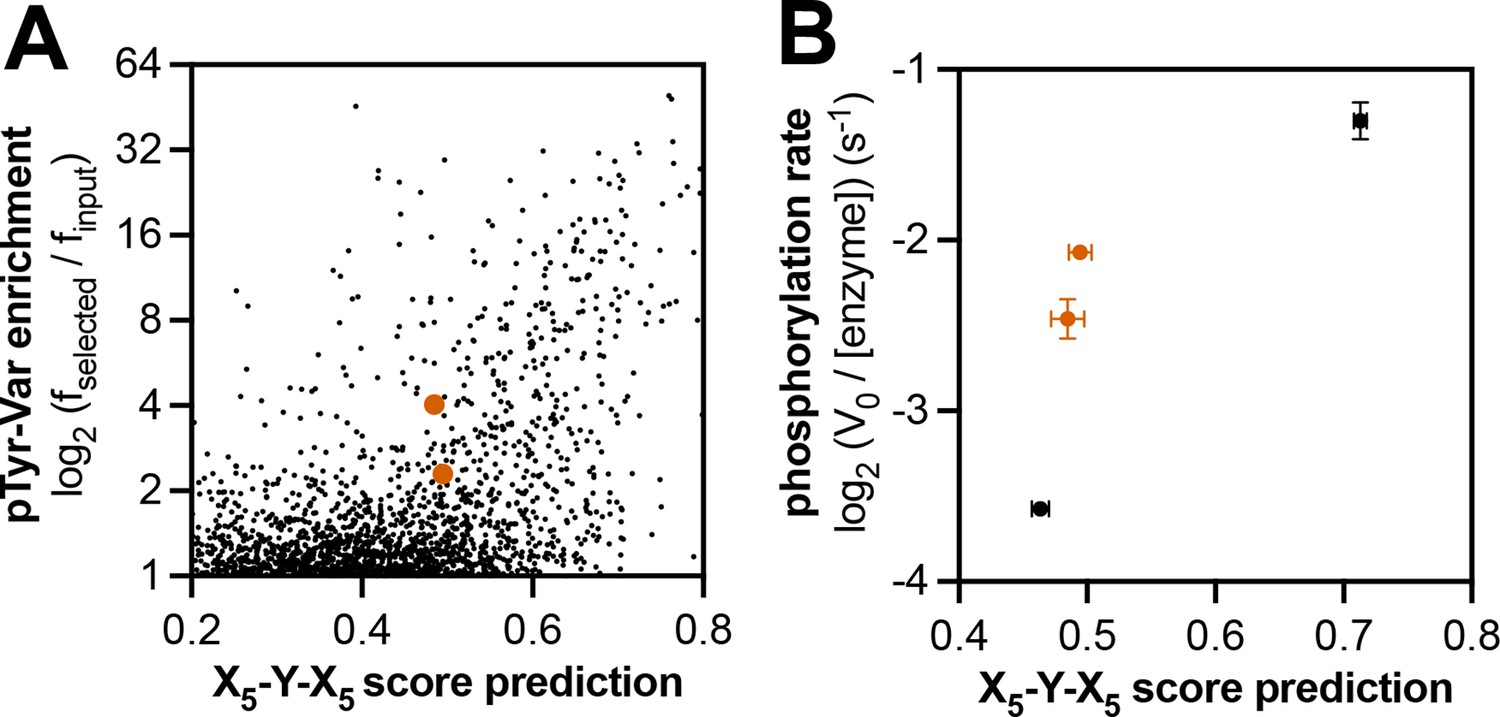
Predicting relative phosphorylation rates using data from X5-Y-X5 library screens.
(A) Correlation between measured phosphorylation rates and X5-Y-X5 predictions for 12 peptides with c-Src. All peptides were used at a concentration of 100 μM, and c-Src was used at a concentration of 500 nM. Error bars represent the standard deviation from at least three rate measurements and three separate scores with individual replicates of the X5-Y-X5 screen. (B) Correlation between the magnitude of mutational effects for 6 peptide pairs with mutational effects predicted from X5-Y-X5 library screens. Error bars represent the standard deviation of at least three rate measurements and three separate scores with individual replicates of the X5-Y-X5 screen.
Figure 3—figure supplement 1
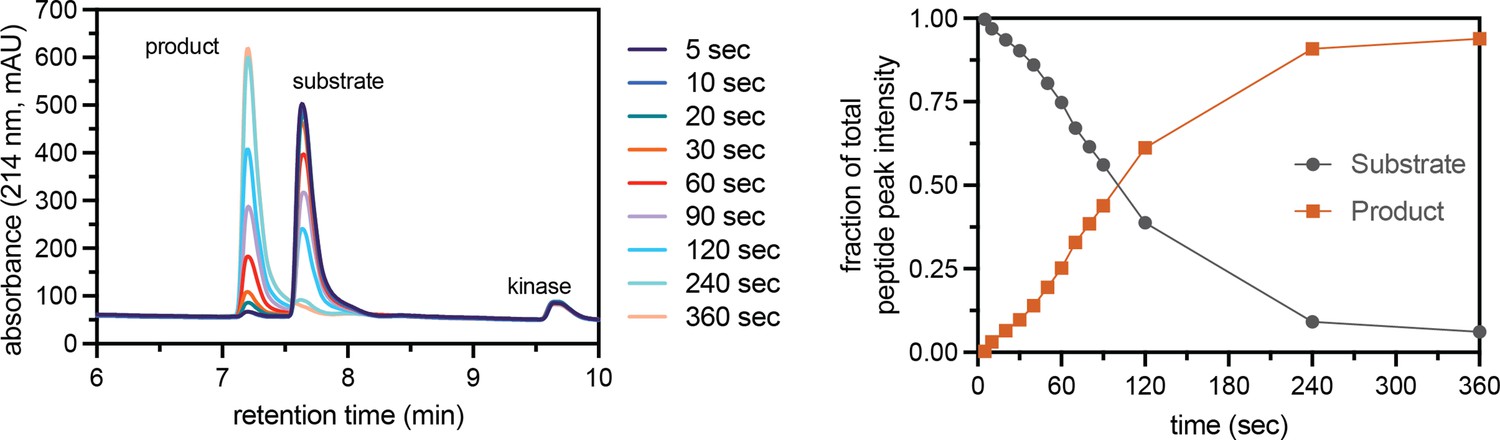
Assay to measure peptide phosphorylation rates using reverse-phase HPLC.
Phosphorylation of the CDK5_Y15 peptide (100 μM) by c-Src (500 nM), monitored by RP-HPLC of selected time points. The HPLC chromatogram shows the formation of a phosphorylated species over time, with concomitant loss of the unphosphorylated peptide (left). The area under the two peaks in the chromatogram were quantified and plotted for each time point (right). Initial phosphorylation rates were extracted by fitting a line to the first few timepoints.
Figure 4 with 9 supplements
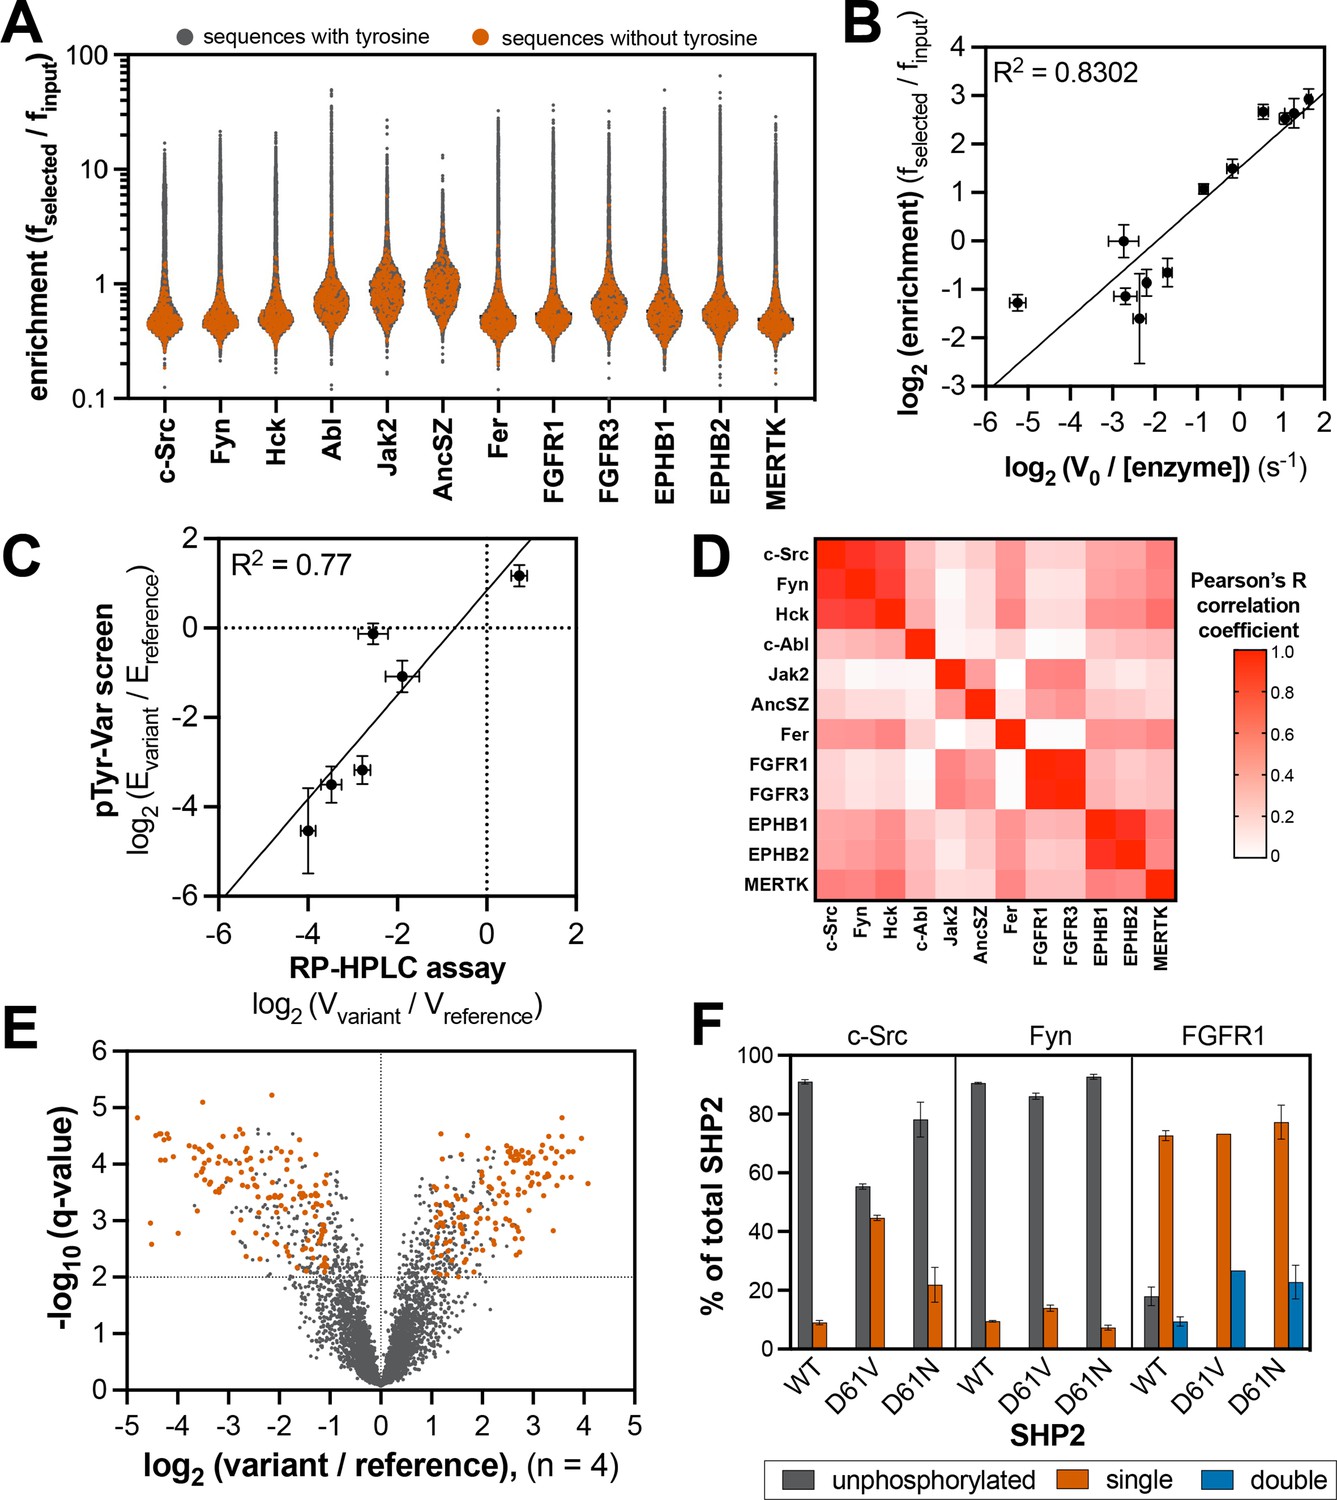
Specificity profiling of tyrosine kinases using the pTyr-Var library.
(A) Distribution of enrichment scores from pTyr-Var screens with 13 tyrosine kinases. Each point represents a peptide sequence in the pTyr-Var library. Data points in orange-red represent sequences without a Tyr residue and data points in dark gray represent sequences with a Tyr residue. Each dataset represents the average of three to five replicates. (B) Correlation between enrichment scores and measured phosphorylation rates for 12 peptides (100 μM) with c-Src (500 nM). (C) Correlation between the magnitude of mutational effects for 6 peptide pairs in the pTyr-Var library with mutational effects measured using an in vitro kinetic assay. Error bars in panels B and C represent the standard deviation from 3 to 4 rate measurements and four pTyr-Var screens. (D) Matrix of Pearson’s correlation coefficients for all pairwise comparisons between replicate-averaged pTyr-Var datasets for 13 kinases. (E) Volcano plot depicting mutational effects in the pTyr-Var screen with c-Src kinase domain. Data points represent the average of four replicates. Hits are colored orange-red. (F) Percent phosphorylation of SHP2 wild-type, D61V, and D61N (10 μM) after an hour incubation with c-Src, Fyn, and FGFR1 (1 μM). Error bars represent the standard deviation from 2 to 3 measurements.
-
Figure 4—source data 1
Enrichment scores from tyrosine kinase pTyr-Var screens.
Data are provided in a flat sheet with average and standard deviation values for all kinase-substrate pairs. Data are also provided for each kinase as a side-by-side comparison of enrichment scores reference and variant sequences and whether the mutation was considered a significant in our analysis. Three sheets are provided listing substrates for c-Src, Fyn, and c-Abl that are also found in a curated list of kinase-substrate pairs in the PhosphositePlus database.
- https://cdn.elifesciences.org/articles/82345/elife-82345-fig4-data1-v2.xlsx
-
Figure 4—source data 2
Position-specific amino acid enrichment matrices from the tyrosine kinase pTyr-Var library screens for sequences containing a single central tyrosine residue.
- https://cdn.elifesciences.org/articles/82345/elife-82345-fig4-data2-v2.xlsx
Figure 4—figure supplement 1
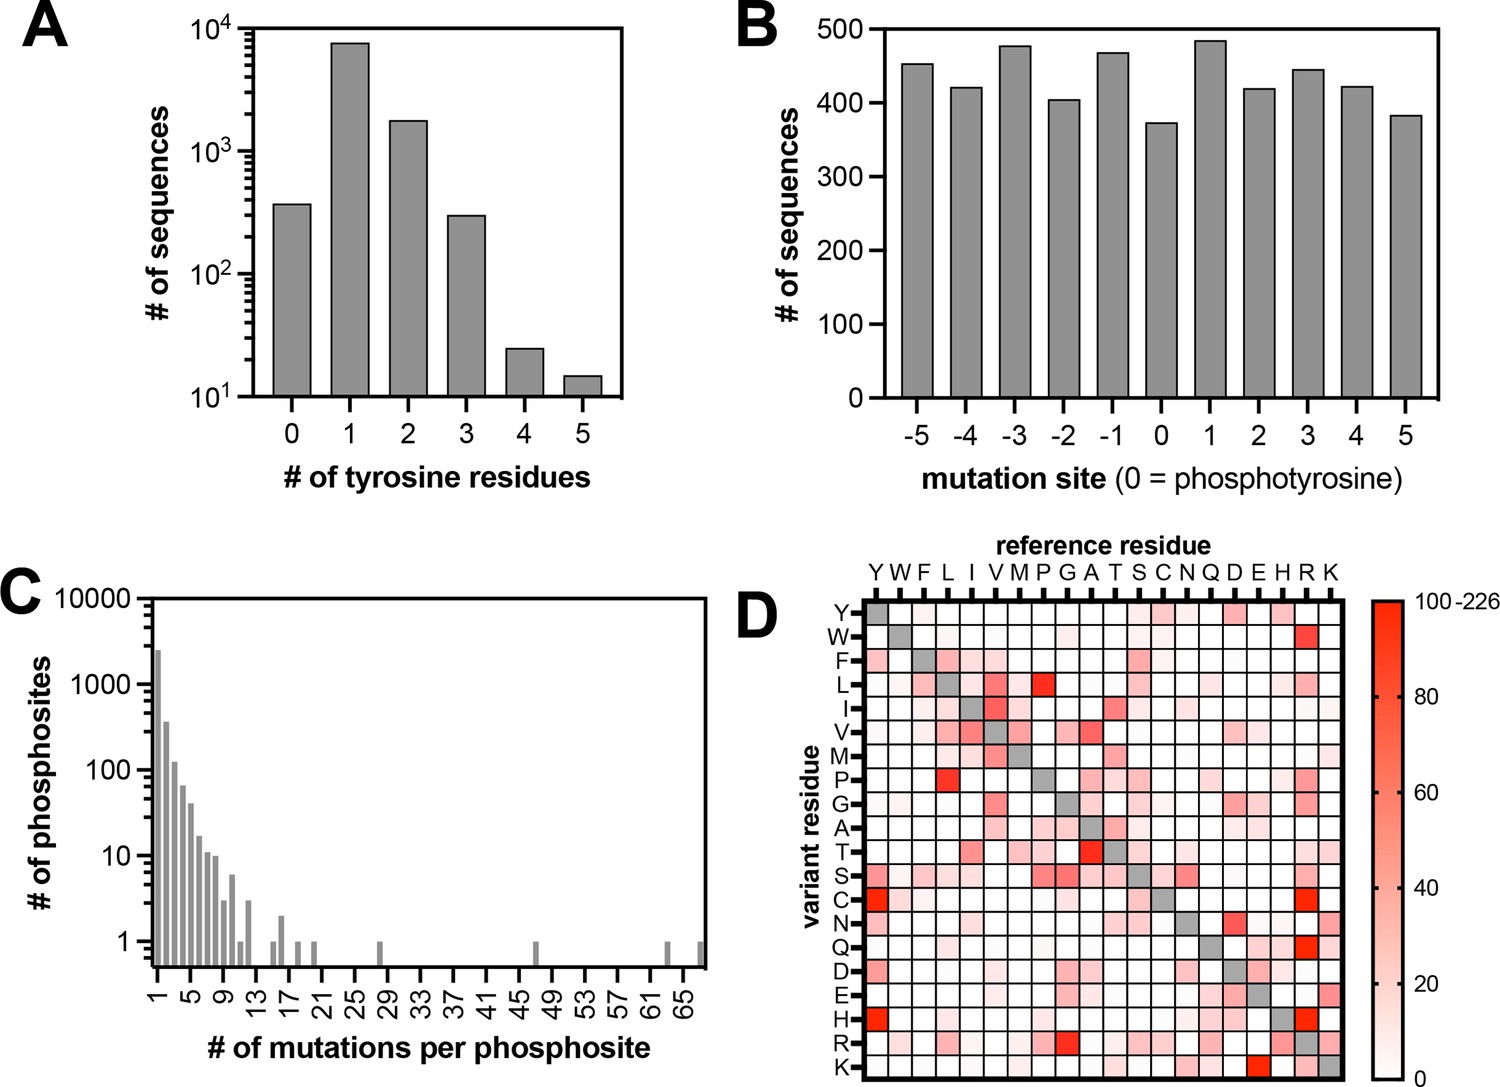
Properties of the pTyr-Var library.
(A) Frequency of sequences in the library with different numbers of tyrosine residues. (B) Positions of mutations across the library relative to the central tyrosine (zero-position). (C) Frequency of substitutions associated with each phosphosite. (D) Abundance of each possible amino acid substitution across the library.
Figure 4—figure supplement 2
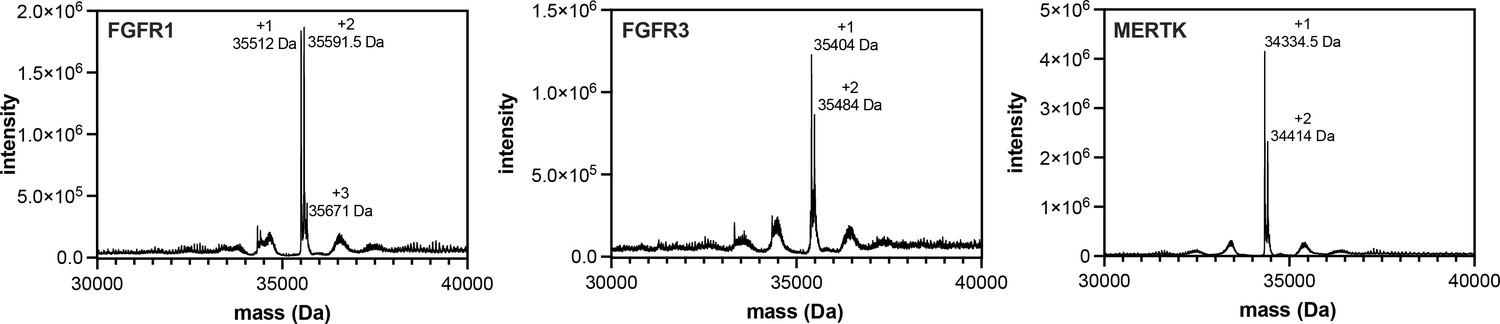
Pre-activation of FGFR1, FGFR3, and MERTK by auto-phosphorylation.
Kinases (25 μM) were incubated with ATP (5 mM) in a magnesium-containing neutral pH buffer for 0.5–2 hr, then desalted and concentrated to remove excess ATP. Proteins were analyzed by electrospray-ionization mass spectrometry. The envelope of multiply-charged states was deconvoluted using the instrument software, and the deconvoluted spectra are shown. The number of phosphorylation events on each kinase is labeled.
Figure 4—figure supplement 3
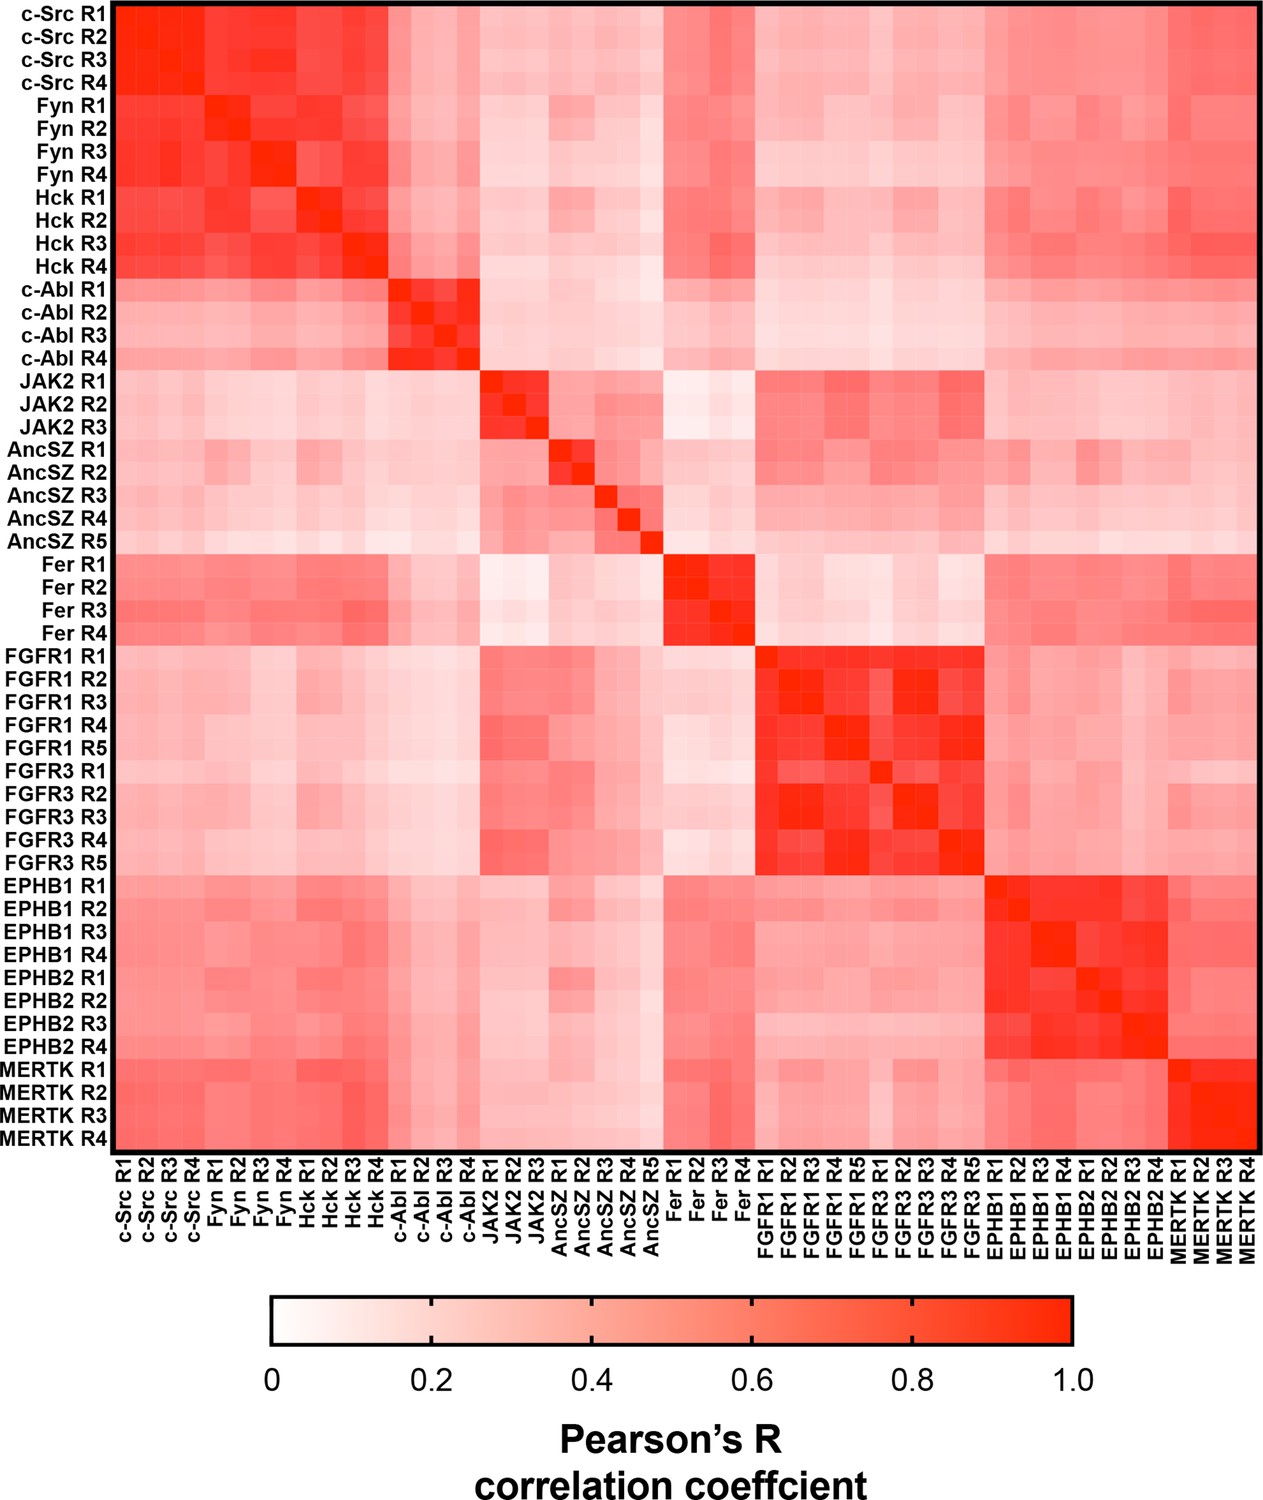
Matrix of Pearson’s correlation coefficients for all replicates of pTyr-Var screens across all 12 kinases.
Figure 4—figure supplement 4
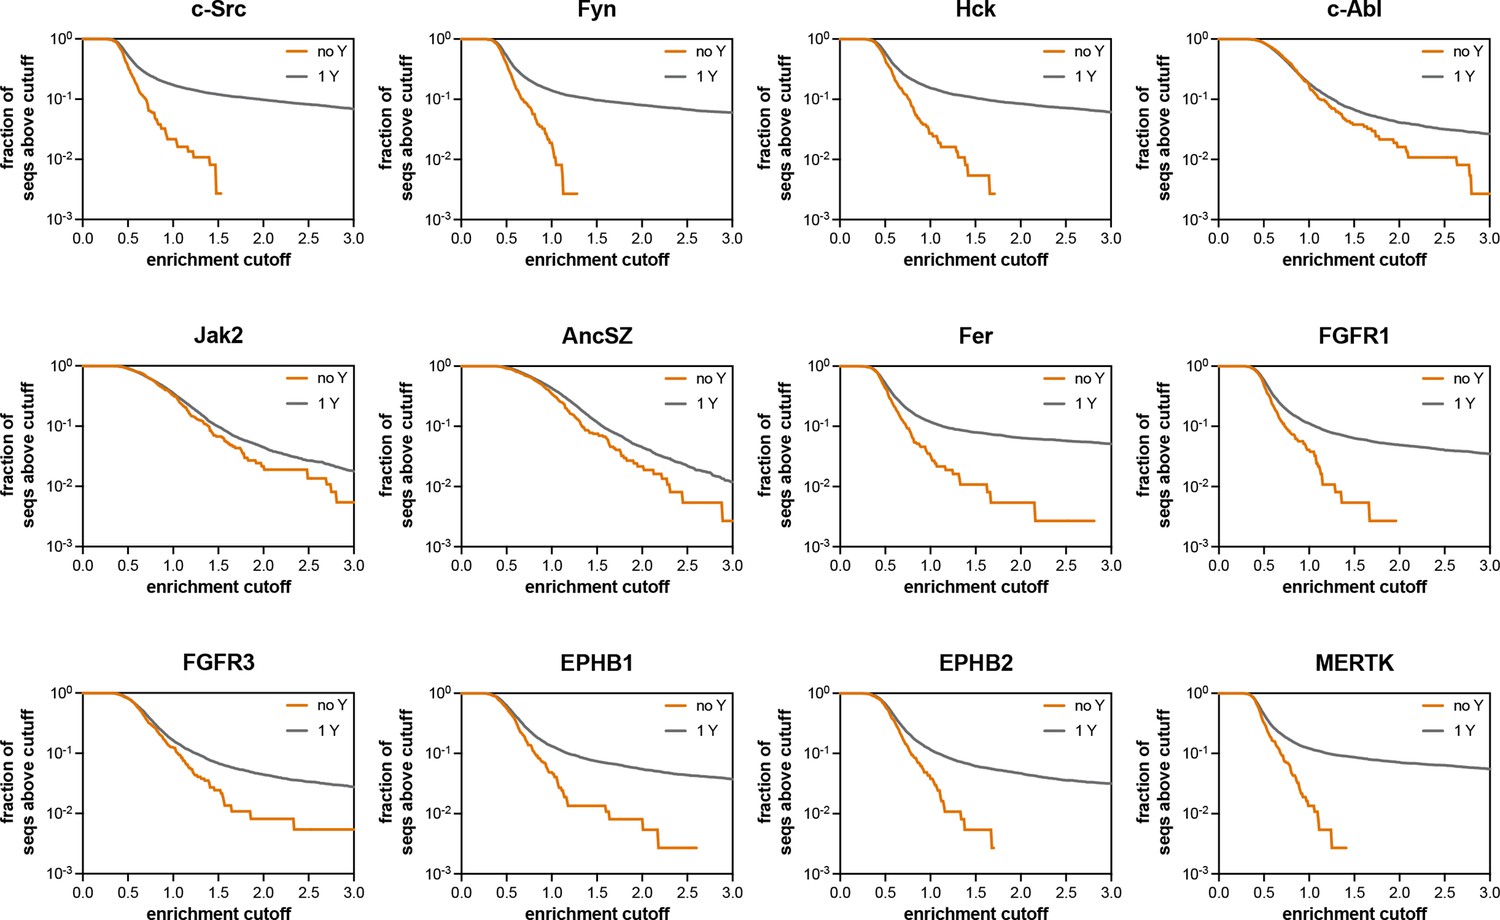
Assessment of the extent of enrichment in pTyr-Var screens with 12 kinases.
These graphs assess what fraction of the sequences containing no Tyr residue (out of 370 sequences) and what fraction of the sequences containing 1 Tyr residue (out of 7468 sequences) have an enrichment score above the cutoff value indicated on the x-axis.
Figure 4—figure supplement 5
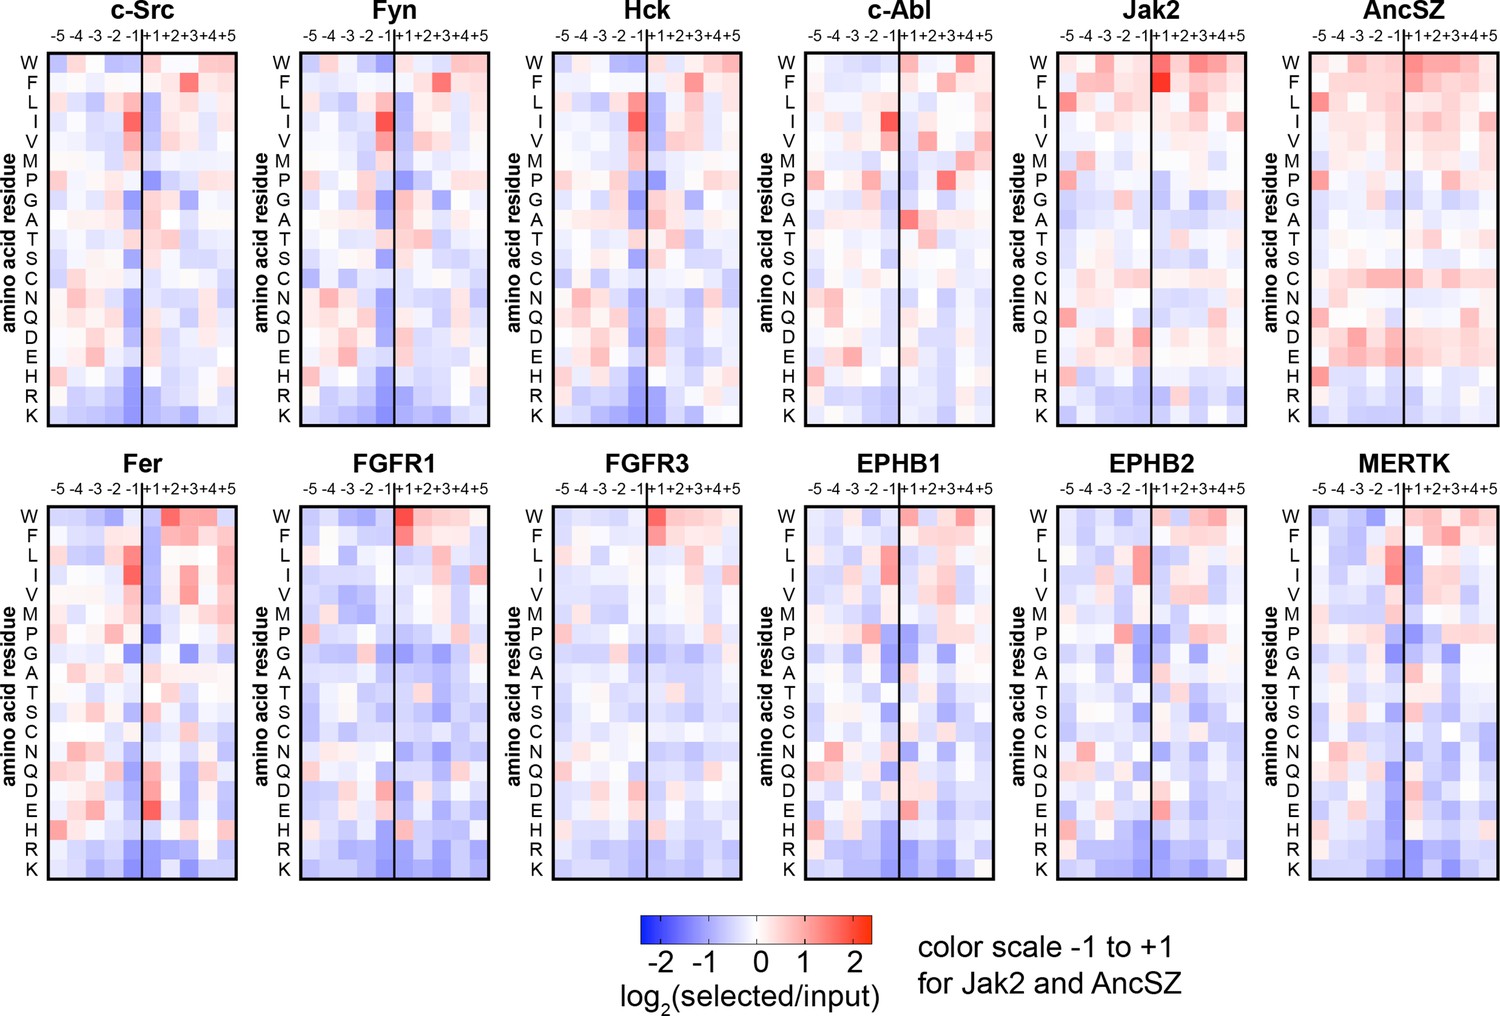
Heatmaps depicting the position-specific amino acid preferences for 12 tyrosine kinase domains, extracted from screens with the pTyr-Var library.
Only sequences with a single central tyrosine were considered in this analysis. Position-specific amino acid enrichment scores were calculated by taking the average log2-transformed enrichment of every sequence with that particular feature. Values are displayed on a color scale from blue (disfavored sequence features, negative value), to white (neutral sequence features, near zero value), to red (favored sequence features, positive value). Values in the heatmaps are the average of three to five replicates.
Figure 4—figure supplement 6
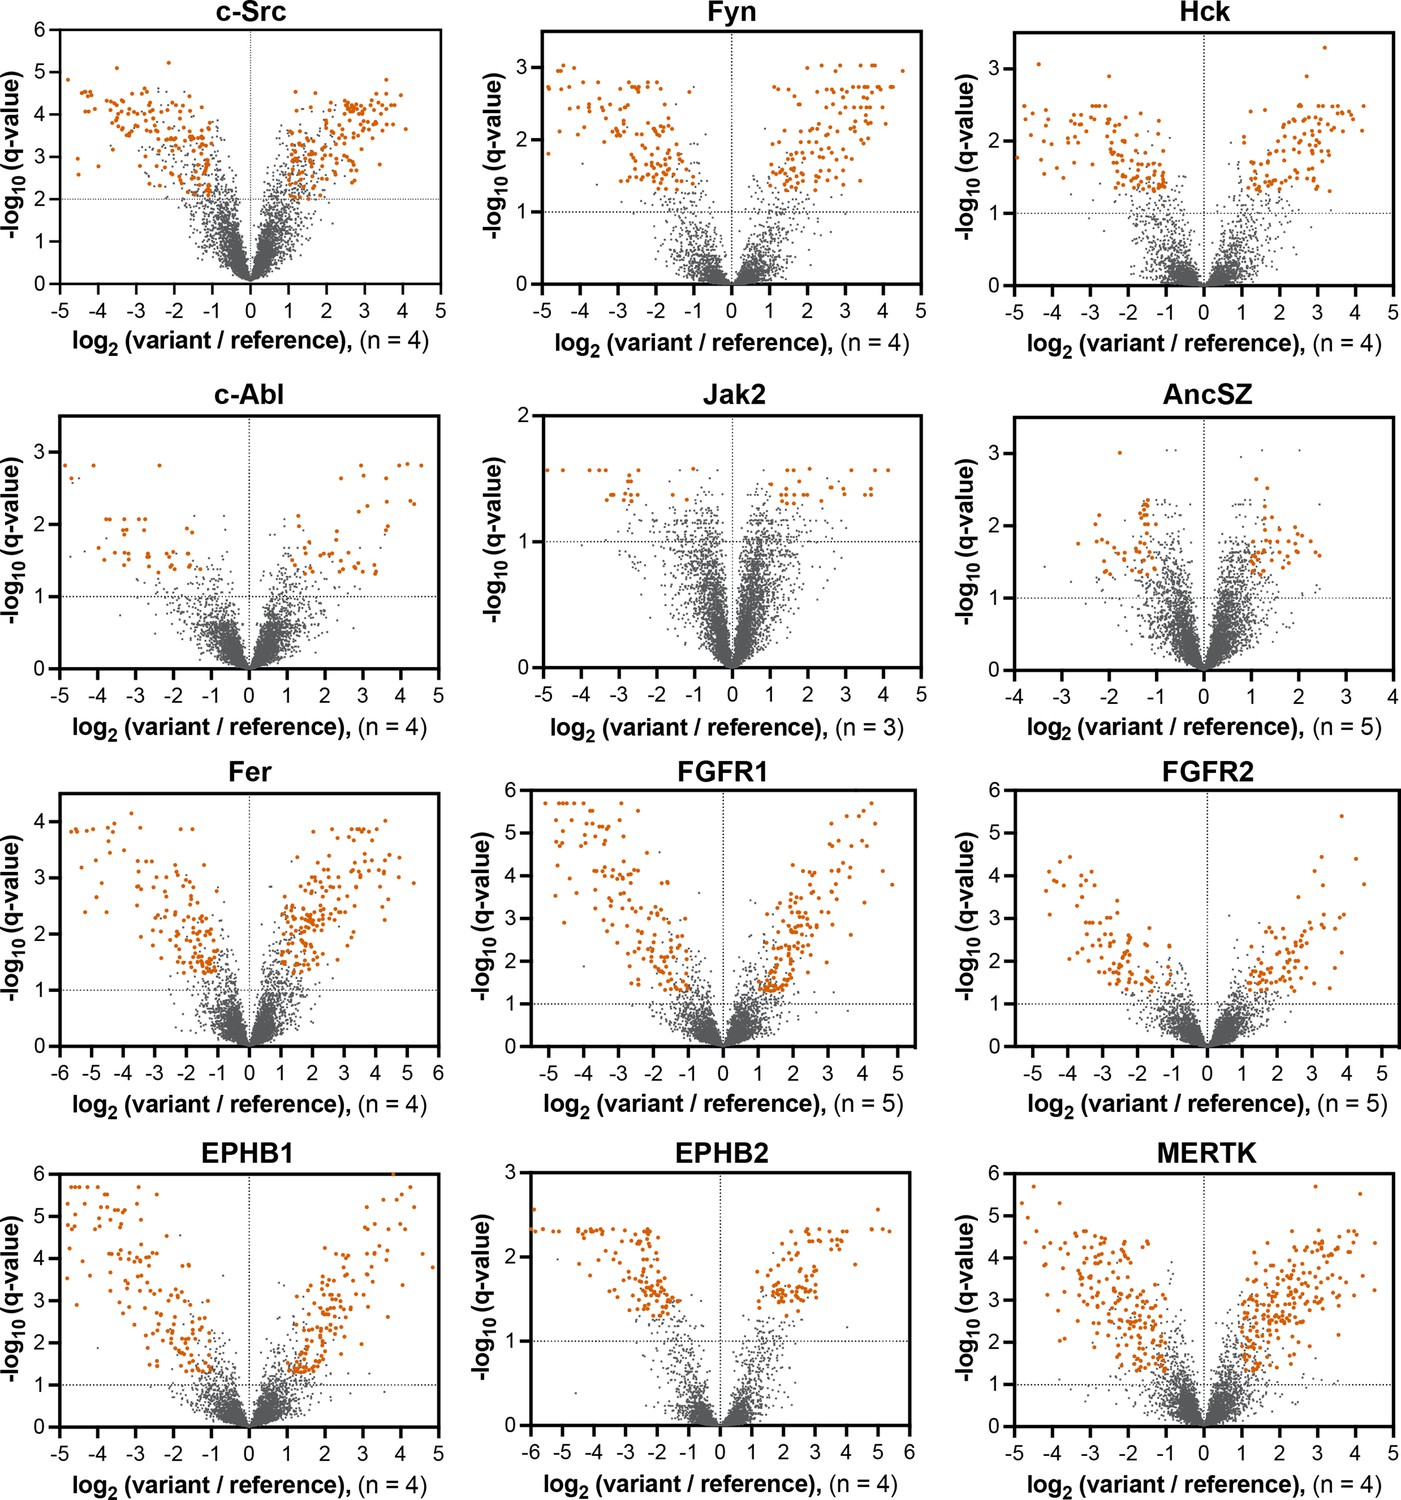
Volcano plots depicting mutational effects in the pTyr-Var screen for 12 kinase domains.
Datasets are the average of three to five replicates. Significant hits are colored in orange-red.
Figure 4—figure supplement 7
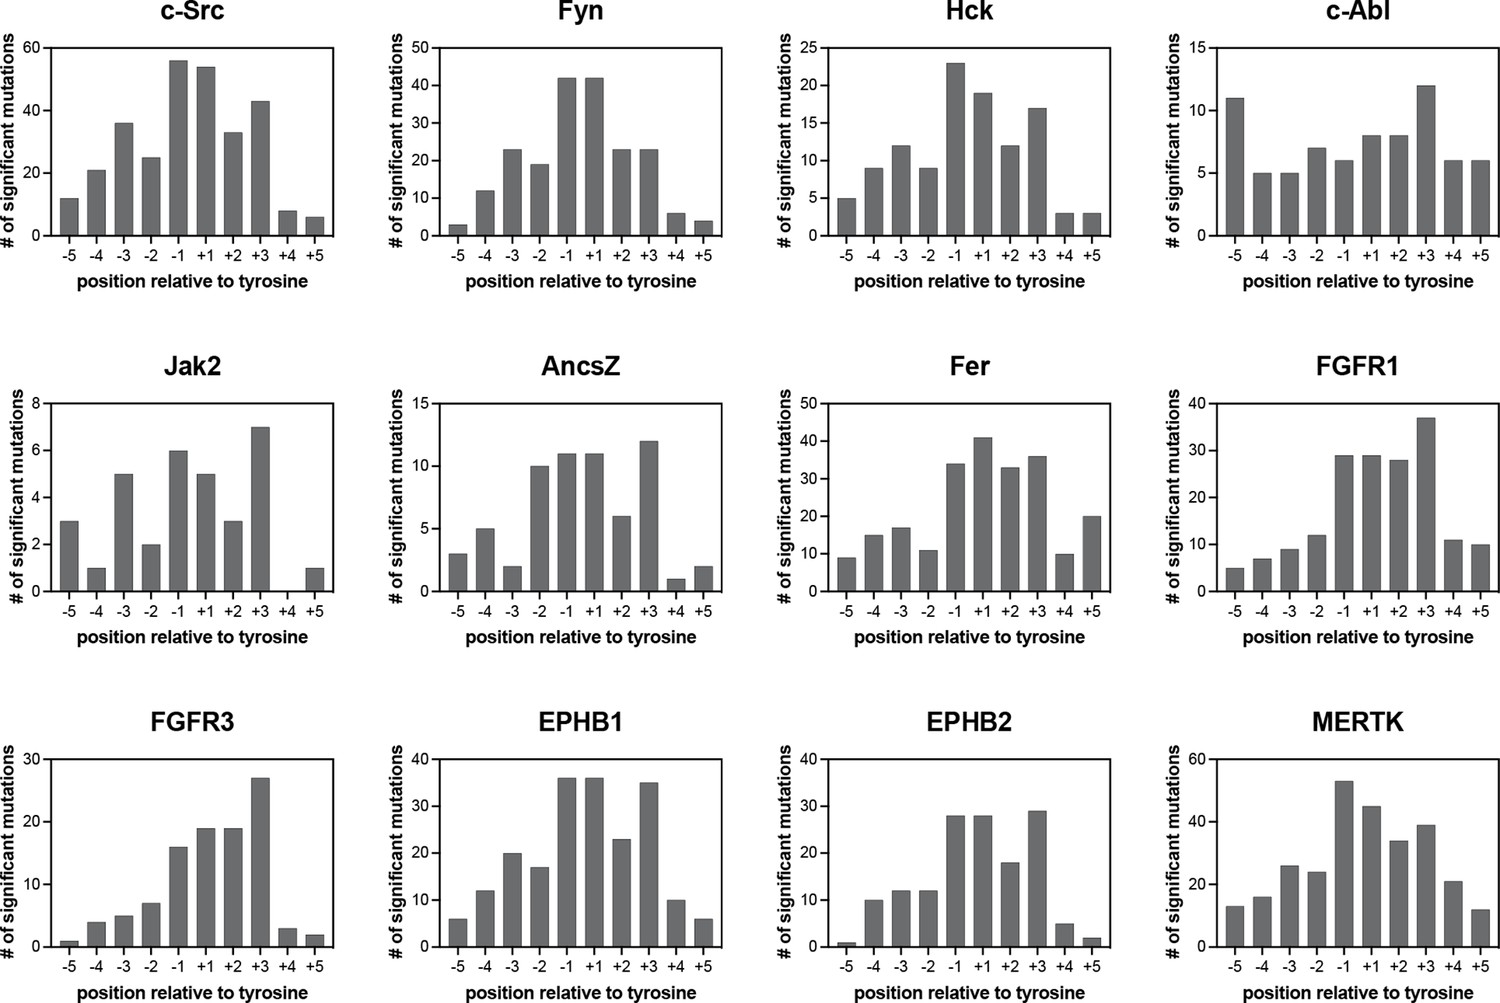
Number of significant mutations for each kinase at each position surrounding the central tyrosine residue.
Mutations that added or removed a tyrosine residue were excluded from these counts.
Figure 4—figure supplement 8
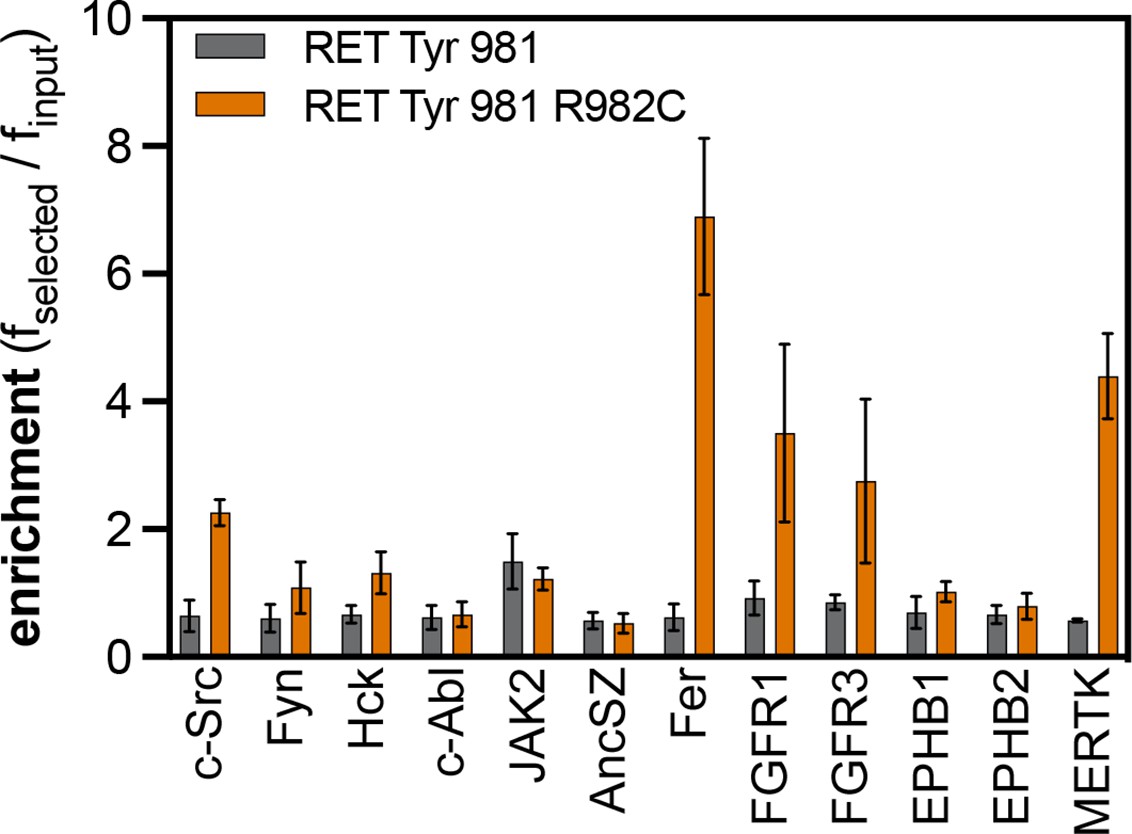
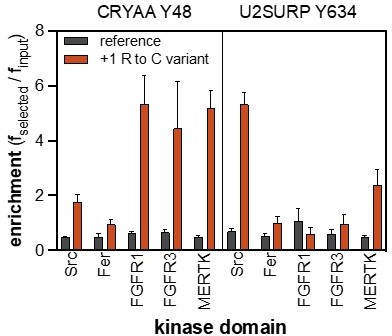
Enrichment scores from pTyr-Var screens for phosphorylation of the RET Tyr 981 reference and variant (R982C) peptides by 12 tyrosine kinases.
Error bars represent the standard deviations from three to five replicates.
Figure 4—figure supplement 9
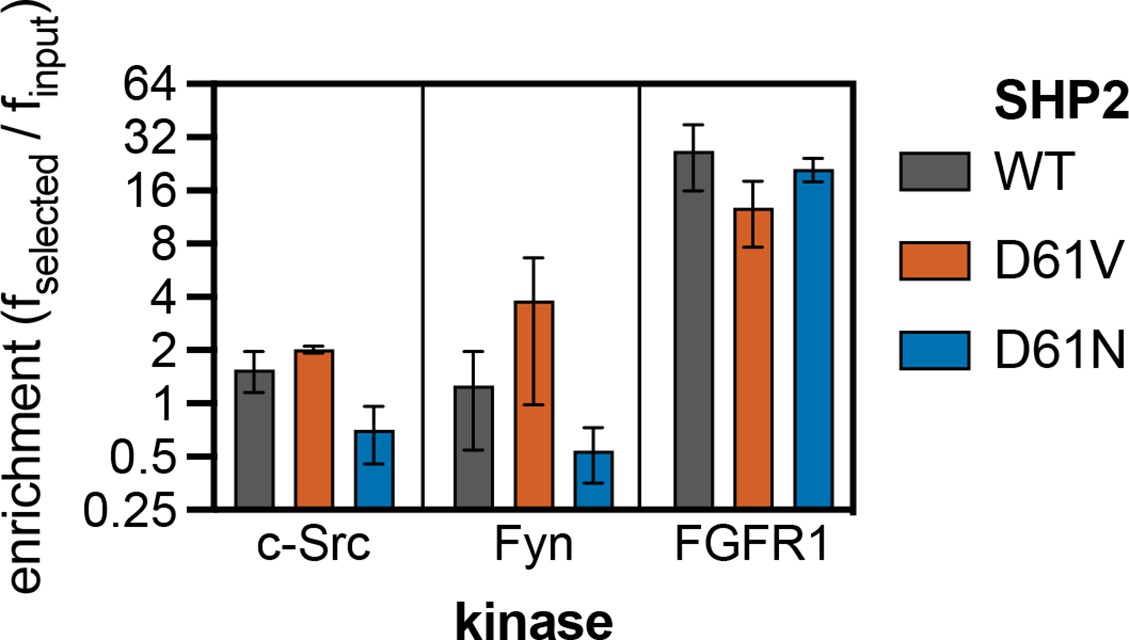
Enrichment scores from pTyr-Var screens for phosphorylation of SHP2 Y62 reference and variant (D61N and D61V) peptides by c-Src, Fyn, and FGFR1.
Error bars represent the standard deviations from three to five replicates.
Figure 5 with 2 supplements
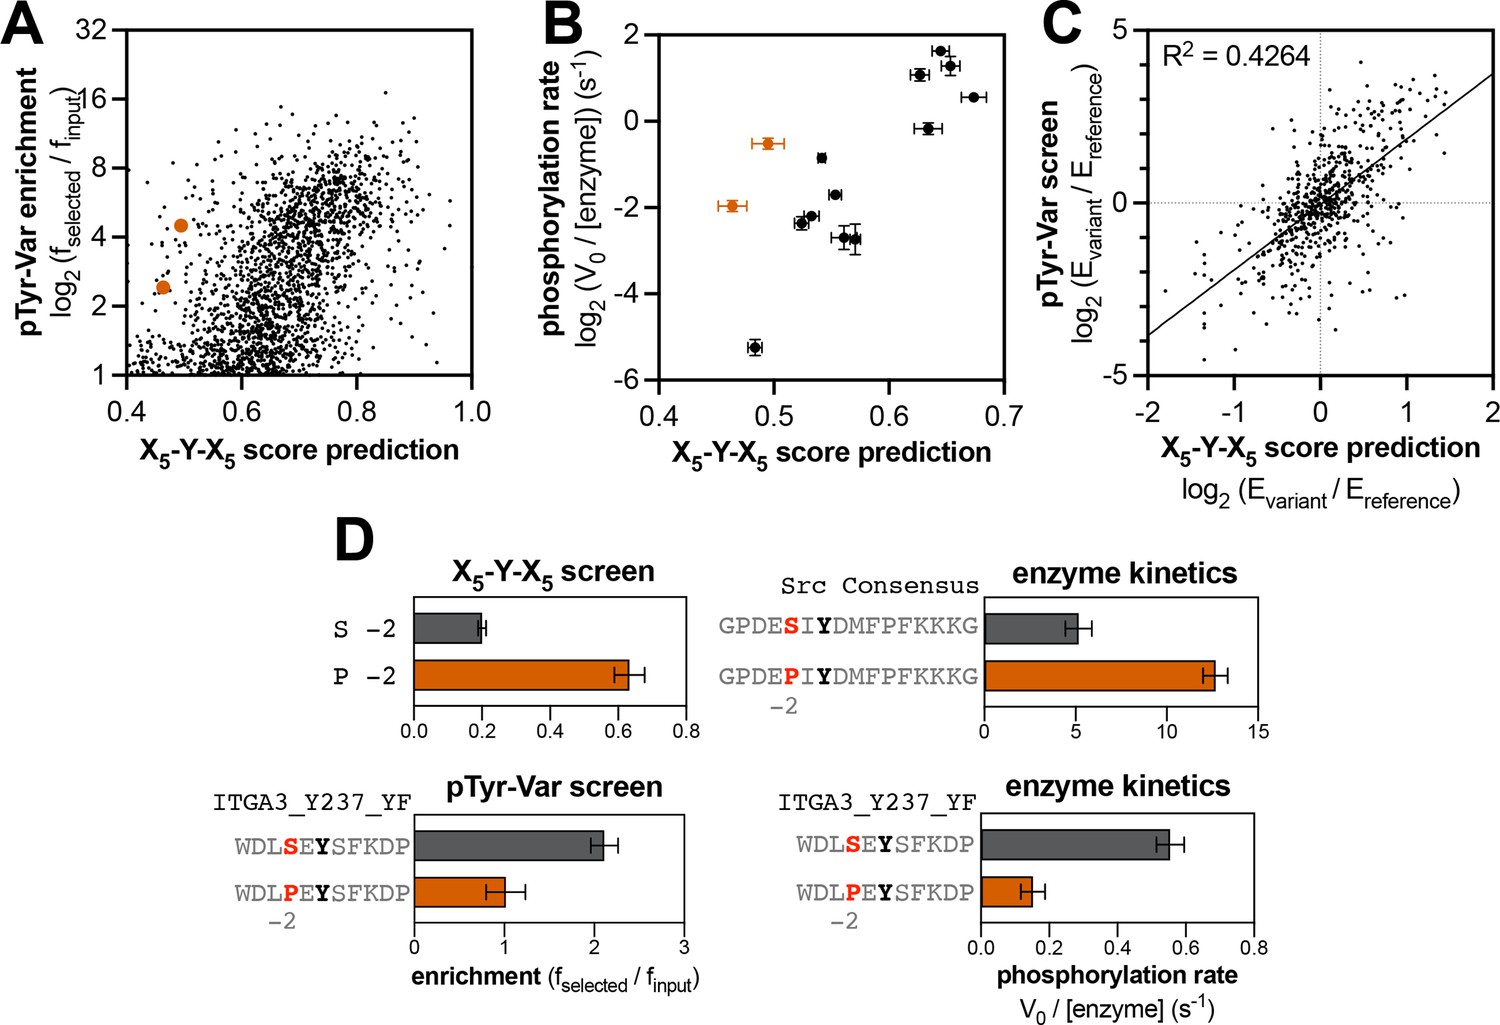
Context-dependent effects of tyrosine kinase recognition.
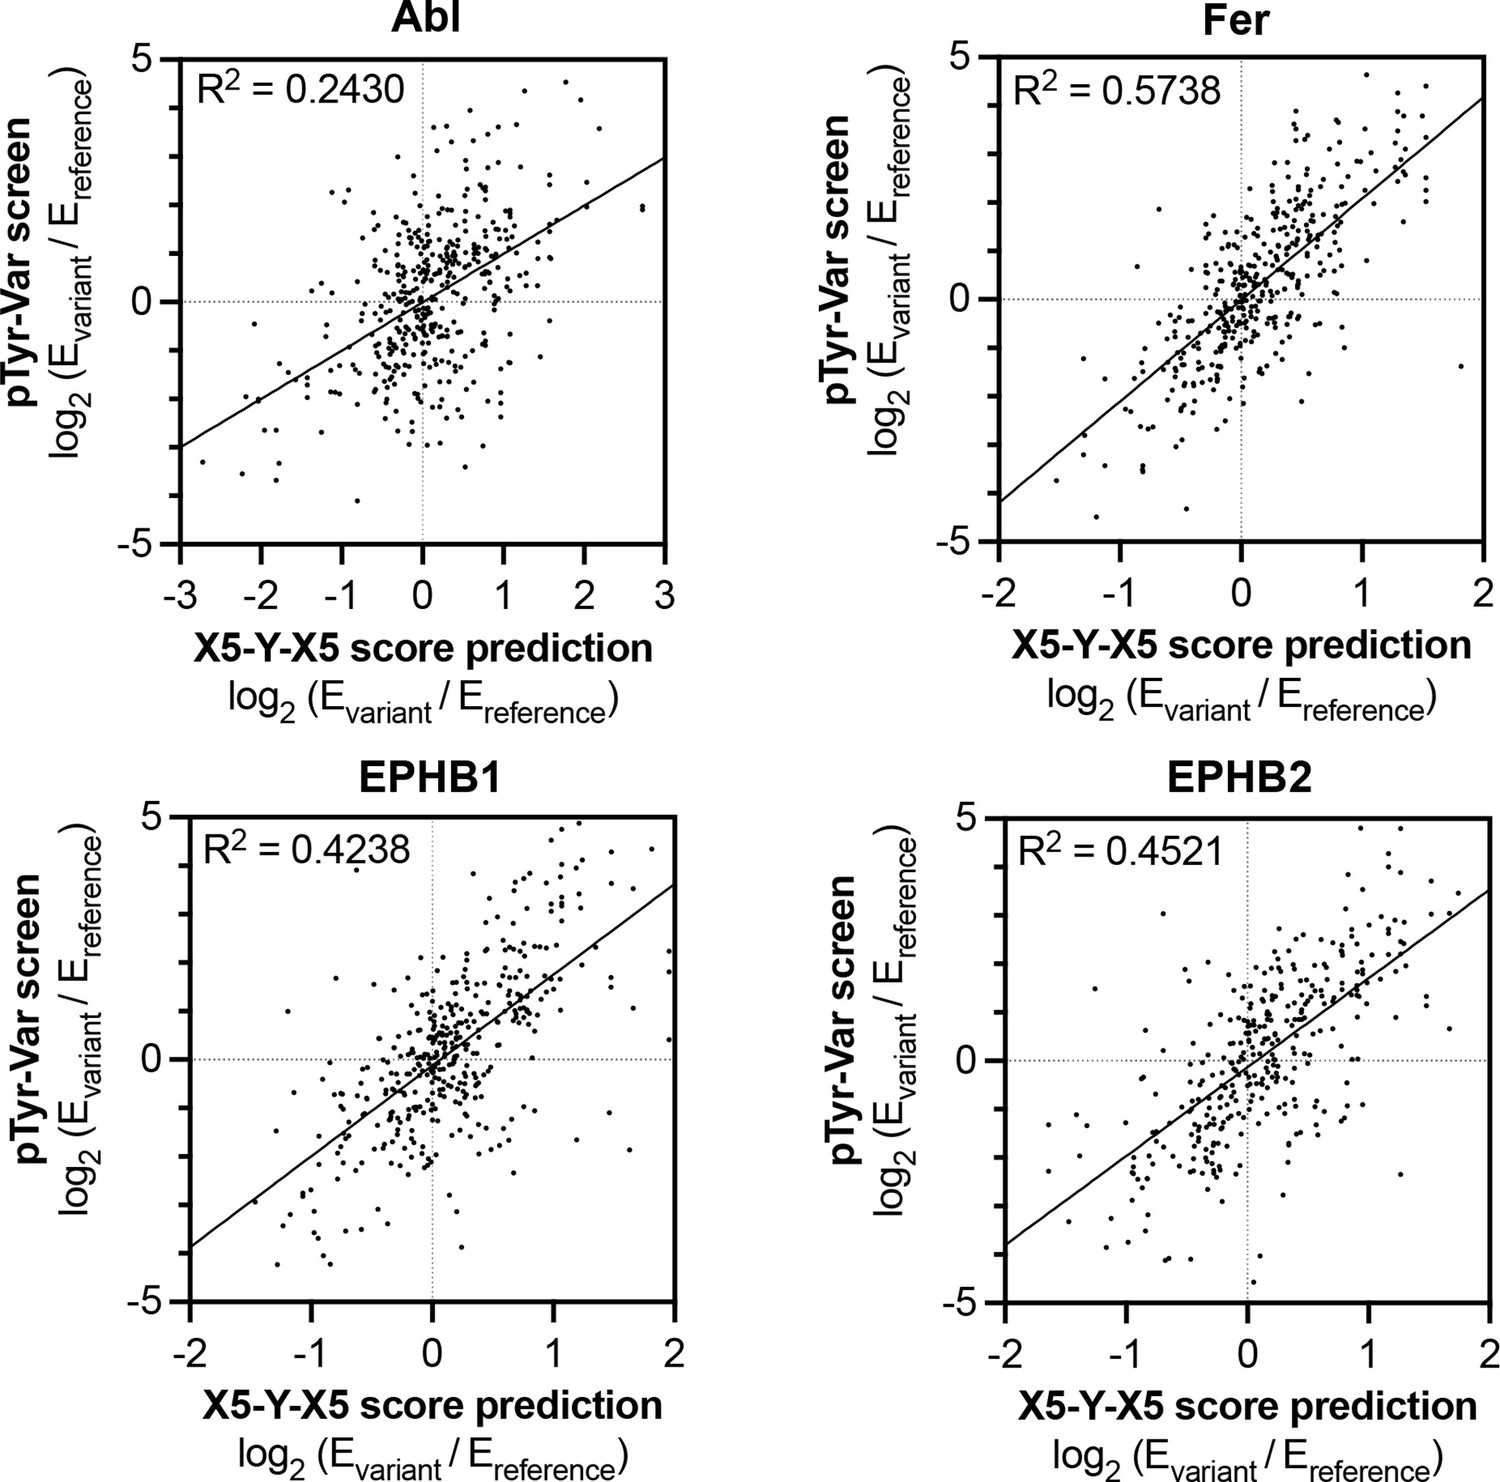
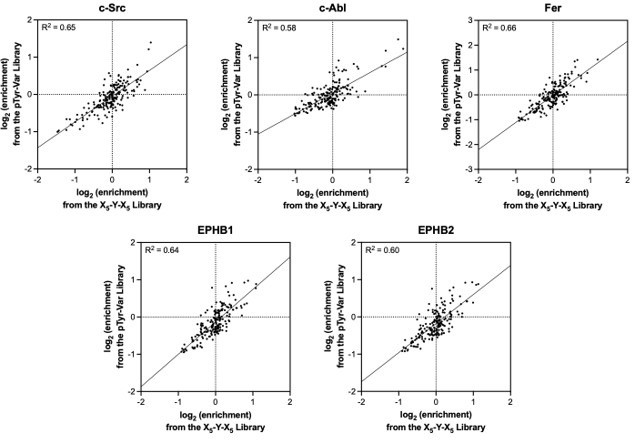
(A) Correlation of enrichment scores measured for c-Src in the pTyr-Var library screen with scores predicted from the X5-Y-X5 library using a position-specific scoring matrix. (B) Correlation between predicted scores and measured phosphorylation rates for 14 peptides (100 μM) with c-Src (500 nM). Peptides that could not be accurately scored by the X5-Y-X5 data are highlighted in orange. (C) Correlation of variant effects measured in the pTyr-Var library screen with those predicted from the X5-Y-X5 library screen for c-Src. Several points lie in the top-left and bottom-right quadrants, indicating a discrepancy between the measured mutational effect in the pTyr-Var screen and the predicted mutational effect from the X5-Y-X5 screen. (D) Effects of serine-to-proline substitution at the –2 position in various assays with c-Src. The left panels show the enrichment levels of –2 serine and proline in the X5-Y-X5 screen (top), and the effect of a –2 serine to proline substitution in a specific peptide in the pTyr-Var screen, (bottom). The right panels show rate measurements using the RP-HPLC assay for the same substitution in the Src consensus peptide (top) and the peptide from the pTyr-Var screen (bottom).
-
Figure 5—source data 1
Peptide sequences and their phosphorylation rates by c-Src or c-Abl, measured using the RP-HPLC kinetic assay.
- https://cdn.elifesciences.org/articles/82345/elife-82345-fig5-data1-v2.xlsx
-
Figure 5—source data 2
Mutational effects measured from the pTyr-Var library screens and their corresponding predictions based on the X5-Y-X5 library screening data.
Only those sequence pairs with high-quality sequencing data (read counts >100) and a single central tyrosine were included in the analysis.
- https://cdn.elifesciences.org/articles/82345/elife-82345-fig5-data2-v2.xlsx
Figure 5—figure supplement 1
Context-dependent effects of c-Abl substrate recognition.
(A) Correlation of enrichment scores measured for c-Abl in the pTyr-Var library screen with scores predicted from the X5-Y-X5 library using a position-specific scoring matrix. (B) Correlation between predicted scores and measured phosphorylation rates for 4 peptides (100 μM) with c-Abl (500 nM). Peptides that showed significant enrichment in the pTyr-Var screen but lower than expected scores from the X5-Y-X5 data are highlighted in orange.
Figure 5—figure supplement 2
Correlation of variant effects measured in the pTyr-Var library screen with those predicted from the X5-Y-X5 library screen for c-Abl, Fer, EPHB1, and EPHB2.
Several points lie in the top-left and bottom-right quadrant, indicating a discrepancy between the measured mutational effect in the pTyr-Var screen and the predicted mutational effect from the X5-Y-X5 screen.
Figure 6 with 8 supplements
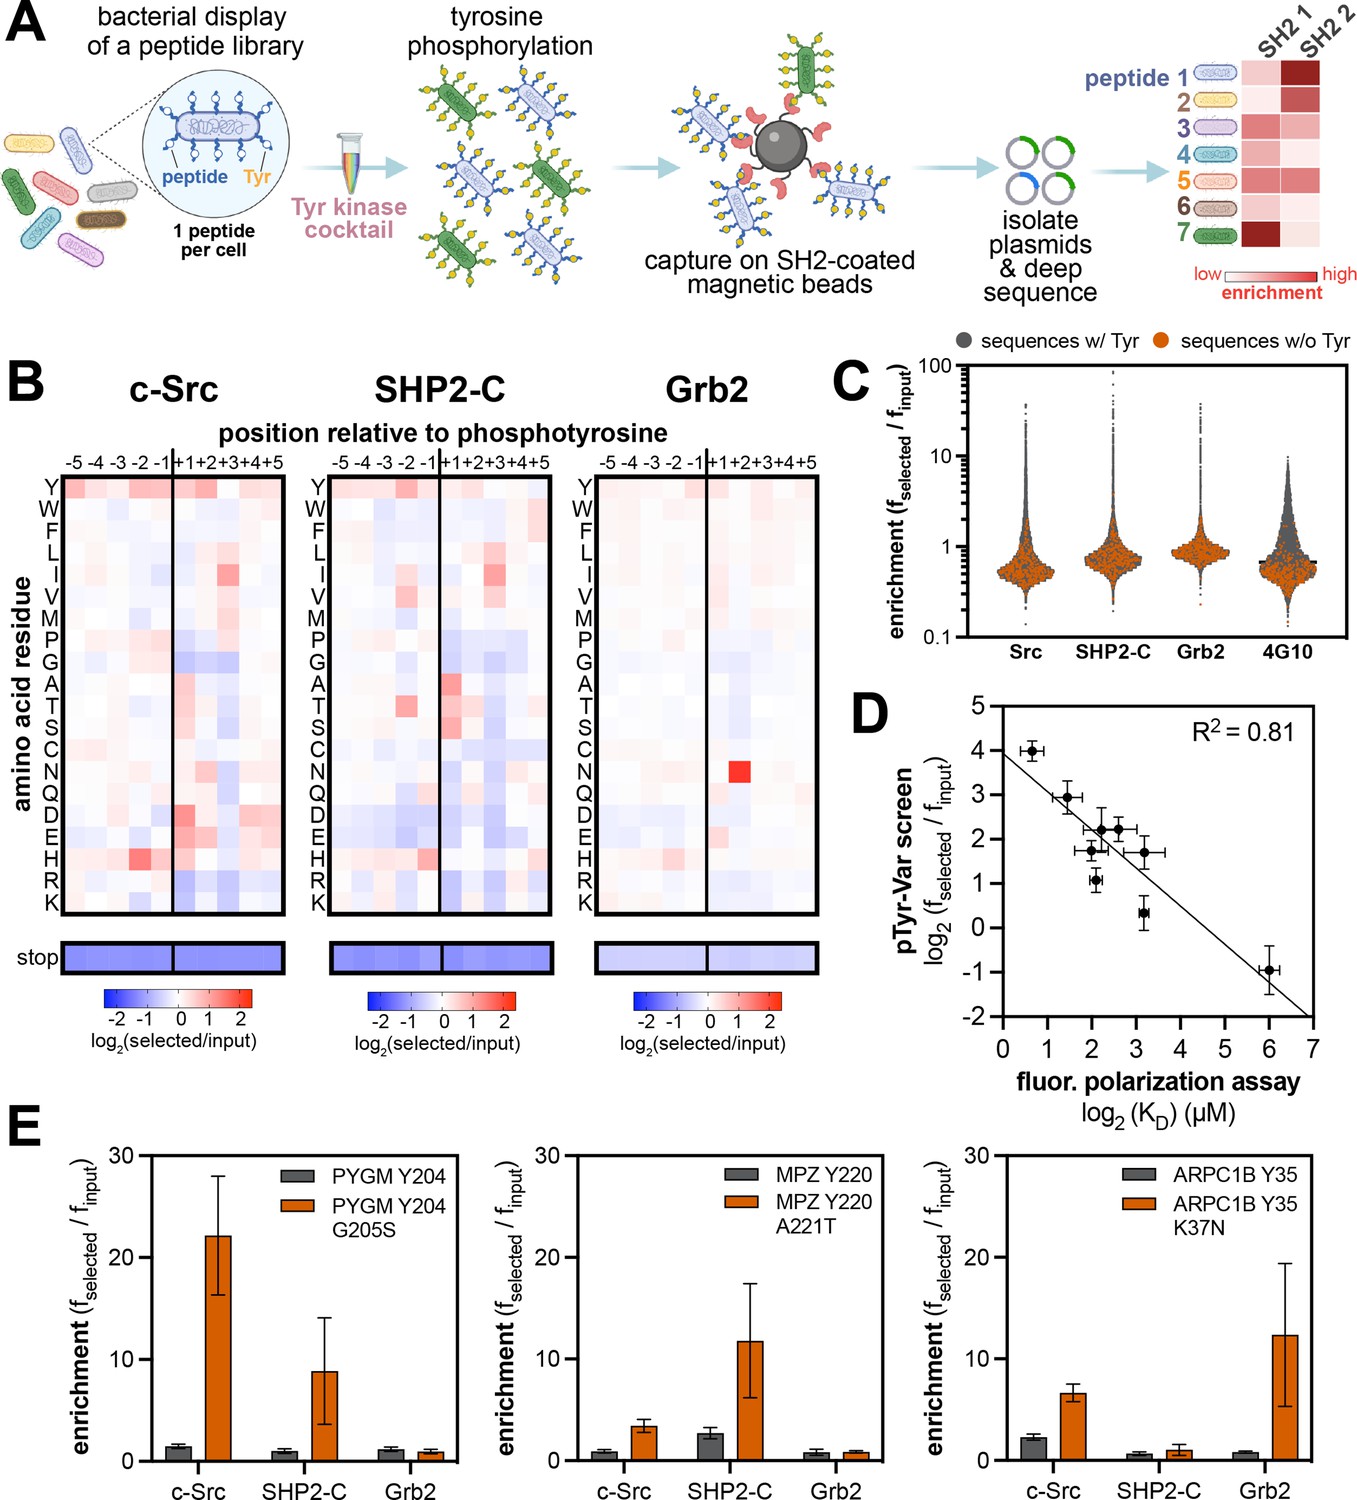
High-throughput profiling of SH2 domain ligand specificity using bacterial peptide display.
(A) Schematic representation of the workflow for SH2 domain specificity profiling. (B) Heatmaps depicting the specificities of the c-Src, SHP2-C, and Grb2 SH2 domains, measured using the X5-Y-X5 library. Enrichment scores were log2-transformed and are displayed on a color scale from blue (disfavored), to white (neutral), to red (favored). Values in the heatmaps are the average of three replicates. (C) Distribution of enrichment scores from pTyr-Var screens with three SH2 domains and the pan-phosphotyrosine antibody 4G10 Platinum. Each point represents a peptide sequence in the library. The antibody selection was done similar to the kinase screens, with antibody labeling of cells, followed by bead-based enrichment, as opposed to cell enrichment with antibody-saturated beads. Each dataset represents the average of three replicates. (D) Correlation between enrichment scores for 9 peptides from the pTyr-Var screen and binding affinities measured using a fluorescence polarization assay. Error bars represent the standard deviations from three screens or binding measurements. (E) Examples of phosphosite-proximal mutations that selectively enhance binding to specific SH2 domains. Error bars represent the standard deviations from three screens.
-
Figure 6—source data 1
Position-specific amino acid enrichment matrices from the SH2 domain X5-Y-X5 library screens.
Matrices calculated with and without inclusion of multi-tyrosine sequences are provided.
- https://cdn.elifesciences.org/articles/82345/elife-82345-fig6-data1-v2.xlsx
-
Figure 6—source data 2
Enrichment scores from SH2 domain pTyr-Var screens.
Data are provided in a flat sheet with average and standard deviation values for all SH2-ligand pairs. Data are also provided for each SH2 domain as a side-by-side comparison of enrichment scores reference and variant sequences and whether the mutation was considered a significant in our analysis.
- https://cdn.elifesciences.org/articles/82345/elife-82345-fig6-data2-v2.xlsx
-
Figure 6—source data 3
Position-specific amino acid enrichment matrices from the SH2 domain pTyr-Var library screens for sequences containing a single central tyrosine residue.
- https://cdn.elifesciences.org/articles/82345/elife-82345-fig6-data3-v2.xlsx
Figure 6—figure supplement 1
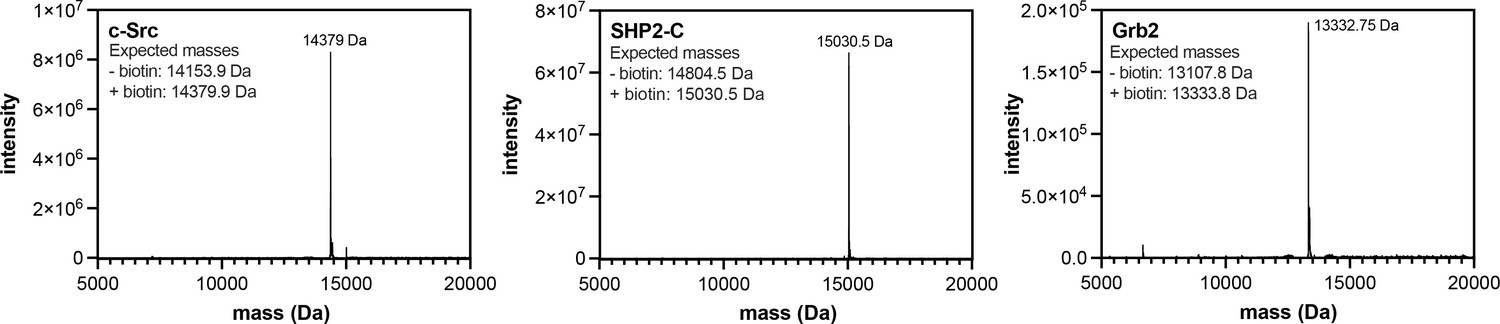
Mass spectrometry analysis of biotinylated SH2 domains.
Proteins were analyzed by electrospray-ionization mass spectrometry. The envelope of multiply-charged states was deconvoluted using the instrument software, and the deconvoluted spectra are shown.
Figure 6—figure supplement 2
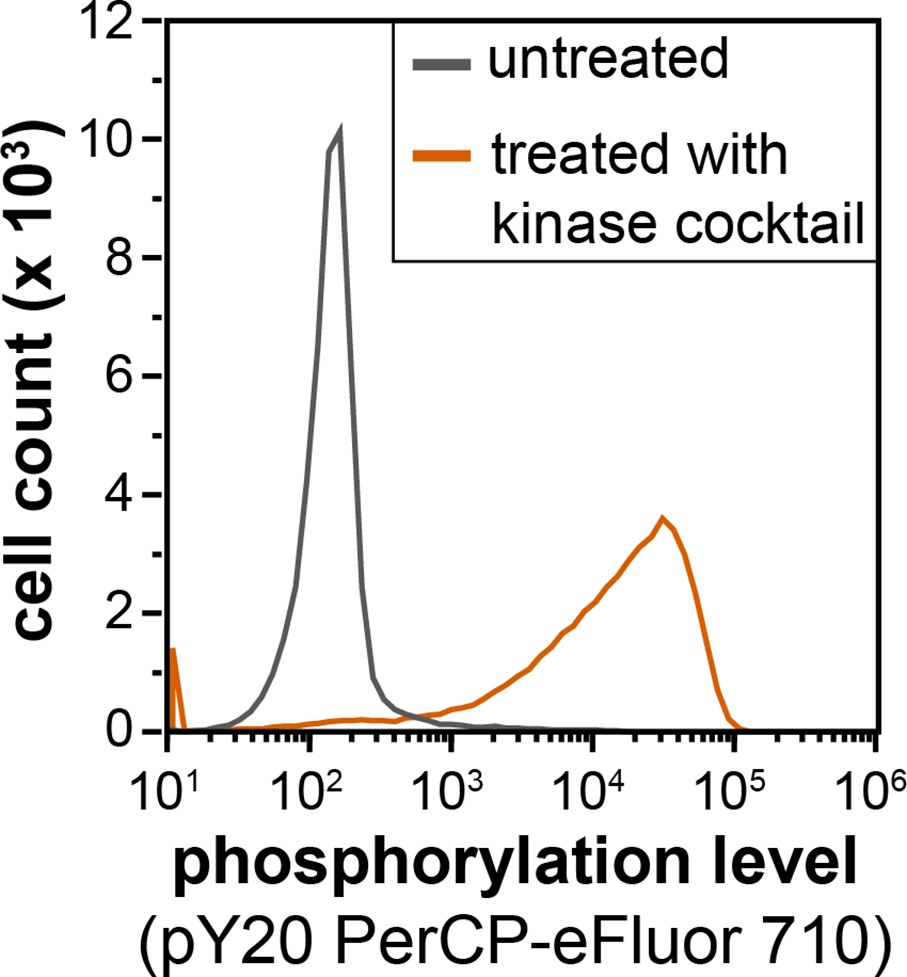
Flow cytometry analysis of library phosphorylation by a cocktail of tyrosine kinases.
Cells displaying the X5-Y-X5 library were treated with a kinase cocktail containing c-Src, c-Abl, AncSZ, and EPHB1 for 3 hr, then labeled with a pan-phosphotyrosine antibody (PY20 PerCP-eFluor 710) and analyzed by flow cytometry.
Figure 6—figure supplement 3
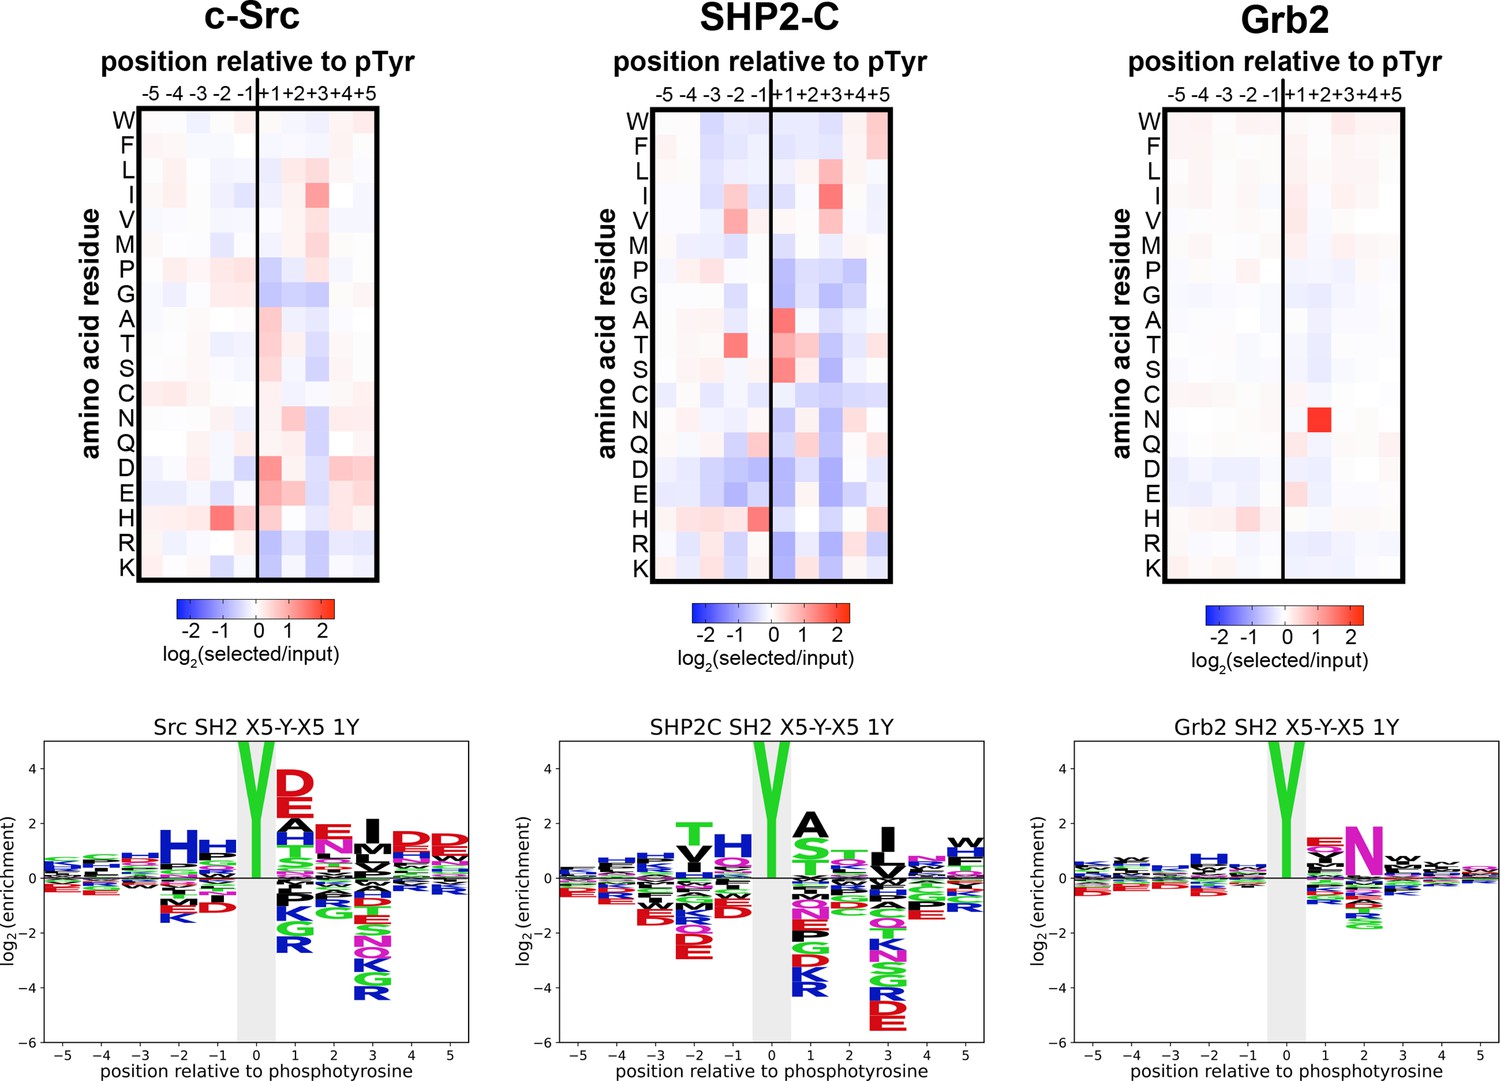
Heatmaps and logos depicting the specificities of the c-Src, SHP2-C, and Grb2 SH2 domains, measured using the X5-Y-X5 library.
Only peptides with one central tyrosine were considered in this analysis. Enrichment scores were log2-transformed and are displayed on a color scale from blue (disfavored sequence features, negative value), to white (neutral sequence features, near zero value), to red (favored sequence features, positive value). The same values were used to plot the heatmaps and the sequence logos. The height for the central ‘Y’ in the sequence logos is an arbitrary value, chosen for optimal visualization of other features. Values are the average of three replicates.
Figure 6—figure supplement 4
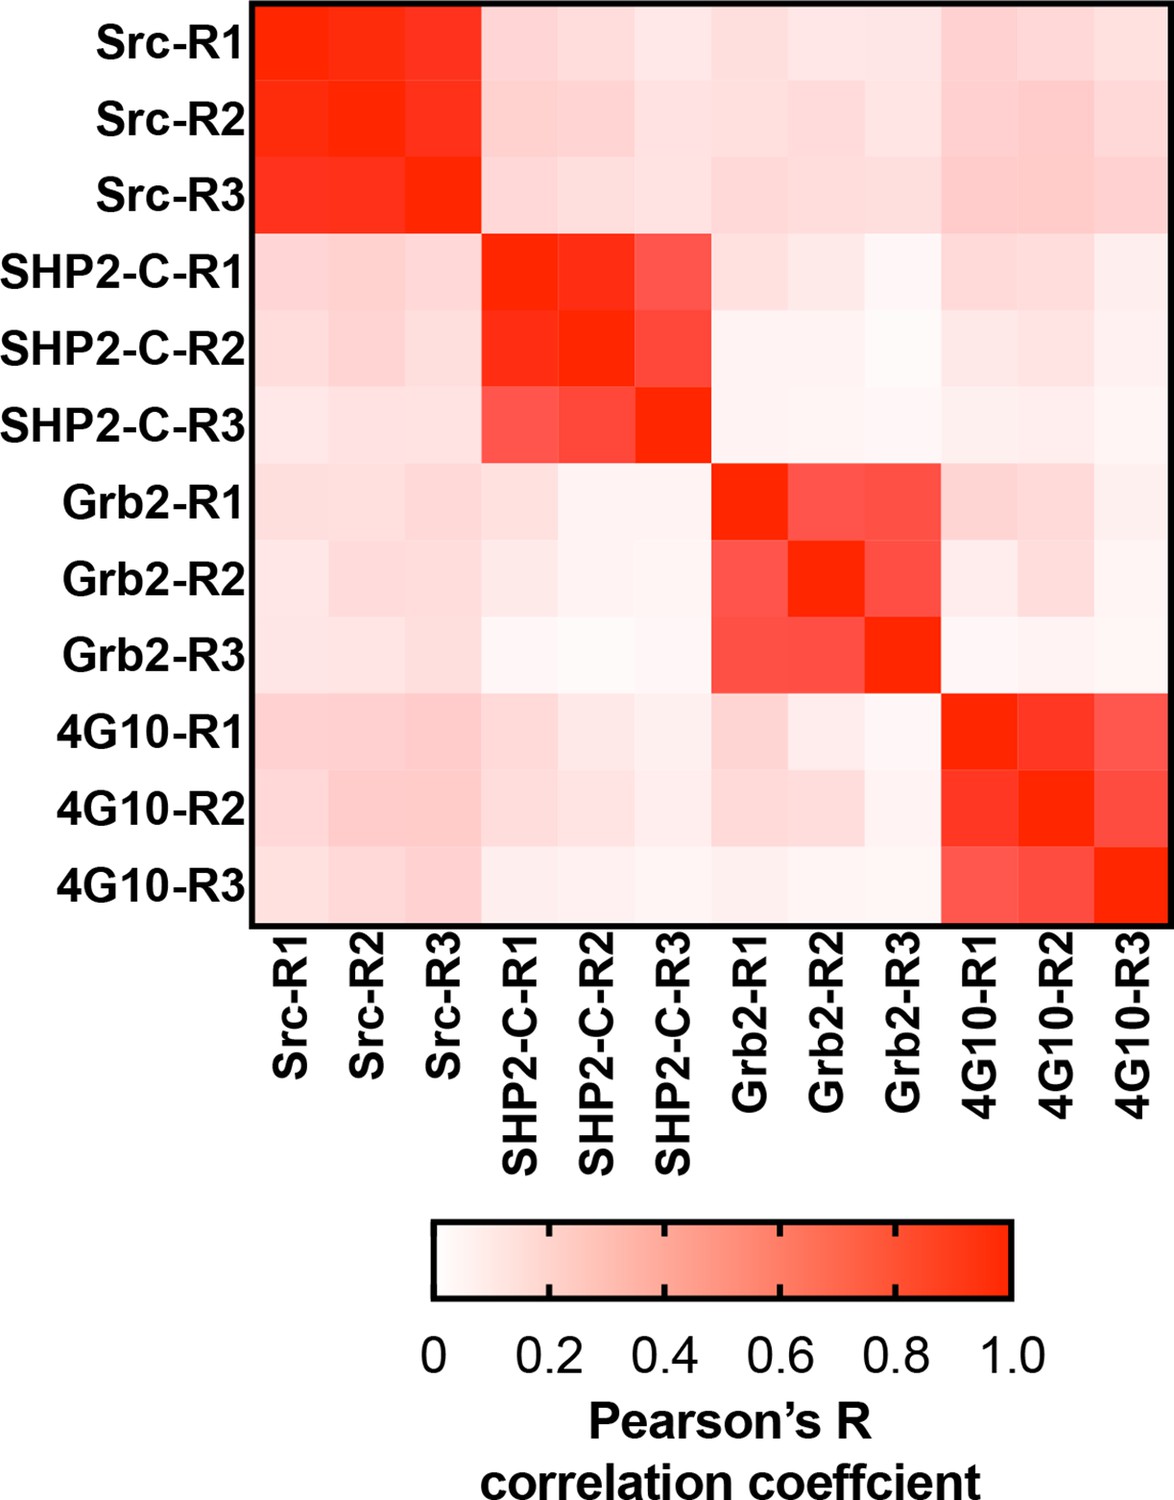
Matrix of Pearson’s correlation coefficients for all replicates of pTyr-Var screens across all 3 SH2 domains and 4G10 platinum.
Figure 6—figure supplement 5
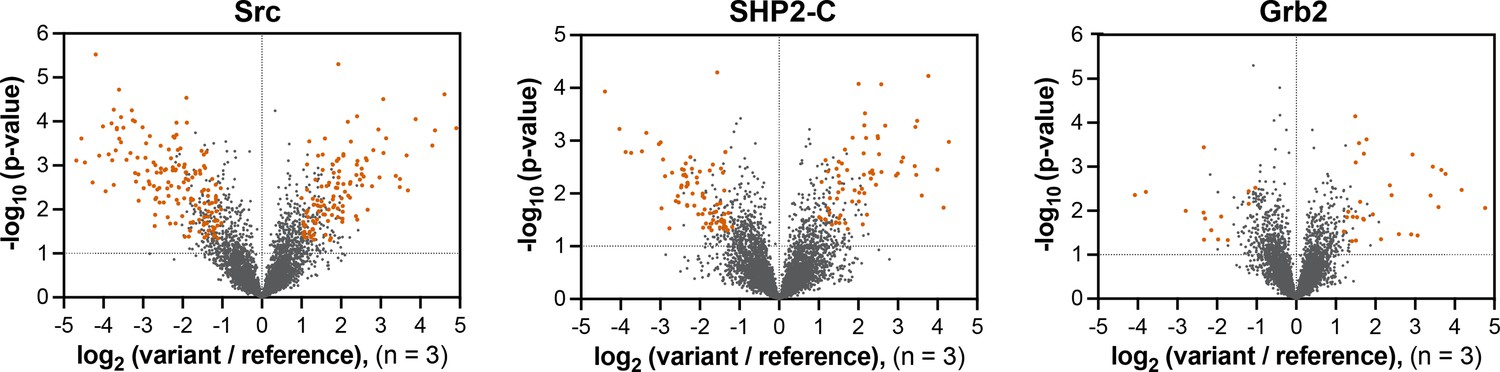
Volcano plots depicting mutational effects in the pTyr-Var screen for 3 SH2 domains.
Datasets are the average of three replicates. Hits are colored in orange-red.
Figure 6—figure supplement 6
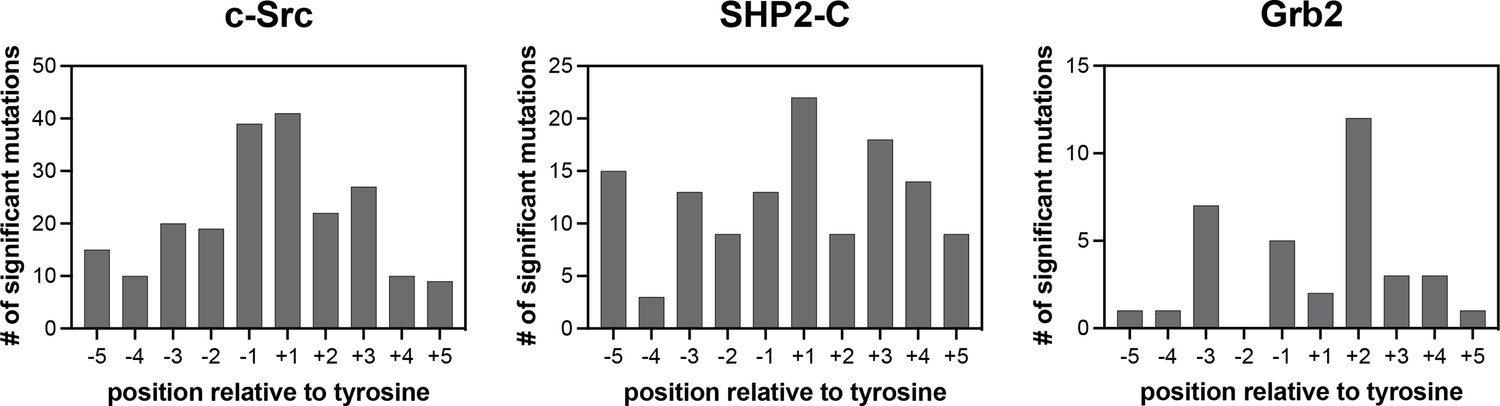
Number of significant mutations for each SH2 domain at each position surrounding the central phosphotyrosine residue.
Mutations that added or removed a tyrosine residue are excluded from these counts.
Figure 6—figure supplement 7
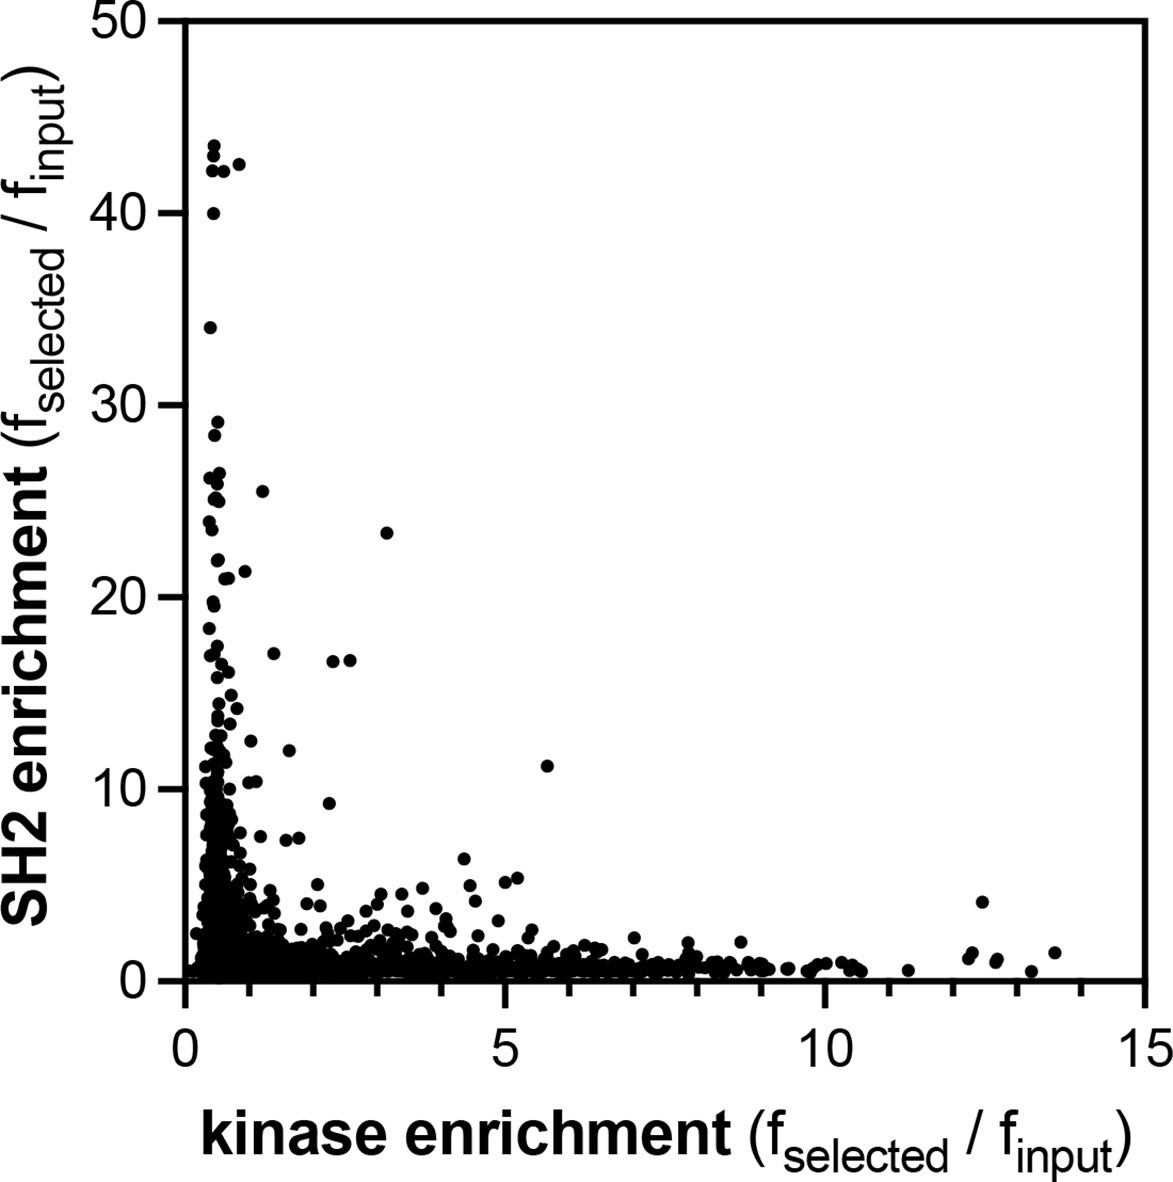
Comparison of the pTyr-Var screens for the c-Src kinase and SH2 domains.
Kinase domain data are the average of four replicates, and SH2 data are the average of three replicates.
Figure 6—figure supplement 8
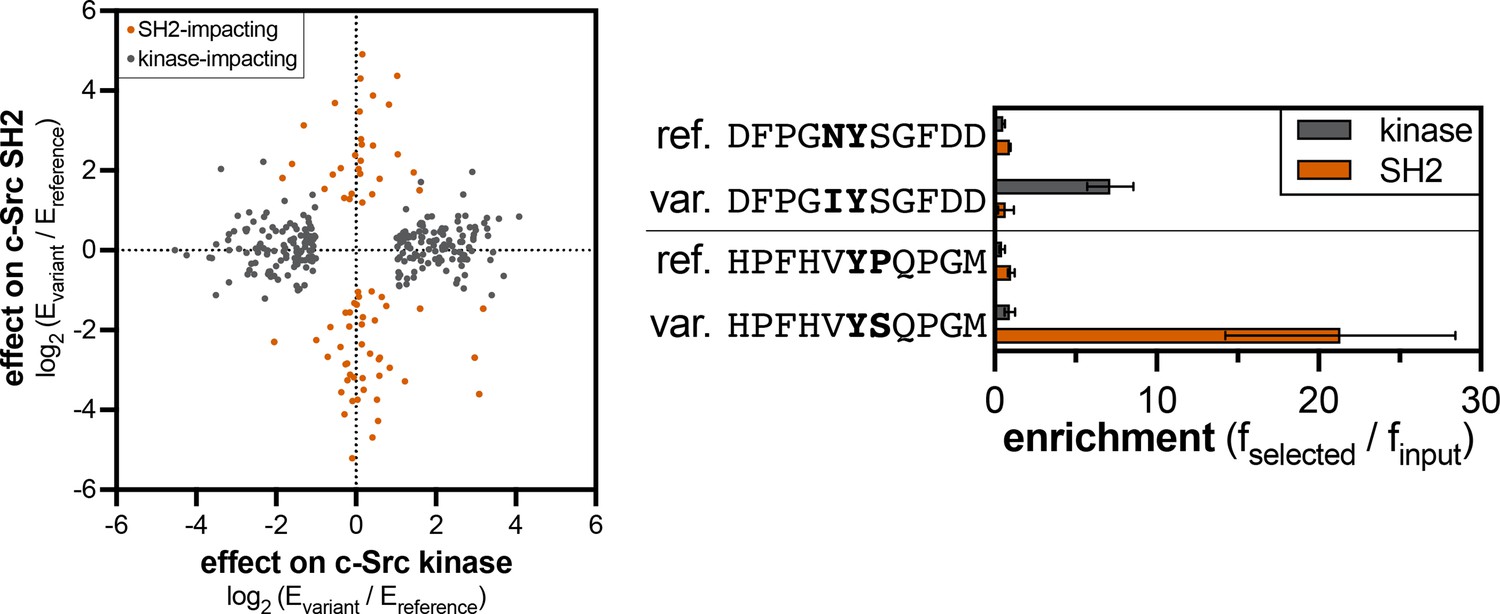
Divergent effects of phosphosite-proximal mutations on c-Src kinase and SH2 domain recognition.
The graph on the left shows the effects of mutations that were significant for the kinase domain (gray) or the SH2 domain (orange-red). The graph on the right shows examples of phosphosite-proximal mutations selectively impact the kinase or SH2 domain of c-Src. Error bars for the kinase and SH2 domain indicate the standard deviations from four and three replicates, respectively.
Figure 7 with 3 supplements
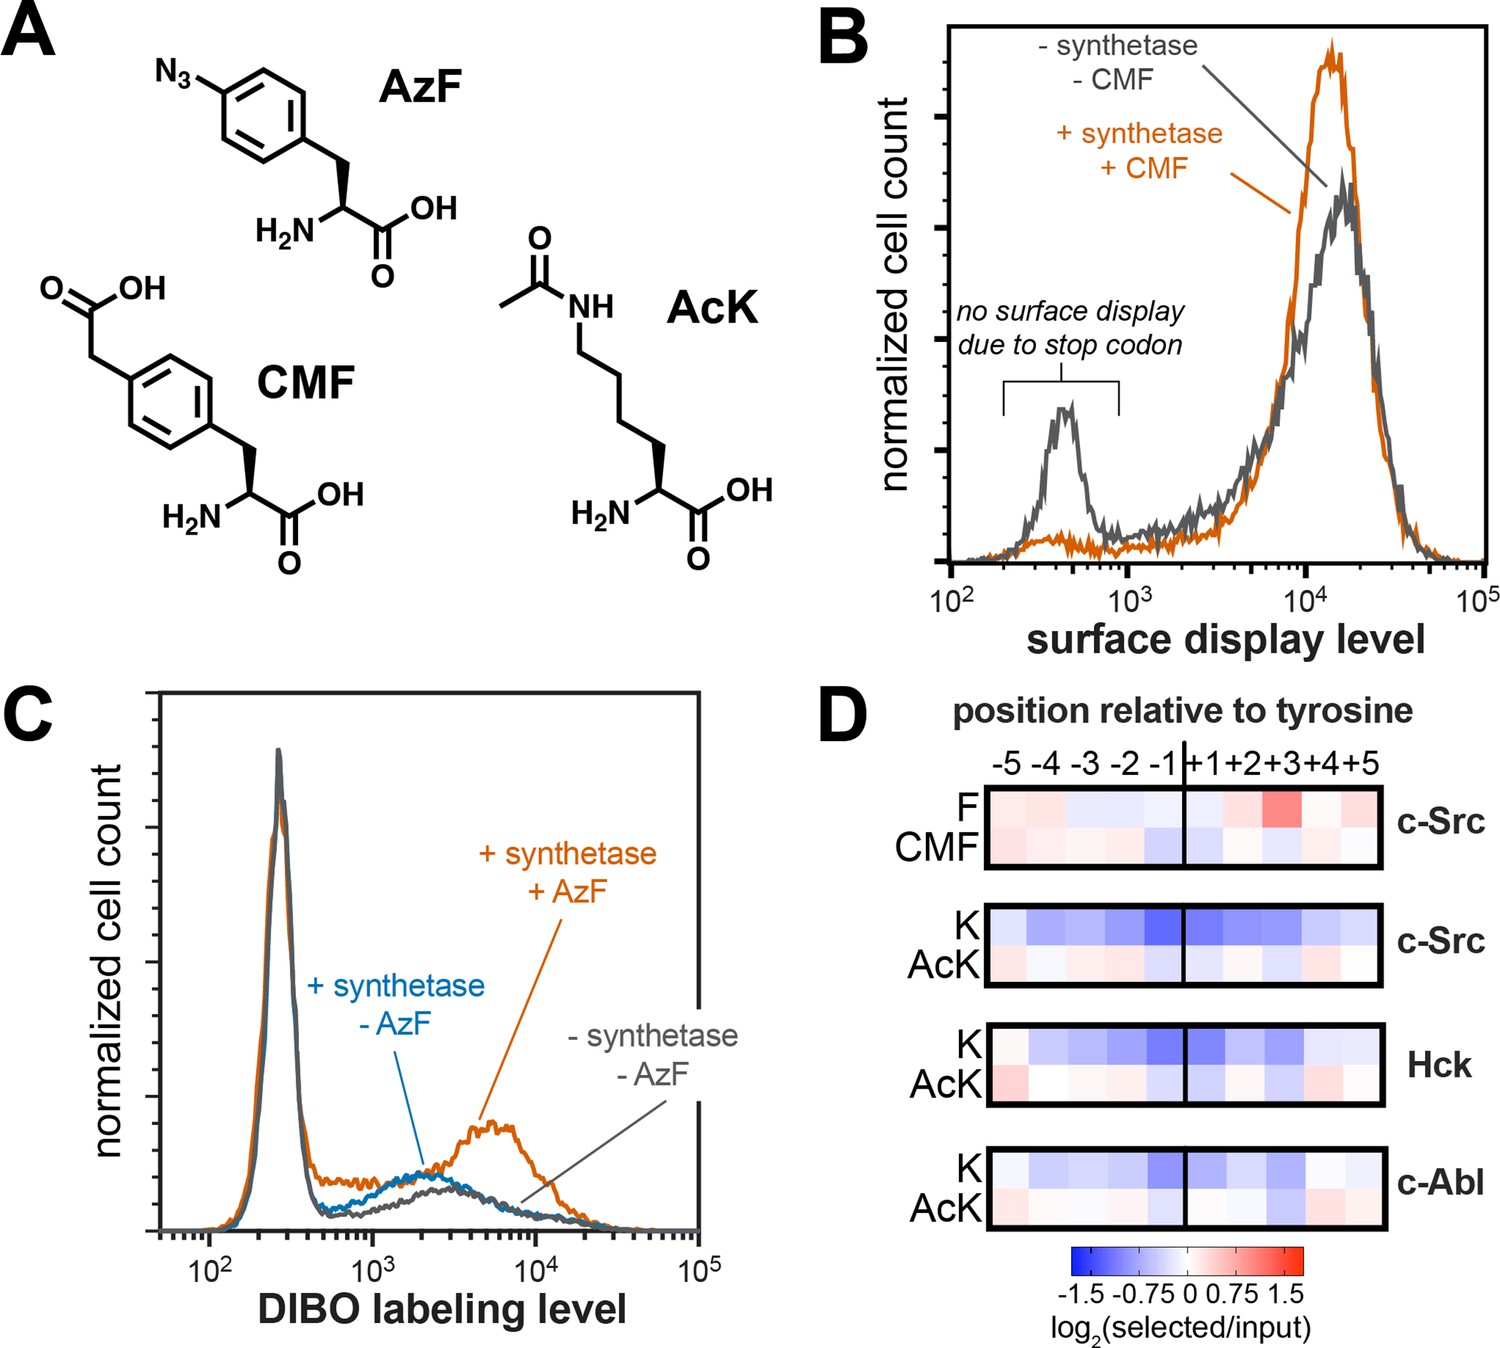
Expansion of peptide display libraries using Amber suppression.
(A) Non-canonical amino acids used in this study. CMF = 4-carboxymethyl phenylalanine, AzF = 4-azido phenylalanine, and AcK = N-ε-acetyl-L-lysine. (B) Amber suppression in the strep-tagged X5-Y-X5 library using CMF. Library surface-display level was monitored by flow cytometry using a fluorophore-labeled StrepMAB antibody for samples with or without Amber suppression components. (C) AzF labeling on bacterial cells using a DIBO-conjugated fluorophore. Cells expressing the X5-Y-X5 library, with and without various Amber suppression components, were treated with DIBO-conjugated Alexa Fluor 555 then analyzed by flow cytometry. (D) Heatmaps depicting the specificities of c-Src, Hck, and c-Abl after CMF or acetyl lysine incorporation. Only sequences with one stop codon were used in this analysis. Enrichment scores were log2-transformed and are displayed on a color scale from blue (disfavored), to white (neutral), to red (favored). Values in heatmaps are the average of three replicates.
Figure 7—figure supplement 1
Stop codon enrichment levels in c-Src X5-Y-X5 screens using different analysis methods.
Error bars represent the standard deviations from three screens.
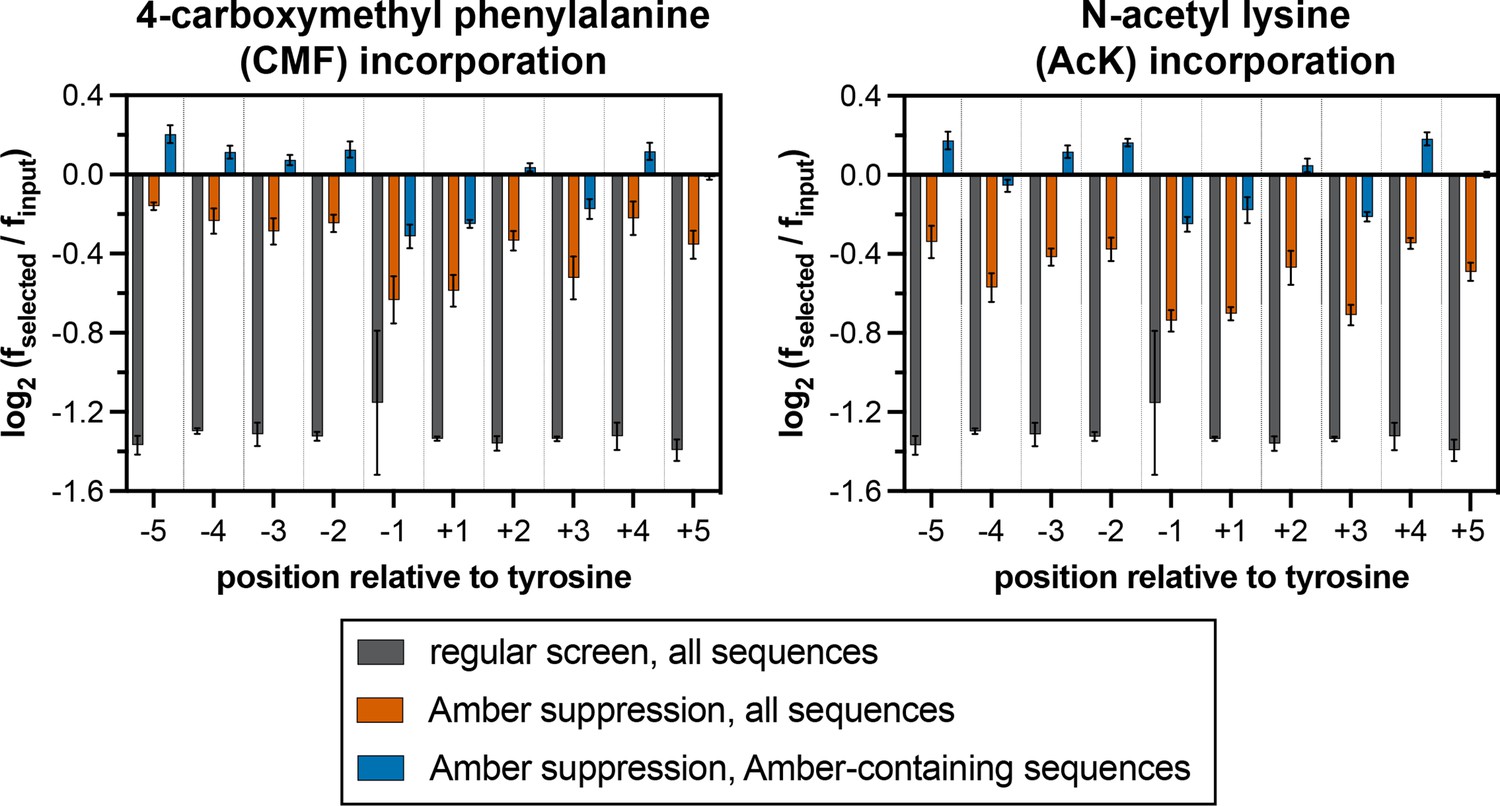
Figure 7—figure supplement 2
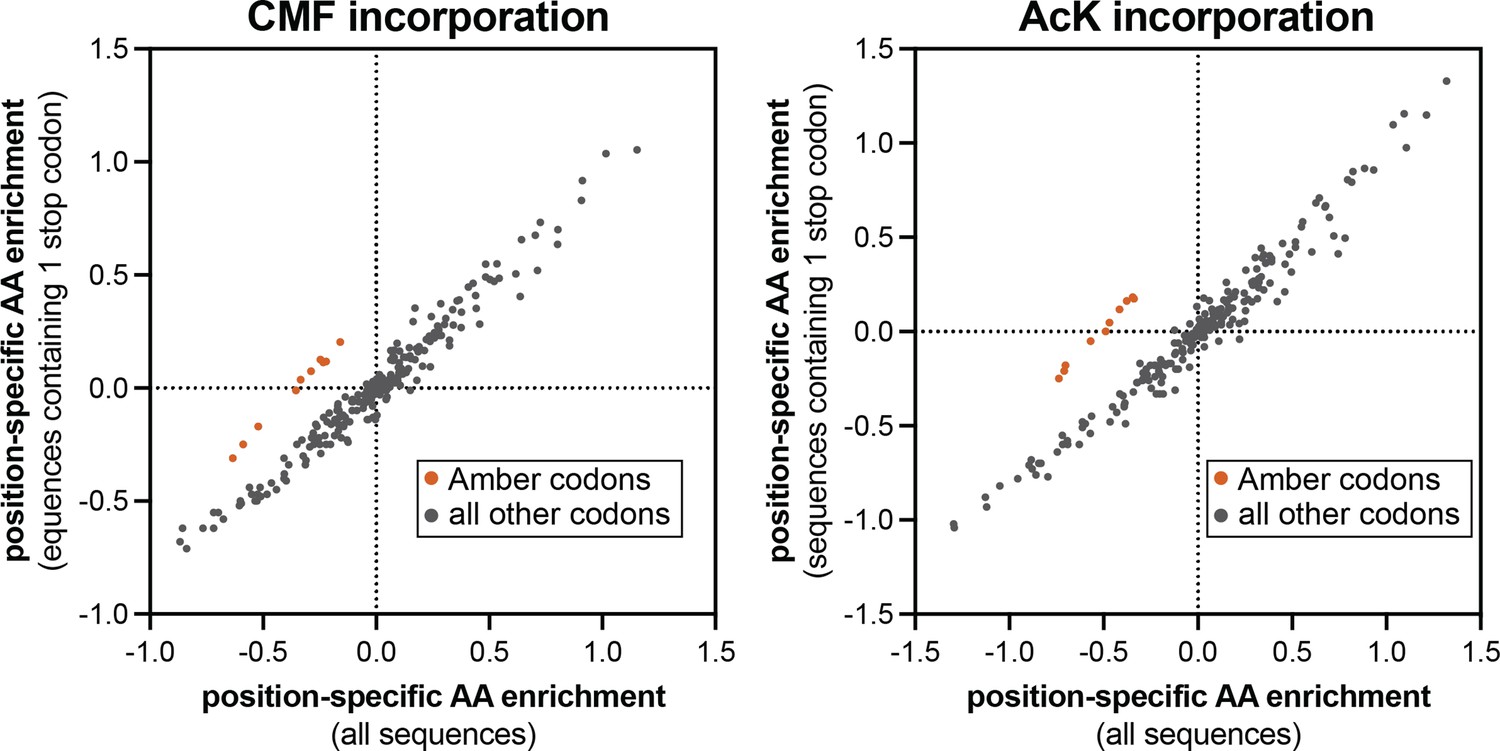
Comparison of position-specific enrichments in screens with Amber suppression analyzed in two different ways.
In each plot, the enrichment of specific amino acids or a stop codon, after phosphorylation by c-Src and bead-based selection, were calculated using two different methods. X-values indicate log-transformed enrichment values calculated across all sequences in the library. Y-values indicate log-transformed enrichment values only for sequences that contain exactly one Amber stop codon. The orange-red points correspond to the Amber codon enrichments at all 10 positions, which selectively fall off of the x=y diagonal line.
Figure 7—figure supplement 3
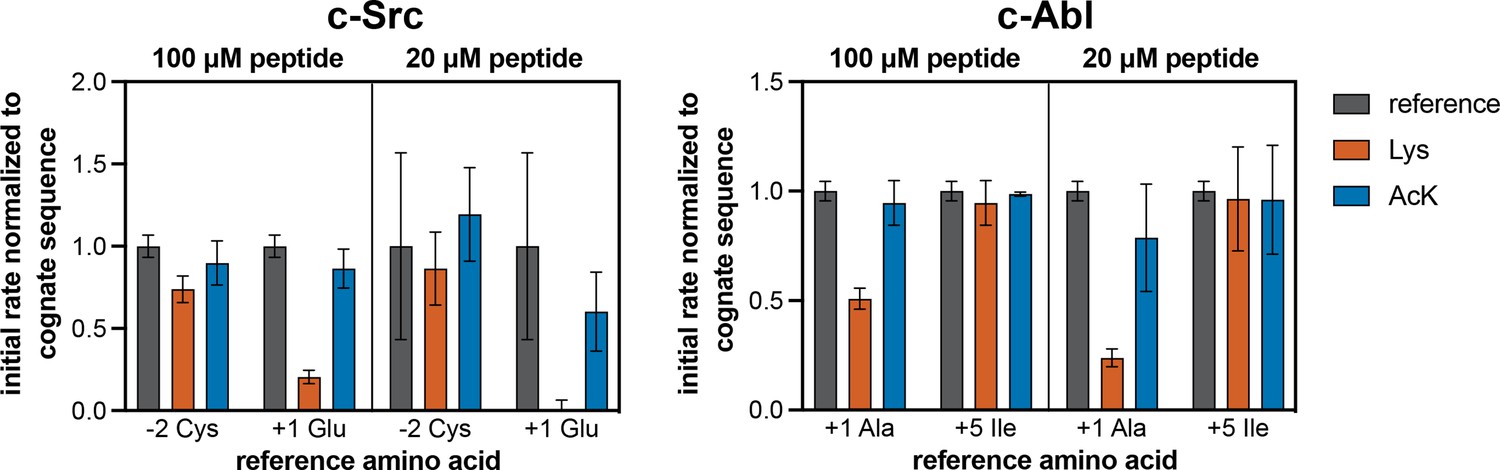
Phosphorylation kinetics of Lys- and AcK-containing consensus peptides against c-Src and c-Abl.
Initial rates measured for each kinase were normalized to the rate of the corresponding cognate consensus peptide. Peptides were used at a concentration of 100 or 20 μM, and the kinases were used at a concentration of 10–50 nM. Error bars represent the standard deviation from three measurements.
Author response image 1
Author response image 2
Author response image 3
Author response image 4
Tables
Table 1
Michaelis-Menten parameters for consensus peptides against c-Src and c-Abl kinase domains.
All measurements were carried out using the ADP-Quest assay in three to five replicates. Errors represent the standard error in global fits of all replicates to the Michaelis-Menten equation.
| Entry | Kinase | Peptide name | Peptide sequence | kcat (s–1) | KM (μM) |
|---|---|---|---|---|---|
| 1 | c-Src | Src Consensus | GPDECIYDMFPFKKKG | 4.9±0.4 | 196±38 |
| 2 | c-Src | Src Consensus (P-5C, D+1 G) | GCDECIYGMFPFKKKG | 4.4±0.2 | 97±10 |
| 3 | c-Src | SrcTide (1995) | GAEEEIYGEFEAKKKG | 3.1±0.2 | 64±10 |
| 4 | c-Src | SrcTide (2014) | GAEEEIYGIFGAKKKG | 1.8±0.1 | 7±3 |
| 5 | c-Src | Fer Consensus | GPDEPIYEWWWIKKKG | 0.4±0.1 | 8±4 |
| 6 | c-Src | Abl Consensus | GPDEPIYAVPPIKKKG | 2.0±0.2 | 159±31 |
| 7 | c-Abl | Abl Consensus | GPDEPIYAVPPIKKKG | 3.0±0.2 | 6±2 |
| 8 | c-Abl | AblTide (2014) | GAPEVIYATPGAKKKG | 2.5±0.2 | 35±8 |
Appendix 1—key resources table
| Reagent type (species) or resource | Designation | Source or reference | Identifiers | Additional information |
|---|---|---|---|---|
| Strain, strain background (E. coli) | MC1061 | Lucigen | Lucigen: 10361012 | bacterial cells used for surface-display screens |
| Strain, strain background (E. coli) | DH5α | Invitrogen | Invitrogen: 18265017 | bacterial cells used for general cloning and library cloning |
| Strain, strain background (E. coli) | BL21(DE3) | ThermoFisher Scientific | Thermo: C600003 | bacterial cells for general protein-expression; pre-transformed with pCDF-YopH for tyrosine kinase overexpression |
| Strain, strain background (E. coli) | C43(DE3) | Lucigen | Lucigen: NC9581214 | bacterial cells used for SH2 domain over-expression; pre-transformed with pCDFDuet-BirA-WT for biotinylation |
| Antibody | 4 G10 Platinum, Biotin (mouse monoclonal) | Millipore Sigma | Millipore Sigma: 16–452-MI | biotin conjugated mouse monoclonal pan-phosphotyrosine antibody dilution: (1:1000) |
| Antibody | PY20-PerCP-eFluor 710 (mouse monoclonal) | eBioscience | eBioscience: 46-5001-42 | PerCP-eFluor 710-conjugated mouse monoclonal pan-phosphotyrosine antibody, clone PY20 dilution: (1:25) |
| Antibody | PY20-biotin (mouse monoclonal) | Exalpha | Exalpha: 50-210-1865 | biotin conjugated mouse monoclonal pan-phosphotyrosine antibody dilution (1:500) |
| Antibody | StrepMAB Chromeo 488 (mouse monoclonal) | IBA LifeSciences | IBA: 2-1546-050 | Chromeo 488-conjugated antibody that recognizes the strep-tag dilution: (1:50–100). Discontinued, but can be replaced with IBA LifeSciences StrepMAB-Classic conjugate DY-488 (IBA: 2-1563-050) |
| Recombinant DNA reagent | pBAD33-eCPX | PMID:18480093 | Addgene: 23336 | pBAD33 plasmid encoding the eCPX bacterial display gene with flanking 5' and 3' SfiI restriction sites |
| Recombinant DNA reagent | pBAD33-eCPX-cStrep | PMID:29547119 | pBAD33 plasmid encoding the eCPX bacterial display gene with a 3' sequence encoding a strep-tag and flanking 5' and 3' SfiI restriction sites | |
| Recombinant DNA reagent | pBAD33-eCPX-cMyc | this paper | pBAD33 plasmid encoding the eCPX bacterial display gene with a 3' sequence encoding a myc-tag and flanking 5' and 3' SfiI restriction sites | |
| Recombinant DNA reagent | X5-Y-X5 Library (myc-tagged) | this paper | peptide display library in the pBAD33 vector, fused to the eCPX scaffold, containing 1–10 million unique sequences with the structure X5-Y-X5, where X is encoded by an NNS codon. The scaffold protein is encoded to have a C-terminal myc-tag: EQKLISEEDL. | |
| Recombinant DNA reagent | X5-Y-X5 Library (strep-tagged) | this paper | peptide display library in the pBAD33 vector, fused to the eCPX scaffold, containing 1–10 million unique sequences with the structure X5-Y-X5, where X is encoded by an NNS codon. The scaffold protein is encoded to have a C-terminal strep-tag: WSHPQFEK. | |
| Recombinant DNA reagent | pTyr-Var Library (myc-tagged) | this paper | peptide display library in the pBAD33 vector, fused to the eCPX scaffold, containing ~10,000 unique sequences encoding reference and variant phosphosite pairs deried from the PhosphoSitePlus database. The scaffold protein is encoded to have a C-terminal myc-tag: EQKLISEEDL. | |
| Recombinant DNA reagent | pTyr-Var Library (strep-tagged) | this paper | peptide display library in the pBAD33 vector, fused to the eCPX scaffold, containing ~10,000 unique sequences encoding reference and variant phosphosite pairs deried from the PhosphoSitePlus database. The scaffold protein is encoded to have a C-terminal strep-tag: WSHPQFEK. | |
| Recombinant DNA reagent | pET-23a-His6-TEV-Src(KD) | PMID:29547119 | bacterial expression vector encoding the human c-Src kinase domain (residues 260–528), with an N-terminal His6-tag and TEV protease recognition sequence | |
| Recombinant DNA reagent | pET-23a-His6-TEV-Fyn(KD) | PMID:29547119 | bacterial expression vector encoding the human Fyn kinase domain (residues 261–529) with an N-terminal His6-tag and TEV protease recognition sequence | |
| Recombinant DNA reagent | pET-23a-His6-TEV-Hck(KD) | PMID:29547119 | bacterial expression vector encoding the human Hck kinase domain (residues 252–520) with an N-terminal His6-tag and TEV protease recognition sequence | |
| Recombinant DNA reagent | pET-23a-His6-TEV-Abl(KD) | PMID:29547119 | bacterial expression vector encoding the mouse c-Abl kinase domain (residues 232–502) with an N-terminal His6-tag and TEV protease recognition sequence | |
| Recombinant DNA reagent | pET-23a-His6-TEV-AncSZ(KD) | DOI: 10.1101/2022.04.24.489292 | bacterial expression vector encoding the AncSZ kinase domain (residues 352–627) with an N-terminal His6-tag and TEV protease recognition sequence | |
| Recombinant DNA reagent | pET23a-His6-TEV-Fer(KD) | this paper | bacterial expression vector encoding the mouse Fer kinase domain (residues 553–823) with an N-terminal His6-tag and TEV protease recognition sequence | |
| Recombinant DNA reagent | pET-His6-TEV-FGFR1(KD) | PMID:30004690 | Addgene: 79719 | bacterial expression vector encoding the human FGFR1 kinase domain (residues 456–763) with an N-terminal His6-tag and TEV protease recognition sequence |
| Recombinant DNA reagent | pET-His6-TEV-FGFR3(KD) | PMID:30004690 | Addgene: 79731 | bacterial expression vector encoding the human FGFR3 kinase domain (residues 449–759) with an N-terminal His6-tag and TEV protease recognition sequence |
| Recombinant DNA reagent | pET-His6-TEV-EPHB1(KD) | PMID:30004690 | Addgene: 79694 | bacterial expression vector encoding the human EPHB1 kinase domain (residues 602–896) with an N-terminal His6-tag and TEV protease recognition sequence |
| Recombinant DNA reagent | pET-His6-TEV-EPHB2(KD) | PMID:30004690 | Addgene: 79697 | bacterial expression vector encoding the human EPHB2 kinase domain (residues 604–898) with an N-terminal His6-tag and TEV protease recognition sequence |
| Recombinant DNA reagent | pET-His6-TEV-MERTK(KD) | PMID:30004690 | Addgene: 79705 | bacterial expression vector encoding the human MERTK kinase domain (residues 570–864) with an N-terminal His6-tag and TEV protease recognition sequence |
| Recombinant DNA reagent | pCDF-YopH | PMID:16260764 | bacterial expression vector for co-expression of untagged YopH phosphatase with tyrosine kinases | |
| Recombinant DNA reagent | pET28-His6-TEV-SHP2-C459E-no tail | this paper | bacterial expression vector encoding the human SHP2 (residues 1–526) with the C459E mutation, an N-terminal His6-tag, and TEV protease recognition sequence | |
| Recombinant DNA reagent | pET28-His6-TEV-SHP2-C459E-no tail-D61V | this paper | bacterial expression vector encoding the human SHP2 (residues 1–526) with C459E and D61V mutations, an N-terminal His6-tag, and TEV protease recognition sequence | |
| Recombinant DNA reagent | pET28-His6-TEV-SHP2-C459E-no tail-D61N | this paper | bacterial expression vector encoding the human SHP2 (residues 1–526) with C459E and D61N mutations, an N-terminal His6-tag, and TEV protease recognition sequence | |
| Recombinant DNA reagent | pCDFDuet-BirA-WT | this paper | bacterial expression vector encoding BirA biotin ligase, used to coexpress with SH2 domain expression vector for biotinylation of SH2 domain | |
| Recombinant DNA reagent | pET-His6-SUMO-Src(SH2) | this paper | bacterial expression vector encoding the human cSrc SH2 domain (residues 143–250) with an N-terminal His6-SUMO tag | |
| Recombinant DNA reagent | pET-His6-SUMO-SHP2(CSH2) | this paper | bacterial expression vector encoding the human SHP2 CSH2 domain (residues 105–220) with an N-terminal His6-SUMO tag | |
| Recombinant DNA reagent | pET-His6-SUMO-Grb2(SH2) | this paper | bacterial expression vector encoding the human Grb2 SH2 domain (residues 56–152) with an N-terminal His6-SUMO tag | |
| Recombinant DNA reagent | pULTRA CMF | PMID:28604693 | bacterial expression vector encoding the tRNA/syntetase pair for incorporation of 4-carboxymethyl phenylalanine via Amber suppression | |
| Recombinant DNA reagent | pEVOL pAzFRS.2.t1 | PMID:26571098 | Addgene: 73546 | bacterial expression vector encoding the tRNA/syntetase pair for incorporation of 4-azido phenylalanine and other Phe derivatives via Amber suppression |
| Recombinant DNA reagent | pULTRA chAcKRS3 | PMID:29544052 | bacterial expression vector encoding the tRNA/syntetase pair for incorporation of acetyl-lysine via Amber suppression; gift from Abhishek Chatterjee at Boston College | |
| Recombinant DNA reagent | pULTRA-Amp CMF | this paper | bacterial expression vector encoding the tRNA/syntetase pair for incorporation of 4-carboxymethyl phenylalanine via Amber suppression, altered to have an ampicillin resistance marker | |
| Recombinant DNA reagent | pULTRA-Amp pAzFRS.2.t1 | this paper | bacterial expression vector encoding the tRNA/syntetase pair for incorporation of 4-azido phenylalanine and other Phe derivatives via Amber suppression, altered to have an ampicillin resistance marker | |
| Recombinant DNA reagent | pULTRA-Amp chAcKRS3 | this paper | bacterial expression vector encoding the tRNA/syntetase pair for incorporation of acetyl-lysine via Amber suppression, altered to have an ampicillin resistance marker | |
| Sequence-based reagent | X5-Y-X5 library oligo; eCPX-rand-lib | this paper, purchased from Millipore Sigma | primer sequence: 5’-GCTGGCCAGTCTGGCCAGNNS NNSNNSNNSNNStatNNSNNSNNSNNSNNSGGAGG GCAGTCTGGGCAGTCTG 3’ | |
| Sequence-based reagent | Oligopool-fwd-primer | this paper, purchased from Millipore Sigma | primer sequence: 5’-GCTGGCCAGTCTG-3’ | |
| Sequence-based reagent | Oligopool-rev-primer | this paper, purchased from Millipore Sigma | primer sequence: 5’-CAGACTGCCCAGACT-3’ | |
| Sequence-based reagent | link-eCPX-fwd | this paper, purchased from Millipore Sigma | 5’-GGAGGGCAGTCTGGGCAGTCTG-3’ | |
| Sequence-based reagent | link-eCPX-rev | this paper, purchased from Millipore Sigma | 5’-GCTTGGCCACCTTGGCCTTATTA-3’ | |
| Sequence-based reagent | BB-fwd-primer | this paper, purchased from Millipore Sigma | 5’-TAATAAGGCCAAGGTGGCCAAGC-3’ | |
| Sequence-based reagent | BB-rev primer | this paper, purchased from Millipore Sigma | 5’-CTGGCCAGACTGGCCAGCTACG-3’ | |
| Sequence-based reagent | TruSeq-eCPX-Fwd | sequence from PMID:29547119, purchased from Millipore Sigma | round one amplicon PCR primer | primer sequence: 5’-TGACTGGAGTTCAGACGTG TGCTCTTCCGATCTNNNNNNACCGCA GGTACTTCCGTAGCT-3’ |
| Sequence-based reagent | TruSeq-eCPX-Rev | sequence from PMID:29547119, purchased from Millipore Sigma | round one amplicon PCR primer | primer sequence: 5’-CACTCTTTCCCTACACGACG CTCTTCCGATCTNNNNNN TTTTGTTGTAGTCACCAGACTG-3’ |
| Sequence-based reagent | D701 | sequence from Illumina, purchased from Millipore Sigma | round two amplicon/indexing PCR primer | primer sequence: 5'-CAAGCAGAAGACGG CATACGAGATcgagtaatGTG ACTGGAGTTCAGACGTG-3' |
| Sequence-based reagent | D702 | sequence from Illumina, purchased from Millipore Sigma | round two amplicon/indexing PCR primer | primer sequence: 5'-CAAGCAGAAGA CGGCATACGAGATtctccgga GTGACTGGAGTTCAGACGTG-3' |
| Sequence-based reagent | D703 | sequence from Illumina, purchased from Millipore Sigma | round two amplicon/indexing PCR primer | primer sequence: 5'-CAAGCAGAAGA CGGCATACGAGATaatgagcg GTGACTGGAGTTCAGACGTG-3' |
| Sequence-based reagent | D704 | sequence from Illumina, purchased from Millipore Sigma | round two amplicon/indexing PCR primer | primer sequence: 5'-CAAGCAGAAGAC GGCATACGAGATggaatctcG TGACTGGAGTTCAGACGTG-3' |
| Sequence-based reagent | D705 | sequence from Illumina, purchased from Millipore Sigma | round two amplicon/indexing PCR primer | primer sequence: 5'-CAAGCAGA AGACGGCATACGAGA TttctgaatGTGACTGGAGT TCAGACGTG-3' |
| Sequence-based reagent | D706 | sequence from Illumina, purchased from Millipore Sigma | round two amplicon/indexing PCR primer | primer sequence: 5'-CAAGCAGAAGA CGGCATACGAGATacgaattc GTGACTGGAGTTCAGACGTG-3' |
| Sequence-based reagent | D707 | sequence from Illumina, purchased from Millipore Sigma | round two amplicon/indexing PCR primer | primer sequence: 5'-CAAGCAGAAG ACGGCATACGAGATagcttcag GTGACTGGAGTTCAGACGTG-3' |
| Sequence-based reagent | D708 | sequence from Illumina, purchased from Millipore Sigma | round two amplicon/indexing PCR primer | primer sequence: 5'-CAAGCAGAAGACG GCATACGAGATgcgcattaGT GACTGGAGTTCAGACGTG-3' |
| Sequence-based reagent | D709 | sequence from Illumina, purchased from Millipore Sigma | round two amplicon/indexing PCR primer | primer sequence: 5'-CAAGCAGAAG ACGGCATACGAGATcatagccg GTGACTGGAGTTCAGACGTG-3' |
| Sequence-based reagent | D710 | sequence from Illumina, purchased from Millipore Sigma | round two amplicon/indexing PCR primer | primer sequence: 5'-CAAGCAGA AGACGGCATACGAGATttcgcgga GTGACTGGAGTTCAGACGTG-3' |
| Sequence-based reagent | D711 | sequence from Illumina, purchased from Millipore Sigma | round two amplicon/indexing PCR primer | primer sequence: 5'-CAAGCAGAAGACG GCATACGAGATgcgcgaga GTGACTGGAGTTCAGACGTG-3' |
| Sequence-based reagent | D712 | sequence from Illumina, purchased from Millipore Sigma | round two amplicon/indexing PCR primer | primer sequence: 5'-CAAGCAGAA GACGGCATACGAGATctatcgctGT GACTGGAGTTCAGACGTG-3' |
| Sequence-based reagent | D501 | sequence from Illumina, purchased from Millipore Sigma | round two amplicon/indexing PCR primer | primer sequence: 5'-AATGATACGGCGA CCACCGAGATCTACACtatagcct ACACTCTTTCCCTACACGAC-3' |
| Sequence-based reagent | D502 | sequence from Illumina, purchased from Millipore Sigma | round two amplicon/indexing PCR primer | primer sequence: 5'-AATGATACGGCG ACCACCGAGATCTACACatagaggc ACACTCTTTCCCTACACGAC-3' |
| Sequence-based reagent | D503 | sequence from Illumina, purchased from Millipore Sigma | round two amplicon/indexing PCR primer | primer sequence: 5'-AATGATACGGCGA CCACCGAGATCTACACcctatcct ACACTCTTTCCCTACACGAC-3' |
| Sequence-based reagent | D504 | sequence from Illumina, purchased from Millipore Sigma | round two amplicon/indexing PCR primer | primer sequence: 5'-AATGATACGGCGA CCACCGAGATCTACACggctctga ACACTCTTTCCCTACACGAC-3' |
| Sequence-based reagent | D505 | sequence from Illumina, purchased from Millipore Sigma | round two amplicon/indexing PCR primer | primer sequence: 5'-AATGATACGGC GACCACCGAGATCTACACaggcgaag ACACTCTTTCCCTACACGAC-3' |
| Sequence-based reagent | D506 | sequence from Illumina, purchased from Millipore Sigma | round two amplicon/indexing PCR primer | primer sequence: 5'-AATGATACGG CGACCACCGAGATCTACACtaatctta ACACTCTTTCCCTACACGAC-3' |
| Sequence-based reagent | D507 | sequence from Illumina, purchased from Millipore Sigma | round two amplicon/indexing PCR primer | primer sequence: 5'-AATGATACGGC GACCACCGAGATCTACACcaggacgt ACACTCTTTCCCTACACGAC-3' |
| Sequence-based reagent | D508 | sequence from Illumina, purchased from Millipore Sigma | round two amplicon/indexing PCR primer | primer sequence: 5'-AATGATACG GCGACCACCGAGATCTACAC gtactgacACACTCTTTCCCTACACGAC-3' |
| Peptide, recombinant protein | Src(KD) | this paper, expressed/purified in-house | human c-Src kinase domain (residues 260–528) | |
| Peptide, recombinant protein | Fyn(KD) | this paper, expressed/purified in-house | human Fyn kinase domain (residues 261–529) | |
| Peptide, recombinant protein | Hck(KD) | this paper, expressed/purified in-house | human Hck kinase domain (residues 252–520) | |
| Peptide, recombinant protein | Abl(KD) | this paper, expressed/purified in-house | mouse c-Abl kinase domain (residues 232–502) | |
| Peptide, recombinant protein | JAK2 Protein, active | Millipore Sigma | Millipore Sigma: 14–640 M | Active, C-terminal His6-tagged, recombinant, human JAK2, amino acids 808-end, expressed by baculo virus in Sf21 cells, for use in Enzyme Assays. |
| Peptide, recombinant protein | AncSZ(KD) | this paper, expressed/purified in-house | AncSZ kinase domain (residues 352–627) designed by ancestral sequence reconstruction | |
| Peptide, recombinant protein | Fer(KD) | this paper, expressed/purified in-house | mouse Fer kinase domain (residues 553–823) | |
| Peptide, recombinant protein | FGFR1(KD) | this paper, expressed/purified in-house | human FGFR1 kinase domain (residues 456–763) | |
| Peptide, recombinant protein | FGFR3(KD) | this paper, expressed/purified in-house | human FGFR3 kinase domain (residues 449–759) | |
| Peptide, recombinant protein | EPHB1(KD) | this paper, expressed/purified in-house | human EPHB1 kinase domain (residues 602–896) | |
| Peptide, recombinant protein | EPHB2(KD) | this paper, expressed/purified in-house | human EPHB2 kinase domain (residues 604–898) | |
| Peptide, recombinant protein | MERTK(KD) | this paper, expressed/purified in-house | human MERTK kinase domain (residues 570–864) | |
| Peptide, recombinant protein | Src(SH2) | this paper, expressed/purified in-house | human c-Src SH2 domain (residues 143–250) | |
| Peptide, recombinant protein | SHP2(C-SH2) | this paper, expressed/purified in-house | human SHP2 C-SH2 domain (residues 105–220) | |
| Peptide, recombinant protein | Grb2(SH2) | this paper, expressed/purified in-house | human Grb2 SH2 domain (residues 56–152) | |
| Peptide, recombinant protein | SHP2(PTP; C459E) | this paper, expressed/purified in-house | human full-length SHP2 (residues 1–526; C459E) | |
| Peptide, recombinant protein | SHP2(PTP; C459E, D61V) | this paper, expressed/purified in-house | human full-length SHP2 (residues 1–526; C459E, D61V) | |
| Peptide, recombinant protein | SHP2(PTP; C459E, D61N) | this paper, expressed/purified in-house | human full-length SHP2 (residues 1–526; C459E, D61N) | |
| Peptide, recombinant protein | SHP2(PTP; C459E, G60V) | this paper, expressed/purified in-house | human full-length SHP2 (residues 1–526; C459E, G60V) | |
| Peptide, recombinant protein | Src Consensus | this paper, synthesized in-house | peptide sequence: Ac-GPDECIYDMFPFKKKG-NH2 | |
| Peptide, recombinant protein | Src Consensus (P-5C, D+1 G) | this paper, synthesized in-house | peptide sequence: Ac-GCDECIYGMFPFRRRG-NH2 | |
| Peptide, recombinant protein | Abl Consensus | this paper, synthesized in-house | peptide sequence: Ac-GPDEPIYAVPPIKKKG-NH2 | |
| Peptide, recombinant protein | Fer Consensus | this paper, synthesized in-house | peptide sequence: Ac-GPDEPIYEWWWIKKKG-NH2 | |
| Peptide, recombinant protein | EPHB1 Consensus | this paper, synthesized in-house | peptide sequence: Ac-GPPEPNYEVIPPKKKG-NH2 | |
| Peptide, recombinant protein | EPHB2 Consensus | this paper, synthesized in-house | peptide sequence: Ac-GPPEPIYEVPPPKKKG-NH2 | |
| Peptide, recombinant protein | SrcTide (1995) | sequence from PMID:7845468, synthesized in-house | peptide sequence: Ac-GAEEEIYGEFEAKKKG-NH2 | |
| Peptide, recombinant protein | SrcTide (2014) | sequence from PMID:25164267, purchased from Synpeptide | peptide sequence: Ac-GAEEEIYGIFGAKKKG-NH2 | |
| Peptide, recombinant protein | AblTide (2014) | sequence from PMID:7845468, synthesized in-house | peptide sequence: Ac-GAPEVIYATPGAKKKG-NH2 | |
| Peptide, recombinant protein | HRAS_Y64 | sequence from PMID:35606422, purchased from Synpeptide | peptide sequence: Ac-AGQEEYSAMRD-NH2 | |
| Peptide, recombinant protein | HRAS_Y64_E63K | sequence from PMID:35606422, purchased from Synpeptide | peptide sequence: Ac-AGQEKYSAMRD-NH2 | |
| Peptide, recombinant protein | CDK13_Y716_YF | this paper, synthesized in-house | peptide sequence: Ac-IGEGTYGQVFK-NH2 | |
| Peptide, recombinant protein | CDK13_Y716_G717R_YF | this paper, synthesized in-house | peptide sequence: Ac-IGEGTYRQVFK-NH2 | |
| Peptide, recombinant protein | CDK5_Y15 | sequence from PMID:35606422, purchased from Synpeptide | peptide sequence: Ac-IGEGTYGTVFK-NH2 | |
| Peptide, recombinant protein | CDK5_Y15_G16R | sequence from PMID:35606422, purchased from Synpeptide | peptide sequence: Ac-IGEGTYRTVFK-NH2 | |
| Peptide, recombinant protein | PLCG1_Y210 | this paper, synthesized in-house | peptide sequence: Ac-SGDITYGQFAQ-NH2 | |
| Peptide, recombinant protein | PLCG1_Y210_T209N | this paper, synthesized in-house | peptide sequence: Ac-SGDINYGQFAQ-NH2 | |
| Peptide, recombinant protein | GLB1_Y294 | this paper, synthesized in-house | peptide sequence: Ac-VASSLYDILAR-NH2 | |
| Peptide, recombinant protein | GLB1_Y294_L297F | this paper, synthesized in-house | peptide sequence: Ac-VASSLYDIFAR-NH2 | |
| Peptide, recombinant protein | MISP_Y95 | this paper, synthesized in-house | peptide sequence: Ac-EGWQVYRLGAR-NH2 | |
| Peptide, recombinant protein | HLA-DPB1_Y59_F64L_YF | this paper, synthesized in-house | peptide sequence: Ac-LERFIYNREEL-NH2 | |
| Peptide, recombinant protein | PEAK1_Y797 | this paper, synthesized in-house | peptide sequence: Ac-SVEELYAIPPD-NH2 | |
| Peptide, recombinant protein | SIRPA_Y496_P491L | this paper, synthesized in-house | peptide sequence: Ac-LFSEYASVQV-NH2 | |
| Peptide, recombinant protein | HGD_Y166_F169L | this paper, synthesized in-house | peptide sequence: Ac-GNLLIYTELGK-NH2 | |
| Peptide, recombinant protein | ITGA3_Y237_YF | this paper, synthesized in-house | peptide sequence: Ac-WDLSEYSFKDP-NH2 | |
| Peptide, recombinant protein | ITGA3_Y237_S235P_YF | this paper, synthesized in-house | peptide sequence: Ac-WDLPEYSFKDP-NH2 | |
| Peptide, recombinant protein | Src Consensus (C-2S) | this paper, synthesized in-house | peptide sequence: Ac-GPDESIYDMFPFKKKG-NH2 | |
| Peptide, recombinant protein | Src Consensus (C-2P) | this paper, synthesized in-house | peptide sequence: Ac-GPDEPIYDMFPFKKKG-NH2 | |
| Peptide, recombinant protein | ACTA1_Y171_YF | this paper, synthesized in-house | peptide sequence: Ac-QPIFEG(pY)ALPHAG-NH2 | |
| Peptide, recombinant protein | ACTA1_Y171_A172G_YF | this paper, synthesized in-house | peptide sequence: Ac-QPIFEG(pY)GLPHAG-NH2 | |
| Peptide, recombinant protein | ACTB_Y240 | this paper, synthesized in-house | peptide sequence: Ac-QSLEKS(pY)ELPDGG-NH2 | |
| Peptide, recombinant protein | ACTB_Y240_P243L | this paper, synthesized in-house | peptide sequence: Ac-QSLEKS(pY)ELLDGG-NH2 | |
| Peptide, recombinant protein | CCDC39_Y593 | this paper, synthesized in-house | peptide sequence: Ac-QRKQQL(pY)TAMEEG-NH2 | |
| Peptide, recombinant protein | CLIP2_Y972 | this paper, synthesized in-house | peptide sequence: Ac-QSDQRR(pY)SLIDRG-NH2 | |
| Peptide, recombinant protein | CLIP2_Y972_R977P | this paper, synthesized in-house | peptide sequence: Ac-QSDQRR(pY)SLIDPG-NH2 | |
| Peptide, recombinant protein | CBS_Y308 | this paper, synthesized in-house | peptide sequence: Ac-QVEGIG(pY)DFIPTG-NH2 | |
| Peptide, recombinant protein | CBS_Y308_G307S | this paper, synthesized in-house | peptide sequence: Ac-QVEGIS(pY)DFIPTG-NH2 | |
| Peptide, recombinant protein | fluorescently-labeled c-Src-SH2 consensus peptide | sequence from PMID:7680959 | peptide sequence: FITC-Ahx-GDG(pY)EEISPLLL-NH2; gift from Jeanine Amacher at Western Washignton University | |
| Peptide, recombinant protein | Src Consensus (D+1 K) | this paper, synthesized in-house | peptide sequence: Ac-GPDECIYKMFPFKKKG-NH2 | |
| Peptide, recombinant protein | Src Consensus (D1AcK) | this paper, synthesized in-house | peptide sequence: Ac-GPDECIY(AcK)MFPFKKKG-NH2 | |
| Peptide, recombinant protein | Src Consensus (C-2K) | this paper, synthesized in-house | peptide sequence: Ac-GPDEKIYDMFPFKKKG-NH2 | |
| Peptide, recombinant protein | Src Consensus (C-2AcK) | this paper, synthesized in-house | peptide sequence: Ac-GPDE(AcK)IYDMFPFKKKG-NH2 | |
| Peptide, recombinant protein | Abl Consensus (A+1 K) | this paper, synthesized in-house | peptide sequence: Ac-GPDEPIYKVPPIKKKG-NH2 | |
| Peptide, recombinant protein | Abl Consensus (A+1 AcK) | this paper, synthesized in-house | peptide sequence: Ac-GPDEPIY(AcK)VPPIKKKG-NH2 | |
| Peptide, recombinant protein | Abl Consensus (I+5 K) | this paper, synthesized in-house | peptide sequence: Ac-GPDEPIYAVPPKKKKG-NH2 | |
| Peptide, recombinant protein | Abl Consensus (I+5 AcK) | this paper, synthesized in-house | peptide sequence: Ac-GPDEPIYAVPP(AcK)KKKG-NH2 | |
| Commercial assay or kit | MiSeq Reagent Kit v3 (150 cycles) | Illumina | Illumina: MS-102–3001 | |
| Commercial assay or kit | NextSeq 500 Mid-Output v2 Kit (150 cycles) | Illumina | Illumina: FC-404–2001 | |
| Commercial assay or kit | Promega QuantiFluor dsDNA Sample Kit | Promega | Promega: E2671 | |
| Commercial assay or kit | ADP Quest Assay Kit | Eurofins Discoverx | Eurofins Discoverx: 90–0071 | |
| Commercial assay or kit | Dynabeads FlowComp Flexi Kit | ThermoFisher Scientific | ThermoFisher Scientific: 11061D | |
| Chemical compound, drug | 4-carboxymethyl phenylalanine (CMF) | Millipore Sigma | Millipore Sigma: ENA423210770 | |
| Chemical compound, drug | 4-azido-L-phenylalanine (AzF) | Chem-Impex International | Chem-Impex: 06162 | |
| Chemical compound, drug | N-ε-Acetyl-L-Lysine (AcK) | MP Biomedicals | MP Biomedicals: 02150235.2 | |
| Chemical compound, drug | Click-iT sDIBO -Alexa fluor 555 | ThermoFisher | Thermo: C20021 | |
| Other | Creatine Phosphokinase from rabbit muscle | Millipore Sigma | Millipore Sigma: C3755-500UN | purified enzyme extracted from rabbit muscle |
| Software, algorithm | FLASH (version FLASH2-2.2.00) | PMID:21903629 | https://ccb.jhu.edu/software/FLASH/ | |
| Software, algorithm | Cutadapt (version 3.5) | DOI:10.14806/ej.17.1.200 | https://cutadapt.readthedocs.io/en/stable/ | |
| Software, algorithm | Python scripts for processing and analysis of adeep sequencing data | this paper (Li et al., 2023) | https://github.com/nshahlab/2022_Li-et-al_peptide-display | |
| Software, algorithm | Logomaker | PMID:31821414 | https://logomaker.readthedocs.io/en/latest/index.html |
Additional files
Download links
A two-part list of links to download the article, or parts of the article, in various formats.
Downloads (link to download the article as PDF)
Open citations (links to open the citations from this article in various online reference manager services)
Cite this article (links to download the citations from this article in formats compatible with various reference manager tools)
High-throughput profiling of sequence recognition by tyrosine kinases and SH2 domains using bacterial peptide display
eLife 12:e82345.
https://doi.org/10.7554/eLife.82345


