Erythrocyte invasion-neutralising antibodies prevent Plasmodium falciparum RH5 from binding to basigin-containing membrane protein complexes
- Department of Biochemistry, University of Oxford, United Kingdom
- Kavli Institute for Nanoscience Discovery, Dorothy Crowfoot Hodgkin Building, University of Oxford, United Kingdom
- Institute of Physiology, Faculty of Medicine, University of Freiburg, Germany
- Signalling Research Centres BIOSS and CIBS, Germany
Figures
Figure 1 with 2 supplements
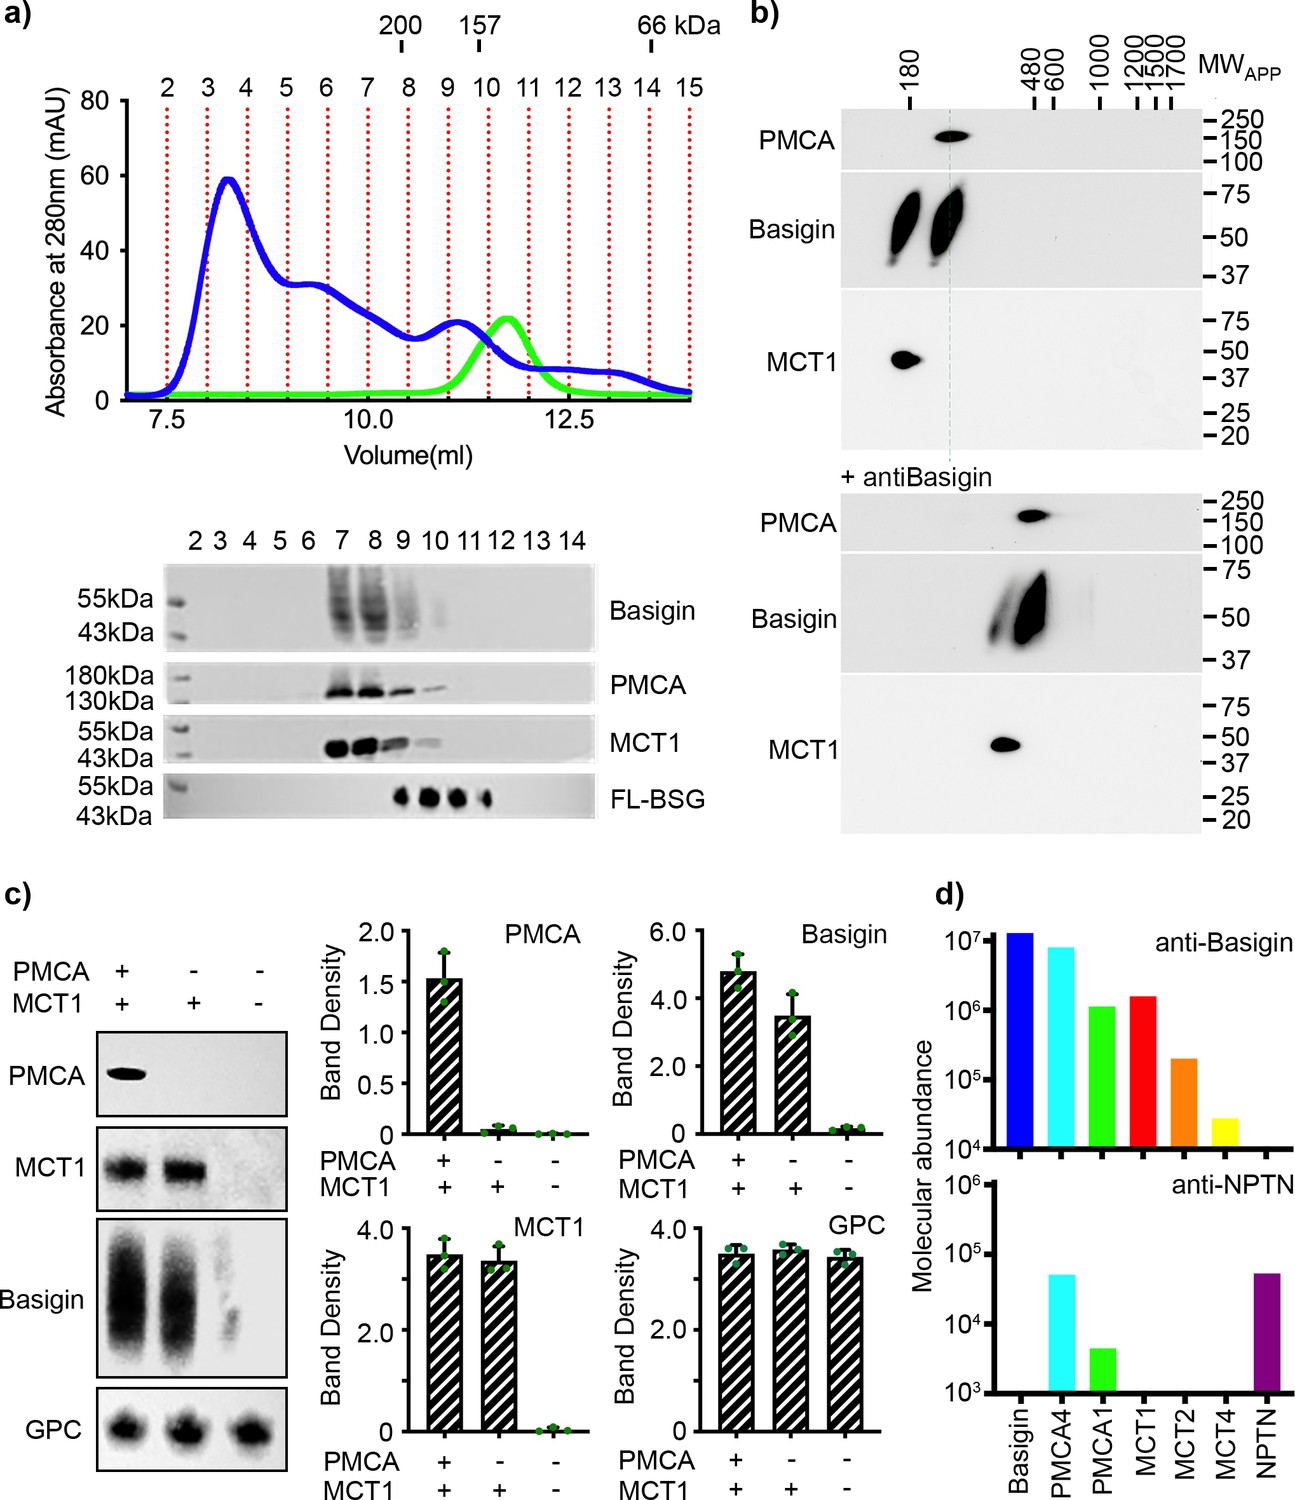
Basigin from human erythrocytes is found in complex with plasma membrane calcium ATPase (PMCA) or monocarboxylate transporter 1 (MCT1).
(a) The upper panel shows the trace from size exclusion chromatography of n-dodecyl-β-D-maltose and cholesterol hemisuccinate (DDM/CHS)-solubilised ghost membrane proteins fractionated on a Superdex 200 increase 10/300 column (blue) and for full-length basigin purified from insect cells in CHAPS and exchanged into DDM:CHS (green). The elution volumes of molecular weight standards are indicated above the trace. Fractions collected are demarcated by vertical red dotted lines. The lower panel shows western blots of fractions 2–14. Representative blots for basigin (40–65 kDa, upper panel), PMCA (~138 kDa, upper middle panel), and MCT1 (~45 kDa, lower middle panel) show that all three proteins co-elute predominantly in fractions 7–9. The lower panel shows the equivalent blot for full-length basigin (FL-BSG), related to the green trace. Data shown are representative from n=2 biological replicates. (b) Western blot analysis of 2D blue native PAGE/SDS-PAGE separations of human erythrocyte membrane solubilisates before (upper panel) and after pre-incubation with anti-basigin antibody (lower panel). Blot membranes were stained with antibodies specific for PMCA1/4, basigin and MCT1. Markers of apparent complex size indicate the positions of known mitochondrial respiratory chain (super)complexes (Schägger and Pfeiffer, 2000) run in a separate gel lane. Binding of the antibody led to a full size-shift of both PMCA1/4-basigin and MCT1-basigin complexes, whereas no signal of free basigin could be observed in the low molecular weight range, even after overexposure of the blot. Data shown are representative from n=2 biological replicates. (c) The left-hand panel shows representative western blot images depicting sequential depletion of PMCA (upper panel) and MCT1 (upper-middle panel). Depletion of both transporters leads to reduced basigin levels, while levels of glycophorin C are unaffected in each fraction, again confirming that basigin is in complex with PMCA or MCT1. The remaining panels show densitometry plots obtained from inverted images of the western blots. Mean integrated band densities are shown with error bars as the standard error of the mean (n=3) and represent technical replicates. (d) Bar diagram depicting molecular abundances (abundancenormspec values) of the indicated proteins in depleting affinity purifications with anti-basigin and anti-neuroplastin (NPTN) antibodies from mildly solubilised human erythrocyte membranes as determined by mass spectrometry. The abundance for all proteins was 0 after affinity purification with an IgG control. Data shown are representative from n=8 biological replicates for basigin and n=5 biological replicates for neuroplastin.
-
Figure 1—source data 1
Data associated with Figure 1.
- https://cdn.elifesciences.org/articles/83681/elife-83681-fig1-data1-v2.xlsx
-
Figure 1—source data 2
Gels and blots associated with Figure 1.
- https://cdn.elifesciences.org/articles/83681/elife-83681-fig1-data2-v2.zip
Figure 1—figure supplement 1
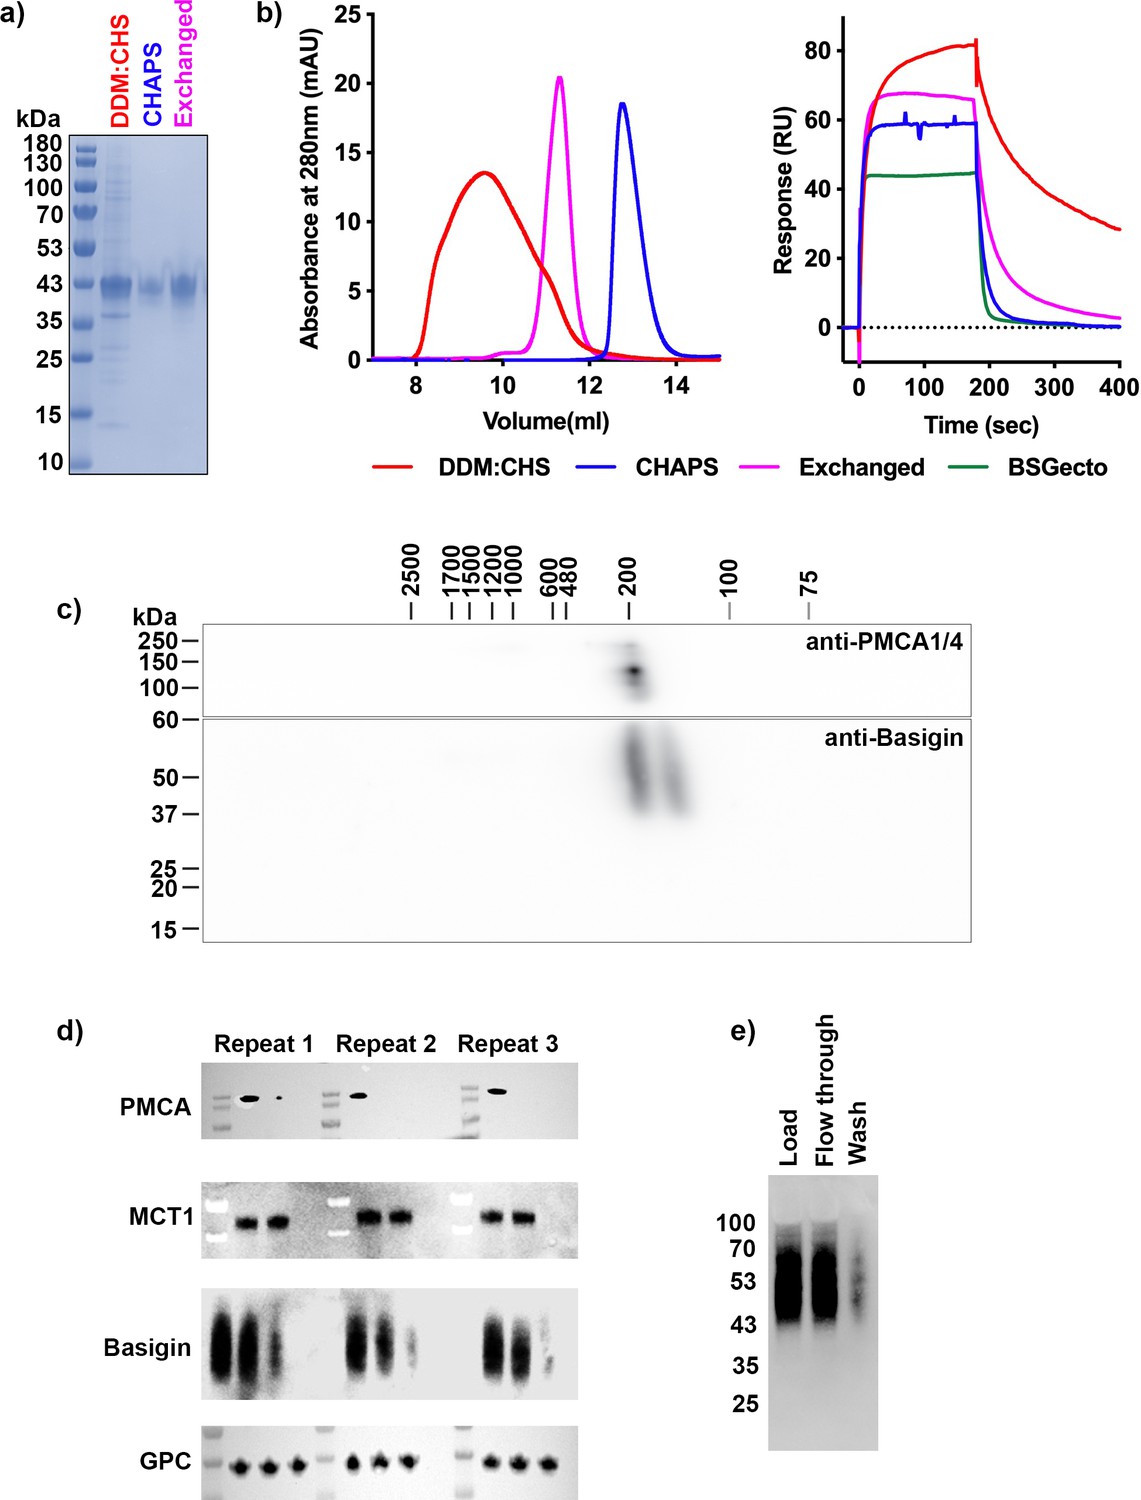
Purification and biochemical characterisation of monomeric and complexed basigin.
(a, b) Purification of full-length basigin from baculovirus-infected insect cells was performed in two different detergent mixtures (n-dodecyl-β-D-maltose and cholesterol hemisuccinate [DDM:CHS] or CHAPS) or was performed in CHAPS, followed by exchange into DDM:CHS (exchanged). (a) shows a Coomassie-stained SDS-PAGE analysis of these three samples. (b) The left-hand panel shows size exclusion chromatography traces on a S200 10/300 increase column for these samples. The right-hand panel shows surface plasmon resonance measurements of the binding of these three samples (0.4 μM), together with basigin ectodomain (BSGecto, 2 μM) to immobilised P. falciparum reticulocyte homologue 5 (PfRH5) (right). (c) Analysis of basigin-containing membrane protein complexes extracted from erythrocytes as in Figure 1b, albeit using a broader mass range resolving blue native gel. Data shown are representative from n=2 biological replicates. (d) Repeats of depletion experiments from Figure 1c. (e) Assessment of the depletion of basigin from solubilised erythrocyte membranes using beads lacking antibodies, related to Figure 1c.
-
Figure 1—figure supplement 1—source data 1
Data associated with Figure 1—figure supplement 1.
- https://cdn.elifesciences.org/articles/83681/elife-83681-fig1-figsupp1-data1-v2.xlsx
-
Figure 1—figure supplement 1—source data 2
Gels and blots associated with Figure 1—figure supplement 1.
- https://cdn.elifesciences.org/articles/83681/elife-83681-fig1-figsupp1-data2-v2.zip
Figure 1—figure supplement 2
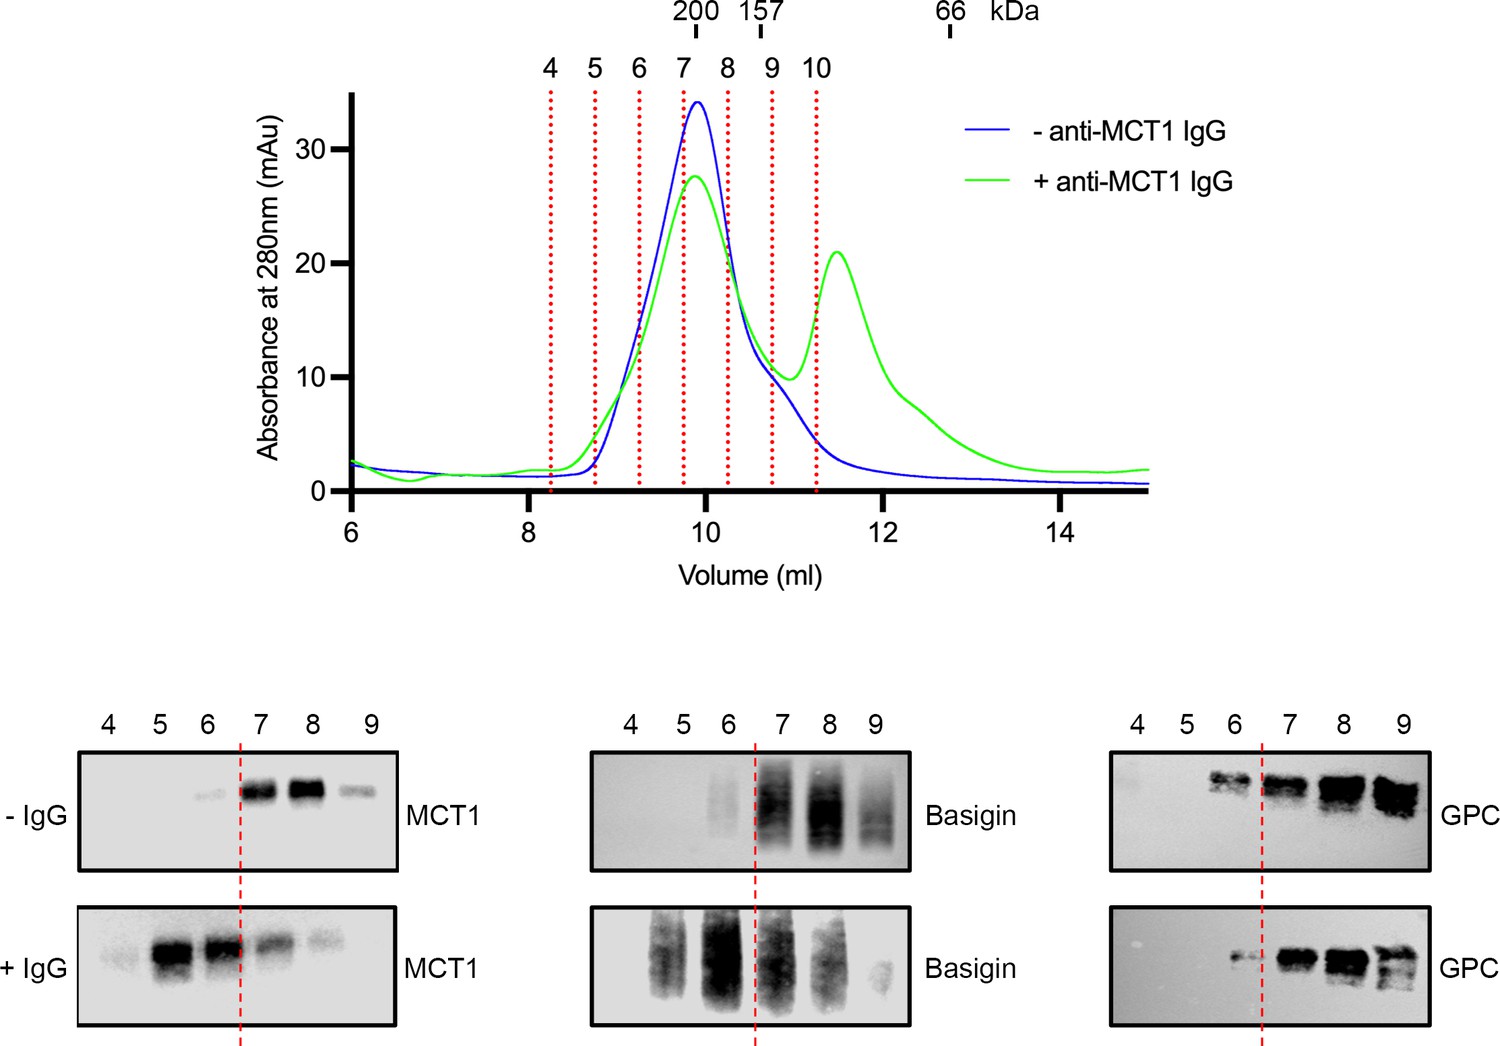
Mobility shift of basigin using a monocarboxylate transporter 1 (MCT1)-targeting antibody.
The top panel shows the outcome of separation of the basigin-rich fraction from n-dodecyl-β-D-maltose and cholesterol hemisuccinate (DDM:CHS)-solubilised ghost membranes on a Superdex 200 increase 10/300 column (blue). This was repeated in the presence of MCT1 antibody (green). Individual fractions are labelled and demarcated using red dashed lines. Above the trace are shown the elution profile of molecular weight standards. The lower panel shows western blots probed with MCT1 (left), basigin (central), and GPC (right) for the fractions from the size exclusion profile, both without (top, -IgG) and with (bottom, +IgG) the MCT1 antibody. This shows mobility shift for both MCT1 and basigin, but not the glycophorin C (GPC) control. Data shown are representative from n=2 technical replicates.
-
Figure 1—figure supplement 2—source data 1
Data associated with Figure 1—figure supplement 2.
- https://cdn.elifesciences.org/articles/83681/elife-83681-fig1-figsupp2-data1-v2.xlsx
-
Figure 1—figure supplement 2—source data 2
Gels and blots associated with Figure 1—figure supplement 2.
- https://cdn.elifesciences.org/articles/83681/elife-83681-fig1-figsupp2-data2-v2.zip
Figure 2 with 2 supplements
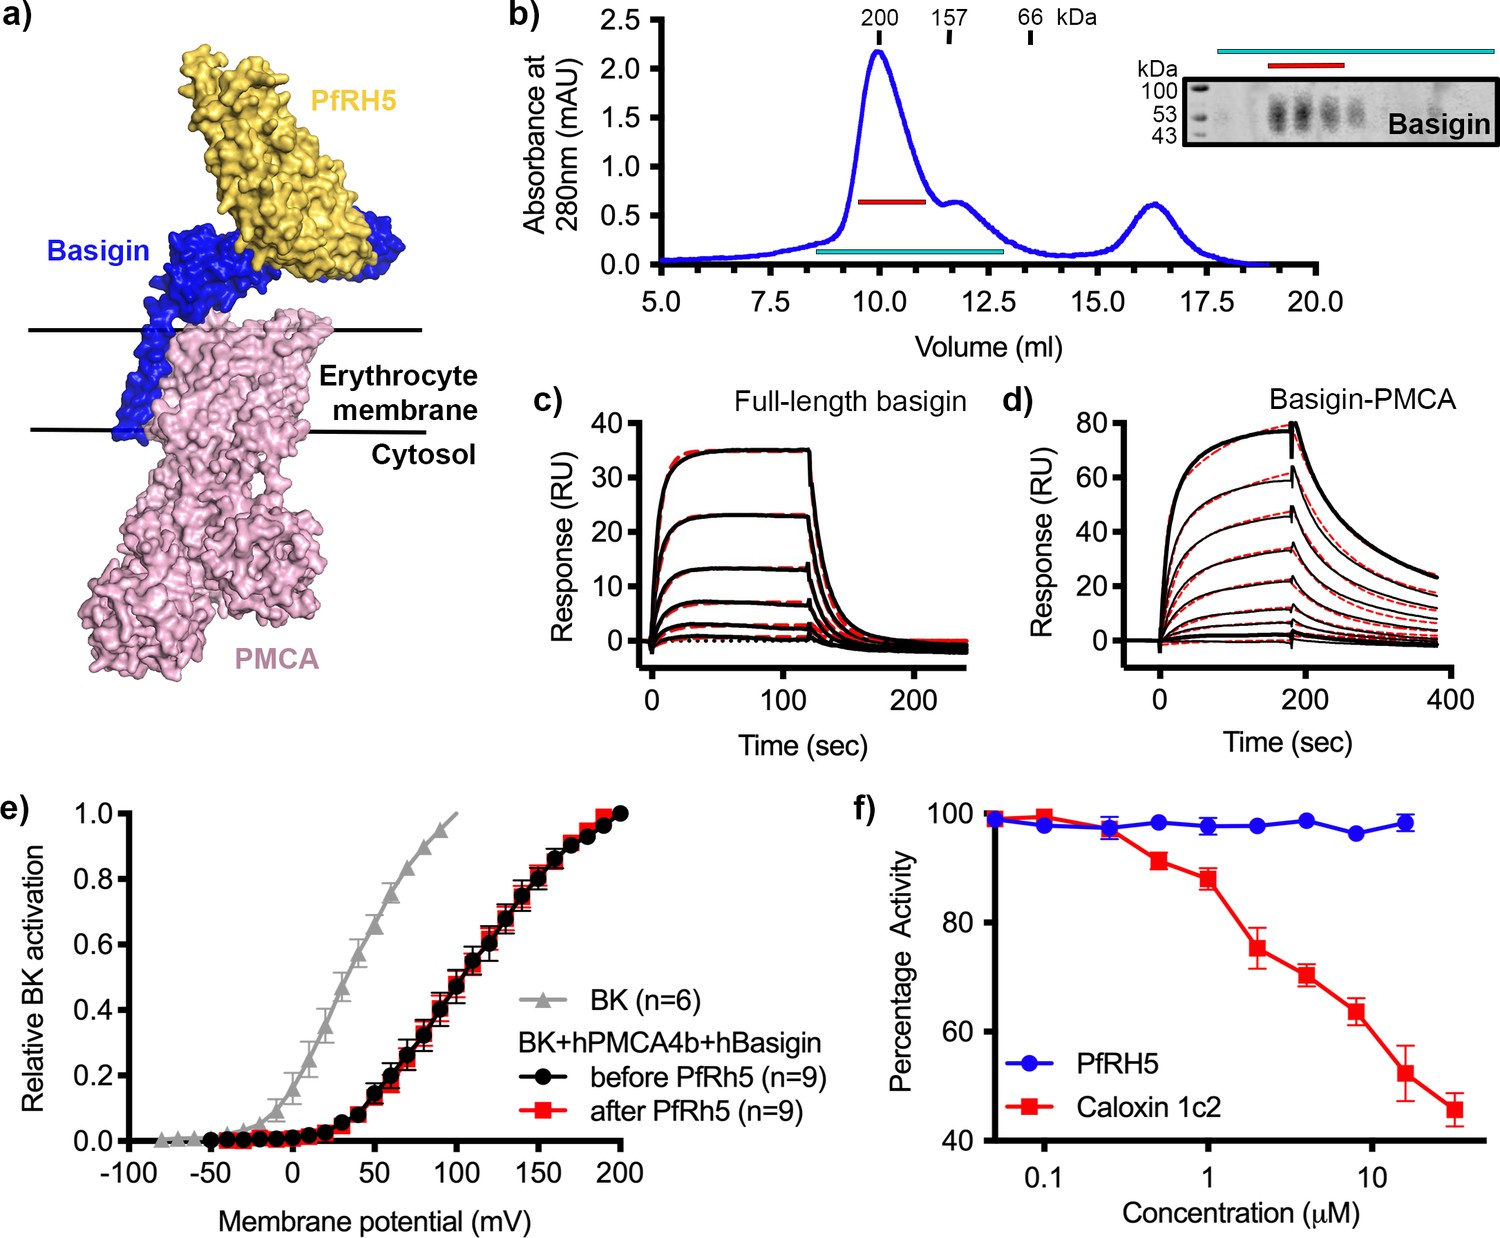
P. falciparum reticulocyte homologue 5 (PfRH5) binds to basigin-plasma membrane calcium ATPase (PMCA) without affecting calcium pumping activity.
(a) A structural model showing a complex of basigin (blue) and PMCA (pink) (based on PDB: 6A69, Gong et al., 2018) onto which the complex of PfRH5 (yellow) and basigin (blue) (PDB:4U0Q, Wright et al., 2014) has been docked. (b) A size exclusion profile obtained for calmodulin affinity chromatography-purified PMCA from human erythrocyte ghosts separated on a Superdex 200 increase 10/300 column. The inset shows a western blot probed with an anti-basigin monoclonal antibody indicating co-migration of basigin with PMCA. Data shown are representative from n=3 biological replicates. (c) A surface plasmon resonance (SPR) sensogram showing the binding of a concentration series of full-length basigin (twofold dilutions from 4 μM) to immobilised PfRH5. Black lines show data and dashed red lines show fitting to a 1:1 binding model, with a dissociation constant of 0.56 μM. Data shown are representative from n=3 biological replicates. (d) An SPR sensogram showing the binding of a concentration series of basigin-PMCA (twofold dilutions from 400 nM) to immobilised PfRH5. Black lines show data and dashed red lines show fitting to a two-state binding model. The derived rate and affinity constants are presented in Supplementary files 1 and 2. Data shown are representative from n=2 biological replicates. (e) Activation curves of BKCa channels recorded in Chinese hamster ovary (CHO) cells expressing BKCa channels alone (grey), or cells also transfected with human PMCA4b and basigin with (red) and without (black) addition of PfRH5 at 2 μM concentration. Data shown are from n=3 biological replicates and error bars show standard error of mean. (f) Concentration-response curves for the inhibition of Ca2+-ATPase activity, as determined by measuring inorganic phosphate production, of purified basigin-PMCA complex by known inhibitor caloxin 1c2 (red) and PfRH5 (blue). Each data point represents the mean and error bars represent the standard error of the mean of technical replicates (n=3, technical replicates).
-
Figure 2—source data 1
Data associated with Figure 2.
- https://cdn.elifesciences.org/articles/83681/elife-83681-fig2-data1-v2.xlsx
-
Figure 2—source data 2
Gels and blots associated with Figure 2.
- https://cdn.elifesciences.org/articles/83681/elife-83681-fig2-data2-v2.zip
Figure 2—figure supplement 1
Purification and functional characterisation of basigin-plasma membrane calcium ATPase (PMCA).
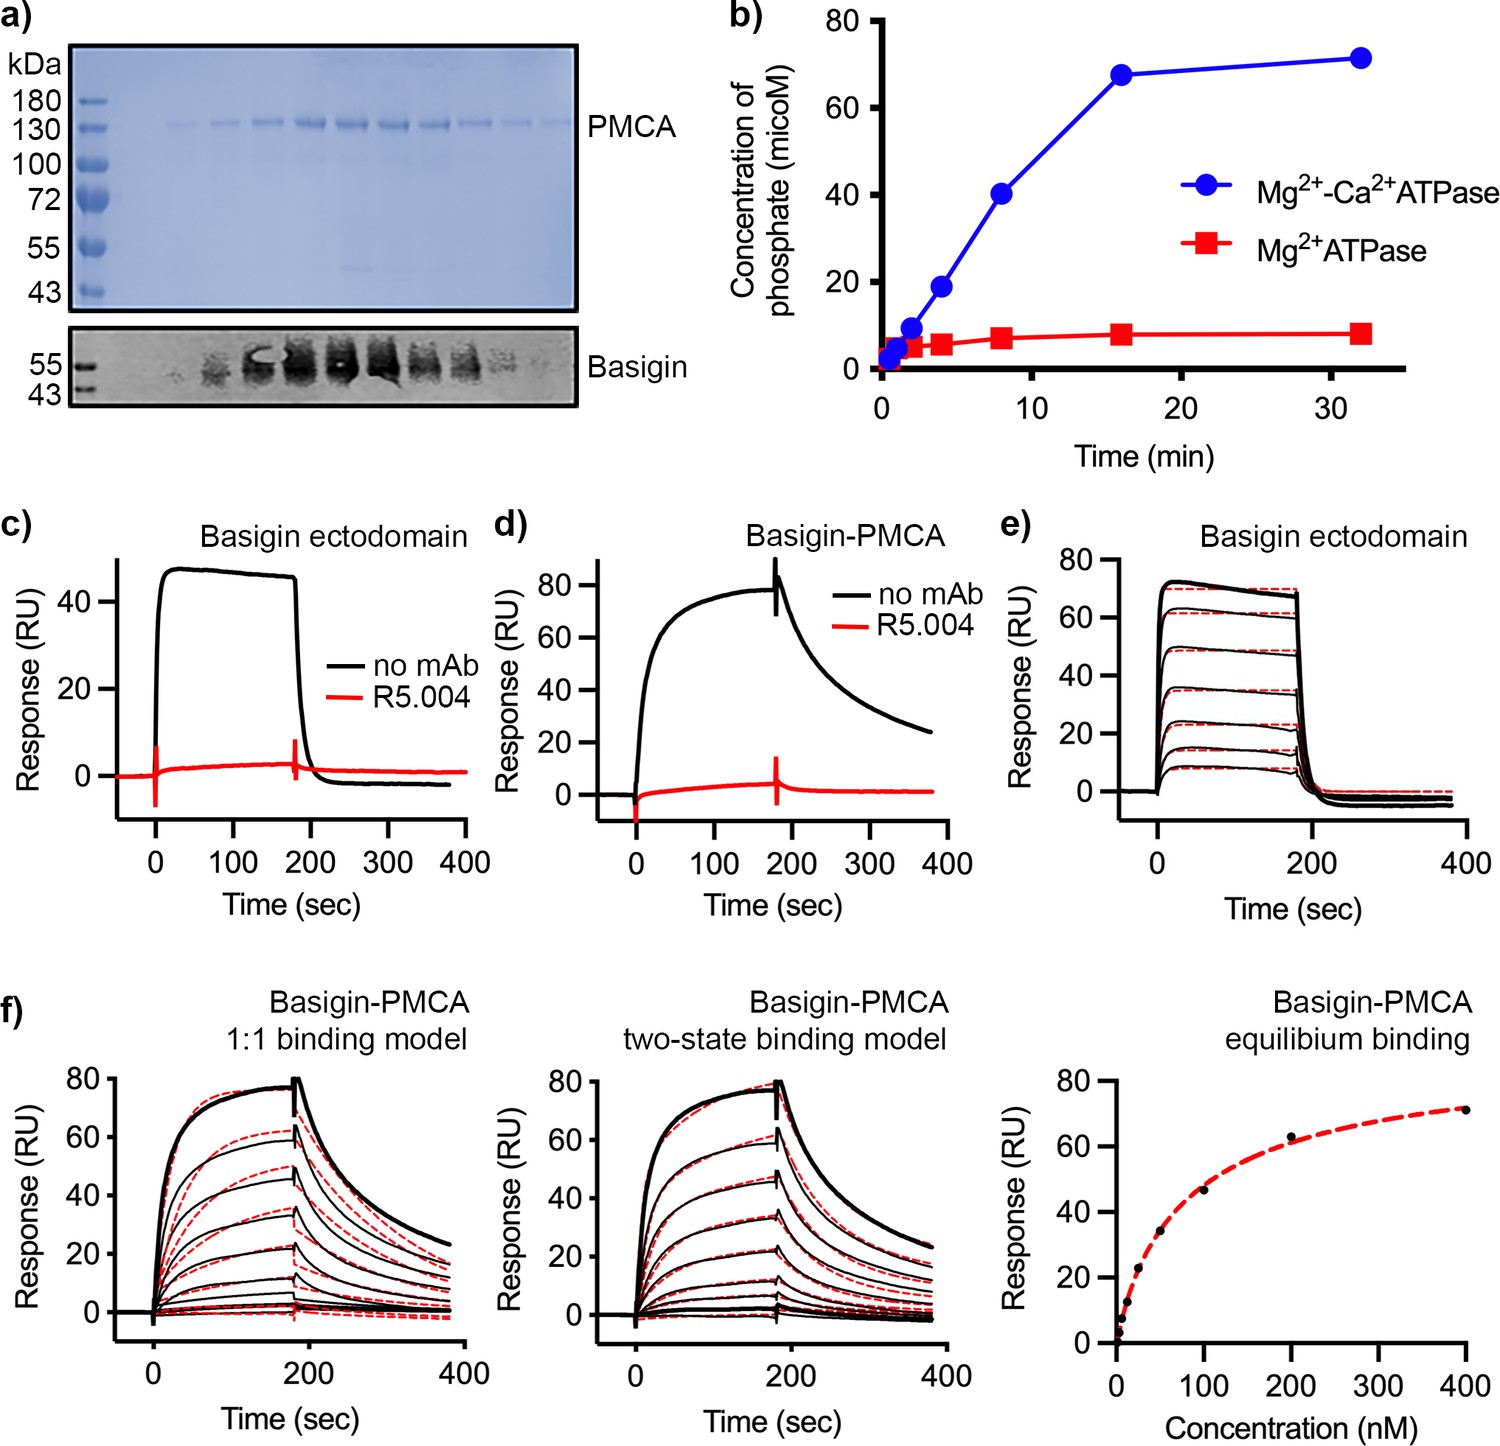
(a) The upper panel shows Coomassie-stained elution fractions from the outcome of purification of PMCA from n-dodecyl-β-D-maltose and cholesterol hemisuccinate (DDM:CHS)-solubilised erythrocyte ghosts using a calmodulin affinity column. PMCA can be observed running at ~130 kDa. The lower panel shows a western blot of the same fractions probed with basigin monoclonal antibody. Basigin and PMCA co-elute. (b) Measurement of phosphate release from ATP catalysed by basigin-PMCA in the absence (red) and presence (red) of Ca2+. The binding of (c) basigin ectodomain and (d) basigin-PMCA to immobilised PfRH5 (at a concentration of 50 nM) in the presence (red) and absence (black) of monoclonal antibody R5.004. Data shown are representative from n=3 biological replicates. (e) The binding of basigin ectodomain to immobilised PfRH5 (with a twofold dilution series starting at 4 μM). Data were filled to a 1:1 binding model with an affinity of 0.79 μM. (f) The binding of basigin-PMCA complex to immobilised PfRH5 (with a twofold dilution series starting at 500 nM). Data were filled to a 1:1 binding model (left), a two-state binding model (centre), and equilibrium model (right, 92 nM affinity).
-
Figure 2—figure supplement 1—source data 1
Data associated with Figure 2—figure supplement 1.
- https://cdn.elifesciences.org/articles/83681/elife-83681-fig2-figsupp1-data1-v2.xlsx
-
Figure 2—figure supplement 1—source data 2
Gels and blots associated with Figure 2—figure supplement 1.
- https://cdn.elifesciences.org/articles/83681/elife-83681-fig2-figsupp1-data2-v2.zip
Figure 2—figure supplement 2

Electrophysiology to assess basigin-plasma membrane calcium ATPase (PMCA) function.
(a) Two-dimensional blue native PAGE western blot analysis as in Figure 1—figure supplement 1c probed with either anti-PMCA1/4 or anti-basigin. The top panel shows solubilised cells transfected with human PMCA4b and basigin, while the lower panel shows basigin-PMCA4 complex purified from these cells. (b) Activation curves of BKCa channels recorded in Chinese hamster ovary (CHO) cells (grey), or cells also transfected with human PMCA4b and basigin with (red) and without (black) addition of PfRCR at 1 μM concentration. Error bars show standard error of mean from n=5 biological replicates. (c) Activation curves of BKCa channels recorded in CHO cells (grey, in the presence of 100 nM, 1 μM, 5 μM, or 50 μM Ca2+), or cells also transfected with human PMCA4b and basigin with (red) and without (black) addition of PfRCR at 1 μM concentration. Error bars show standard error of mean from n=5 biological replicates.
-
Figure 2—figure supplement 2—source data 1
Data associated with Figure 2—figure supplement 2.
- https://cdn.elifesciences.org/articles/83681/elife-83681-fig2-figsupp2-data1-v2.xlsx
-
Figure 2—figure supplement 2—source data 2
Gels and blots associated with Figure 2—figure supplement 2.
- https://cdn.elifesciences.org/articles/83681/elife-83681-fig2-figsupp2-data2-v2.zip
Figure 3 with 2 supplements
P. falciparum reticulocyte homologue 5 (PfRH5) binds to basigin-monocarboxylate transporter 1 (MCT1).
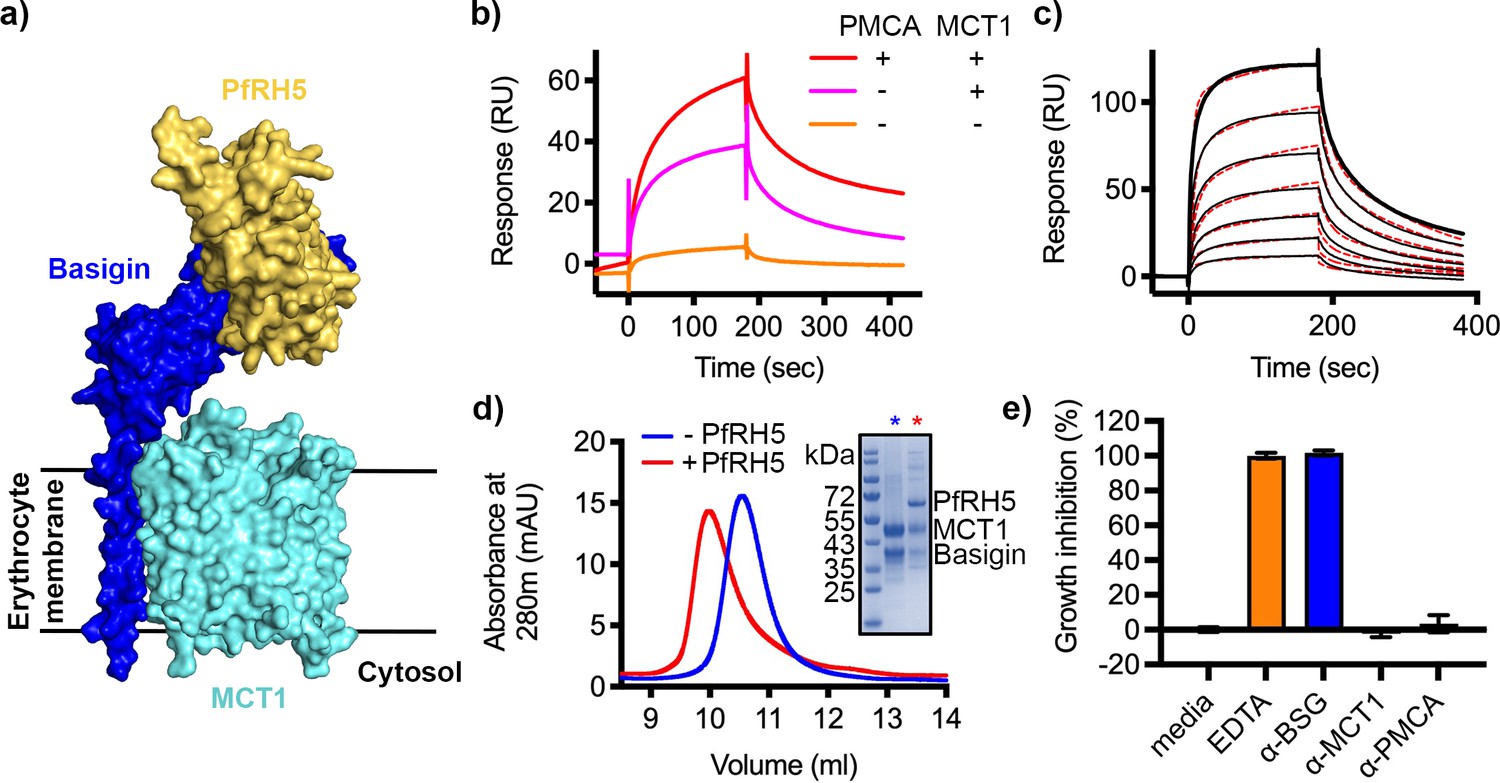
(a) A structural model showing a complex of basigin (blue) and MCT1 (cyan) (based on PDB: 6LYY, Wang et al., 2021) onto which the complex of PfRH5 (yellow) and basigin (blue) (PDB:4U0Q, Wright et al., 2014) has been docked. (b) Surface plasmon resonance (SPR) traces after flowing detergent solubilised erythrocyte membrane basigin-rich fractions (red) and membrane fractions depleted for plasma membrane calcium ATPase (PMCA) (pink) and both PMCA and MCT1 (orange) over a PfRH5-coated surface. (c) An SPR sensogram showing the binding of a concentration series of basigin-MCT1 (twofold dilutions from 1600 nM) to immobilised PfRH5. Black lines show data and dotted red lines show fitting to a two-state binding model. Data shown are representative from n=3 technical replicates. (d) Purified PfRH5 and basigin-MCT1 were assayed for complex formation through size exclusion chromatography using a Superdex 200 increase 10/300 column. The elution profile of basigin-MCT1 alone (blue) and in the presence of PfRH5 (red) are shown. The inset SDS-PAGE gel shows the protein species present in the fractions indicated by stars in the elution trace. (e) Growth inhibition assays assessed the effect of antibodies targeting basigin (at 1 μg/ml) and MCT-1 and PMCAs (both at 75 μg/ml) on P. falciparum growth in human blood culture. Five mM EDTA was used as a positive control (100% growth inhibition) while complete media was used as a negative control (0% growth inhibition). Data are the mean and standard deviation of three technical replicates, with a single example from three biological repeats shown.
-
Figure 3—source data 1
Data associated with Figure 3.
- https://cdn.elifesciences.org/articles/83681/elife-83681-fig3-data1-v2.xlsx
-
Figure 3—source data 2
Gels and blots associated with Figure 3.
- https://cdn.elifesciences.org/articles/83681/elife-83681-fig3-data2-v2.zip
Figure 3—figure supplement 1
Surface plasmon resonance analysis of binding of P. falciparum reticulocyte homologue 5 (PfRH5) to basigin-monocarboxylate transporter 1 (MCT1).
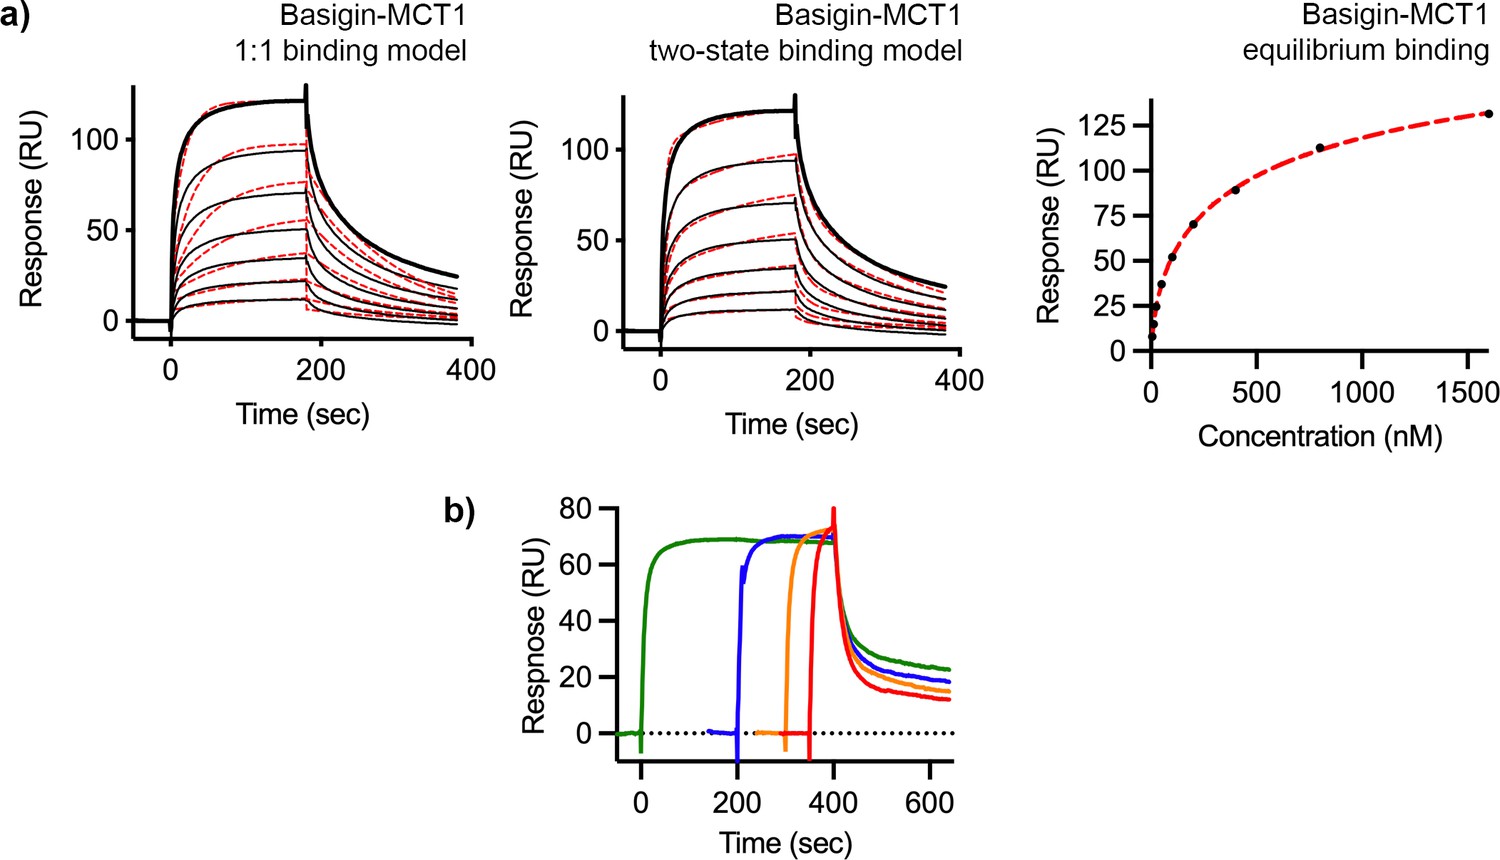
(a) The binding of basigin-MCT1 to immobilised PfRH5 (with a twofold dilution series starting at 1600 nM). Data were filled to a 1:1 binding model (left), a two-state binding model (centre), and equilibrium model (right, 178 nM affinity). (b) Analysis of the binding of basigin-MCT1 (at a concentration of 250 nM) to immobilised PfRH5. The four curves were measured with different association times, showing that increased association time leads to slow dissociation rates. In each case, data are shown as a black line and fitting curves are dashed red lines. Each binding measurement was done twice (n=2).
-
Figure 3—figure supplement 1—source data 1
Data associated with Figure 3—figure supplement 1.
- https://cdn.elifesciences.org/articles/83681/elife-83681-fig3-figsupp1-data1-v2.xlsx
Figure 3—figure supplement 2

Assessment of antibodies targeting basigin, plasma membrane calcium ATPase (PMCA), and monocarboxylate transporter 1 (MCT1).
Human erythrocytes were stained with monoclonal antibodies targeting the extracellular domains of MCT1, PMCA, or basigin. Western blots are for gels loaded with 15 μg of sample and are probed with anti-MCT1 (top-left, 1:250 dilution), anti-PMCAs (top-right, 1:500 dilution), and anti-basigin (bottom-right, 1:1000 dilution), Experiments were done twice (n=2).
-
Figure 3—figure supplement 2—source data 1
Gels and blots associated with Figure 3—figure supplement 2.
- https://cdn.elifesciences.org/articles/83681/elife-83681-fig3-figsupp2-data1-v2.zip
Figure 4 with 1 supplement
Neutralising monoclonal antibodies targeting P. falciparum reticulocyte homologue 5 (PfRH5) prevent its binding to basigin-plasma membrane calcium ATPase (PMCA) and basigin-monocarboxylate transporter 1 (MCT1) complexes.
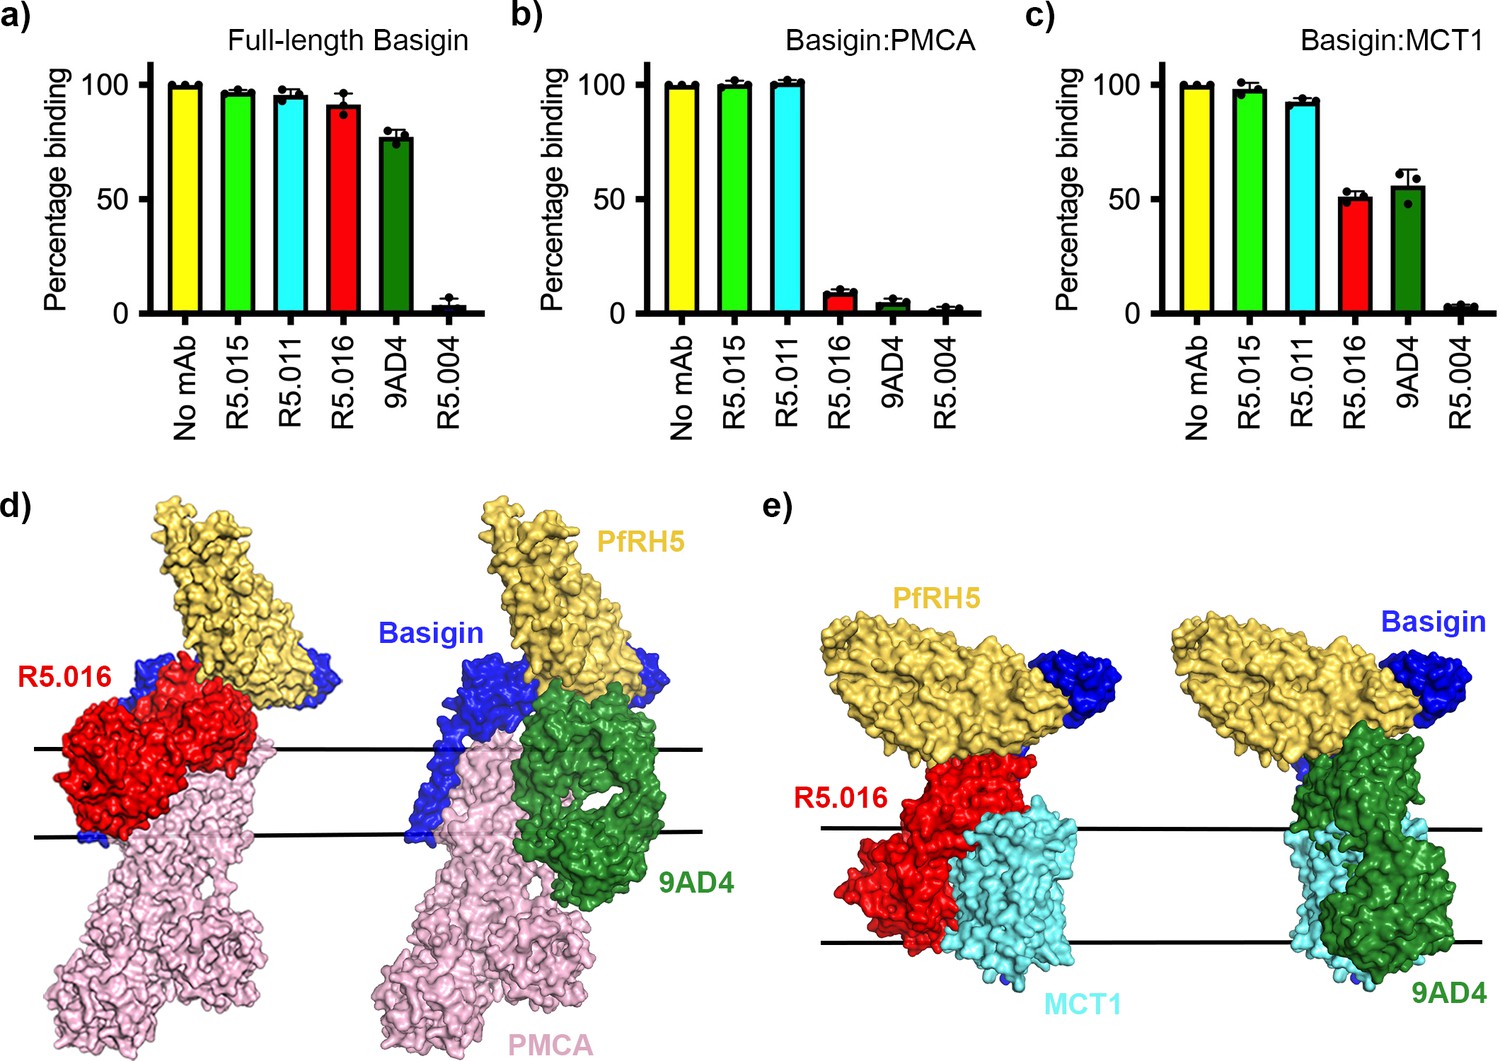
Five different PfRH5-binding monoclonal antibodies were tested for the inhibition of the binding of PfRH5 to (a) full-length basigin, (b) basigin-PMCA complex, and (c) basigin-MCT1 complex. In each case data (n=3) shown are the mean and error bars represent standard error of mean of biological replicates for full-length basigin and basigin-PMCA and technical replicates for basigin-MCT1. (d) Structural models showing a complex of basigin (blue) and PMCA (pink) (based on PDB: 6A69, Gong et al., 2018) onto which the complex of PfRH5 (yellow) and basigin (blue) (PDB:4U0Q, Wright et al., 2014) has been docked. Onto this model has been docked either the complex of PfRH5 (yellow) bound to the Fab fragment of R5.016 (red, PDB:6RCV, Alanine et al., 2019) or of 9AD4 (green; 4U0R, Wright et al., 2014). (e) Structural models showing a complex of basigin (blue) and MCT1 (cyan) (based on PDB: 6LYY, Wang et al., 2021) onto which the complex of PfRH5 (yellow) and basigin (blue) (PDB:4U0Q, Wright et al., 2014) has been docked. Onto this model has been docked either the complex of PfRH5 (yellow) bound to the Fab fragment of R5.016 (red, PDB:6RCV, Alanine et al., 2019) or of 9AD4 (green; 4U0R, Wright et al., 2014).
-
Figure 4—source data 1
Data associated with Figure 4.
- https://cdn.elifesciences.org/articles/83681/elife-83681-fig4-data1-v2.xlsx
Figure 4—figure supplement 1

Neutralising monoclonal antibodies targeting P. falciparum reticulocyte homologue 5 (PfRH5) prevent its binding to basigin-plasma membrane calcium ATPase (PMCA) and basigin-monocarboxylate transporter 1 (MCT1) complexes.
(a) The impact of five different PfRH5-binding monoclonal antibodies on the binding of PfRH5 to basigin ectodomain. Data plot shows mean and standard error from three biological replicates (n=3). (b) Assessment of the impact of the same monoclonal antibodies binding to full-length basigin (left), basigin-PMCA complex (centre), and basigin-MCT1 complex (right) by surface plasmon resonance analysis. (c) Analysis of the dose response of inhibition of binding of basigin-PMCA to immobilised PfRH5 with different concentrations of R5.016. The left-hand panel shows surface plasmon resonance traces while the right-hand panel shows the response plotted against R5.016 concentration.
-
Figure 4—figure supplement 1—source data 1
Data associated with Figure 4—figure supplement 1.
- https://cdn.elifesciences.org/articles/83681/elife-83681-fig4-figsupp1-data1-v2.xlsx
Additional files
-
Supplementary file 1
Binding constants derived from surface plasmon resonance analysis by fitting sensograms with Langmuir 1:1 model.
- https://cdn.elifesciences.org/articles/83681/elife-83681-supp1-v2.docx
-
Supplementary file 2
Binding constants derived from surface plasmon resonance analysis by fitting sensograms with two-state interaction model.
- https://cdn.elifesciences.org/articles/83681/elife-83681-supp2-v2.docx
-
MDAR checklist
- https://cdn.elifesciences.org/articles/83681/elife-83681-mdarchecklist1-v2.pdf
Download links
A two-part list of links to download the article, or parts of the article, in various formats.
Downloads (link to download the article as PDF)
Open citations (links to open the citations from this article in various online reference manager services)
Cite this article (links to download the citations from this article in formats compatible with various reference manager tools)
Erythrocyte invasion-neutralising antibodies prevent Plasmodium falciparum RH5 from binding to basigin-containing membrane protein complexes
eLife 12:e83681.
https://doi.org/10.7554/eLife.83681


