Involvement of superior colliculus in complex figure detection of mice
- Department of Circuits, Structure & Function, The Netherlands Institute for Neuroscience, Royal Netherlands Academy of Arts and Sciences (KNAW), Netherlands
- Department of Vision and Cognition, The Netherlands Institute for Neuroscience, Royal Netherlands Academy of Arts and Sciences (KNAW), Netherlands
- Department of Integrative Neurophysiology, VU University, Netherlands
- Department of Psychiatry, Academic Medical Centre, Netherlands
- Laboratory of Visual Brain Therapy, Sorbonne Université, Institut National de la Santé et de la Recherche Médicale, Centre National de la Recherche Scientifique, Institut de la Vision, France
Figures
Figure 1 with 5 supplements
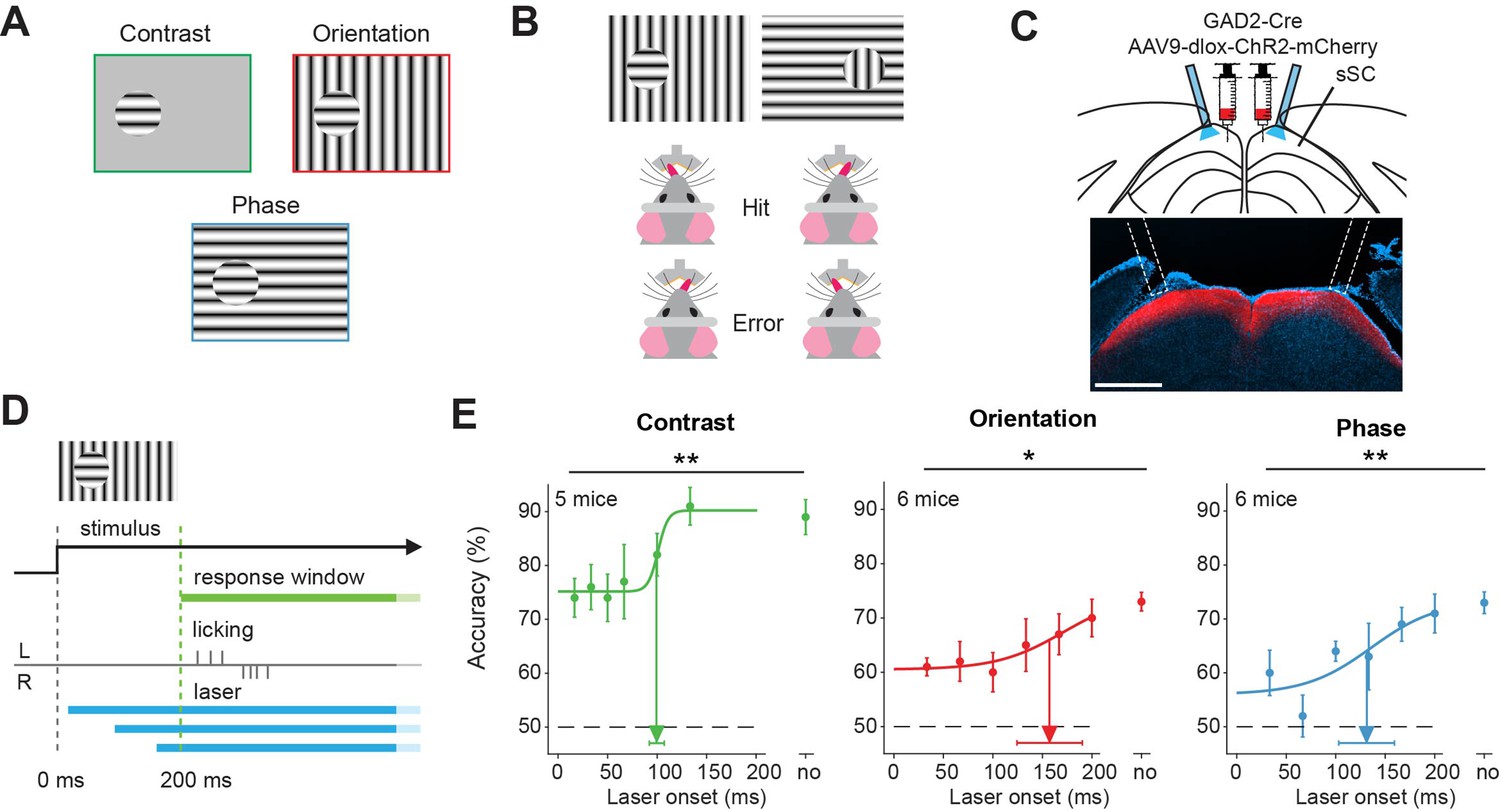
Superior colliculus is involved in figure detection.
(A) The stimulus types that were used for the figure detection task. The stimulus consisted of a static grating that differed from the background in either contrast (top left), orientation (top right), or phase (bottom). (B) Two example stimuli (both orientation task). Licking on the side corresponding to the figure constituted a hit, a lick on the other side an error. (C) Top: Schematic illustration of viral injections and optic fiber implantation. Bottom: histological verification of viral expression. Red: ChR2-mCherry. Blue: DAPI. Scale bar is 600 μm.(D) Timing of the task. We optogenetically inhibited activity in superficial layers of the SC (sSC) by activating sSC GABAergic neurons in both hemispheres at different delays after stimulus appearance. The mice reported the figure location after 200 ms by licking on the same side as the figure. (E) Inhibition of sSC significantly decreased task performance for each figure detection task. Accuracy is defined as hits/(hits + errors). The accuracy on unperturbed trials without the laser condition is indicated by ‘no.’ Colored dots represent means ± SEM of accuracies across mice. Arrow and error bar indicate mean ± SD of bootstrapped fitted inflection points. Dashed line indicates chance level performance. *p<0.05, **p<0.01. Detailed statistics can be found in Figure 1—source data 1.
-
Figure 1—source data 1
It contains details of statistical tests for Figure 1 and Figure 1—figure supplements 2–5.
- https://cdn.elifesciences.org/articles/83708/elife-83708-fig1-data1-v1.docx
Figure 1—figure supplement 1
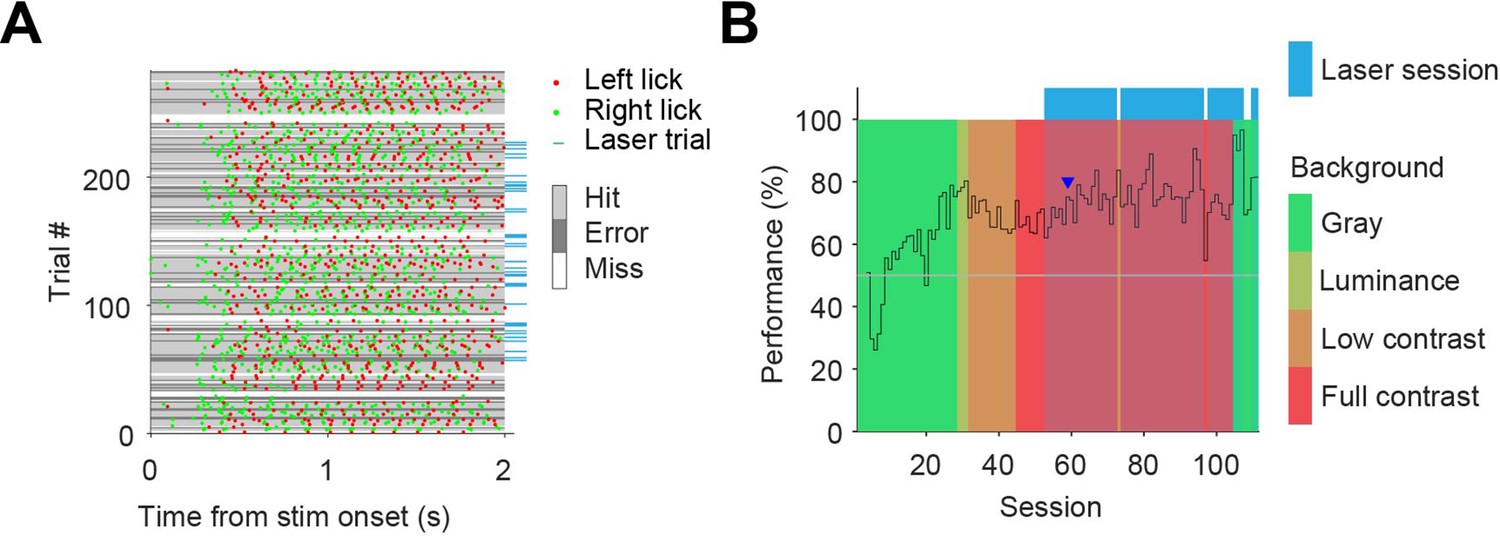
Example behavioral session and learning over sessions.
(A) Example behavioral session. Optogenetic interference took place in trials indicated by blue tag on the right. Session performance was 74% on all trials, and 68% on trials with laser on. (B) Performance over all training/recording sessions for one mouse. Training started with the contrast task (gray background; green sessions), after which background complexity was increased by a change in luminance (yellow sessions), a background grating increasing in contrast (orange), and finally a full contrast grating as background (red). The session of figure A is indicated by the blue arrowhead. The first three sessions did not assess the performance of the mouse as the mouse was learning to lick the spout.
Figure 1—figure supplement 2
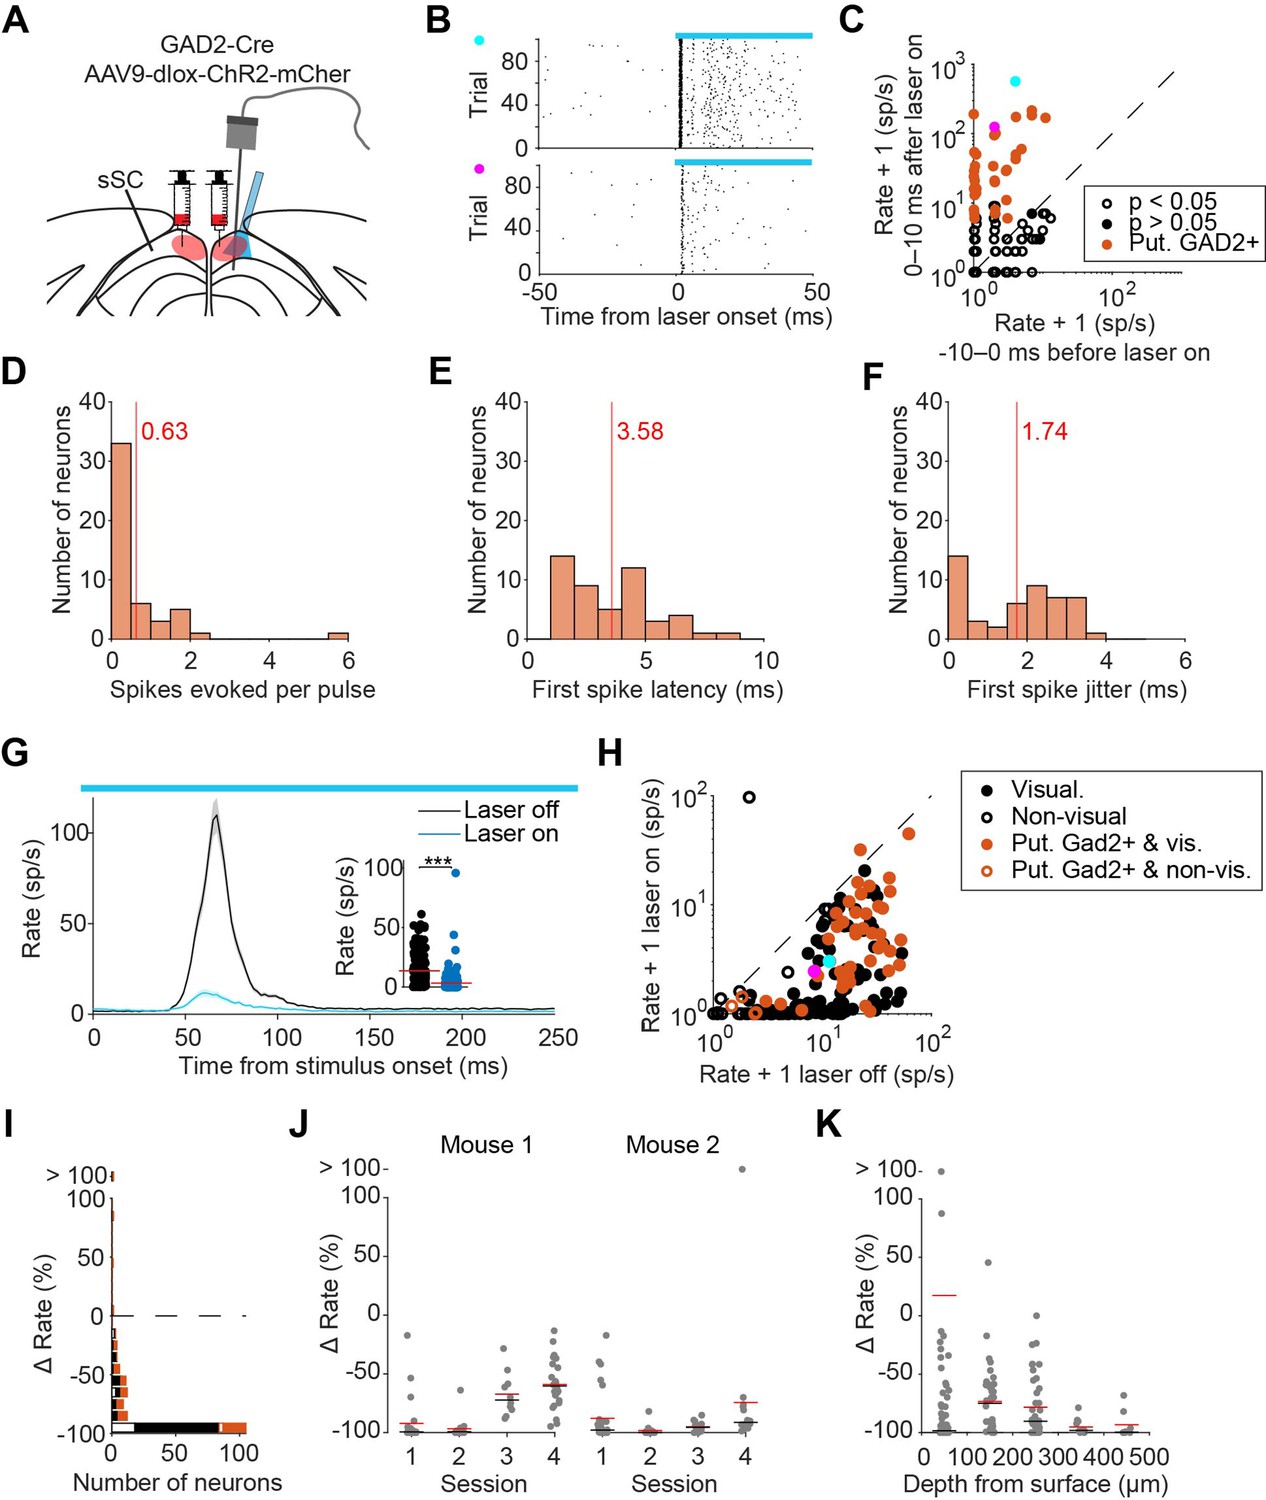
Reduction of visually-evoked neural activity in superficial layers of the SC (sSC) of awake mice by optogenetic activation of GABAergic neurons.
(A) Extracellular recording in sSC of awake GAD2-Cre mice transfected with channelrhodopsin. (B) Example spike raster plot of two putative GAD2-positive neurons during a 50 ms laser pulse. (C) Rate of multi- and single-units in the sSC during the first 10 ms of a 50 ms laser pulse and the last 10 ms before laser onset. Putative GAD2-positive neurons that show an increased rate (p<0.05, zeta-test) indicated in orange. Example units of (B) are indicated by cyan (top example) and magenta (bottom example). (D) Average number of spikes evoked in a 10 ms window after laser onset by putative GAD2-positive neurons. (E) First spike latency and (F) Jitter of the first spike of putative GAD2-positive neurons evoked by laser stimulation. (D–F) red lines indicate the mean. (G) Mean (± SEM) population responses of visually responsive neurons in sSC of awake mice to a static grating in laser off (black) and laser on (blue) conditions. Laser was turned on approx. 30 ms before stimulus onset Inset, Average firing rate 0–200 ms after grating onset in laser off and laser on conditions. Red lines indicate the mean. ***p<0.001. (H) Scatter plot of mean rates during presentation of a static grating for laser on and off conditions of putative GAD2-positive neurons (orange), visually responsive (closed circles), and non-visually responsive cells (open circles). Dashed line indicates parity. (I) Percentage change in average firing rate 0–200 ms after grating onset in laser on relative to laser off trials. (J) The reduction of the rate during optogenetic interference in GAD2-Cre mice is present across sessions. (K) The reduction of the rate during optogenetic interference in GAD2-Cre mice is present across the entire depth of sSC. Depth is relative to the dorsal SC surface. (J–K) Red and black lines indicate the mean and median, respectively.
Figure 1—figure supplement 3

No visual response to the laser light in wild-type mice.
(A) Extracellular recording in sSC of awake wild-type mice. (B) Population rates (mean ± SEM) show no response to a 50 ms laser pulse around the time of response to retinal visual input, indicating that the laser does not cause a visual response. Laser artifact is removed ± 1 ms around laser onset and offset. (C) Firing rates before and for the 200 ms following the start of the 50 ms laser pulse for single- and multi-units in sSC of 2 wild-type (WT) mice (49 visually responsive units, 35 non-visual units) show no units responding to the laser light. (D) Mean (± SEM) population responses of visually responsive neurons in sSC of awake mice to a static grating in laser off (black) and laser on (blue) trials. Laser was turned on approx. 30 ms before stimulus onset (109 visually responsive units, 111 non-visual units). (E) Mean rates per unit during visual stimulation for laser on versus laser off trials. Red lines indicate the mean. (E) Laser illumination causes a small, but significant, reduction in visual response (p<0.001, LME).
Figure 1—figure supplement 4
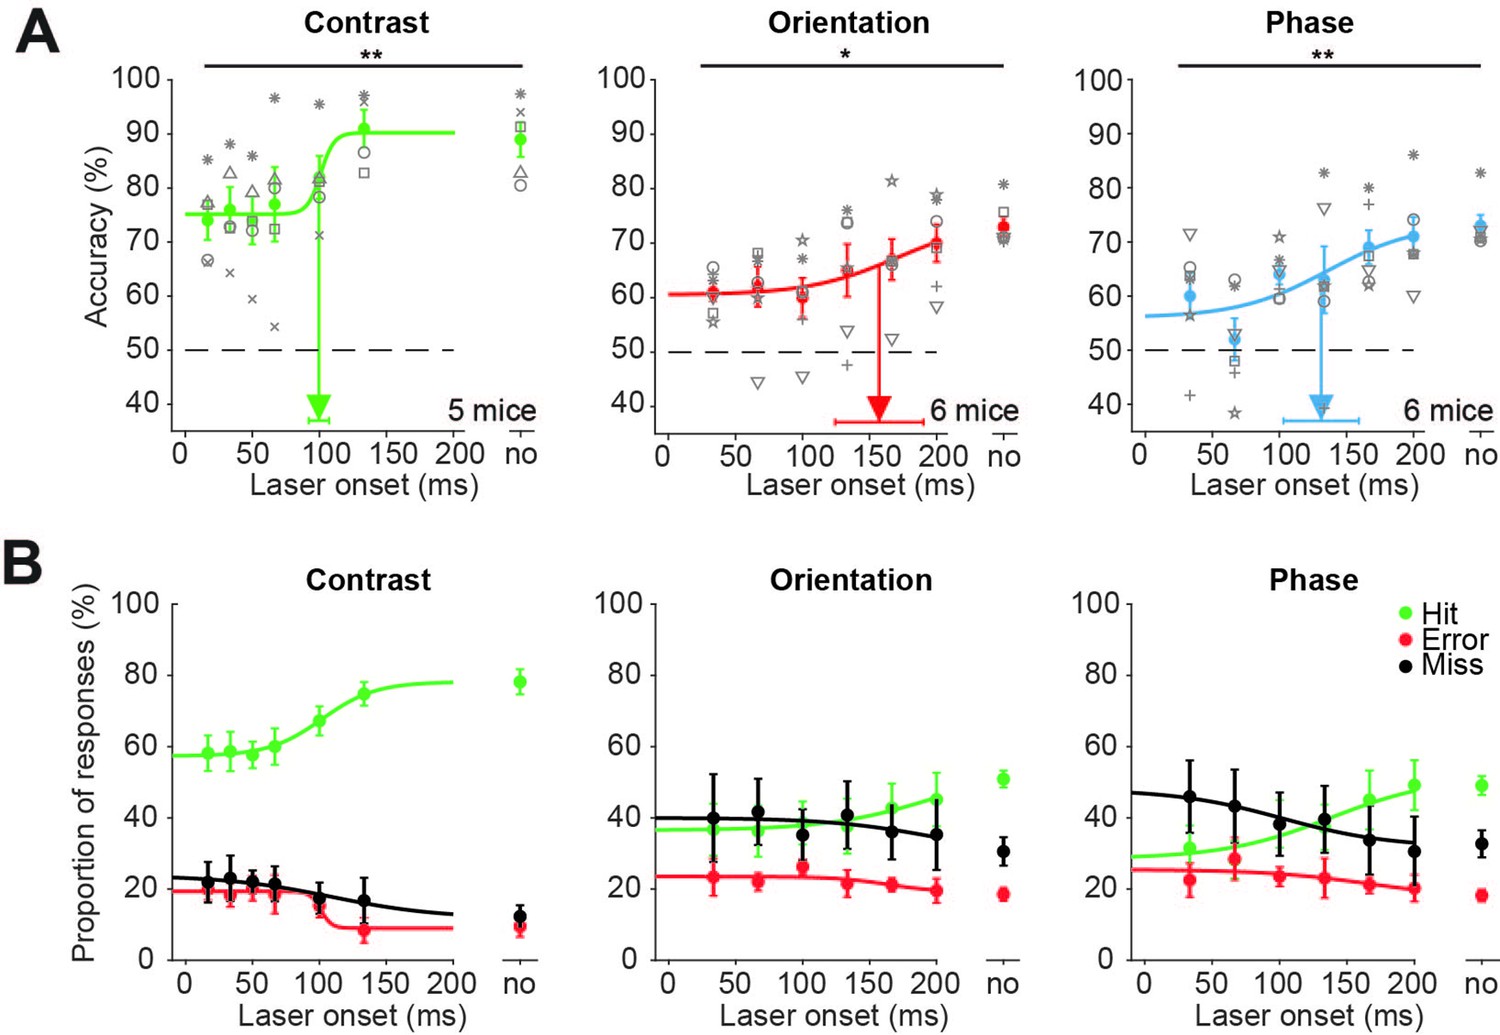
Superior colliculus is involved in figure detection: data for individual mice.
(A) Supplementary data to Figure 1E, showing accuracies for individual mice. Inhibition of superficial layers of the SC (sSC) significantly decreased task performance for each figure detection task. The accuracy on unperturbed trials without the laser condition is indicated by ‘no.’ Colored dots represent means ± SEM of accuracies across mice. Gray symbols indicate accuracies of individual mice for each laser onset condition. Arrow and error bars indicate mean ± SD of bootstrapped fitted inflection points. Dashed line indicates chance level performance. *p<0.05, **p<0.01. (B) Average proportions of hit, error, and miss responses separated by laser onset and trial type. The without-laser condition is indicated by ‘no.’ Colored dots represent means ± SEM of average proportions across mice. Curves indicate logistic fits.
Figure 1—figure supplement 5
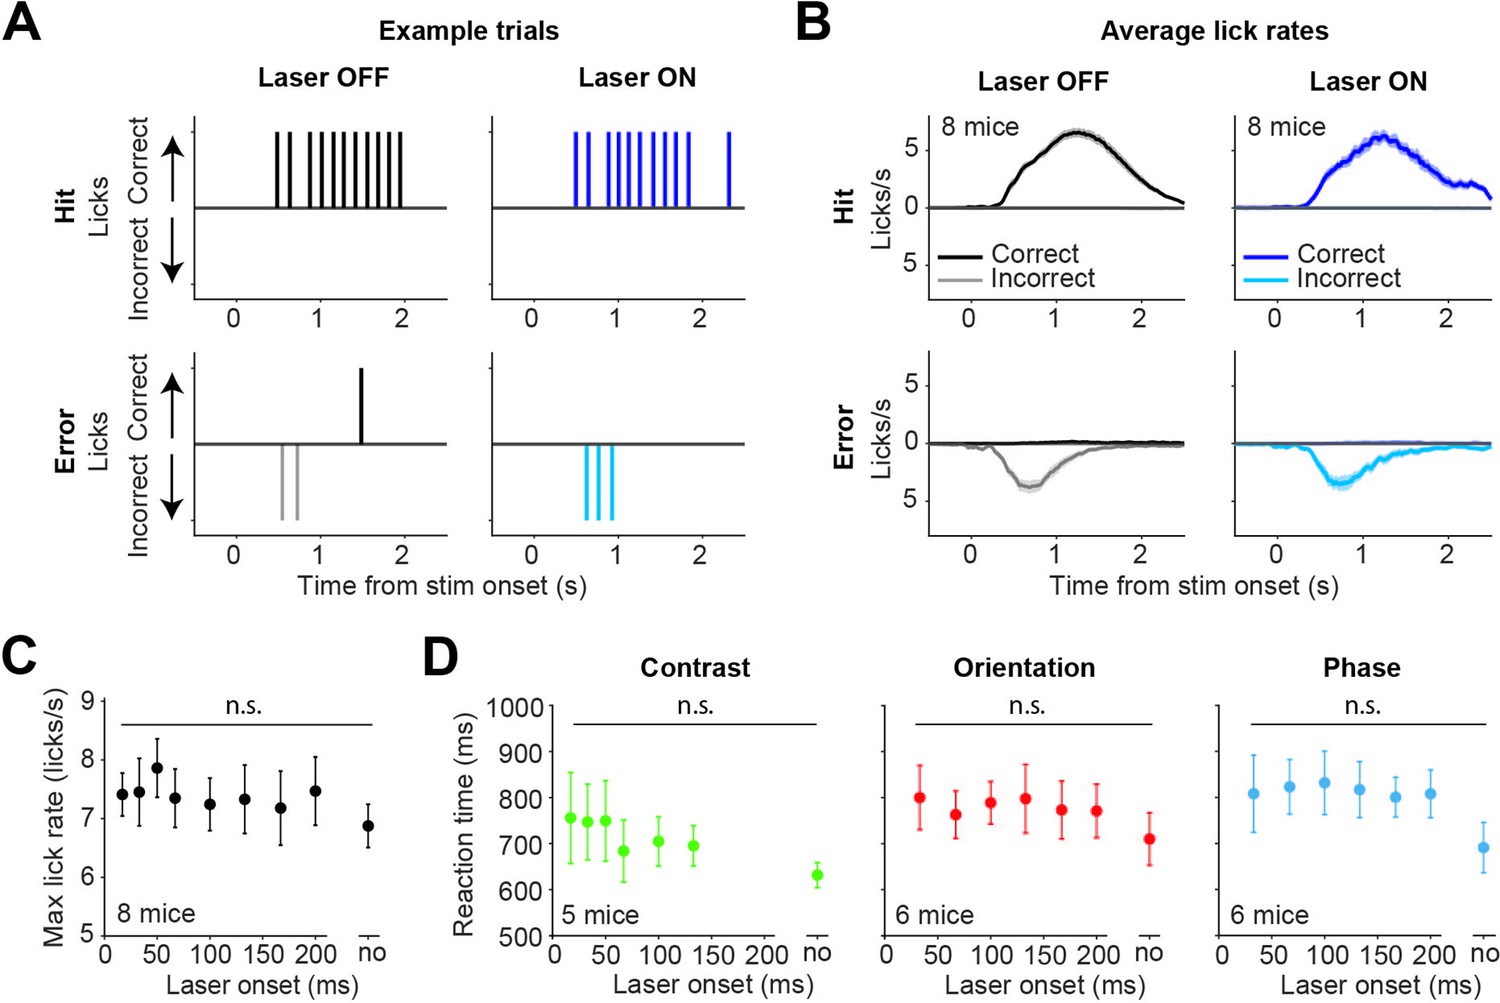
Optogenetic inhibition by activating inhibitory superficial layers of the SC (sSC) neurons does not affect lick rates and reaction times.
(A) Example of licking behavior in four different types of trials. Upward ticks indicate licks on the correct side, downward ticks indicate licks on the incorrect side. Top row shows Hit trials, bottom row shows Error trials. Left column shows laser OFF trials, right column shows laser ON trials. (B) Mean (± SEM) lick rates for each of the trial types, across mice. The mice typically only licked one side on each trial. Mice continued to lick on Hit trials, as they received the water reward through the lick spout. (C) Maximum lick rates (on Hit trials) were not significantly affected by the latency of optogenetic inhibition. Dots represent means ± SEM of reaction times across mice. The reaction time on unperturbed trials without the laser condition is indicated by ‘no.’ (D) Reaction times of the mice were not significantly affected by the latency of optogenetic inhibition.
Figure 2 with 3 supplements
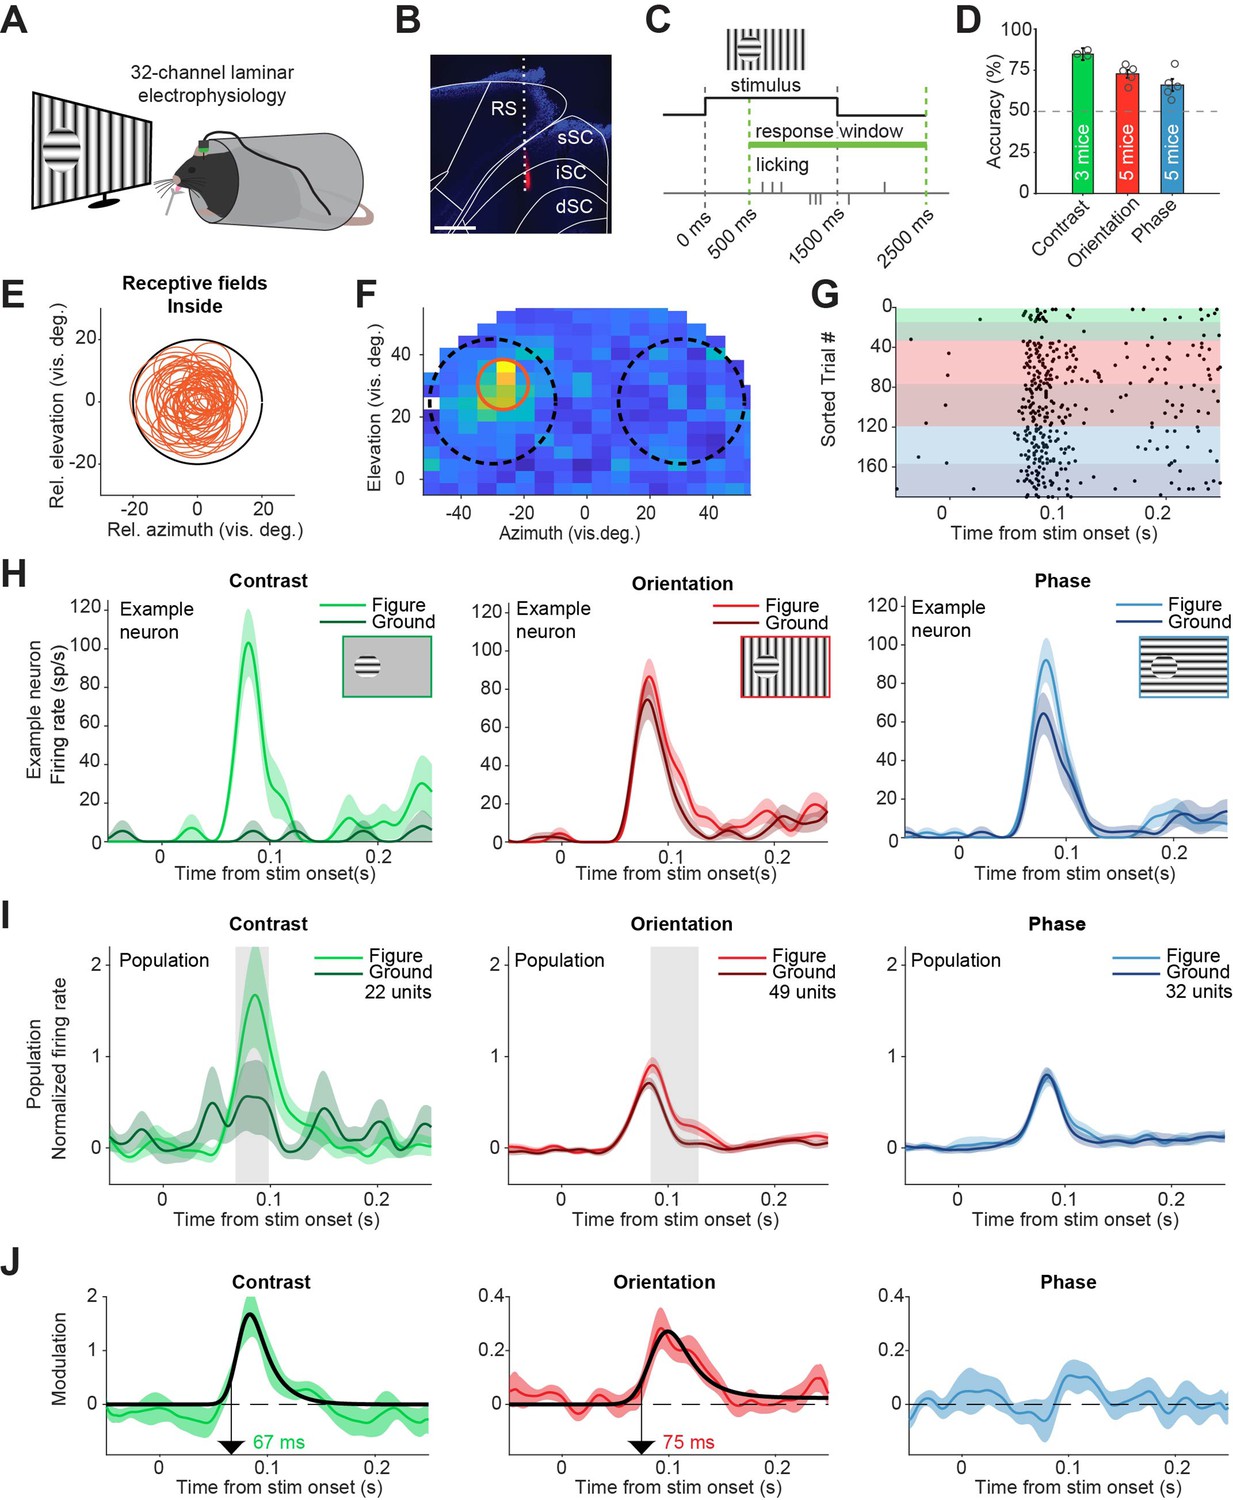
Superior colliculus activity elicited by contrast and figure-ground stimuli.
(A) Schematic illustration of setup. (B) Histological verification of electrode track. Blue: DAPI. Red: diI. Scale bar is 600 μm. (C) Timing of the task. The mice could report the figure location after 500 ms. (D) Accuracy of the mice in each task, mean ± SEM. (E) Estimated receptive fields of neurons with a receptive field (RF) entirely inside the figure. (F–H) Example neuron. (F) Receptive field of an example neuron. Black circles indicate the position of the figure (on top of RF) and ground (outside of RF) stimulus in the visual field. Red circle indicates estimated RF. (G) Raster plot, sorted by task and trial type. Each dot indicates a spike. Green, red and blue colors indicate contrast, orientation, and phase task trials, respectively. Brighter colors indicate figure trials, and darker colors indicate ground trials. (H) Mean (± SEM) activity of the example neuron for each task. (I) Mean (± SEM) population responses for each task. Gray patches indicate time clusters where the difference between figure and ground is significant (p<0.05). (J) Difference between figure and ground responses in each task and estimated onset of the response difference. Colored lines indicate data, black lines indicate fit of the response. Arrows indicate the onset latency of the response difference. Detailed statistics can be found in Figure 2—source data 1.
-
Figure 2—source data 1
It contains details of statistical tests for Figure 2 and Figure 2—figure supplement 1.
- https://cdn.elifesciences.org/articles/83708/elife-83708-fig2-data1-v1.docx
Figure 2—figure supplement 1
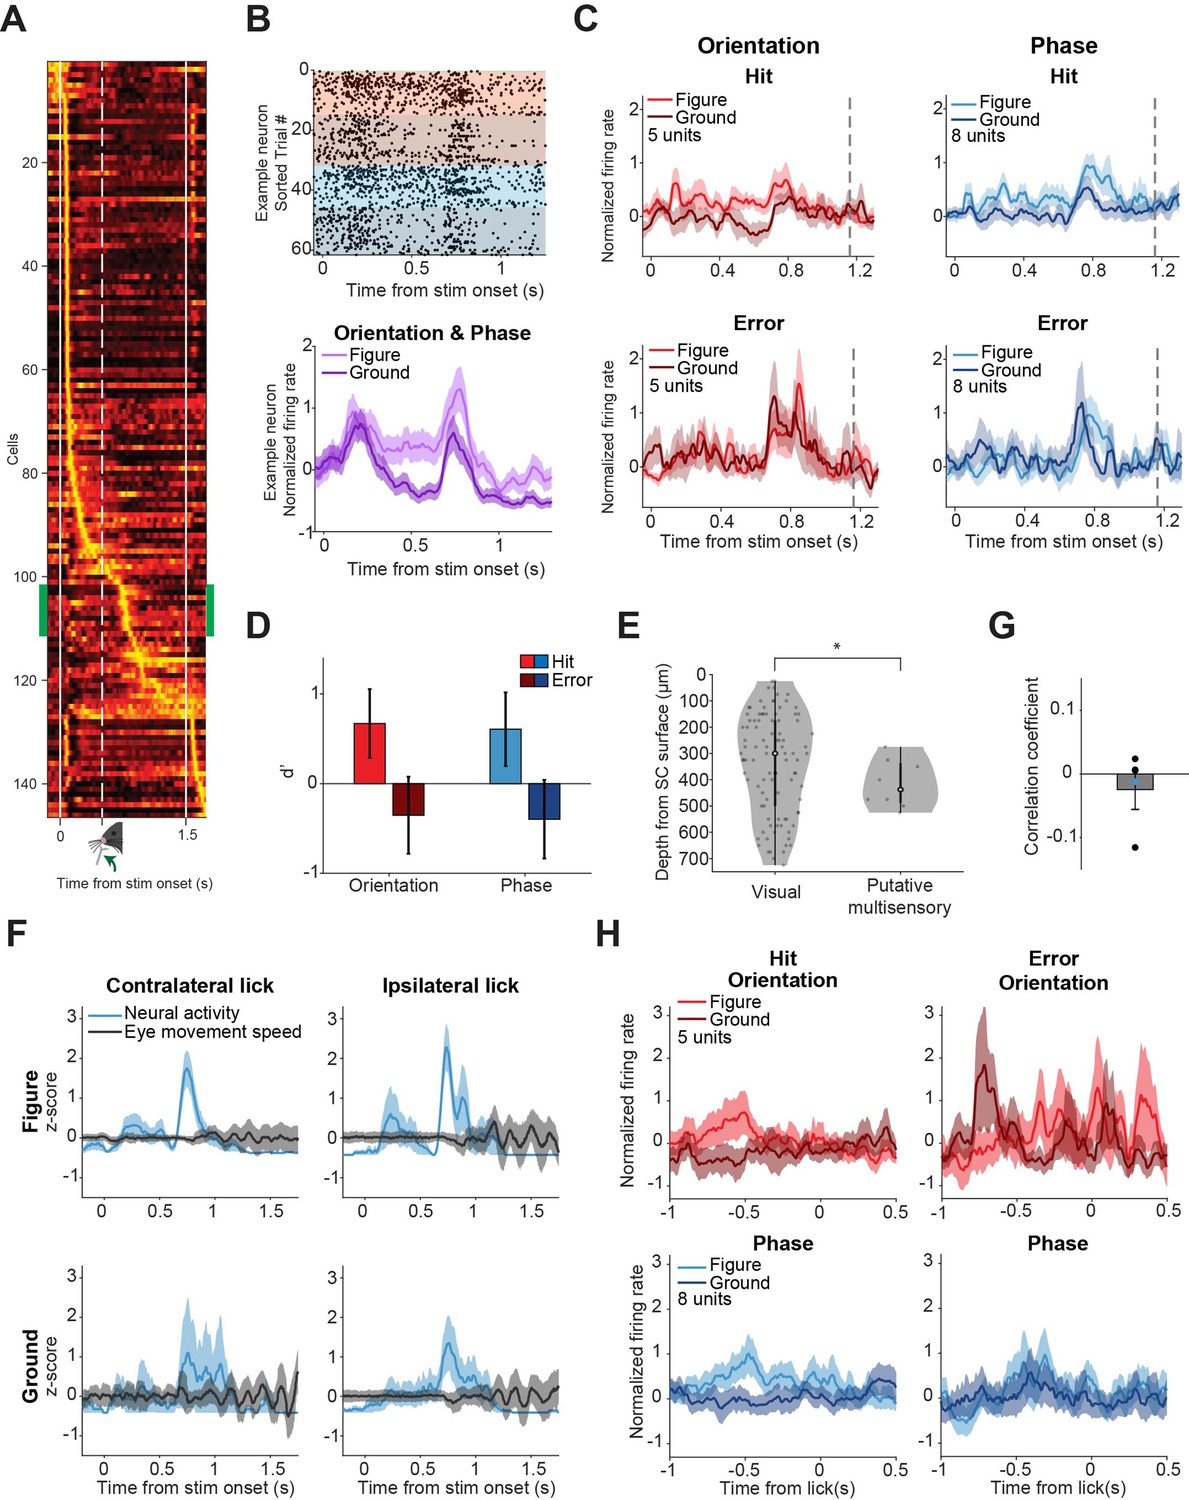
Putative multisensory neurons show task-related responses.
(A) Mean responses of all recorded neurons, sorted by the time of their peak response. A small group of neurons (indicated by green sidebars) is time-locked to the stimulus (p<0.05, Zeta-test) and most active around 700 ms: just after the lick spout moves towards the mouse, but before the mouse licks. (B) Responses of example putative multisensory neuron. Top: Raster plot where each dot indicates a spike. Red and blue indicate orientation and phase task trials, respectively. Brighter colors indicate figure trials, darker colors indicate ground trials. Bottom: Mean response of example neuron for figure vs. ground trials (orientation and phase trials combined). Shading indicates SEM. (C) Population figure-ground responses for hits and errors across all putative multisensory cells. Dashed gray line indicates the mean reaction time of the mice. Note that the response difference between figure and ground trials is larger for hits than for errors. (D) Neuronal d-primes for hit and error trials, p=0.044 for the main effect of response (Hit vs. Error), post-hoc analysis showed p>0.05 for the individual tasks. (E) The variances of estimated histological depth of visual vs. putative multisensory cells are different. *p=0.046. (F) Neural activity for example putative multisensory neurons plotted together with mean eye movement speed for different (stimulus/response) types of trials. Shading indicates SEM. (G) No significant correlation between eye movement speed and neural activity of putative multisensory neurons (p=0.49). Dots indicate individual neurons. Blue dot indicates the example neuron. (H) Population responses for hits vs. errors for all putative multisensory cells, centered on the time of the first lick in the response window. Note that the distinctive peak from (C) is not present here, suggesting that the peak response is locked to the stimulus onset, and not to the first lick.
Figure 2—figure supplement 2
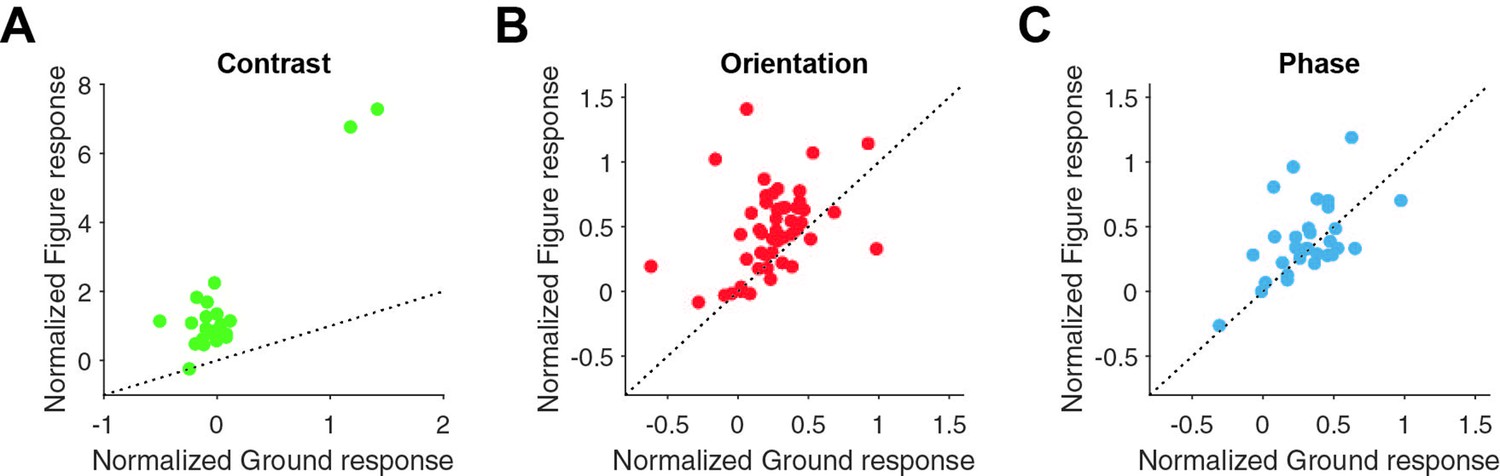
Figure-ground modulation of individual neurons for different stimuli.
(A) Normalized figure vs. ground response for contrast-defined figures during the period of significant difference in Figure 2I. (B) Normalized figure versus ground response for orientation-defined figures during the period of significant difference in Figure 2I. (C) Normalized figure versus ground response for phase-defined figures during the period of significant difference for the orientation-defined figures in Figure 2I.
Figure 2—figure supplement 3

Eye position and pupil dilation during object detection tasks.
(A) Normalized eye tracking data and average firing rate of the recorded neurons during one example trial. (B) Mean (± SEM) eye X/Y position and pupil dilation across mice. Trials with early (0–450 ms) eye movements were excluded from analysis. In the included trials, the mice show no eye movements or pupil dilation changes during the peak of the visual response (0–250 ms).
Figure 3 with 1 supplement
Decoding the stimulus identity from population responses in superior colliculus.
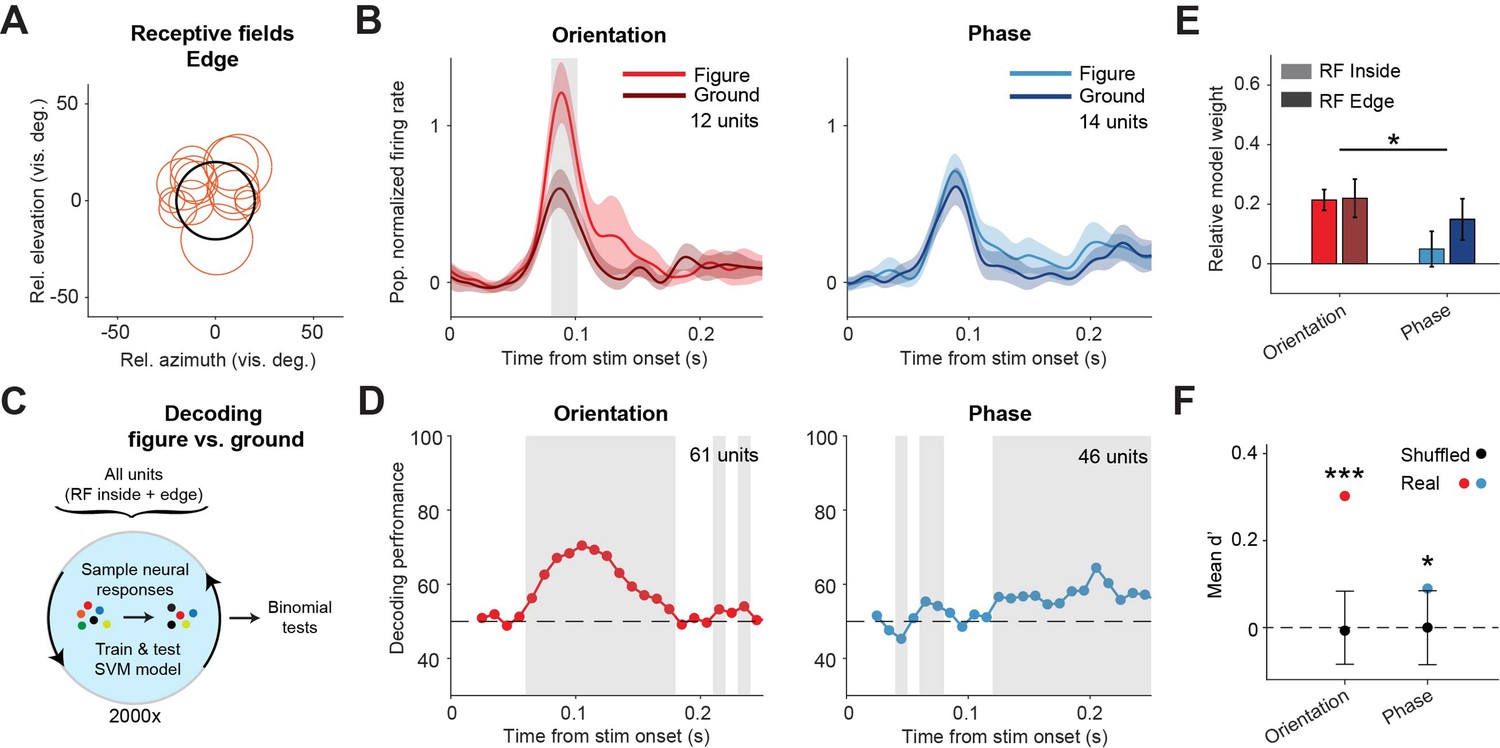
(A) Estimated receptive fields of the neurons with a receptive field (RF) on the figure edge. (B) Mean (± SEM) population responses of the RF edge neurons for each task. Gray patches indicate time clusters where the difference between figure and ground is significant (p<0.05). (C) Schematic illustration of bootstrapping and decoding process. (D) Decoding performance of a linear support vector machine (SVM) classifier for each task with neurons with RF inside the figure and on the figure edge. Performance was computed using a sliding window of 50 ms in steps of 10 ms. Gray regions indicate decoding performance significantly different from chance (p<0.05). (E) Mean (± SEM) of relative model weights for each task and RF type. *p<0.05 (F) Neuronal d-primes during the window with the best decoding performance. Black bars indicate the mean (±95% confidence interval) population d-primes of bootstraps with shuffled trial identities. Colored dots indicate the real mean of d-primes in the population. *p<0.05, ***p<0.001. Detailed statistics can be found in Figure 3—source data 1.
-
Figure 3—source data 1
It contains details of statistical tests for Figure 3.
- https://cdn.elifesciences.org/articles/83708/elife-83708-fig3-data1-v1.docx
Figure 3—figure supplement 1

Figure-ground modulation for neurons with receptive field (RF) on figure edge.
(A) Normalized figure versus ground response of neurons with an RF on the figure edge for orientation-defined figures during the period of significant difference in Figure 3B. (B) Normalized figure versus ground response of neurons with an RF on the figure edge for phase-defined figures during the period of significant difference for orientation-defined stimulus in Figure 3B.
Figure 4 with 1 supplement
Different discriminability in superficial layers of the SC (sSC) for hits vs.errors.
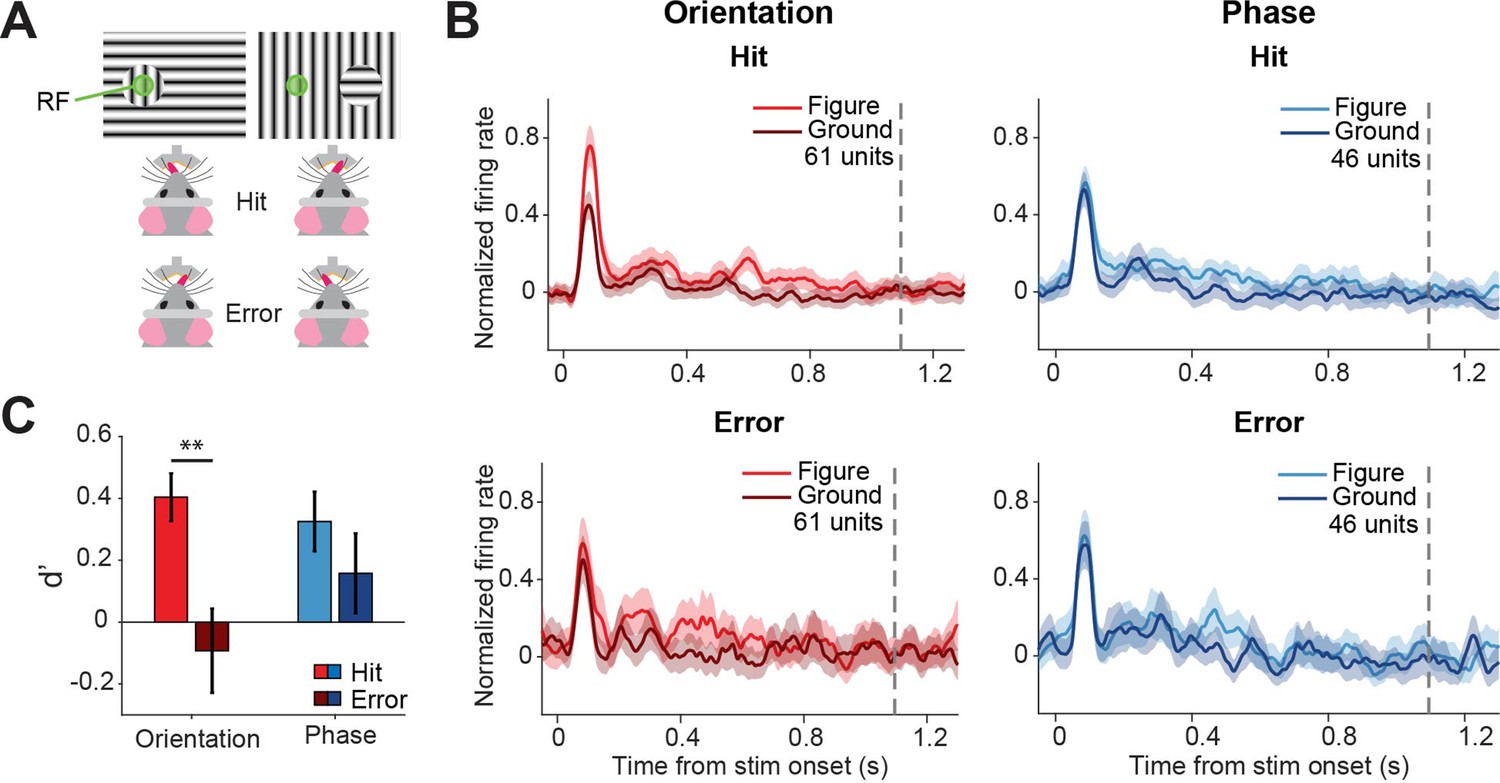
(A) Two example stimuli (both orientation task). Licking on the side corresponding to the figure constituted a hit, and vice versa. RF: receptive field. Note that the information inside the receptive field is the same between the two stimuli. (B) Population responses for hits vs. errors. Dashed gray line indicates the mean reaction time of the mice. Note that the difference between figure and ground is larger for hits than errors. (C) Neuronal d-primes were higher for hit trials than for error trials. **p<0.01. Detailed statistics can be found in Figure 4—source data 1.
-
Figure 4—source data 1
It contains details of statistical tests for Figure 4.
- https://cdn.elifesciences.org/articles/83708/elife-83708-fig4-data1-v1.docx
Figure 4—figure supplement 1

Figure-ground modulation for neurons split in hit and error trials.
(A) Normalized figure versus ground response of neurons for orientation-defined figures during the period between stimulus onset and first lick, split in hit (left) and error trials (right). (B) Normalized figure versus ground response of neurons with an RF on the figure edge for phase-defined figures during the period between stimulus onset and first lick, split in hit (left) and error trials (right).
Additional files
Download links
A two-part list of links to download the article, or parts of the article, in various formats.
Downloads (link to download the article as PDF)
Open citations (links to open the citations from this article in various online reference manager services)
Cite this article (links to download the citations from this article in formats compatible with various reference manager tools)
Involvement of superior colliculus in complex figure detection of mice
eLife 13:e83708.
https://doi.org/10.7554/eLife.83708


