Optogenetic manipulation of Gq- and Gi/o-coupled receptor signaling in neurons and heart muscle cells
- Graduate School of Science, Nagoya University, Japan
- Graduate School of Bioagricultural Sciences, Nagoya University, Japan
- Institute for Advanced Research, Nagoya University, Japan
- Graduate School of Science, Osaka Metropolitan University, Japan
Figures
Figure 1
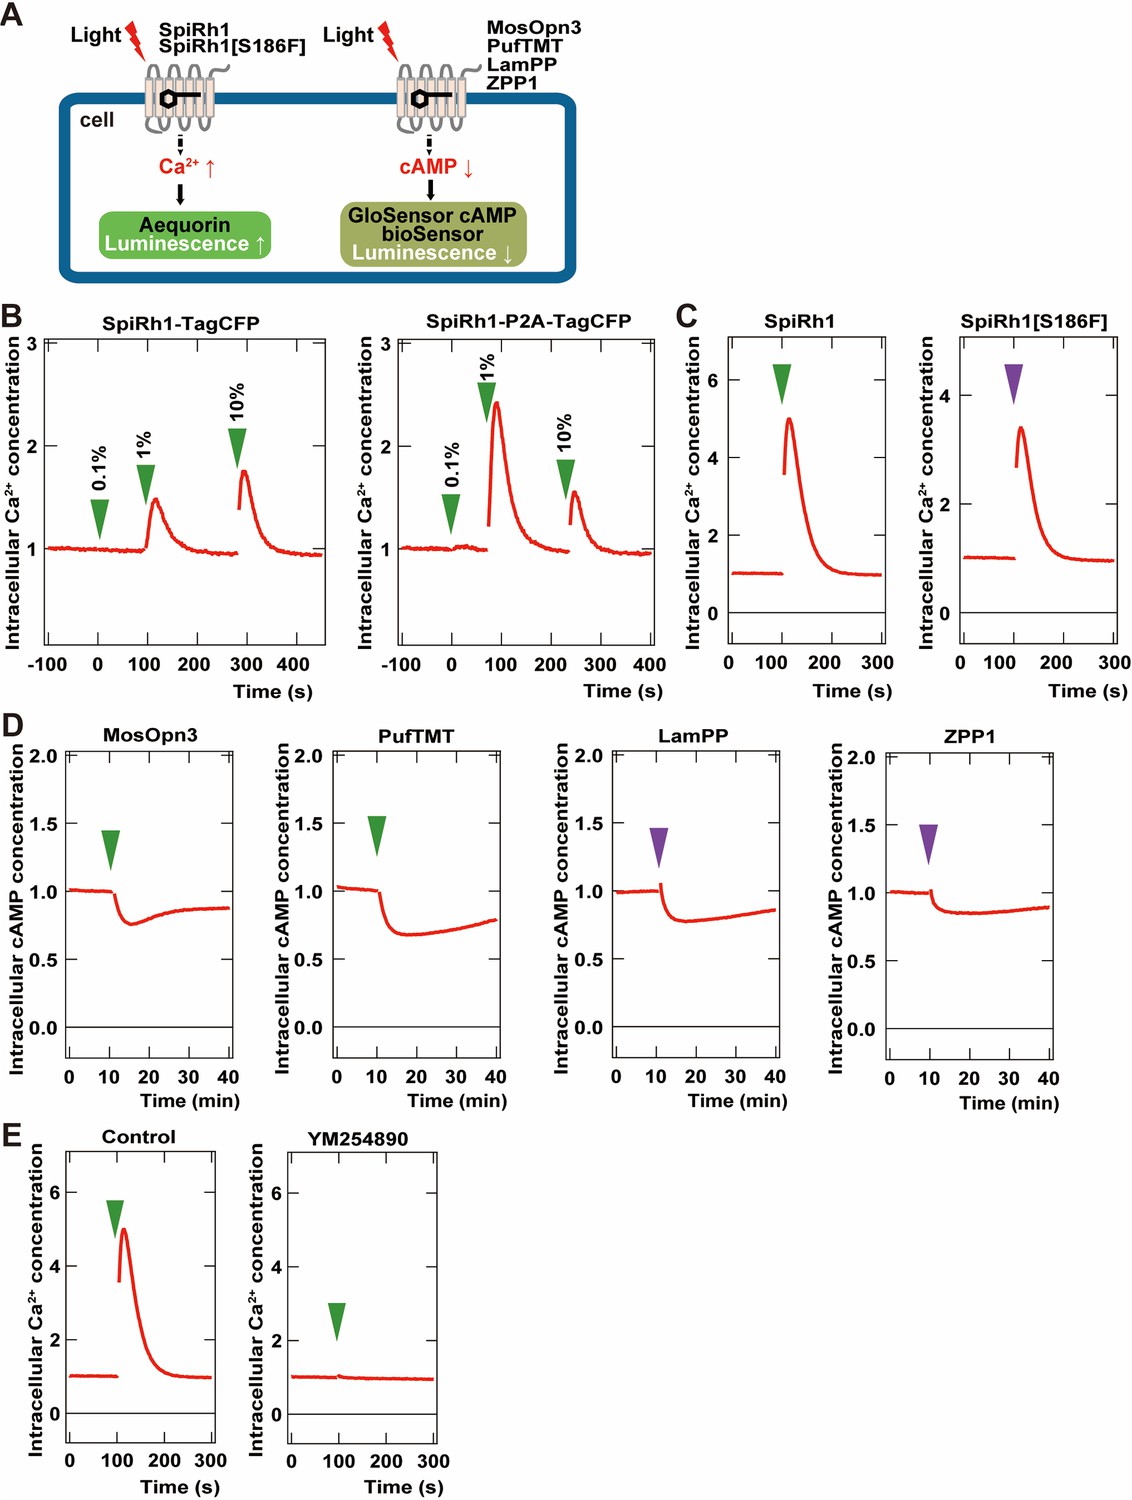
Activity of G-coupled bistable rhodopsins in HEK293S cells.
(A) Schematic of intracellular Ca2+ or cAMP measurements in HEK293S cells. Intracellular Ca2+ and cAMP concentrations in rhodopsin-expressing HEK293S cells were measured using the aequorin m2 assay or the GloSensor 20 F assay, respectively. (B) Comparison of optogenetic activities of Gq-coupled Spider Rh1 (SpiRh1) expressed using TagCFP fusion protein and the P2A-TagCFP system. HEK293S cells were transfected with an expression plasmid for the fusion protein of SpiRh1 and TagCFP (SpiRh1-TagCFP, left panel), or for that of Flag-tagged SpiRh1, porcine teschovirus 2 A peptide, and TagCFP (SpiRh1-P2A-TagCFP, right panel). Transfected cells were incubated with 11-cis retinal and stimulated by different intensities of 500 nm light (0.1%, 1%, or 10% of the light intensity, with 0.106 mW/mm2 as 100%). Intracellular Ca2+ concentration was measured by using aequorin m2 and is indicated as a ratio to the unstimulated state in the graphs. (C) Comparison of activities of Flag-tagged SpiRh1 and SpiRh1 [S186F]. Transfected cells were stimulated by 500 nm (green arrow, 0.106 mW/mm2) or 410 nm (purple arrow, 0.0194 mW/mm2) light and intracellular Ca2+ concentration was measured. (D) Light-stimulus-dependent reduction of intracellular cAMP level by Gi/o-coupled mosquito Opn3 (MosOpn3), pufferfish TMT (PufTMT), lamprey PP (LamPP), and zebrafish PP1 (ZPP1). HEK293S cells were transfected with expression plasmids for flagged-tagged Gi/o rhodopsins. Transfected cells were incubated with 11-cis retinal and stimulated by 500 nm (green arrow) or 410 nm (purple arrow) light. Intracellular cAMP concentration was measured with GloSensor 20 F and is indicated as a ratio to the unstimulated state. (E) Effects of Gαq inhibitor YM254890 on SpiRh1. HEK293S cells transfected with an expression plasmid for SpiRh1 were incubated with 11-cis retinal alone (left panel) or with 11-cis retinal and YM254890 (right panel), and stimulated by 500 nm light. Intracellular Ca2+ concentration was measured.
-
Figure 1—source data 1
Data for Figure 1, activity of bistable rhodopsins in HEK293S cells.
- https://cdn.elifesciences.org/articles/83974/elife-83974-fig1-data1-v1.xlsx
Figure 2 with 3 supplements
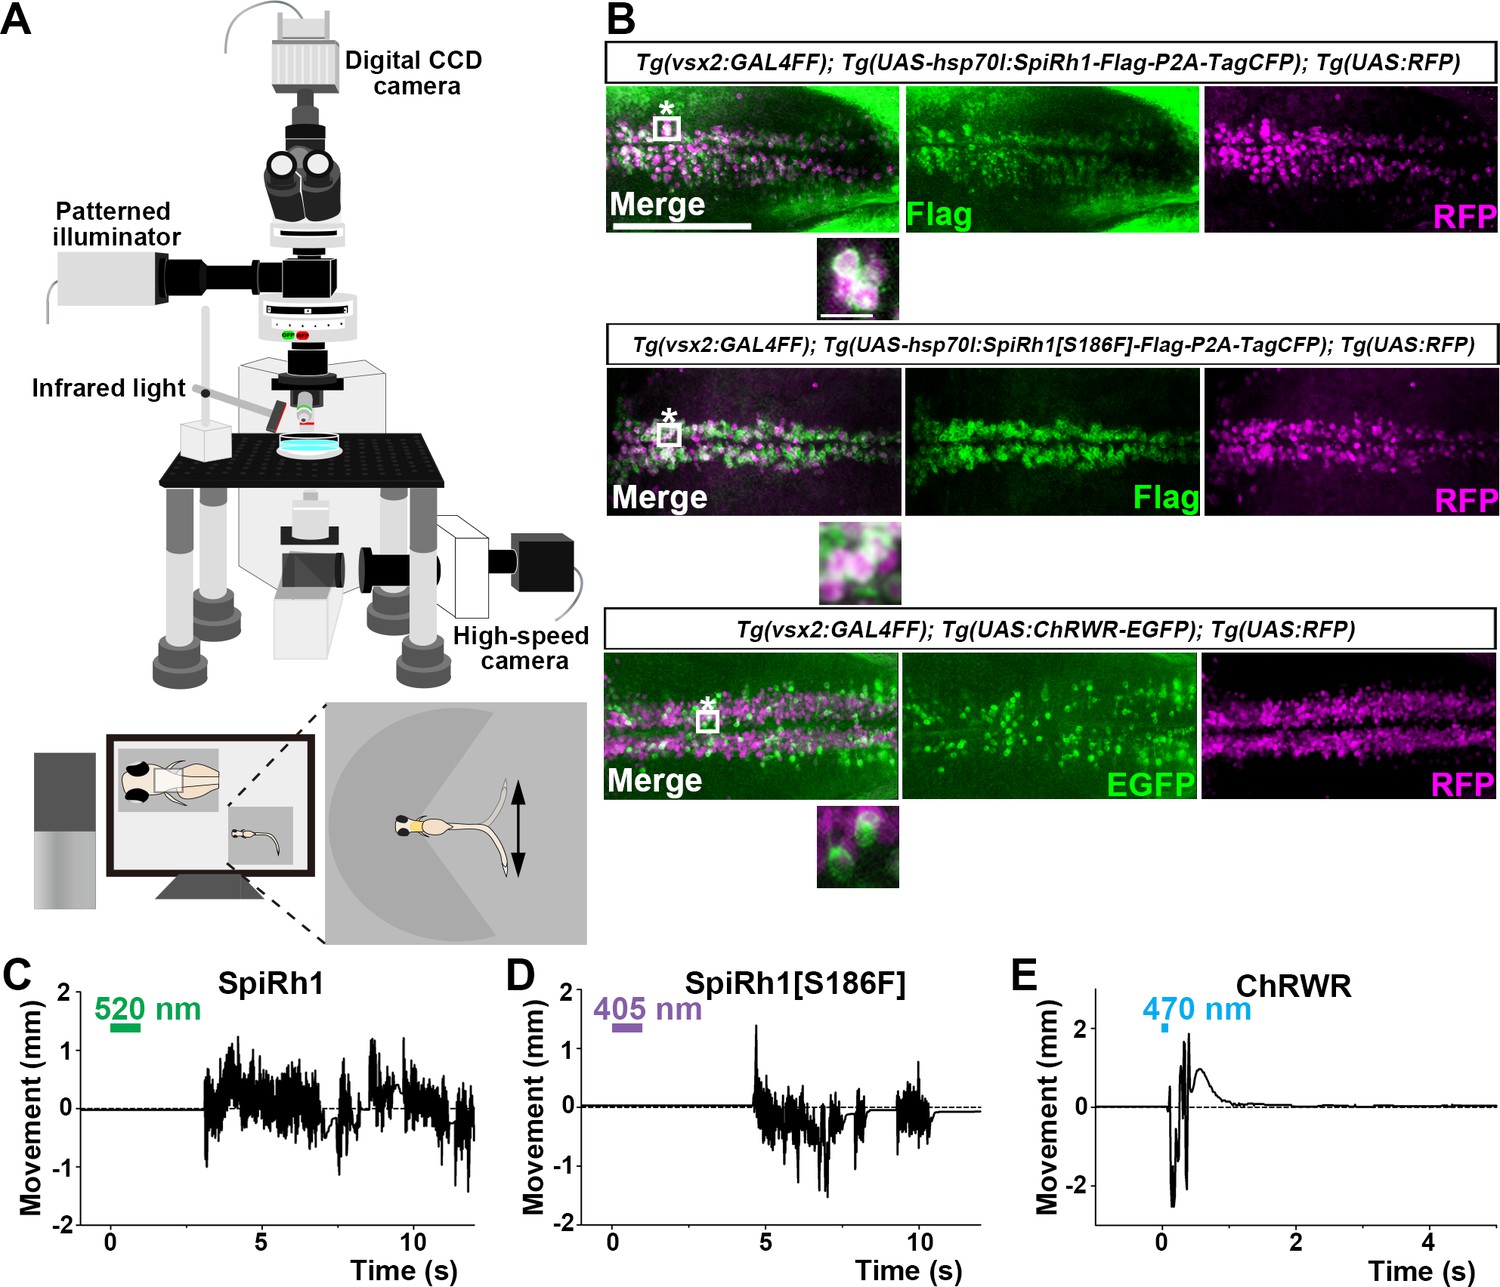
Activation of reticulospinal V2a neurons by Gq-coupled bistable rhodopsins.
(A) Schematic of experimental devices for induction of swimming behavior and a larva embedded in agarose. The hindbrain region was irradiated with light by using a patterned illuminator. Tail (caudal fin) movements were monitored by a high-speed camera with infrared light. (B) Expression of SpiRh1, SpiRh1[S186F], and channel rhodopsin wide receiver (ChRWR) in hindbrain reticulospinal V2a neurons. 3-dpf (days post fertilization) Tg(vsx2:GAL4FF);Tg(UAS-hsp70l:SpiRh1-Flag-P2A-TagCFP, myl7:mCherry);Tg(UAS:RFP), Tg(vsx2:GAL4FF);Tg(UAS-hsp70l:SpiRh1[S186F]-Flag-P2A-TagCFP, myl7:mCherry);Tg(UAS:RFP) and Tg(vsx2:GAL4FF);Tg(UAS:ChRWR-EGFP);Tg(UAS:RFP) larvae were fixed and stained with anti-Flag or anti-GFP (EGFP, green), and anti-DsRed (RFP, magenta) antibodies. Inset: higher magnification views of the boxed areas showing double-labeled neurons. (C, D, E) Tail movements of 3-dpf Tg larvae expressing SpiRh1 (C), SpiRh1 [S186F] (D), and ChRWR (E) in the reticulospinal V2a neurons after light stimulation. The hindbrain area was stimulated with light (0.4 mW/mm2) of wavelengths of 520 nm (for SpiRh1), 405 nm (for SpiRh1[S186F]), and 470 nm (for ChRWR) for 1 s (for SpiRh1 and SpiRh1[S186F]) or 100 ms (for ChRWR). Typical movies are shown in Figure 2—videos 1–3. Scale bar = 150 μm in (B), 10 μm in the insets of (B).
-
Figure 2—source data 1
Data for Figure 2C–E, tail movements of Tg larvae expressing SpiRh1, SpiRh1[S186F], and ChRWR.
- https://cdn.elifesciences.org/articles/83974/elife-83974-fig2-data1-v1.xlsx
Figure 2—video 1
Tail movements in a larva expressing ChRWR-EGFP in reticulospinal V2a neurons.
The hindbrain in a 3-dpf Tg(vsx2:GAL4FF);Tg(UAS-hsp70l:ChRWR-EGFP);Tg(UAS:RFP) larva was stimulated with 470 nm light for 100 ms. The timing of light stimulation is indicated by a blue circle.
Figure 2—video 2
Tail movements in a larva expressing SpiRh1 in reticulospinal V2a neurons.
The hindbrain in a 3-dpf Tg(vsx2:GAL4FF);Tg(UAS-hsp70l:SpiRh1-Flag-P2A-TagCFP, myl7:mCherry);Tg(UAS:RFP) larva was stimulated with 520 nm light for 1 s. The timing of light stimulation is indicated by a green circle.
Figure 2—video 3
Tail movements in a larva expressing SpiRh1[S186F] in reticulospinal V2a neurons.
The hindbrain in a 3-dpf Tg(vsx2:GAL4FF);Tg(UAS-hsp70l:SpiRh1[S186F]-Flag-P2A-TagCFP; myl7:mCherry);Tg(UAS:RFP) larva was stimulated with 405 nm light for 1 s. The timing of light stimulation is indicated by a purple circle.
Figure 3 with 4 supplements
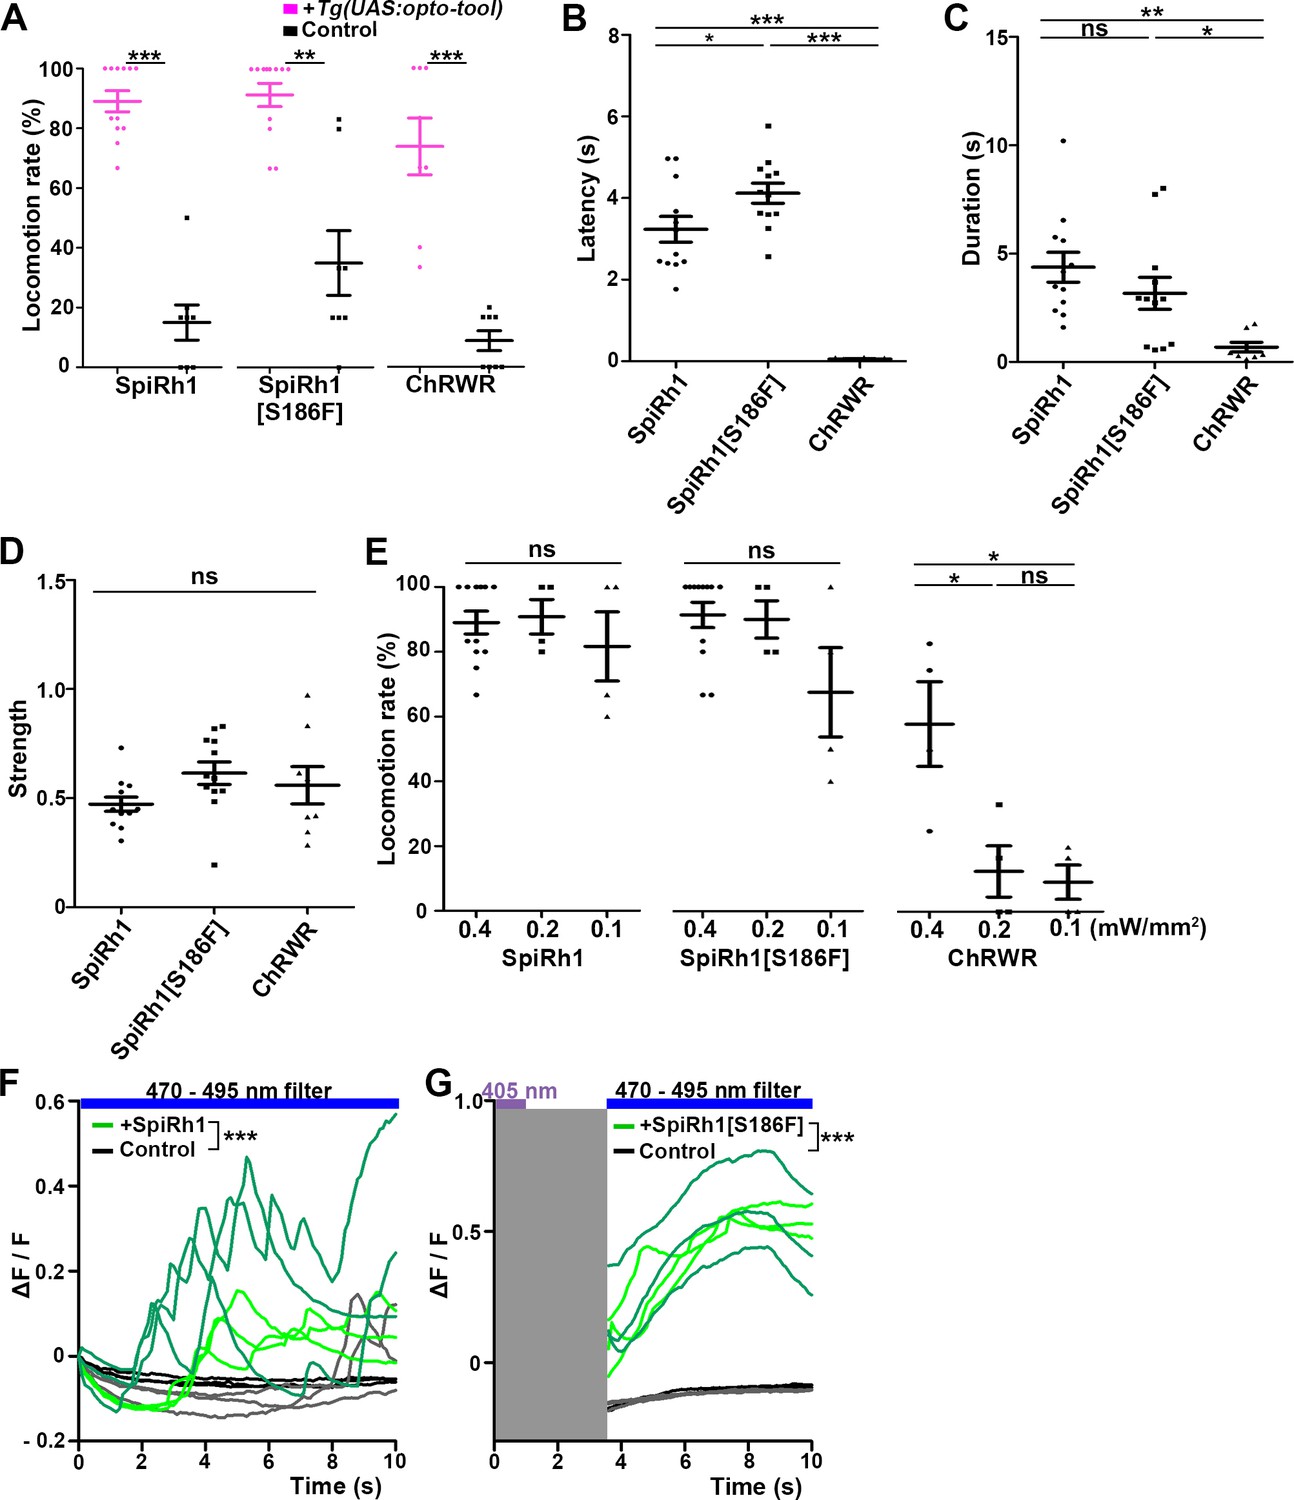
Locomotion induced by SpiRh1, SpiRh1[S186F], and ChRWR.
(A) Light stimulus-dependent locomotion rates of 3-dpf Tg larvae expressing SpiRh1, SpiRh1[S186F] and ChRWR in hindbrain reticulospinal V2a neurons. Sibling larvae that did not express the tools were used as controls. The hindbrain area of the larvae was irradiated with light (0.4 mW/mm2) of wavelengths of 520 nm for 1 s (SpiRh1), 405 nm for 1 s (SpiRh1[S186F]), and 470 nm for 100 ms (ChRWR). Six consecutive stimulus trials were analyzed for 8 or 12 larvae of each Tg line (n=12 for SpiRh1 and SpiRh1[S186F], n=8 for ChRWR). For each larva, the average percentage of trials in which tail movement was elicited was calculated as the locomotion rates and plotted in graphs. Wilcoxon rank sum test (SpiRh1 vs control, p=0.000192; SpiRh1[S186F] vs control, p=0.00664; ChRWR vs control, p=0.000792). (B, C, D) Light stimulus-evoked tail movements of latency (B), duration (C), and strength (D). The time from the start of light application to the first tail movement was defined as latency (s), and the time from the beginning to the end of the first tail movement was defined as duration (s). The maximum distance the caudal fin moved from the midline divided by body length was measured as strength. One-way ANOVA with Tukey’s post hoc test (latency SpiRh1 vs SpiRh1[S186F], p=0.0424; SpiRh1 vs ChRWR, p=1.58e-08; SpiRh1[S186F] vs ChRWR, p=7.40 e-11; duration SpiRh1 vs ChRWR; p=0.00245; SpiRh1[S186F] vs ChRWR; p=0.0469). (E) Locomotion rates evoked by the stimulus light of various intensities. For each Tg line and each condition, six consecutive stimulus trials were analyzed for 4 or 12 larvae (n=12 for 0.4 mW/mm2 light stimulation with SpiRh1 and SpiRh1[S186F], n=4 for others) and the average locomotion rates were calculated. For comparison, Tg fish expressing ChRWR were also irradiated for 1 s. One-way ANOVA with Tukey’s post hoc test (ChRWR 0.4 mW/mm2 vs 0.2 mW/mm2, p=0.0181; 0.4 mW/mm2 vs 0.1 mW/mm2, p=0.0124; 0.2 mW/mm2 vs 0.1 mW/mm2, p=0.966). (F, G) Light-evoked Ca2+ increased with SpiRh1 (F) and SpiRh1[S186F] (G) in hindbrain V2a neurons. 3-dpf Tg(vsx2:GAL4FF);Tg(UAS-hsp70l:SpiRh1-Flag-P2A-TagCFP, myl7:mCherry);Tg(UAS-hsp70l:GCaMP6s) and Tg(vsx2:GAL4FF);Tg(UAS-hsp70l:SpiRh1[S186F]-Flag-P2A-TagCFP, myl7:mCherry);Tg(UAS-hsp70l:GCaMP6s) larvae were used. Sibling larvae that expressed GCaMP6s but did not express SpiRh1 or SpiRh1[S186F] were used as controls. The hindbrain area was irradiated and GCaMP6s fluorescence was detected with a fluorescence detection filter (excitation 470–495 nm, emission 510–550 nm) for SpiRh1. For SpiRh1[S186F], GCaMP6s fluorescence was detected after 1 s of 405 nm light application and filter conversion (about 4 s, shown in gray shade). Two larvae for each condition (SpiRh1, SpiRh1[S186F], and controls) were analyzed and three consecutive trials were analyzed. The change in fluorescence intensity of GCaMP6s (ΔF/F) is indicated as a ratio to the fluorescence intensity at the start of stimulation (F) for SpiRh1 and before (G) the start of stimulation with 405 nm light for SpiRh1[S186F]. The ΔF/F of Tg larvae expressing SpiRh1 or SpiRh1[S186F] is indicated by green lines whereas that of control larvae is indicated by black lines. Data from the three light applications are shown. Ca2+ responses were significantly higher in Tg larvae expressing SpiRh1 and SpiRh1[S186F] than control larvae. Linear mixed-effects model, * p<0.05, ** p<0.01, *** p<0.001, ns, not significant. Means and SEMs are shown.
-
Figure 3—source data 1
Data for Figure 3, locomotion inducced by SpiRh1, SpiRh1[S186F], and ChRWR.
- https://cdn.elifesciences.org/articles/83974/elife-83974-fig3-data1-v1.xlsx
Figure 3—figure supplement 1

Effect of trial number on locomotion rate.
Locomotion rates in trials 1 and 6 are shown (n=12 for SpiRh1 and SpiRh1[S186F], n=8 for ChRWR). Means and SEMs are indicated. ns, not significant; one-way ANOVA with Tukey’s post hoc test.
-
Figure 3—figure supplement 1—source data 1
Data for Figure 3—figure supplement 1, effects of trial number on locomotion rate.
- https://cdn.elifesciences.org/articles/83974/elife-83974-fig3-figsupp1-data1-v1.xlsx
Figure 3—figure supplement 2

Latency and duration of locomotion induced with light of various intensities.
Latency (A) and duration (B) of locomotion evoked with light of various intensities. The hindbrain region of 3-dpf larvae expressing SpiRh1, SpiRh1[S186F], and ChRWR in hindbrain reticulospinal V2a neurons was stimulated with light of various intensities (0.4, 0.2, or 0.1 mW/mm2). Six consecutive stimulation trials were analyzed for 4 or 12 larvae of each Tg line (n=12 for SpiRh1 and SpiRh1[S186F], n=4 for ChRWR). One-way ANOVA with Tukey’s post hoc test was used to statistically analyze data. ns: not significant. Means and SEMs are indicated.
-
Figure 3—figure supplement 2—source data 1
Data for Figure 3—figure supplement 2, latency and duration of locomotion.
- https://cdn.elifesciences.org/articles/83974/elife-83974-fig3-figsupp2-data1-v1.xlsx
Figure 3—video 1
Ca2+ imaging of hindbrain reticulospinal V2a neurons of a larva expressing SpiRh1 and GCaMP6s.
The hindbrain in 3-dpf Tg(vsx2:GAL4FF);Tg(UAS-hsp70l:SpiRh1-Flag-P2A-TagCFP, myl7:mCherry);Tg(UAS-hsp70l:GCaMP6s) was stimulated with a fluorescence detection filter (excitation 470–495 nm, emission 510–550 nm). The timing of stimulation is indicated by a blue square. GCaMP6s fluorescence was simultaneously monitored with the same filter.
Figure 3—video 2
Ca2+ imaging in hindbrain reticulospinal V2a neurons of a larva expressing SpiRh1[S186F] and GCaMP6s.
The hindbrain in 3-dpf Tg(vsx2:GAL4FF);Tg(UAS-hsp70l:SpiRh1[S186F]-Flag-P2A-TagCFP, myl7:mCherry);Tg(UAS-hsp70l:GCaMP6s) was stimulated with 405 nm light after detection of the baseline fluorescence. The timing of light stimulation is indicated by a purple circle. GCaMP6s fluorescence was monitored with a fluorescence detection filter (excitation 470–495 nm, emission 510–550 nm). The timings of the observations are indicated by blue squares.
Figure 4 with 8 supplements
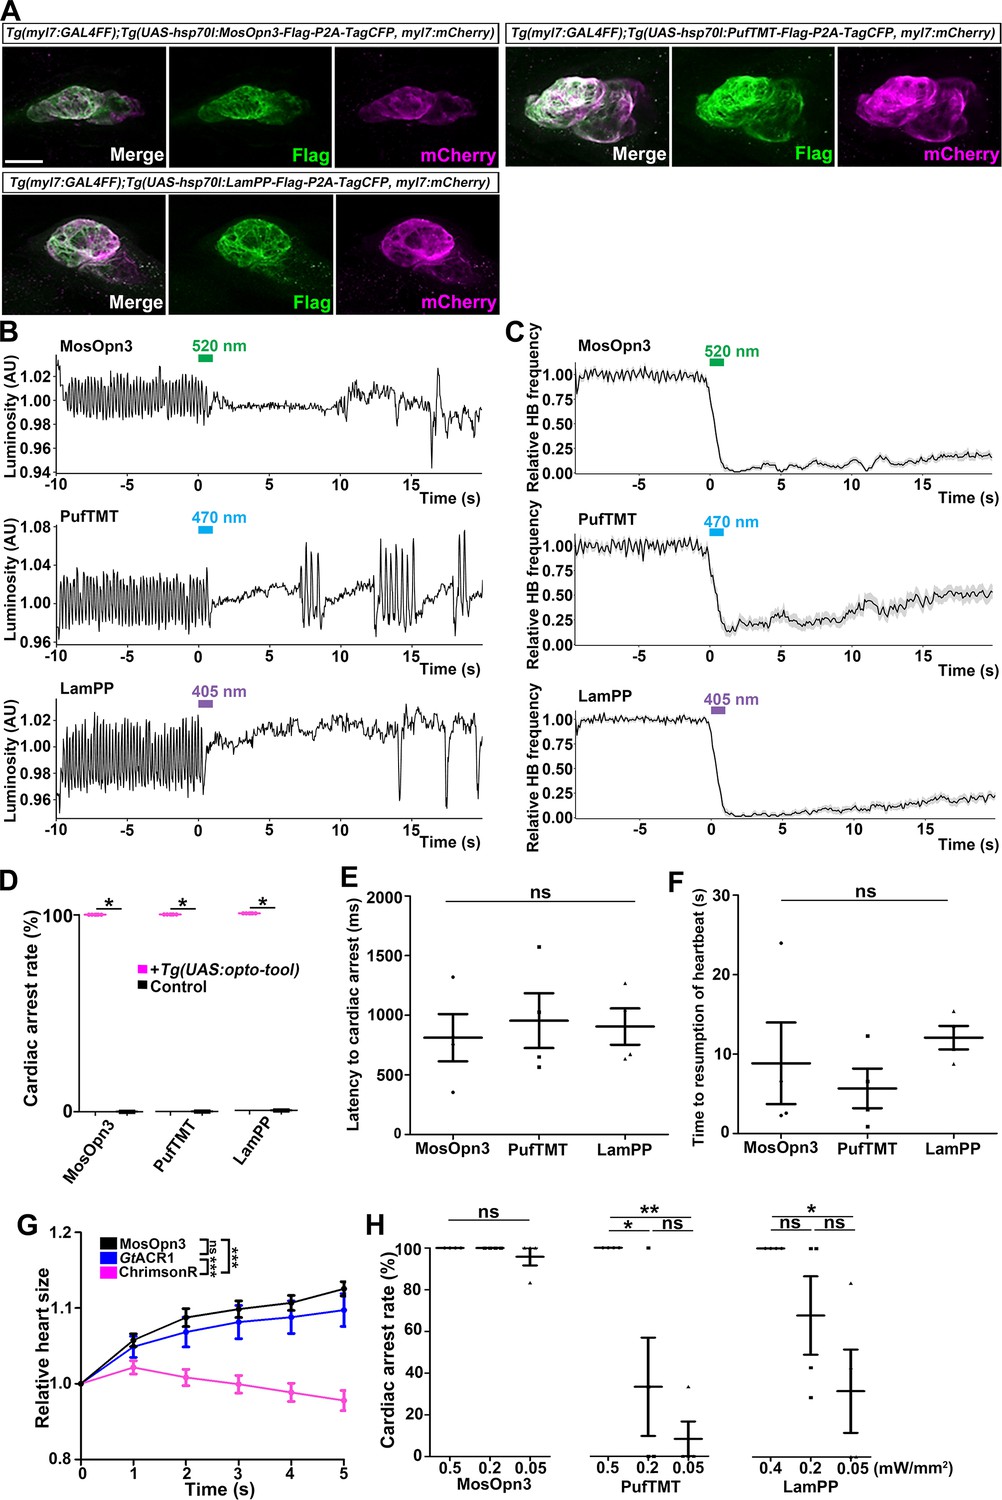
Inhibition of cardiomyocytes by Gi/o-coupled bistable rhodopsins.
(A) Expression of Gi/o-coupled rhodopsins MosOpn3, PufTMT, and LamPP in zebrafish cardiomyocytes. 4-dpf Tg(myl7:GAL4FF);Tg(UAS:opto-tool-Flag-P2A-TagCFP, myl7:mCherry) larvae were fixed and stained with anti-Flag (green) and anti-DsRed (mCherry: magenta). (B, C) Heartbeat (HB) monitoring by change in luminosity (AU: arbitrary units) (B) and the average relative HB frequency (C) of four larvae expressing MosOpn3, PufTMT, and LamPP in cardiomyocytes. The heart area of larvae expressing MosOpn3, PufTMT, and LamPP in cardiomyocytes that were stimulated with 520, 470, and 405 nm light (0.5 mW/mm2), respectively, for 1 s. Six consecutive stimulus trials were analyzed for four rhodopsin-expressing larvae of each Tg line. The entire heart was manually set as the region of interest (ROI), and luminosity in the ROI was measured. The change in luminosity reflects the HB. The relative HB frequency was calculated from the HB data during 1 s before and after each time point. Six consecutive stimulus trials were analyzed for four rhodopsin-expressing larvae and four control larvae of each Tg line (MosOpn3, PufTMT, and LamPP). Typical HB data are shown in (B) and the average HB frequency for 24 trials are shown in (C). Gray shade indicates SEM. (D) Cardiac arrest rates. Wilcoxon rank sum test (MosOpn3, PufTMT, and LamPP, p=0.0131). (E, F) Latency to cardiac arrest (E), and time to resumption of HBs (F) with MosOpn3, PufTMT, and LamPP by light stimulation. One-way ANOVA followed by Tukey’s post hoc test was used for statistical analyses. (G) Heart size after activation of MosOpn3, GtACR1, and ChrimsonR in the heart. The heart area in the Tg larvae expressing MosOpn3, GtACR1-EYFP, or ChrimsonR-tdTomato was irradiated by a fluorescence detection filter (excitation 530–550 nm) for 5 s. The size of the entire heart area was measured, and the ratio to the size at the onset of cardiac arrest (t=0) was calculated and plotted in a graph. Five trials from two larvae for each condition were analyzed. The linear mixed effects model with Bonferroni-adjusted pairwise comparisons were used for statistical analyses. (H) Cardiac arrest rates induced by MosOpn3, PufTMT, and LamPP with light of various intensities. For MosOpn3 and PufTMT, one trial for 0.5 mW/mm2 and six consecutive trials for 0.2 or 0.05 W/mm2 were analyzed. For LamPP, one trial for 0.4 mW/mm2 and six consecutive trials for 0.2 and 0.05 W/mm2 were analyzed. One-way ANOVA with Tukey’s post hoc test (PufTMT 0.5 mW/mm2 vs 0.05 mW/mm2, p=0.00386; 0.5 mW/mm2 vs 0.2 mW/mm2, p=0.0239; LamPP 0.4 mW/mm2 vs 0.05 mW/mm2, p=0.0332). * p<0.05, ** p<0.01, *** p<0.001, ns: not significant. Means and SEMs are shown. Scale bar = 50 µm in (A).
-
Figure 4—source data 1
Data for Figure 4, inhibition of cardiomyocytes by Gi/o-coupled rhodopsins.
- https://cdn.elifesciences.org/articles/83974/elife-83974-fig4-data1-v1.xlsx
Figure 4—figure supplement 1
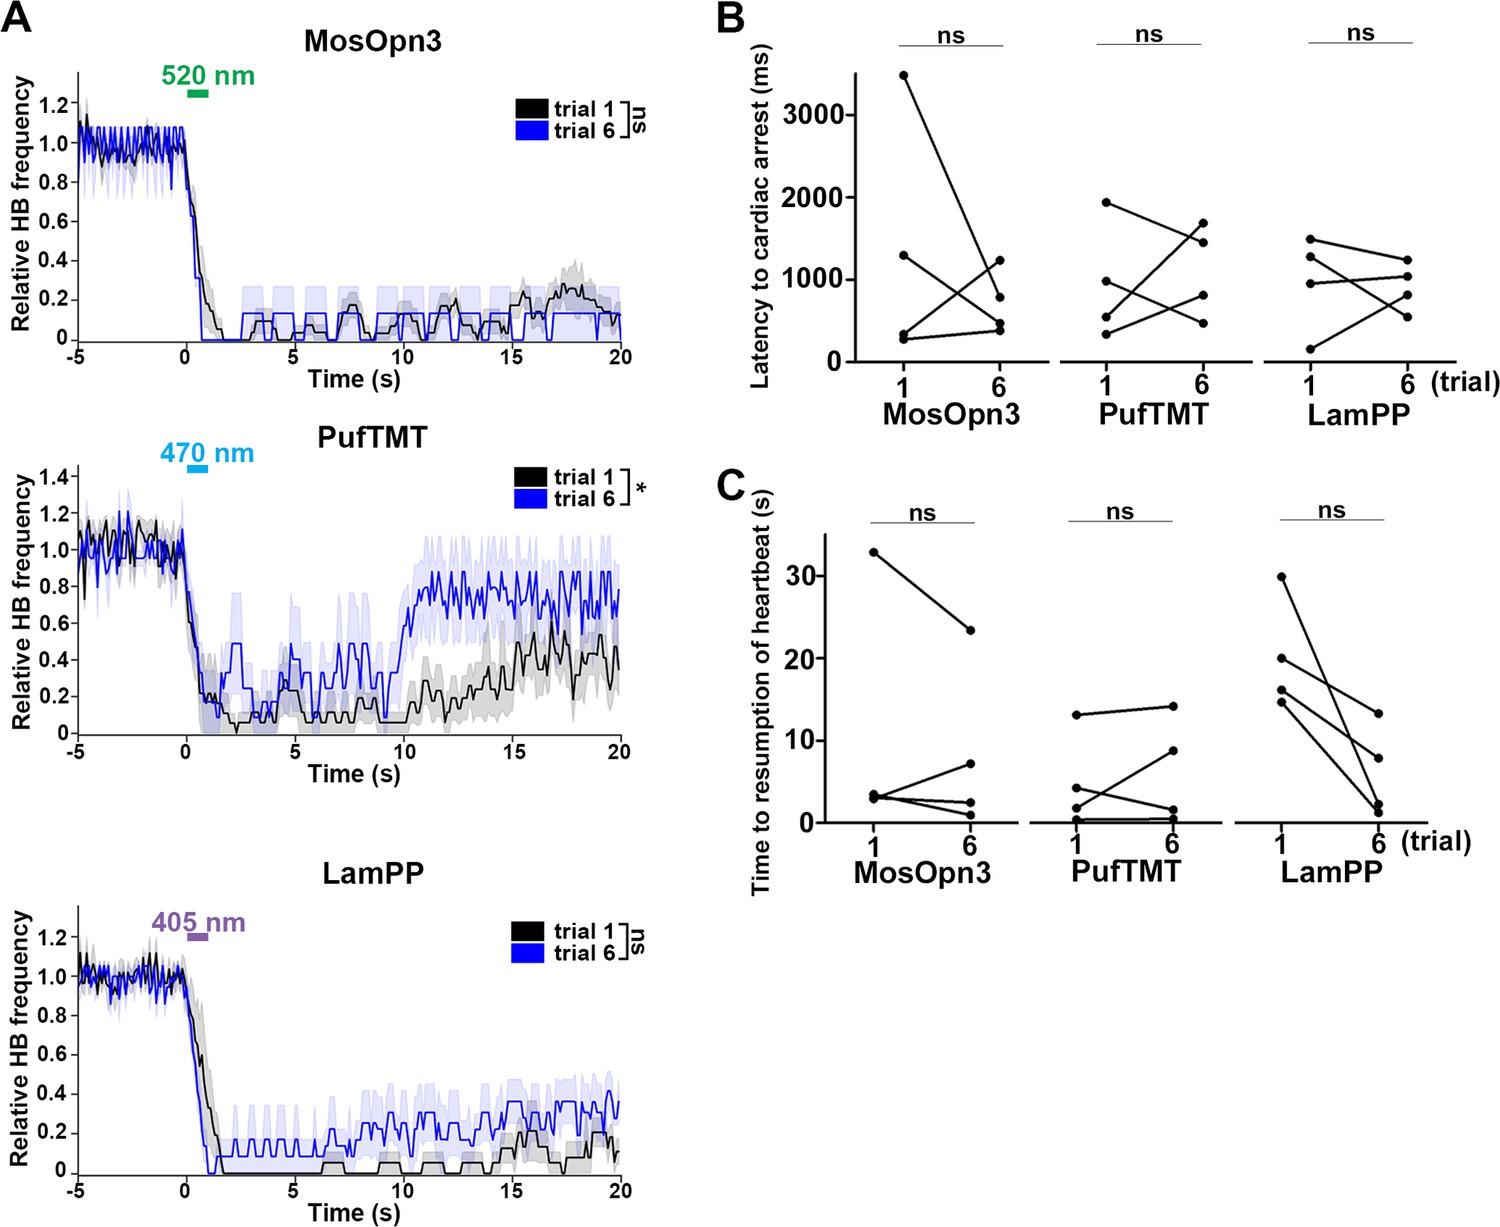
Effect of trial number on heartbeats (HBs).
(A) Average relative HB frequency of larvae expressing MosOpn3 (n=7 for trial 1; n=2 for trial 6), PufTMT (n=5 for trial 1; n=3 for trial 6), and LamPP (n=4 for both trials 1 and 6) in cardiomyocytes. The heart area of Tg larvae was irradiated with light (520 nm for MosOpn3, 470 nm for PufTMT, and 405 nm for LamPP) at 0.5 mW/mm2 for 1 s at the indicated period. The statistical analysis employed the linear mixed effects model. Shading indicates SEM. (B, C) Latency to cardiac arrest (B) and time to resumption of HBs (C) in trials 1 and 6. Four larvae for each Tg line were analyzed. There were no significant differences in latency or time to resumption between trials 1 and 6 of MosOpn3, PufTMT, and LamPP. Student’s t-test, * p<0.05; ns, not significant.
-
Figure 4—figure supplement 1—source data 1
Data for Figure 4—figure supplement 1, effect of trial number on HBs.
- https://cdn.elifesciences.org/articles/83974/elife-83974-fig4-figsupp1-data1-v1.xlsx
Figure 4—figure supplement 2

Change in heartbeats (HBs) after stimulation with light of various intensities.
(A) Average relative HB frequency of larvae expressing MosOpn3, PufTMT, and LamPP in cardiomyocytes. The heart area of Tg larvae was irradiated with light (520 nm for MosOpn3, 470 nm for PufTMT, and 405 nm for LamPP) at 0.5, 0.2 or 0.05 mW/mm2 (for MosOpn3 and PufTMT), or 0.4, 0.2 or 0.05 mW/mm2 (for LamPP) for 1s at the indicated period. MosOpn3 (n=24 for 0.5 mW/mm2, n=18 for 0.2 mW/mm2, n=16 for 0.05 mW/mm2), PufTMT (n=24 for 0.5 mW/mm2, n=6 for 0.2 mW/mm2, n=4 for 0.05 mW/mm2), and LamPP (n=24 for 0.5 mW/mm2, n=18 for 0.2 mW/mm2, n=2 for 0.05 mW/mm2)-expressing larvae were analyzed. The statistical analysis employed the linear mixed effects model. Shading indicates SEM. (B) Latency to cardiac arrest (B) and time to resumption of HBs (C). Six consecutive trials were analyzed in four larvae for each condition. MosOpn3 (n=4 for 0.5, 0.2 and 0.05 mW/mm2), PufTMT (n=4 for 0.5 mW/mm2, n=2 for 0.2 mW/mm2, n=1 for 0.05 mW/mm2), and LamPP (n=4 for 0.4 mW/mm2, n=4 for 0.2 mW/mm2, n=2 for 0.05 mW/mm2)-expressing larvae were analyzed. One-way ANOVA with Tukey’s post hoc test (time to resumption of HBs LamPP 0.4 mW/mm2 vs 0.2 mW/mm2, p=0.000531; 0.2 mW/mm2 vs 0.05 mW/mm2, p=0.991; 0.4 mW/mm2 vs 0.05 mW/mm2, p=0.00158), * p<0.05. ** p<0.01. *** p<0.001; ns, not significant. Means and SEMs are indicated.
-
Figure 4—figure supplement 2—source data 1
Data for Figure 4—figure supplement 2, change in HBs after stimulation of light of various intensities.
- https://cdn.elifesciences.org/articles/83974/elife-83974-fig4-figsupp2-data1-v1.xlsx
Figure 4—figure supplement 3
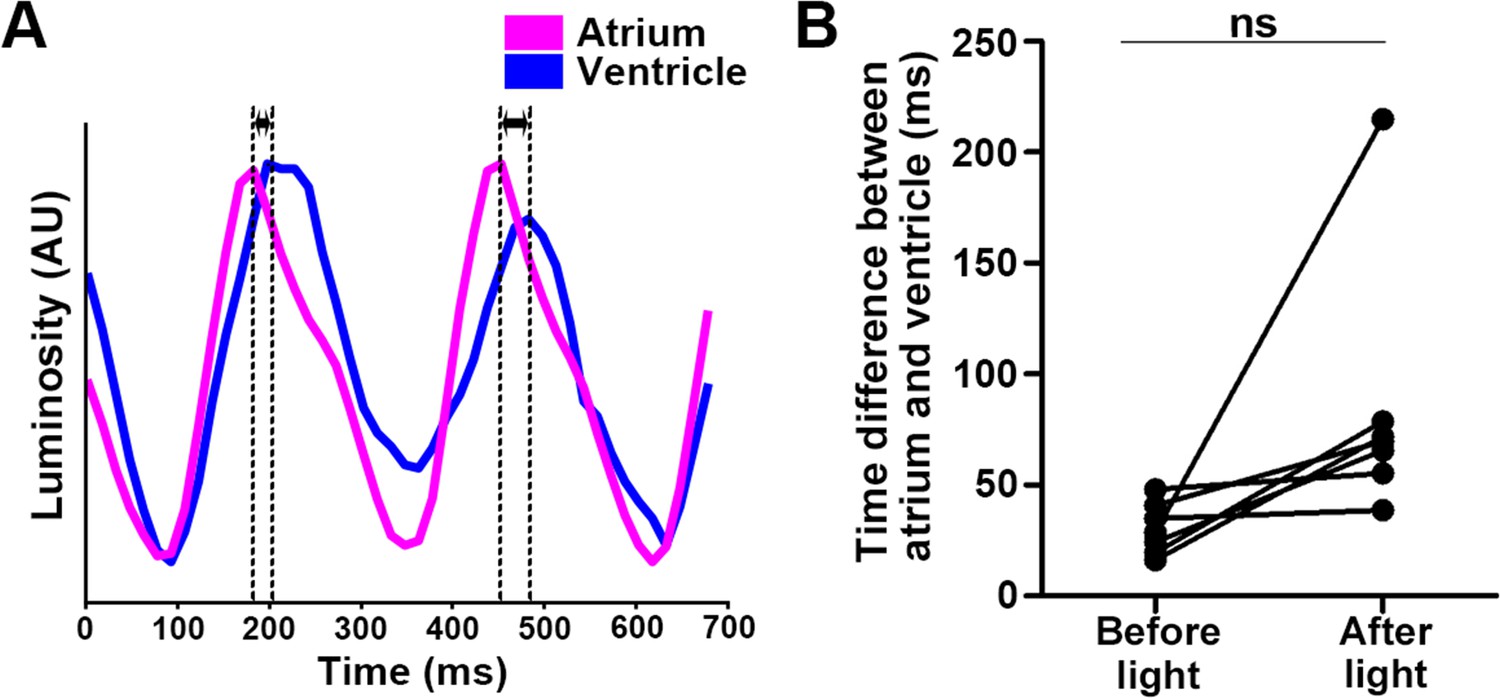
Time difference between atrial and ventricular contractions.
(A) Heartbeats (HBs) of atrium and ventricle. The heart area of 4-dpf Tg larvae expressing MosOpn3 was irradiated with 520 nm light at an intensity of 0.5 mW/mm2 for 1 s. HB data were extracted from luminosity data of arbitrary positions of the atrium and ventricle. The time difference between atrial and ventricular (AV) contractions is indicated. (B) Time difference between AV contractions before and after light application. The 10 s period before light application is defined as ‘before light application’. The state in which the interval between HBs was twice as long as the interval before light application, but less than 5 s, is defined as ‘after light application’. Time differences between AV contractions before and after light applications were calculated and plotted in a graph. Seven trials were analyzed from six larvae. Student’s t-test; ns, not significant (p=0.0758).
-
Figure 4—figure supplement 3—source data 1
Data for Figure 4—figure supplement 3, time difference between atrial and ventricular contractions.
- https://cdn.elifesciences.org/articles/83974/elife-83974-fig4-figsupp3-data1-v1.xlsx
Figure 4—figure supplement 4
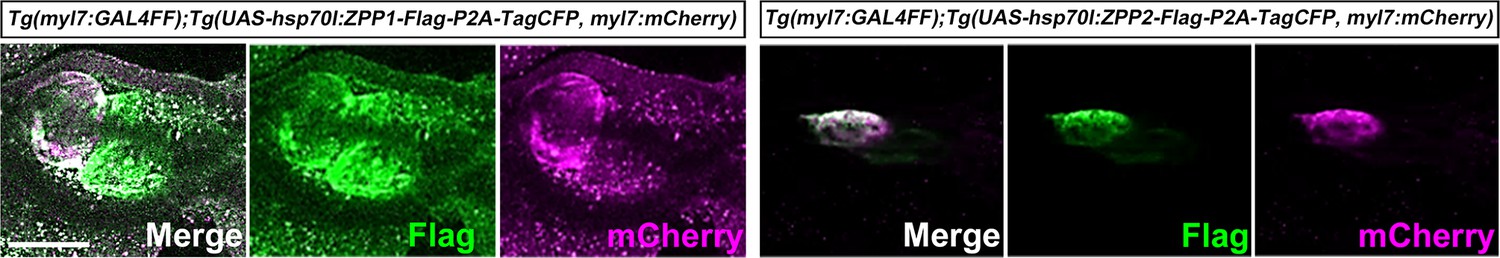
Expression of ZPP1 and ZPP2 in cardiomyocytes.
Immunostaining of 4-dpf Tg(myl7:GAL4FF);Tg(UAS-hsp70l:ZPP1-Flag-P2A-TagCFP, myl7:mCherry) Tg(myl7:GAL4FF); Tg(UAS-hsp70l:ZPP2-Flag-P2A-TagCFP, myl7:mCherry) larvae, which were fixed and stained with anti-Flag (green) and anti-DsRed (mCherry: magenta) antibodies. Scale bar = 100 µm in (A).
Figure 4—video 1
Heartbeats in a larva expressing MosOpn3 in cardiomyocytes.
The heart area of Tg(myl7:GAL4FF);Tg(UAS-hsp70l:MosOpn3-Flag-P2A-TagCFP, myl7:mCherry) was stimulated with 520 nm light for 1 s. The timing of light stimulation is indicated by a green circle.
Figure 4—video 2
Heartbeats in a larva expressing PufTMT in cardiomyocytes.
The heart area of Tg(myl7:GAL4FF);Tg(UAS-hsp70l:PufTMT-Flag-P2A-TagCFP, myl7:mCherry) was stimulated with 470 nm light for 1 s. The timing of light stimulation is indicated by a blue circle.
Figure 4—video 3
Heartbeats in a larva expressing LamPP in cardiomyocytes.
The heart area of Tg(myl7:GAL4FF);Tg(UAS-hsp70l:LamPP-Flag-P2A-TagCFP, myl7:mCherry) was stimulated with 405 nm light for 1 s. The timing of light stimulation is indicated by a purple circle.
Figure 4—video 4
Changes in heart size caused by activation of MosOpn3, GtACR1, and ChrimsonR in cardiomyocytes.
Relaxation was caused by MosOpn3 and GtACR1, and contraction was caused by ChrimsonR. The heart area in Tg fish expressing MosOpn3, GtACR1, and ChrimsonR was irradiated with a fluorescence detection filter (excitation 530–550 nm, emission 575IF nm, U-MWIG3, Olympus) for 10 s.
Figure 5 with 4 supplements
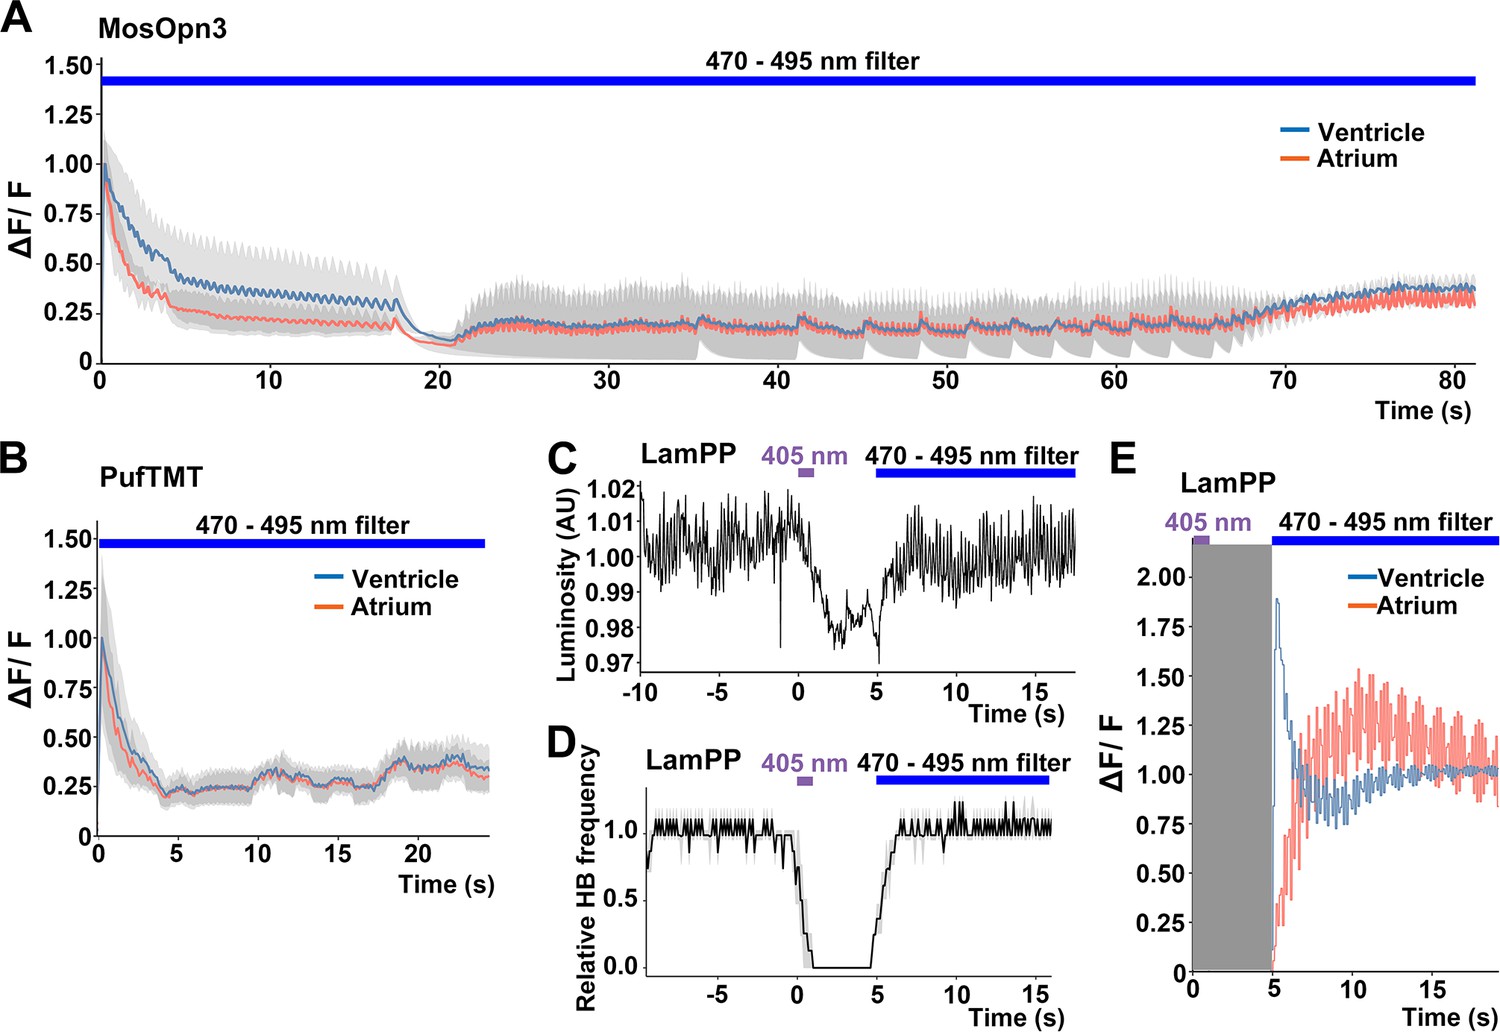
Switchable control of heartbeats by Gi/o-coupled bistable rhodopsins.
(A, B) Average changes in fluorescence of GCaMP6s (ΔF/F) of 4-dpf larvae expressing MosOpn3 (A) or PufTMT (B), and GCaMP6s in cardiomyocytes. The heart area was irradiated with a fluorescence detection filter (excitation 470–495 nm, emission 510–550 nm) for the indicated period (n=2 for MosOpn3, n=4 for PufTMT). ΔF/F was calculated as a ratio to the fluorescence intensity of GCaMP6s at the start of stimulation. (C, D) HB monitoring by luminosity (AU) change (C) and average of relative HB frequency (n=2) (D) of 4-dpf larvae expressing LamPP in cardiomyocytes. The heart area was irradiated with 405 nm light (0.5 mW/mm2) for 1 s and then with a fluorescence detection filter (470–495 nm light) for the indicated period. Gray shading indicates SEMs (A, B, D). (E) Changes in ΔF/F of GCaMP6s of a larva expressing LamPP and GCaMP6s in the heart. The heart area was irradiated with 405 nm light (0.5 mW/mm2) for 1 s and then with a fluorescence detection filter (470–495 nm light) for the indicated period. GCaMP6s fluorescence was detected after light stimulation and filter conversion (5 s, shown in gray shading). ΔF/F was calculated as the ratio to the fluorescence intensity of GCaMP6s at the steady state (after the resumption of HBs). Blue and red lines indicate ΔF/F in the ventricle and atrium, respectively (A, B, E).
-
Figure 5—source data 1
Data for Figure 5, switchable control of HBs by Gi/o-coupled rhodopsins.
- https://cdn.elifesciences.org/articles/83974/elife-83974-fig5-data1-v1.xlsx
Figure 5—figure supplement 1
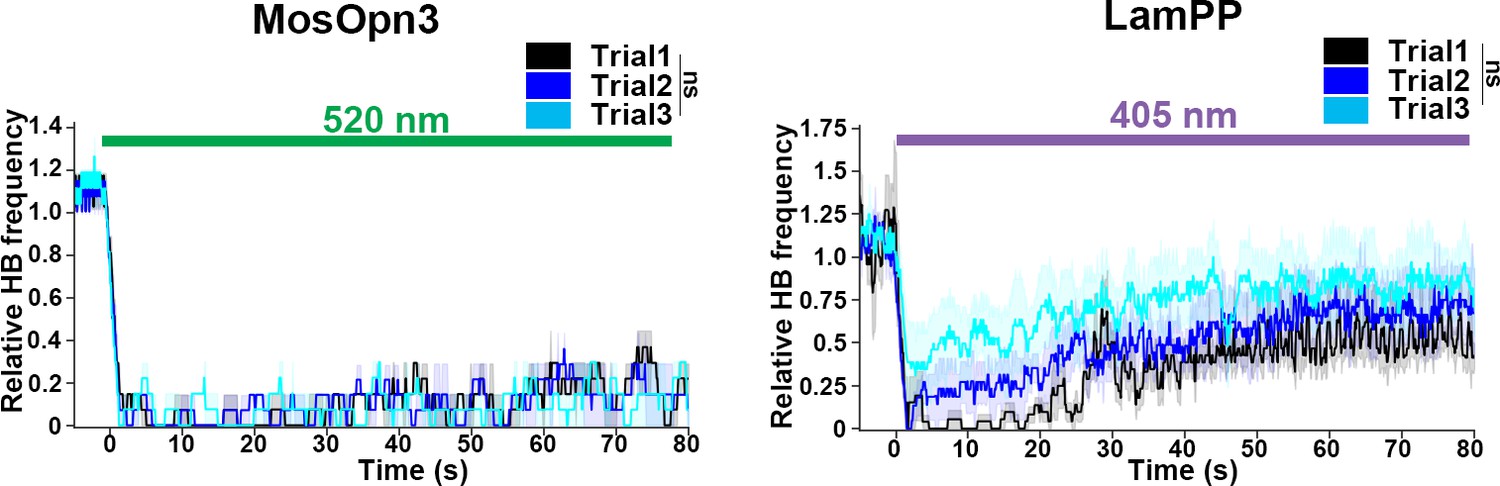
Average relative heartbeat frequency during prolonged irradiation.
The heart area of Tg larvae expressing MosOpn3 or LamPP was irradiated for 80 s with 0.5 mW/mm2 light of 520 nm for MosOpn3 and 0.4 mW/mm2 light of 405 nm for LamPP. Three stimulation trials were performed with a 20 min interval in between. Two MosOpn3- and four LamPP-expressing larvae were analyzed. Linear mixed effects model; ns, not significant.
-
Figure 5—figure supplement 1—source data 1
Data for Figure 5—figure supplement 1, average relative heartbeat frequency during prolonged irradiation.
- https://cdn.elifesciences.org/articles/83974/elife-83974-fig5-figsupp1-data1-v1.xlsx
Figure 5—video 1
Ca2+ imaging in the heart of a larva expressing MosOpn3 and GCaMP6s.
The heart area of Tg(myl7:GAL4FF);Tg(UAS-hsp70l:MosOpn3-Flag-P2A-TagCFP, myl7:mCherry);Tg(UAS-hsp70l:GCaMP6s) was stimulated with a fluorescence detection filter (excitation 470–495 nm, emission 510–550 nm). GCaMP6s fluorescence was monitored with the same filter set. GCaMP6s fluorescence gradually decreased and became almost undetectable. At about 40 s, fluorescence recovered as the heart began to beat. A typical example is shown.
Figure 5—video 2
Changes in heartbeat (HB) following stimulation with light of different wavelengths in a larva expressing LamPP in cardiomyocytes.
The heart area of Tg(myl7:GAL4FF);Tg(UAS-hsp70l:LamPP-Flag-P2A-TagCFP, myl7:mCherry) was stimulated with 405 nm light and a fluorescence detection filter (470–495 nm light). The timing of stimulation with 405 nm (1 s) and 470–495 nm light is indicated by a purple circle and a blue square, respectively. Cardiac arrest was induced by stimulation. Immediately after stimulation with 470–495 nm light, HBs were resumed. A typical example is shown.
Figure 5—video 3
Changes in heartbeat (HB) following light stimulation of LamPP in cardiomyocytes.
Higher magnification view. The timing of stimulation with 405 nm (1 s) and 470–495 nm light (about 2.5 s) is indicated by a purple circle and a blue square, respectively. Cardiac arrest was induced by stimulation. Immediately after stimulation with 470–495 nm light, HBs were resumed. A typical example is shown.
Figure 6 with 2 supplements
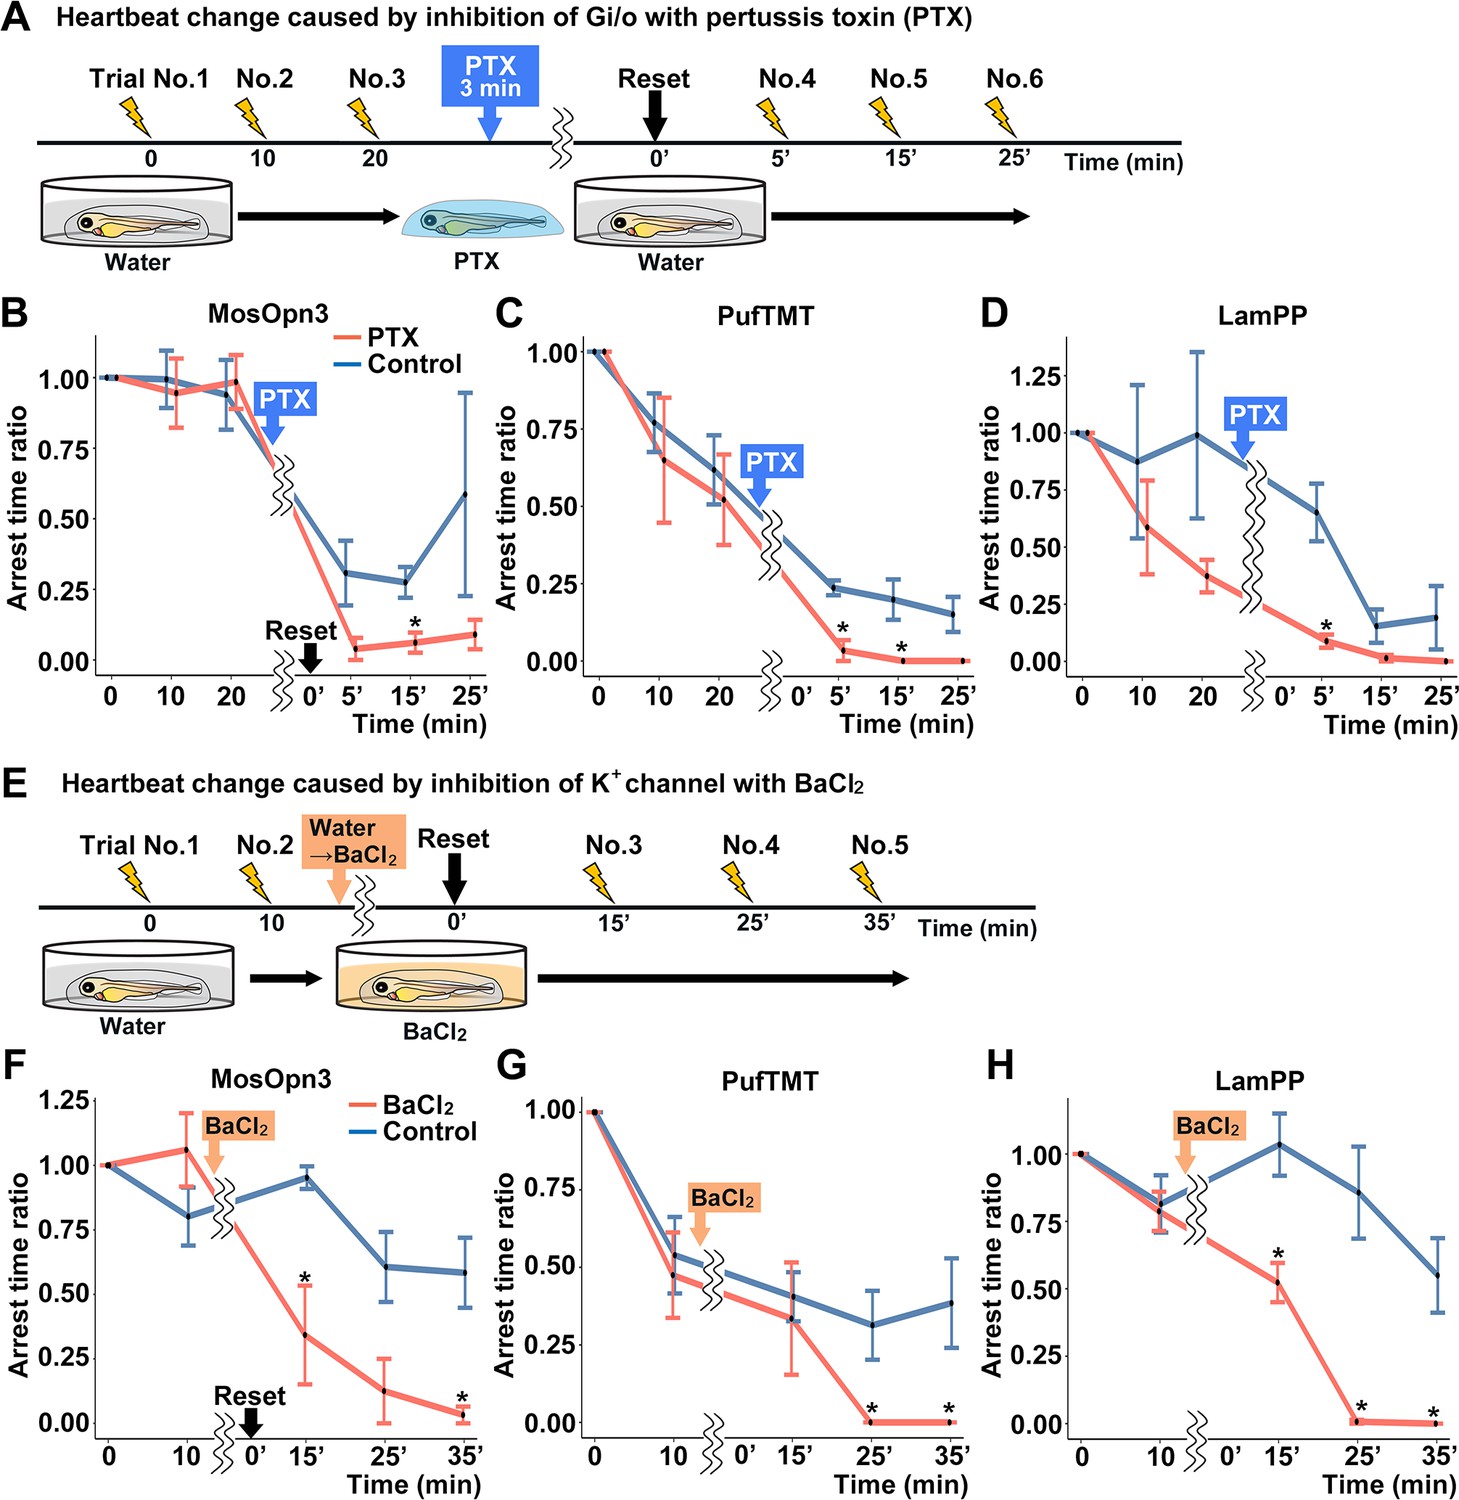
Gi/o and inward-rectifier K+ channel-dependent cardiac arrest by Gi/o-coupled bistable rhodopsins.
(A) Time course of light application and treatment with pertussis toxin (PTX) (min, minutes). 4-dpf Tg larvae expressing MosOpn3, PufTMT, or LamPP in cardiomyocytes were used. After three trials of light stimulation of the heart area in larvae embedded in agarose, the larvae were treated with PTX for 3 min and embedded in agarose again and subjected to three subsequent light stimulation trials. In each trial, the heart area was irradiated with light (520 nm for MosOpn3, 470 nm for PufTMT, and 405 nm for LamPP) at an intensity of 0.5 mW/mm2 for 1 s, and cardiac arrest time was measured. The ratio to cardiac arrest time during the first trial was calculated (arrest time ratio). (B, C, D) Effect of PTX treatment on cardiac arrest induced by MosOpn3 (B), PufTMT (C), and LamPP (D). Average arrest time ratio of larvae expressing MosOpn3 (B), PufTMT (C), or LamPP (D) is shown in graphs. Larvae that were not treated with PTX were used as controls. Four treated and four non-treated control larvae were analyzed for each opto-tool. Wilcoxon rank sum test (MosOpn3 PTX vs control at 15 min, p=0.0294; PufTMT PTX vs control at 5 and 15 min, p=0.0265 and 0.0210; LamPP PTX vs control at 5 min, p=0.0285). (E) Time course of light application and treatment with BaCl2. After two trials of light stimulation of the heart area in larvae embedded in agarose, the larvae were treated with BaCl2 (or water) and subjected to three subsequent light stimulation trials. In each trial, the heart area was irradiated with light at an intensity of 0.5 mW/mm2 for 1 s. Cardiac arrest time was measured and the arrest time ratio was calculated. (F, G, H) Effect of BaCl2 treatment on cardiac arrest induced by MosOpn3 (F), PufTMT (G), and LamPP (H). Average arrest time ratio of larvae expressing MosOpn3 (F), PufTMT (G), or LamPP (H) is shown in graphs. Larvae that were not treated with BaCl2 were used as controls. Four treated and four non-treated control larvae were analyzed for each opto-tool. Wilcoxon rank sum test (MosOpn3 BaCl2 vs control at 15 and 35 min, p=0.0285 and 0.0265; PufTMT BaCl2 vs control at 25 and 35 min, p=0.0210 and 0.0210; LamPP BaCl2 vs control at 15, 25, and 35 min, p=0.0285, 0.0265, and 0.0210). * p<0.05. Means and SEMs are shown.
-
Figure 6—source data 1
Data for Figure 6, GIRK-dependent cardiac arrest by Gi/o-coupled bistable rhodopsins.
- https://cdn.elifesciences.org/articles/83974/elife-83974-fig6-data1-v1.xlsx
Figure 6—video 1
Effect of pertussis toxin (PTX) treatment on cardiac arrest induced by PufTMT activation.
4-dpf Tg larvae expressing PufTMT in cardiomyocytes were stimulated with 470 nm light for 1 s in the first three trials. They were then treated with PTX (right panel) or remained untreated (left panel). Subsequently, they were stimulated with 470 nm light in trials 4–6. Heartbeats in trials 1 and 4 are shown. The timing of stimulation is indicated by blue circles. Cardiac arrest was no longer observed after PTX treatment (PTX Tx; trial 4, right panel).
Figure 6—video 2
Effect on BaCl2 treatment on cardiac arrest induced by LamPP activation.
4-dpf Tg larvae expressing LamPP in cardiomyocytes were stimulated with 405 nm light in trials 1 and 2. They were then treated with BaCl2 (right panel) or remained untreated (left panel). Subsequently, they were stimulated with 405 nm light in trials 3–5. Heart movements in trials 1 and 5 are shown. The timing of stimulation is indicated by purple circles. Cardiac arrest was no longer observed after BaCl2 treatment (BaCl2 Tx; trial 5, right panel).
Tables
Table 1
Summary of optogenetic tools.
Rhodopsins were expressed in hindbrain reticulospinal V2a neurons or cardiomyocytes using the Gal-4-UAS system. The wavelengths of light used in this study and the light for maximum activation or inhibition are described. The expression levels of the tools were determined by immunostaining with anti-Flag or anti-GFP (for ChRWR-EGFP) antibodies (+weak, ++medium, +++strong expression). The light stimulus-dependent responses are indicated by the percentage of fish that responded (induced swimming or cardiac arrest). As controls, the responses of sibling larvae that did not express the tool were also examined. The number of larvae analyzed are also indicated. *1 Light stimulus-dependent increase of cytoplasmic Ca2+. *2 Neither cardiac arrest, bradycardia, nor tachycardia were induced with either 490–510 nm, 530–560 nm (microscope-equipped light source, n=100), or 520 nm (LED, n=2) light. *3 Expression was confirmed by detecting TagCFP. *4 Cardiac arrest was not induced with 490–510 nm, 530–560 nm (microscope-equipped light source, n=60), or 620 nm (LED, n=2) light. *5 Light-stimulus-dependent reduction of cAMP. *6 The percentages of spontaneous tail movements elicited by white light that was inhibited by rhodopsin activation (locomotion-inhibition trials) are indicated (no rhodopsin activation was used as control). *7 Expression of ZPP1 and ZPP2 is shown in Figure 4—figure supplement 4. *8 Cardiac arrest was induced with 405 nm (LED) light for 1 s (n=2), and cardiac arrest was also induced with 426–446 nm (microscope-equipped light source, n=60) only when the interval between stimuli was more than 2–3 hr. *9 Cardiac arrest was not induced with 460–500 nm light (equipped with microscope). Abbreviations: NA, not available; ND, not determined; PP, parapinopsin; TMT, teleost multiple tissue (TMT) opsin.
| GPCR type | Rhodopsin name | Origin | Light for activation[light for maximum activation](nm) | Light for inhibition[light for maximum inhibition](nm) | Cell response | V2a neurons | Heart | ||
|---|---|---|---|---|---|---|---|---|---|
| Expression | Response (control) | Expression | Response(control) | ||||||
| ChRWR | Chlamydomonas reinhardtii | 470 [470] | ND | ND | +++ | 73.8%, n=8 (8.75%, n=8) | ND | ND | |
| Gq | Spider (Spi) Rh1 | Jumping spider (Hasarius adansoni) | 520 [520] | ND [NA] | ++*1 | ++ | 89.0%, n=12 (15.0%, n=8) | +++ | 0%, n=102*2 (ND) |
| Gq | Spider (Spi) Rh1 [S186F] | Jumping spider (Hasarius adansoni) | 405 [405] | ND [550] | ++*1 | +++ | 91.4%, n=12 (35.0%, n=8) | ND | ND |
| Gq | BeeUVOP | Honeybee (Apis cerena) | 405 [405] | ND [>480] | ND | +*3 | 28.1%, n=8 (8.30%, n=8) | ND | ND |
| Gq | BeeBLOP | Honeybee (Apis cerena) | 405 [405] | ND [>520] | ND | ++ | 25.2%, n=8 (14.6%, n=8) | ND | ND |
| Gq | PxRh3 | Butterfly (Papilio xuthus) | 620 [620] | ND [520] | ND | + + | 35.0%, n=8 (20.0%, n=8) | ND | 0%, n=62*4 (ND) |
| Gi/o | MosOpn3 | Mosquito (Anopheles stephensi) | 520 [520] | 470–495 [470] | ++*5 | +*3 | 44.4%, n=3*6 (50.0%, n=3) | +++ | 100%, n=4 (0%, n=4) |
| Gi/o | PufTMT | Pufferfish (Takifugu rubripes) | 470 [470] | 470–495 [NA] | ++*5 | ND | ND | +++ | 100%, n=4 (0%, n=4) |
| Gi/o | LamPP | Lamprey (Lethenteron camtschaticum) | 405 [405] | 470–495 [520] | ++*5 | +*3 | 26.7%, n=7*6 (25.0%, n=7) | +++ | 100%, n=4 (0%, n=4) |
| Gi/o | ZPP1 | Zebrafish (Danio rerio) | 405 [405] | ND [520] | ++*5 | ND | ND | +++*7 | 100%, n=62*8 (ND) |
| Gi/o | ZPP2 | Zebrafish (Danio rerio) | 460–500 [470] | ND [NA] | ND | ND | ND | +*7 | 0%, n=100*9 (ND) |
Key resources table
| Reagent type (species) or resource | Designation | Source or reference | Identifiers | Additional information |
|---|---|---|---|---|
| Gene (Chlamydomonas reinhardtii) | ChRWR-EGFP | Umeda et al., 2013 | ||
| Gene (Hasarius adansoni) | Spider Rh1 (SpiRh1) | Koyanagi et al., 2008; Nagata et al., 2012 | GenBank: AB251846 Human codon optimized | |
| Gene (Hasarius adansoni) | Spider Rh1[S186F] (SpiRh1[S186F]) | Nagata et al., 2019 | GenBank: AB251846 S186F mutation is introduced | |
| Gene (Apis cerana) | Honeybee UV opsin (beeUVOP) | Terakita et al., 2008 | Genbank: AB355816 | |
| Gene (Apis cerana) | Honeybee blue opsin (beeBLOP) | Terakita et al., 2008 | Genbank: AB355817 | |
| Gene (Papilio xuthus) | Butterfly PxRh3 | Saito et al., 2019 | Genbank: AB007425 | |
| Gene (Anopheles stephensi) | Mosquito Opn3 (MosOpn3) | Koyanagi et al., 2013 | Genbank: AB753162 Carboxy terminal truncated | |
| Gene (Takifugu rubripes) | Pufferfish TMT opsin (PufTMT) | Koyanagi et al., 2013 | Genbank: AF402774 | |
| Gene (Lethenteron camtschaticum) parapinopsin | Lamprey (LamPP) | Koyanagi et al., 2004 | Genbank: AB116380 | |
| Gene (Danio rerio) | Zebrafish parapinopsin 1 (ZPP1) | Koyanagi et al., 2015 | Genbank: AB626966 | |
| Gene (Danio rerio) | Zebrafish parapinopsin 2 (ZPP2) | Koyanagi et al., 2015 | Genbank: AB626967 | |
| Gene (porcine teschovirus-1) | Porcine teschovirus 2 A (P2A) | Tanabe et al., 2010 | ||
| Genetic reagent (Danio rerio) | mitfaw2/w2 | Lister et al., 1999 | RRID:ZFIN_ZDB-GENO-070501-2 | |
| Genetic reagent (Danio rerio) | TgBAC(vsx2:GAL4FF) | Kimura et al., 2013 | TgBAC(vsx2:GAL4FF) nns18Tg | |
| Genetic reagent (Danio rerio) | Tg(myl7:GAL4FF) | This paper | Tg(myl7:GAL4FF)nub38Tg | Available from M. Hibi lab |
| Genetic reagent (Danio rerio) | Tg(UAS:ChRWR-EGFP) | Kimura et al., 2013 | Tg(UAS:ChRWR-EGFP)js3Tg | |
| Genetic reagent (Danio rerio) | Tg(UAS-hsp70l:SpiRh1-Flag-P2A-TagCFP) | This paper | Tg(5xUAS-hsp70l:Had.Rh1-Flag-P2A-TagCFP, myl7:mCherry)nub39Tg | Available from M. Hibi lab |
| Genetic reagent (Danio rerio) | Tg(UAS-hsp70l:SpiRh1[S186F]-Flag-P2A-TagCFP) | This paper | Tg(5xUAS-hsp70l:Had.Rh1[S186F]-Flag-P2A-TagCFP, myl7:mCherry)nub40Tg | Available from M. Hibi lab |
| Genetic reagent (Danio rerio) | Tg(UAS-hsp70l:beeUVOP-Flag-P2A-TagCFP) | This paper | Tg(5xUAS-hsp70l: Ace.UVOP-Flag-P2A-TagCFP, myl7:mCherry)nub41Tg | Available from M. Hibi lab |
| Genetic reagent (Danio rerio) | Tg(UAS-hsp70l:beeBLOP-Flag-P2A-TagCFP) | This paper | Tg(5xUAS-hsp70l:Ace.BLOP-Flag-P2A-TagCFP, myl7:mCherry)nub42Tg | Available from M. Hibi lab |
| Genetic reagent (Danio rerio) | Tg(UAS-hsp70l:PxRh3-Flag-P2A-TagCFP) | This paper | Tg(5xUAS-hsp70l:Pxu.Rh3-Flag-P2A-TagCFP; myl7:mCherry)nub43Tg | Available from M. Hibi lab |
| Genetic reagent (Danio rerio) | Tg(UAS-hsp70l:MosOpn3-Flag-P2A-TagCFP) | This paper | Tg(5xUAS-hsp70l:Ast.Opn3-Flag-P2A-TagCFP, myl7:mCherry)nub44Tg | Available from M. Hibi lab |
| Genetic reagent (Danio rerio) | Tg(UAS-hsp70l:PufTMT-Flag-P2A-TagCFP) | This paper | Tg(5xUAS-hsp70l:Tru.TMT-Flag-P2A-TagCFP, myl7:mCherry)nub45Tg | Available from M. Hibi lab |
| Genetic reagent (Danio rerio) | Tg(UAS-hsp70l:LamPP-Flag-P2A-TagCFP) | This paper | Tg(5xUAS-hsp70l:Lca.PP-Flag-P2A-TagCFP, myl7:mCherry)nub46Tg | Available from M. Hibi lab |
| Genetic reagent (Danio rerio) | Tg(UAS-hsp70l:ZPP1-Flag-P2A-TagCFP) | This paper | Tg(5xUAS-hsp70l:parapinopsina-Flag-P2A-TagCFP, myl7:mCherry)nub47Tg | Available from M. Hibi lab |
| Genetic reagent (Danio rerio) | Tg(UAS-hsp70l:ZPP2-Flag-P2A-TagCFP) | This paper | Tg(5xUAS-hsp70l:parapinopsinb-Flag-P2A-TagCFP, myl7:mCherry)nub48Tg | Available from M. Hibi lab |
| Genetic reagent (Danio rerio) | Tg(UAS-hsp70l:GCaMP6s) | Muto et al., 2017 | Tg(5xUAS-hsp70l:GCaMP6s) nkUAShspzGCaMP6s13aTg | |
| Genetic reagent (Danio rerio) | Tg(UAS-hsp70l:GtACR1-EYFP) | This paper | Tg(5xUAS-hsp70l:GtACR1-EYFP, myl7:mCherry)nub53Tg | Available from M. Hibi lab |
| Genetic reagent (Danio rerio) | Tg(UAS-hsp70l:ChrimsonR-tdTomato) | This paper | Tg(5xUAS-hsp70l:ChrimsonR-tdTomato)nub119Tg | Available from M. Hibi Lab |
| Cell line (Homo sapiens) | Human embryonic kidney 293 S (HEK293S) | Terakita et al., 2008 | ||
| Recombinant DNA reagent | pCS2 +SpiRh1-Flag-P2A-TagCFP | This paper | Mammalian expression plasmid, available from M. Hibi lab | |
| Recombinant DNA reagent | pCS2 +SpiRh1[S186F]-Flag-P2A-TagCFP | This paper | Mammalian expression plasmid, available from M. Hibi lab | |
| Recombinant DNA reagent | pCS2 +MosOpn3-Flag-P2A-TagCFP | This paper | Mammalian expression plasmid, available from M. Hibi lab | |
| Recombinant DNA reagent | pCS2 +PufTMT-Flag-P2A-TagCFP | This paper | Mammalian expression plasmid, available from M. Hibi lab | |
| Recombinant DNA reagent | pCS2 +LamPP-Flag-P2A-TagCFP | This paper | Mammalian expression plasmid, available from M. Hibi lab | |
| Recombinant DNA reagent | pCS2 +ZPP1-Flag-P2A-TagCFP | This paper | Mammalian expression plasmid, available from M. Hibi lab | |
| Recombinant DNA reagent | pGloSesor-20F cAMP | Promega | GeneBank: EU770615.1 | |
| Recombinant DNA reagent | pcDNA3.1+/mit-2mutAEQ | Addgene #45539 | ||
| Recombinant DNA reagent | pT2ALR-Dest | Dohaku et al., 2019 | Tol2 Gateway plasmid, available from M. Hibi lab | |
| Recombinant DNA reagent | pBH-R1-R2 | This paper | Tol2 Gateway Plasmid, available from M. Hibi lab | |
| Recombinant DNA reagent | pENTR L1-5xUAS-hsp70l-R5 | This paper | Gateway entry clone, available from M. Hibi lab | |
| Recombinant DNA reagent | pENTR L5-SpiRh1-Flag-P2A-TagCFP-SV40pAS-L2 | This paper | Gateway entry clone, available from M. Hibi lab | |
| Recombinant DNA reagent | pENTR L5-SpiRh1[S186F] -Flag-P2A-TagCFP-SV40pAS -L2 | This paper | Gateway entry clone, available from M. Hibi lab | |
| Recombinant DNA reagent | pENTR L5-beeUVOP-Flag-P2A-TagCFP-SV40pAS-L2 | This paper | Gateway entry clone, available from M. Hibi lab | |
| Recombinant DNA reagent | pENTR L5-beeBlueOP-Flag-P2A-TagCFP-SV40pAS-L2 | This paper | Gateway entry clone, available from M. Hibi lab | |
| Recombinant DNA reagent | pENTR L5-PxRh3-Flag-P2A-TagCFP-SV40pAS-L2 | This paper | Gateway entry clone, available from M. Hibi lab | |
| Recombinant DNA reagent | pENTR L5-MosOpn3-Flag-P2A-TagCFP-SV40pAS-L2 | This paper | Gateway entry clone, available from M. Hibi lab | |
| Recombinant DNA reagent | pENTR L5-PufTMT-Flag-P2A-TagCFP-SV40pAS-L2 | This paper | Gateway entry clone, available from M. Hibi lab | |
| Recombinant DNA reagent | pENTR L5-LamPP-Flag-P2A-TagCFP-SV40pAS-L2 | This paper | Gateway entry clone, available from M. Hibi lab | |
| Recombinant DNA reagent | pENTR L5-ZPP1-Flag-P2A-TagCFP-SV40pAS-L2 | This paper | Gateway entry clone, available from M. Hibi lab | |
| Recombinant DNA reagent | pENTR L5-ZPP2-Flag-P2A-TagCFP-SV40pAS-L2 | This paper | Gateway entry clone, available from M. Hibi lab | |
| Antibody | Mouse monoclonal anti-Flag antibody | Sigma-Aldrich | Cat# F3165; RRID:AB_259529 | Dilution 1:500 |
| Antibody | Mouse monoclonal anti-Myc tag antibody | Santa Cruz Biotechnology | Cat# sc-40; RRID:AB_627268 | Dilution 1:500 |
| Antibody | Rat monoclonal anti-GFP antibody | Nacalai Tesque, Inc | Cat# 04404–84; RRID:AB_10013361 | Dilution 1:500 |
| Antibody | Rabbit polyclonal anti-DsRed antibody | Takara Bio | Cat# 632496; RRID:AB_10013483 | Dilution 1:500 |
| Antibody | Goat CF488A anti-mouse IgG antibody | Biotium Inc | Cat# 20018; RRID:AB_10557263 | Dilution 1:500 |
| Antibody | Goat CF488A anti-rat IgG antibody | Biotium, Inc | Cat# 20023; RRID:AB_10557403 | Dilution 1:500 |
| Antibody | Goat CF568 anti-rabbit IgG antibody | Biotium Inc | Cat# 20103; RRID:AB_10558012 | Dilution 1:500 |
| Chemical compound, drug | YM-254890 | Fujifilm Wako Pure Chemical Corp. | 257–00631 | |
| Chemical compound, drug | low gelling temperature Type VII-A | Sigma-Aldrich | A0701 | |
| Chemical compound, drug | tricaine methanesulfonate | Nacalai Tesque, Inc | Cat# 886-86-2 | |
| Chemical compound, drug | pentylenetetrazol | Sigma-Aldrich | Cat# P6500 | |
| Chemical compound, drug | Pertussis toxin | FUJIFILM Wako Pure Chemical Corp. | Cat# 168–22471 | |
| Chemical compound, drug | BaCl2 | FUJIFILM Wako Pure Chemical Corp. | Cat# 025–00172 | |
| Software, algorithm | PolyScan2 | Mightex | ||
| Software, algorithm | StreamPix7 | NorPix Inc | ||
| Software, algorithm | LabVIEW | National Instruments | 2015 | https://www.ni.com/ja-jp.html |
| Software, algorithm | GraphPad Prism5 | GraphPad Software | https://www.mdf-soft.com/ | |
| Software, algorithm | VSDC Free Video Editor 6.4.7.155 | FLASH-INTEGRO LLC | https://www.videosoftdev.com/jp | |
| Software, algorithm | Microsoft Movies & TV | Microsoft Corp. | https://apps.microsoft.com/store/detail/movies-tv/9WZDNCRFJ3P2 | |
| Software, algorithm | QuickTime player 10.5 | Apple Inc | https://quicktime.softonic.jp/ | |
| Software, algorithm | Fiji / ImageJ | National Institutes of Health (NIH) | http://fiji.sc/ | |
| Software, algorithm | R 3.6.1 and 4.2.1 | https://www.r-project.org/ | ||
| Software, algorithm | ggplot2 3.2.0 of R | https://ggplot2.tidyverse.org/ | ||
| Software, algorithm | nlme 3.1–162 of R | https://cran.r-project.org/web/packages/nlme/index.html | ||
| Software, algorithm | Bonsai | Lopes et al., 2015 | https://open-ephys.org/bonsai | |
| Software, algorithm | Python 3.5.6 | Python Software Foundation | https://www.python.org/ | |
| Software, algorithm | Tracker Video Analysis and Modeling Tool for Physics Education 5.1.5 | https://physlets.org/tracker/ | ||
| Software, algorithm | Microsoft Excel for Mac, ver. 16.74 | Microsoft | ||
| Software, algorithm | HB_frequency.py | This paper | Source code file | |
| Software, algorithm | HB_frequency_plot.py | This paper | Source code file | |
| Software, algorithm | AV_conductivity_plot.py | This paper | Source code file | |
| Software, algorithm | AV_conductivity.py | This paper | Source code file |
Additional files
-
MDAR checklist
- https://cdn.elifesciences.org/articles/83974/elife-83974-mdarchecklist1-v1.pdf
-
Source code 1
Software that detects the timing of each heartbeat from the data of luminosity changes over time.
- https://cdn.elifesciences.org/articles/83974/elife-83974-code1-v1.zip
-
Source code 2
Software that calculates the average and SEM of heartbeats from the heartbeat data and plots them on a graph with time on the x-axis and heart rate on the y-axis.
- https://cdn.elifesciences.org/articles/83974/elife-83974-code2-v1.zip
-
Source code 3
Software that plots the temporal changes in luminosity data from any arbitrary position in the atrium and ventricle as waveform data.
Within a specified time frame, it normalizes the data so that the maximum and minimum luminosity values are the same for both the atrium and ventricle.
- https://cdn.elifesciences.org/articles/83974/elife-83974-code3-v1.zip
-
Source code 4
Software that computes the interval between the peak of the atrial heartbeat and the corresponding peak of the ventricular heartbeat from the waveform data of the atrium and ventricle, as the time difference between atrial and ventricular contractions.
- https://cdn.elifesciences.org/articles/83974/elife-83974-code4-v1.zip
Download links
A two-part list of links to download the article, or parts of the article, in various formats.
Downloads (link to download the article as PDF)
Open citations (links to open the citations from this article in various online reference manager services)
Cite this article (links to download the citations from this article in formats compatible with various reference manager tools)
Optogenetic manipulation of Gq- and Gi/o-coupled receptor signaling in neurons and heart muscle cells
eLife 12:e83974.
https://doi.org/10.7554/eLife.83974


