Aurora A and cortical flows promote polarization and cytokinesis by inducing asymmetric ECT-2 accumulation
- Department of Molecular Genetics and Cell Biology, University of Chicago, United States
Figures
Figure 1 with 4 supplements
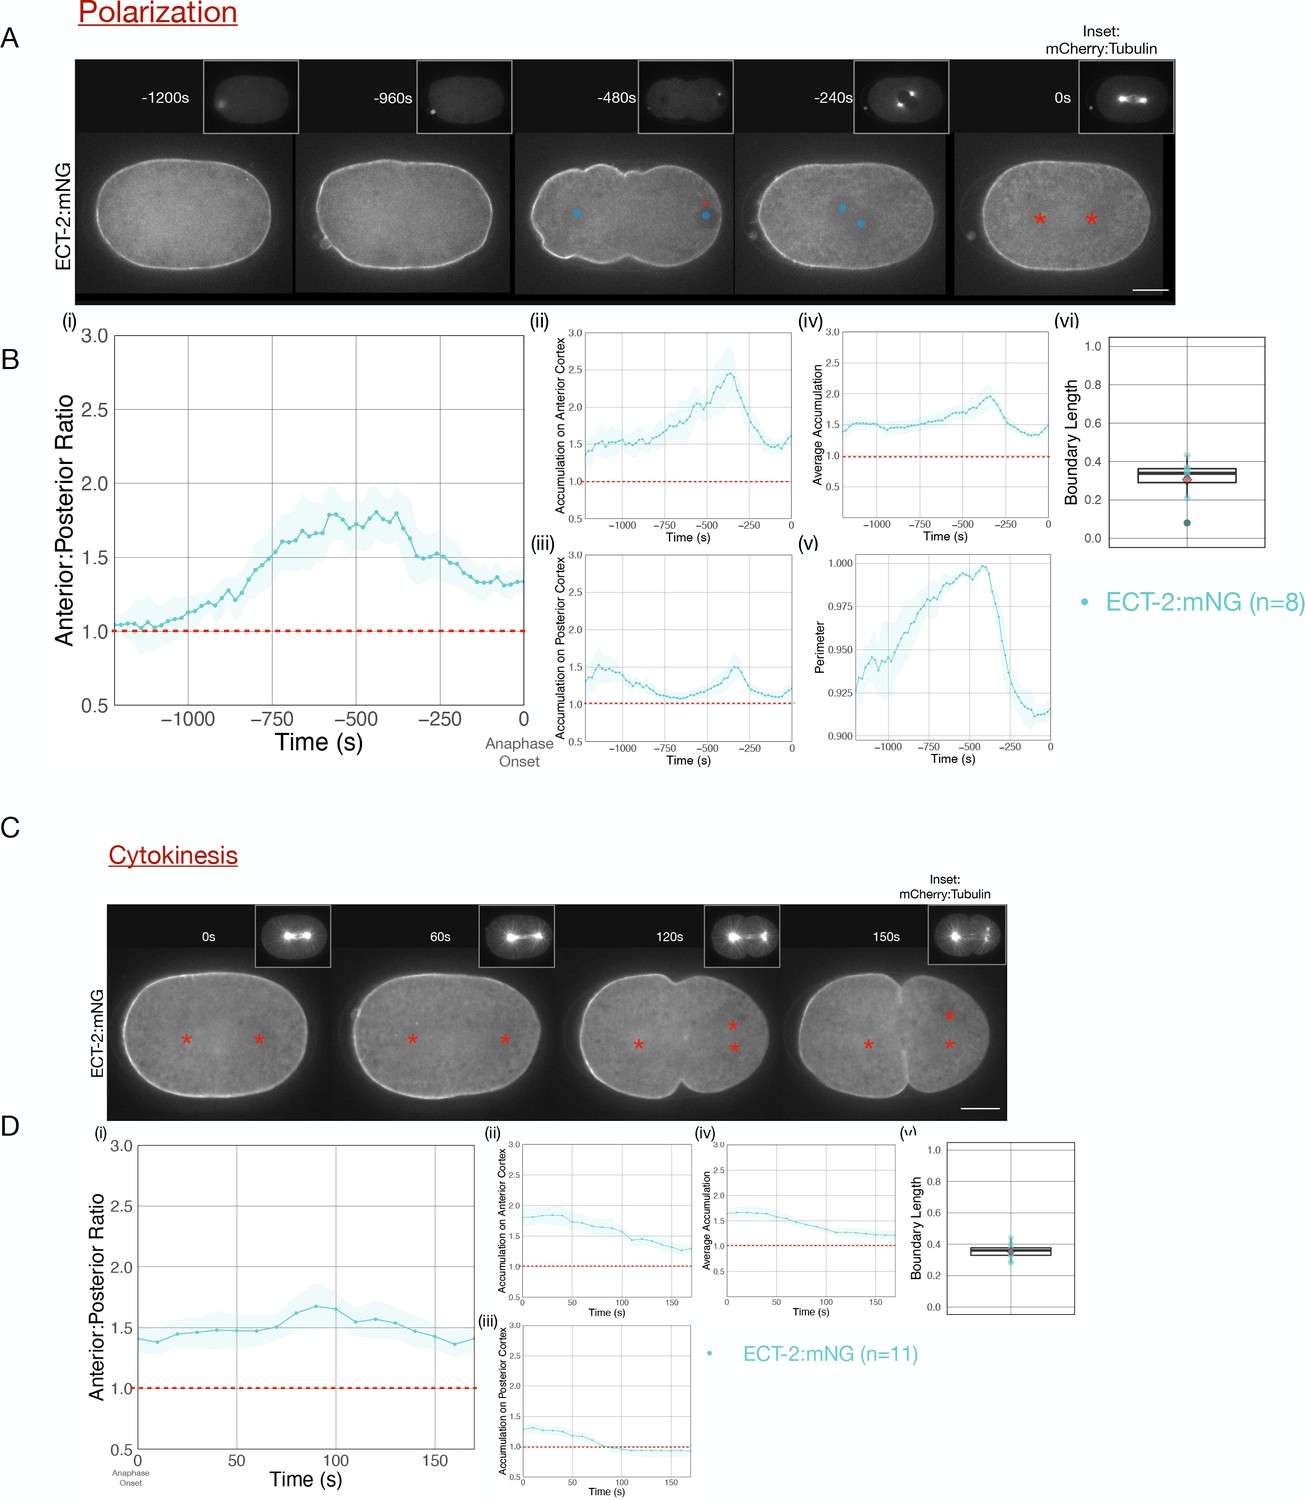
Cortical ECT-2 becomes asymmetric during polarization and cytokinesis.
(A) ECT-2 accumulation is asymmetric during polarization. Selected time points from a representative embryo expressing ECT-2:mNeonGreen (mNG) and mCherry:Tubulin (insets) during polarity establishment. Time zero represents anaphase onset. Blue circles indicate pronuclei and red asterisks label the approximate locations of the centrosomes. All scale bars represent 10 µm. (B) Quantification of (i) average anterior:posterior ratio of anterior and posterior cortical accumulation, (ii) average anterior cortical accumulation, (iii) average posterior cortical accumulation, (iv) average cortical accumulation over the entire cortex, and (v) normalized perimeter of embryos over time (s). n=8; solid line is the average of all embryos measured and the shaded ribbon represents the 95% confidence interval (95 CI). (vi) Box plot of boundary length. Boundary length is the fraction of the embryo cortex with normalized ECT-2 levels below threshold calculated at the time point of the maximum anterior:posterior ratio of ECT-2 for each embryo (see Materials and methods for details). Source data is available (Figure 1—source data 1). (C) ECT-2 accumulation is asymmetric during cytokinesis. A representative embryo expressing endogenously tagged ECT-2:mNeonGreen (mNG) at the indicated time points during cytokinesis beginning at anaphase onset (0 s). Red asterisks label the approximate locations of the centrosomes. (D) Quantification of the (i) average anterior:posterior ratio, (ii) average anterior cortical accumulation, (iii) average posterior cortical accumulation, and (iv) average cortical accumulation. n=11; solid line represents the average of all embryos and the shaded ribbon represents the 95% confidence interval (95 CI). (v) Box plot of boundary length at the most asymmetric time point of ECT-2 for each embryo. Source data is available (Figure 1—source data 1).
-
Figure 1—source data 1
This source data table consists of the measurements of ECT-2 accumulation as a function of time.
Specifically, for each embryo at each time point, the table includes the average accumulation of ECT-2 in the anterior and posterior 20% of the embryo normalized to the cytoplasmic level and the ratio of these values [AntRatio, PostRatio,AntPostRatio]. The graphs in the figure present the average of these values for the set of embryos for each treatment at each time point and plotted with a 95% confidence intervals. The treatments are described in the respective figure legend.
- https://cdn.elifesciences.org/articles/83992/elife-83992-fig1-data1-v2.zip
Figure 1—figure supplement 1
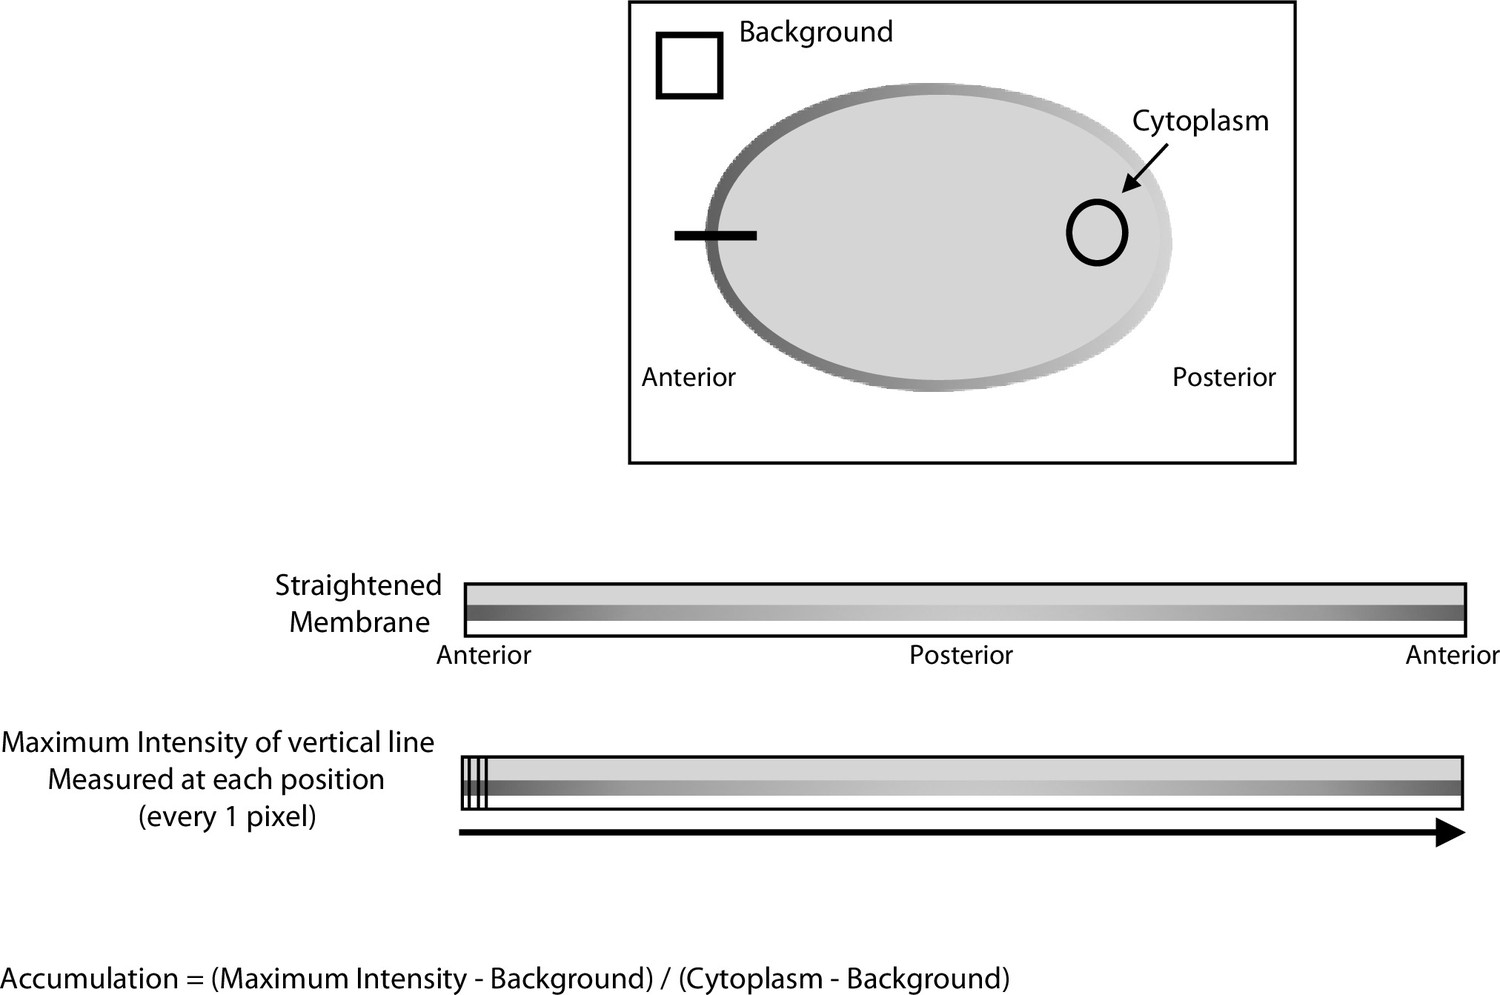
Schematic describing quantitation of ECT-2 cortical accumulation.
Average intensity of the background and the cytoplasm were taken at every time point in a time series of an embryo. The embryo boundaries were recognized and a 50 pixel line centered on the cortex was straightened starting from the anterior of the embryo and proceeding around the embryo perimeter clockwise through the posterior and returning to the anterior. From the image containing the straightened cortical region, a 3 pixel-wide line was drawn perpendicular to the cortical and the maximum intensity was taken at each position along the line. Accumulation was calculated for every position using (maximum intensity-background)/(cytoplasm-background). The measurements of anterior and posterior accumulation reflect the average accumulation in the anterior 20% or the posterior 20% of the embryo, respectively.
Figure 1—figure supplement 2
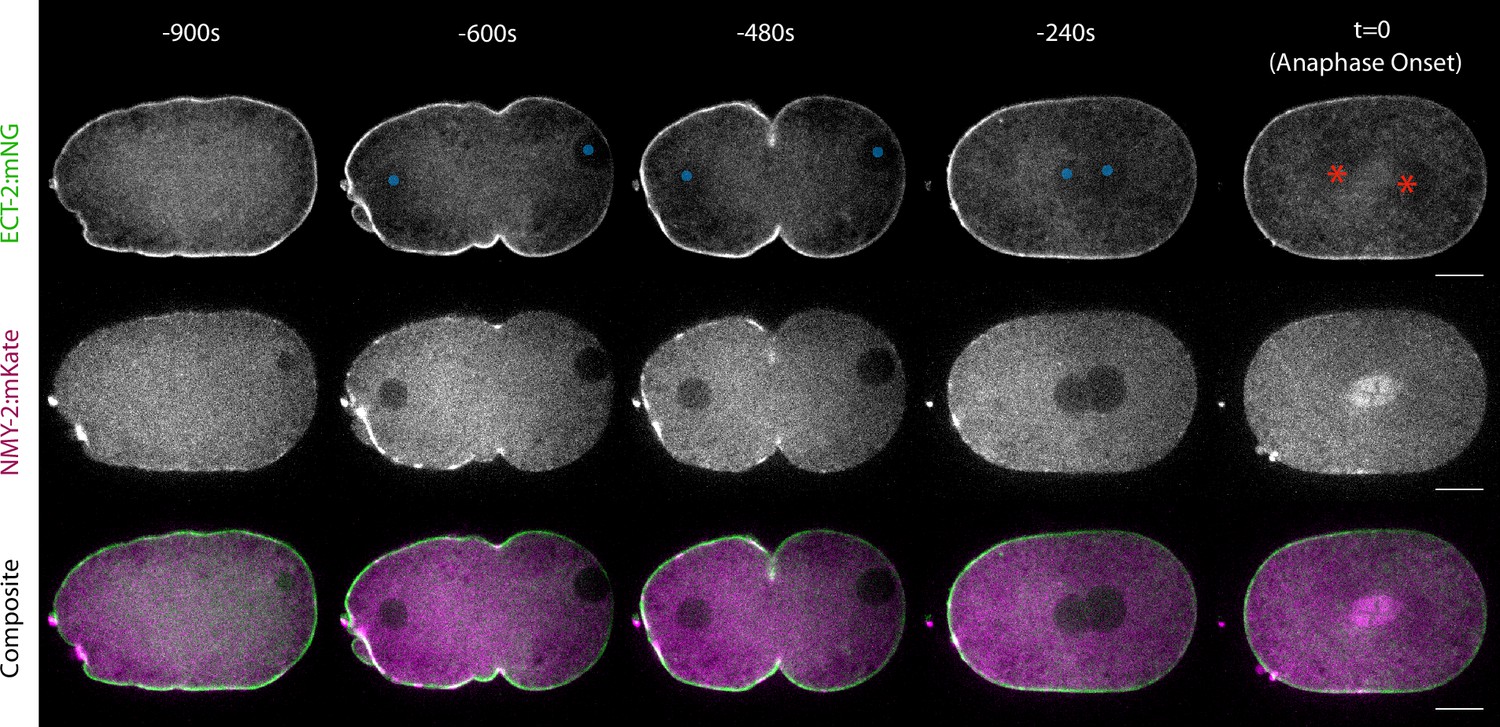
ECT-2 and cortical myosin accumulate on the anterior cortex during polarization.
Selected time points from a time-lapse series acquired from embryos co-expressing ECT-2:mNG and NMY-2:mKate. Composite includes ECT-2:mNG in green and NMY-2:mKate in magenta. Anaphase onset is set to t=0.
Figure 1—figure supplement 3
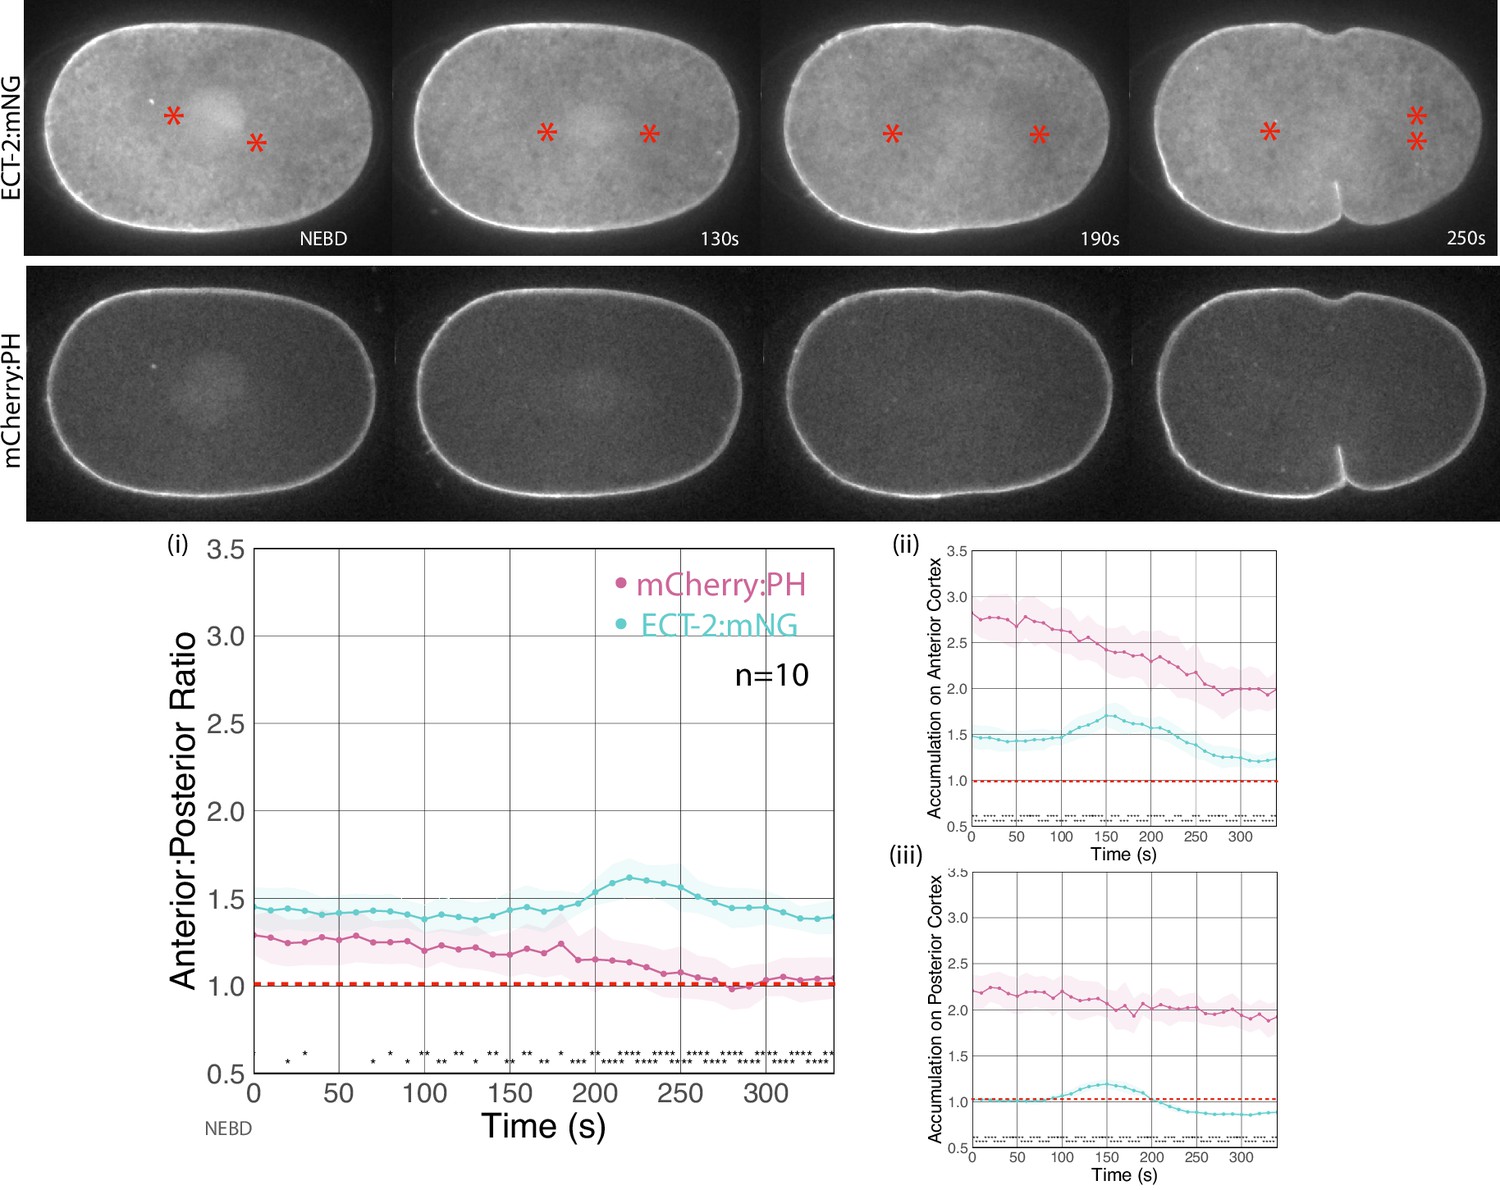
ECT-2 is more asymmetric than a membrane marker.
Embryos co-expressing ECT-2:mNG; mCherry:PH were imaged during cytokinesis; stills were taken from a single time lapse. Graphs show the asymmetric accumulation ratio, anterior accumulation, and posterior accumulation over time. The asterisks at the bottom of the graphs represent a statistically significant difference between the accumulations of PH and ECT-2 at each indicated time point. The asterisks range between one (*) where the p-value is less than 0.05, and four (****) where the p-value is less than 0.0001. Source data is available (Figure 1—figure supplement 3—source data 1).
-
Figure 1—figure supplement 3—source data 1
The source data is as described in legend to Figure 1—source data 1.
- https://cdn.elifesciences.org/articles/83992/elife-83992-fig1-figsupp3-data1-v2.zip
Figure 1—figure supplement 4
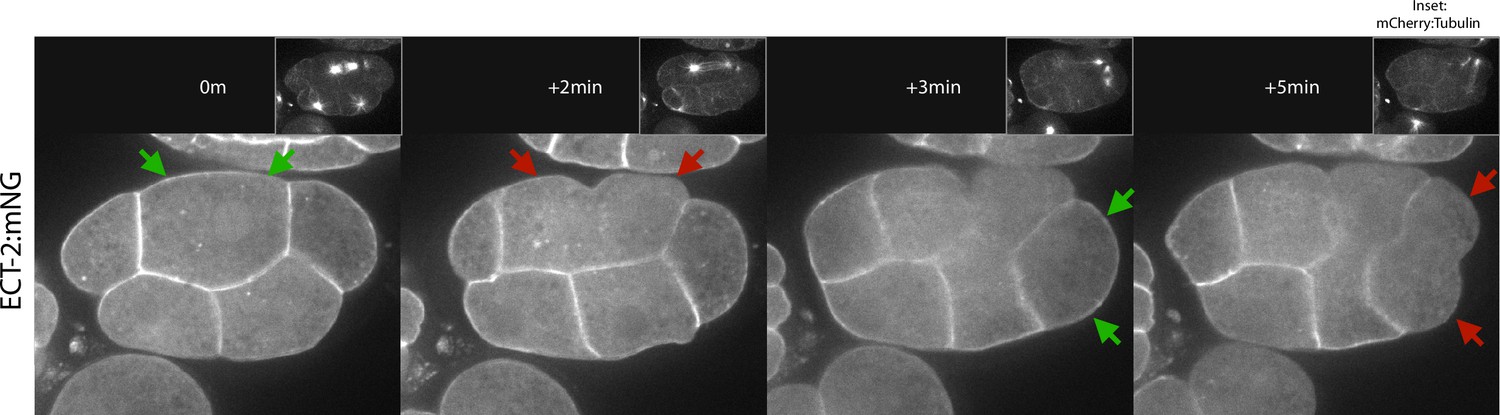
ECT-2 accumulates in an asymmetric manner on the cortex in multicellular embryos.
Shown is an embryo co-expressing ECT-2:mNG and mCherry:Tubulin. Images were acquired every 30 s for several minutes. Insets show the corresponding mCherry:Tubulin image. Arrows indicate changes in ECT-2 accumulation. Time 0 s is anaphase onset of the indicated blastomere.
Figure 2 with 2 supplements
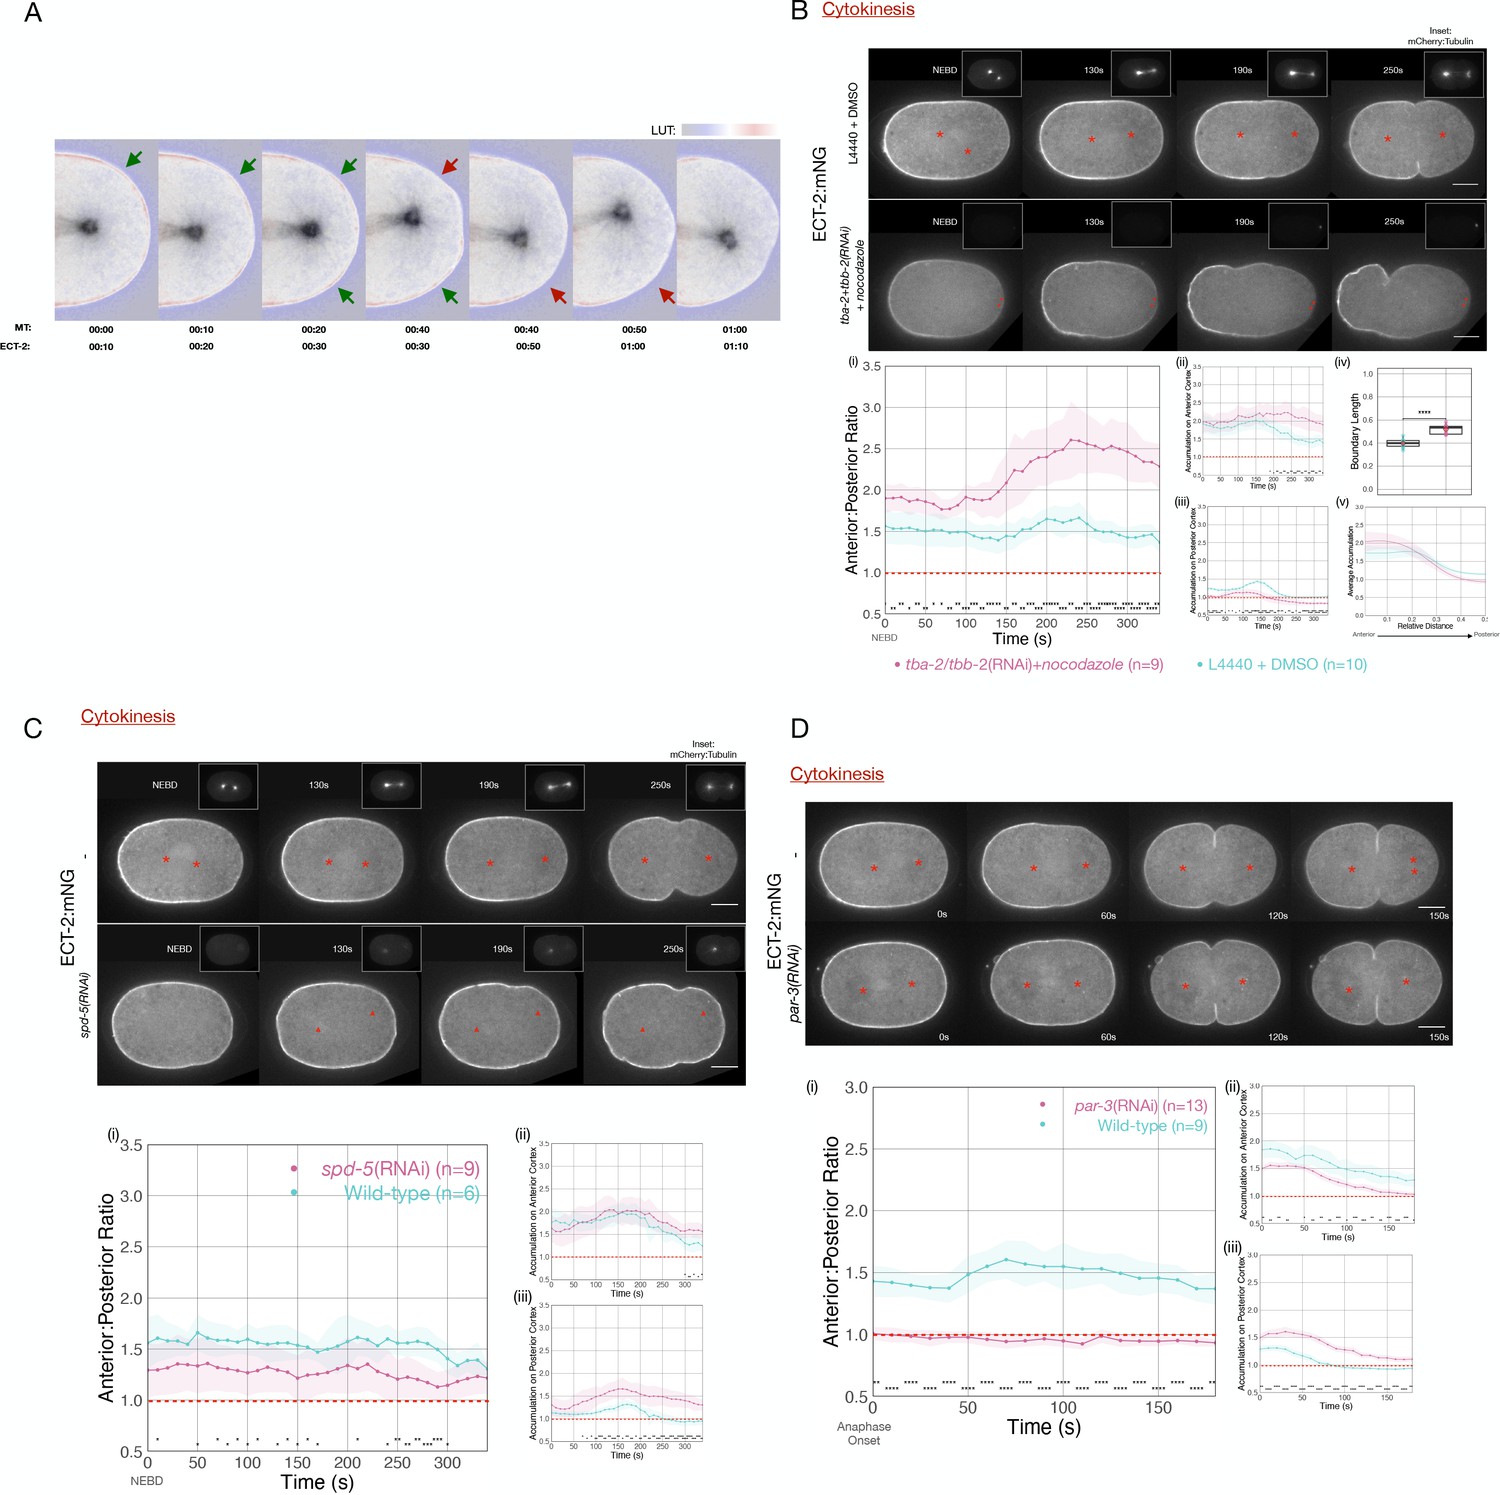
ECT-2 asymmetry is responsive to the position of the spindle.
(A) A close-up view of the localization of endogenously tagged ECT-2 and tubulin during first cleavage. Images from a time-lapse series show the distribution of ECT-2:mNG and mCherry:Tubulin. Composite images are shown: ECT-2 shown in using the displayed lookup table (LUT); the tubulin signal is displayed with inverted grayscale. In the overlays, the tubulin image is advanced by 10 s relative to ECT-2. Arrows highlight two sites where local accumulation of ECT-2 declines ~10 s after the spindle approaches, as indicated by the color change in the arrows from green to red. (B) ECT-2:mNG localization in embryos under control [L4440 + DMSO] or experimental [tba-2+tbb-2(RNAi) + 50 µg/mL nocodazole] conditions. The images are stills from a time lapse showing ECT-2:mNG localization while the insets are mCherry:Tubulin images acquired concurrently. Asterisks label the approximate locations of the asters. (i–iii) The graphs measure the anterior:posterior accumulation ratio, anterior accumulation, and posterior accumulation of ECT-2 relative to the cytoplasm over time starting at NEBD with 95% confidence interval (CI) labeled as shaded ribbons. (iv) The box plot graphs posterior boundary length of ECT-2 at the maximum polarized time point while (v) the line graph plots average accumulation at the same time point as a function of cortical position relative to the anterior of the embryo. For this and all subsequent figures, asterisks on graphs indicate statistically significant differences between wild-type and experimental conditions at each indicated time point (*p<0.05, **p<0.01,***p<0.001, ****p<0.0001). Where multiple comparisons are present, the asterisk color reflects the experimental condition compared to wild-type. All scale bars represent 10 µm. Source data is available (Figure 2—source data 1). (C) ECT-2 localization in an spd-5(RNAi) and wild-type embryos beginning at NEBD. The insets show images of mCherry:Tubulin acquired at the same time points. The red asterisks label the approximate locations of the asters while the red triangles label the approximate locations of the compromised asters. The graphs measure the anterior:posterior accumulation ratio, anterior accumulation, and posterior accumulation of ECT-2 relative to the cytoplasm over time. Source data is available (Figure 2—source data 1). (D) ECT-2 localization in a par-3(RNAi) and wild-type embryos with images starting at anaphase onset. Red asterisks label the approximate locations of the asters. The graphs measure the anterior:posterior accumulation ratio, anterior accumulation, and posterior accumulation of ECT-2 relative to the cytoplasm over time. Source data is available (Figure 2—source data 1).
-
Figure 2—source data 1
The source data is as described in legend to Figure 1—source data 1.
- https://cdn.elifesciences.org/articles/83992/elife-83992-fig2-data1-v2.zip
Figure 2—figure supplement 1
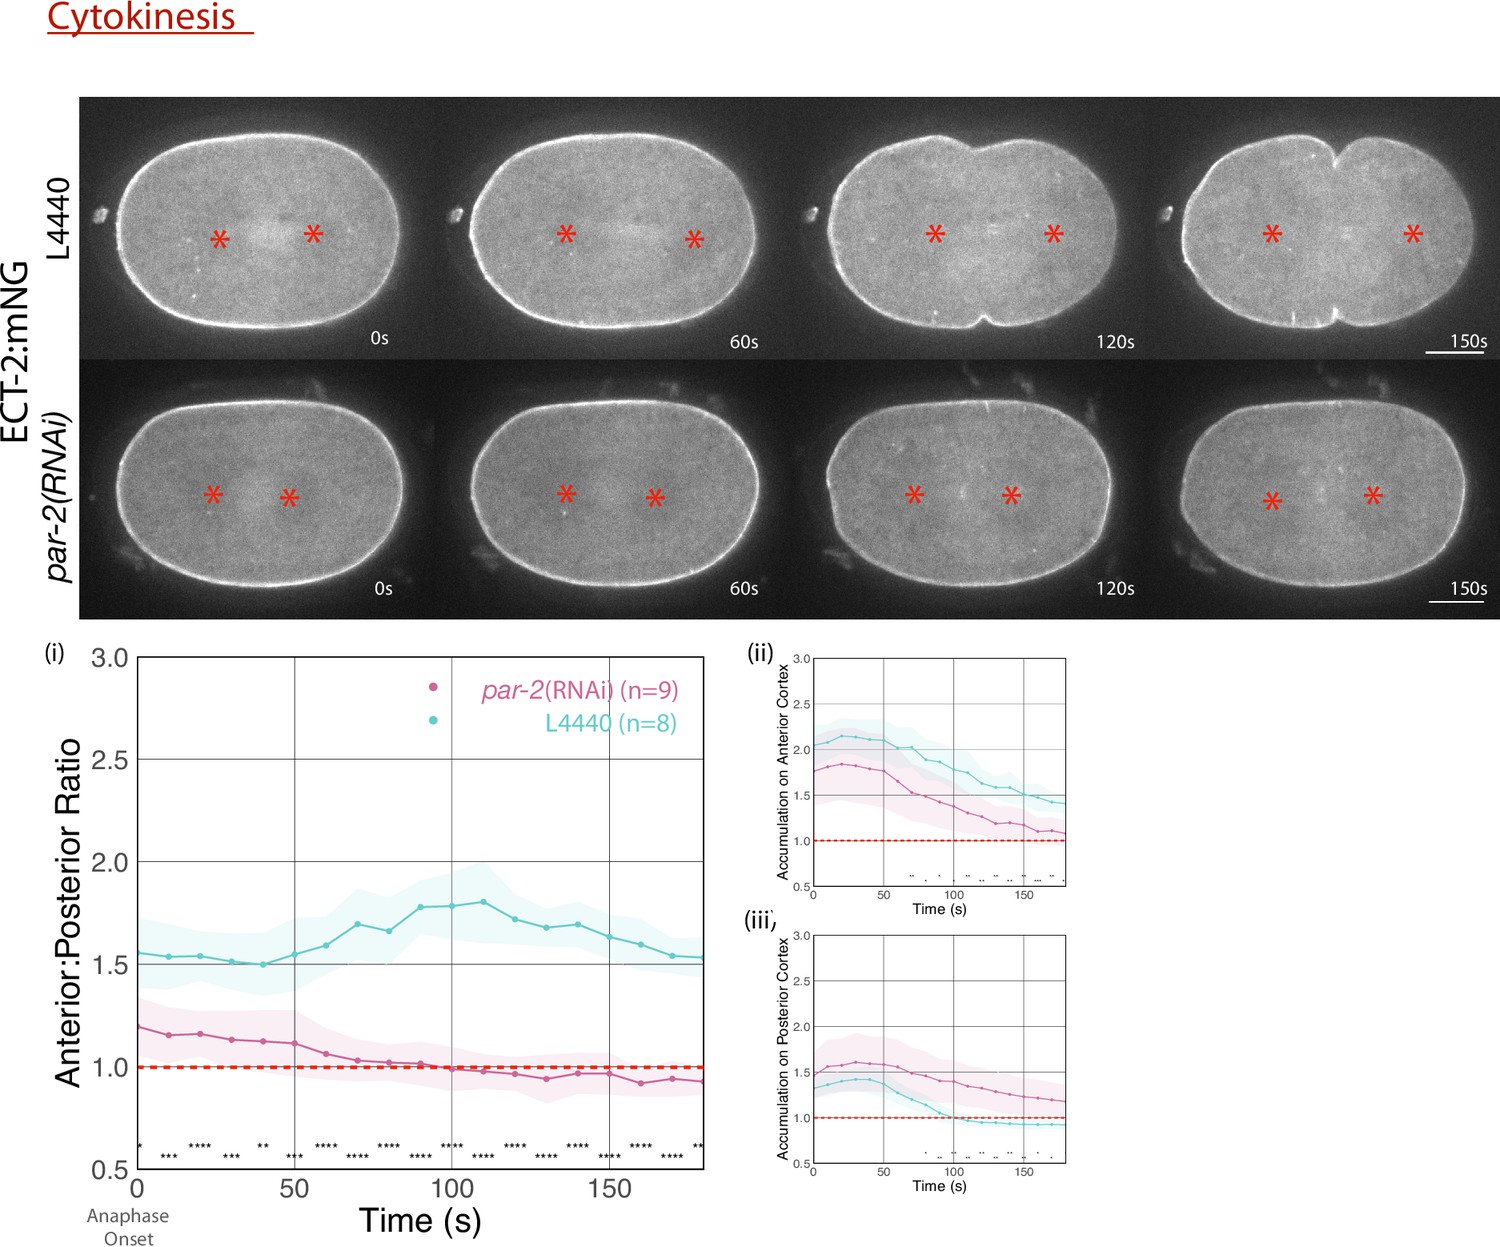
ECT-2 localization in par-2(RNAi) and L4440-treated embryos with images starting at anaphase onset.
Red asterisks label the approximate locations of the asters. The graphs measure the anterior:posterior accumulation ratio, anterior accumulation, and posterior accumulation of ECT-2 relative to the cytoplasm over time (anaphase onset is 0 s). Source data is available (Figure 2—figure supplement 1—source data 1).
-
Figure 2—figure supplement 1—source data 1
The source data is as described in legend to Figure 1—source data 1.
- https://cdn.elifesciences.org/articles/83992/elife-83992-fig2-figsupp1-data1-v2.zip
Figure 2—figure supplement 2
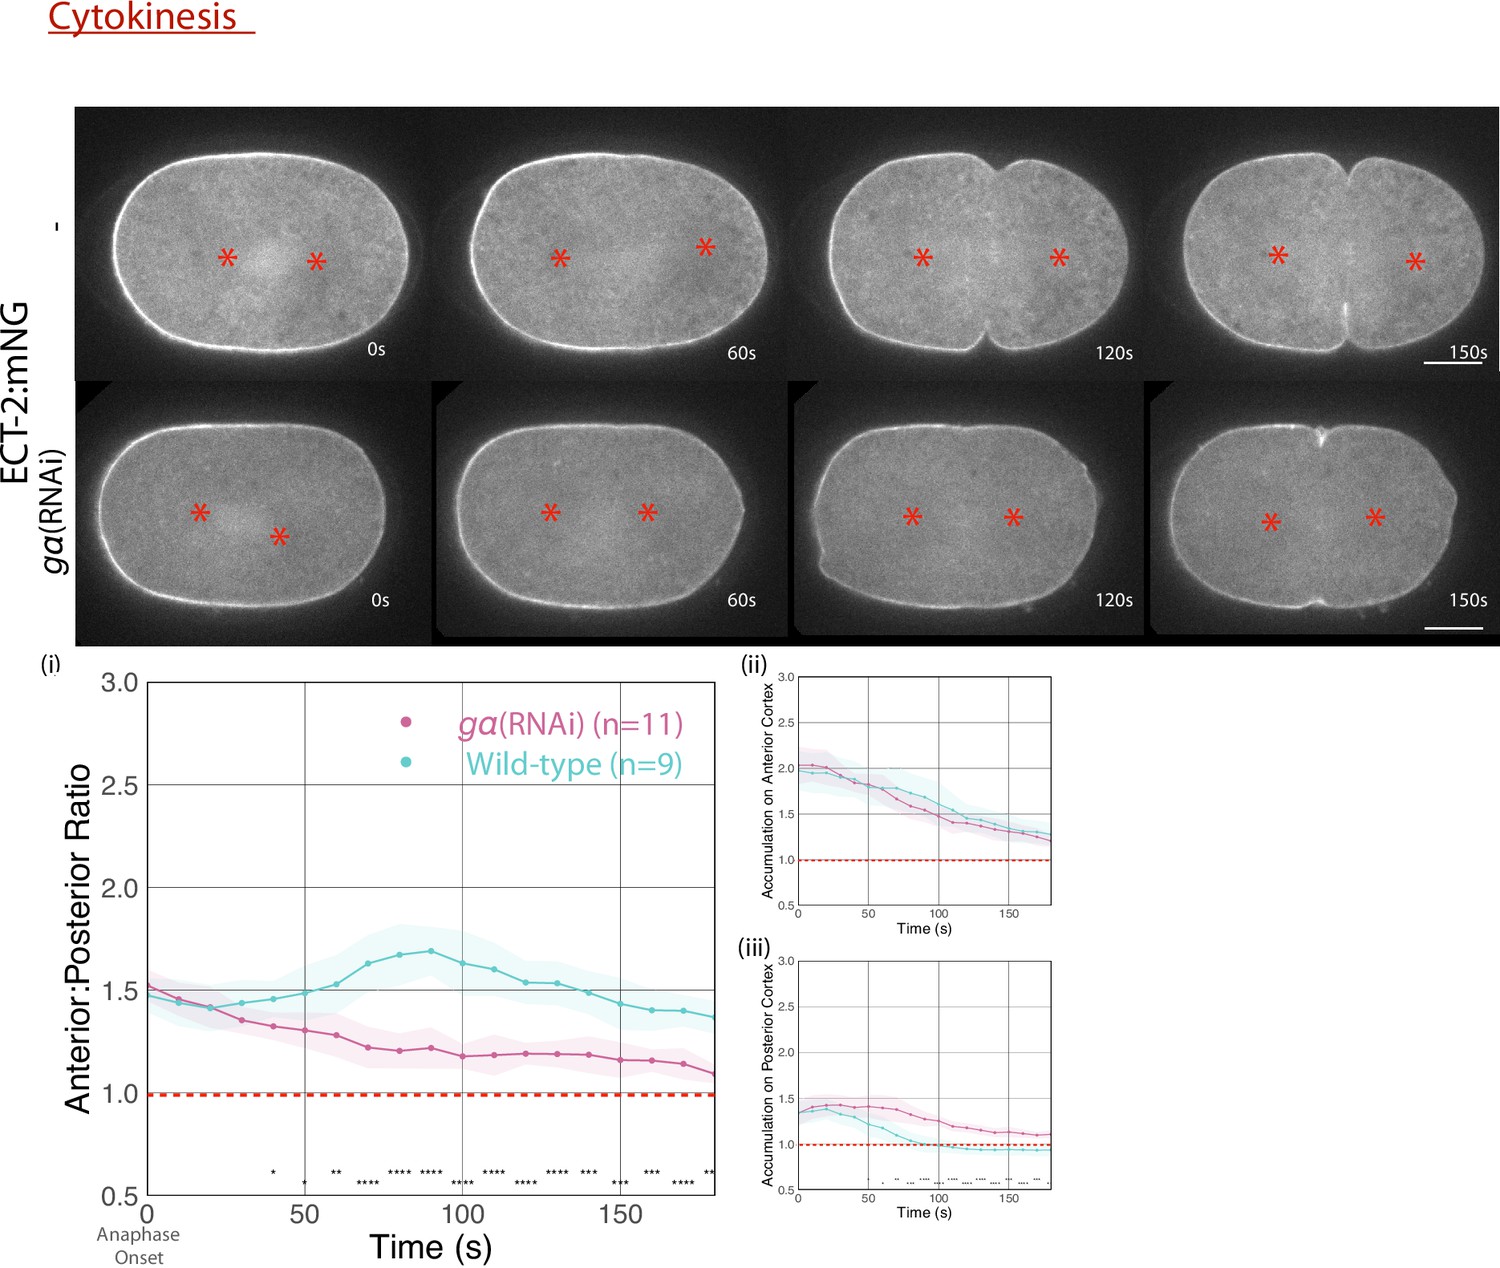
ECT-2 localization in gα-depleted and wild-type embryos with the representative stills starting at anaphase onset.
Red asterisks on the embryo images label the approximate locations of the asters. The graphs measure anterior:posterior ratio and anterior and posterior accumulations of ECT-2 relative to cytoplasm over time. Source data is available (Figure 2—figure supplement 2—source data 1).
-
Figure 2—figure supplement 2—source data 1
The source data is as described in legend to Figure 1—source data 1.
- https://cdn.elifesciences.org/articles/83992/elife-83992-fig2-figsupp2-data1-v2.zip
Figure 3 with 4 supplements
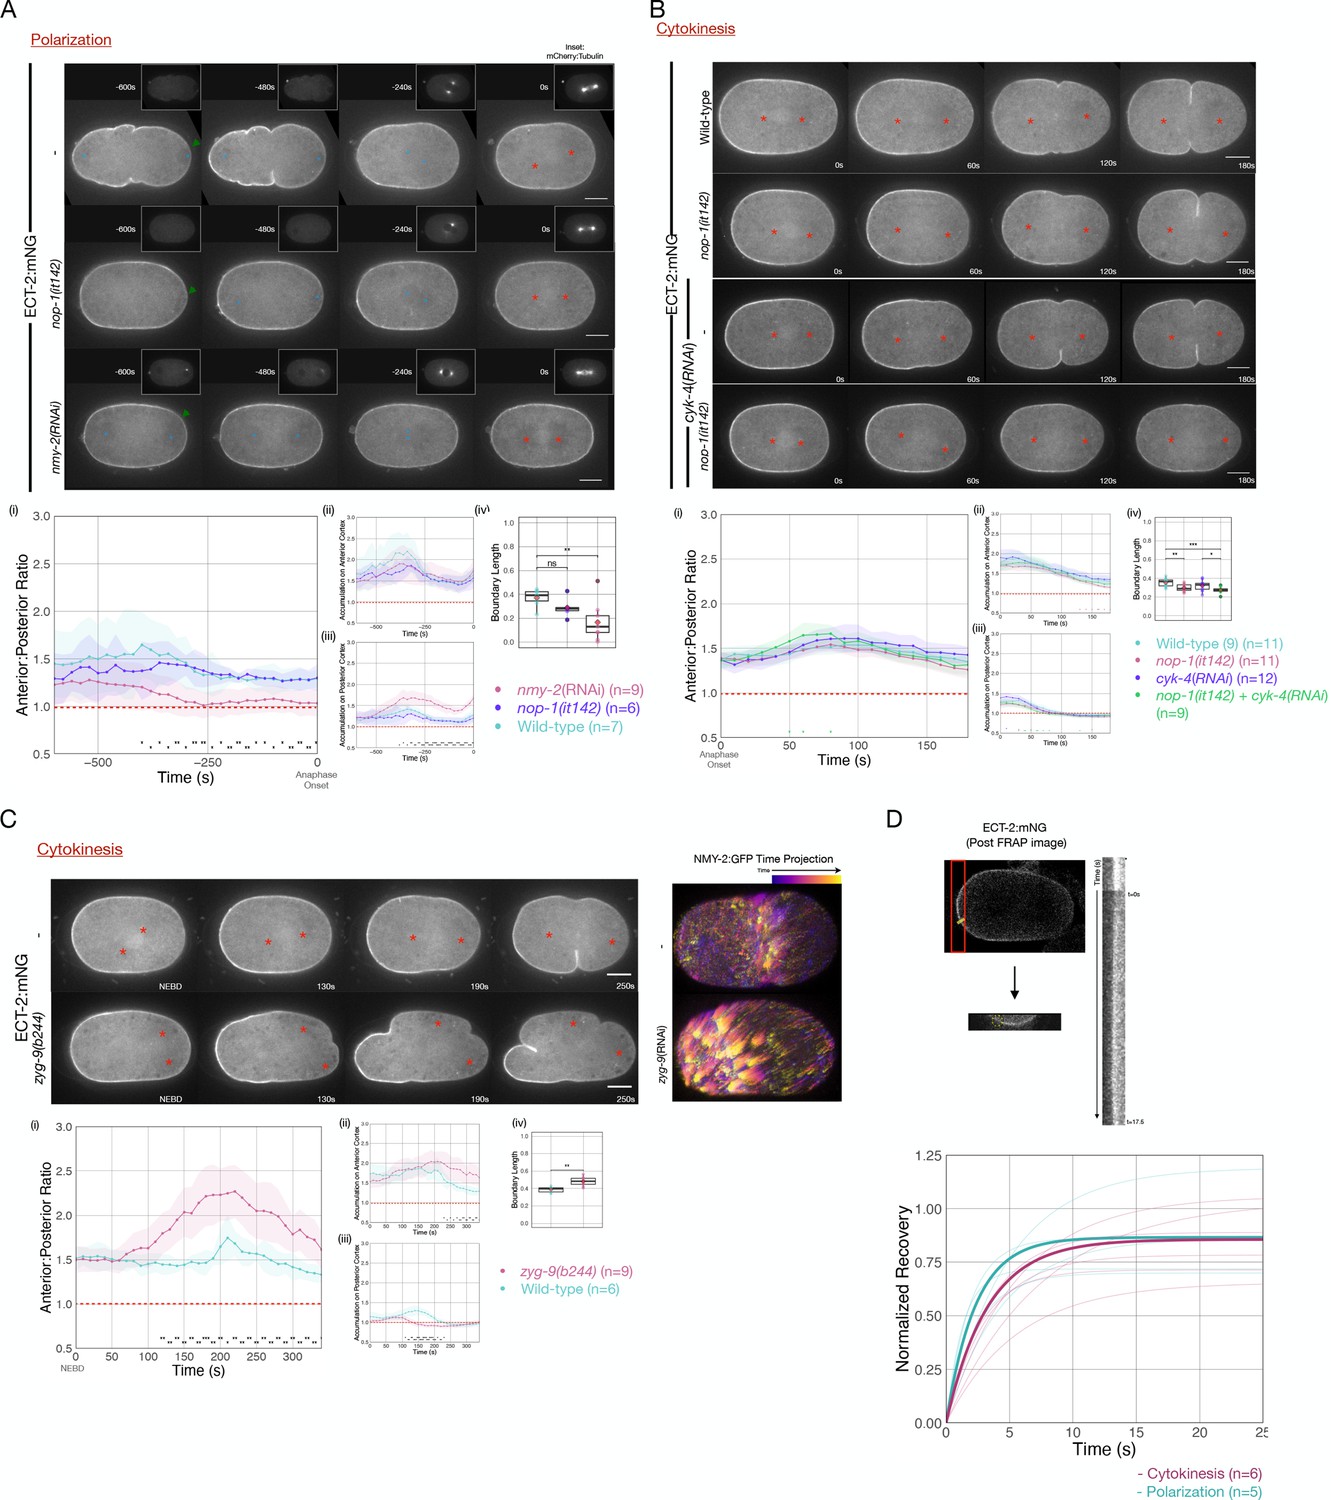
Cortical flows contribute to asymmetric cortical accumulation of ECT-2.
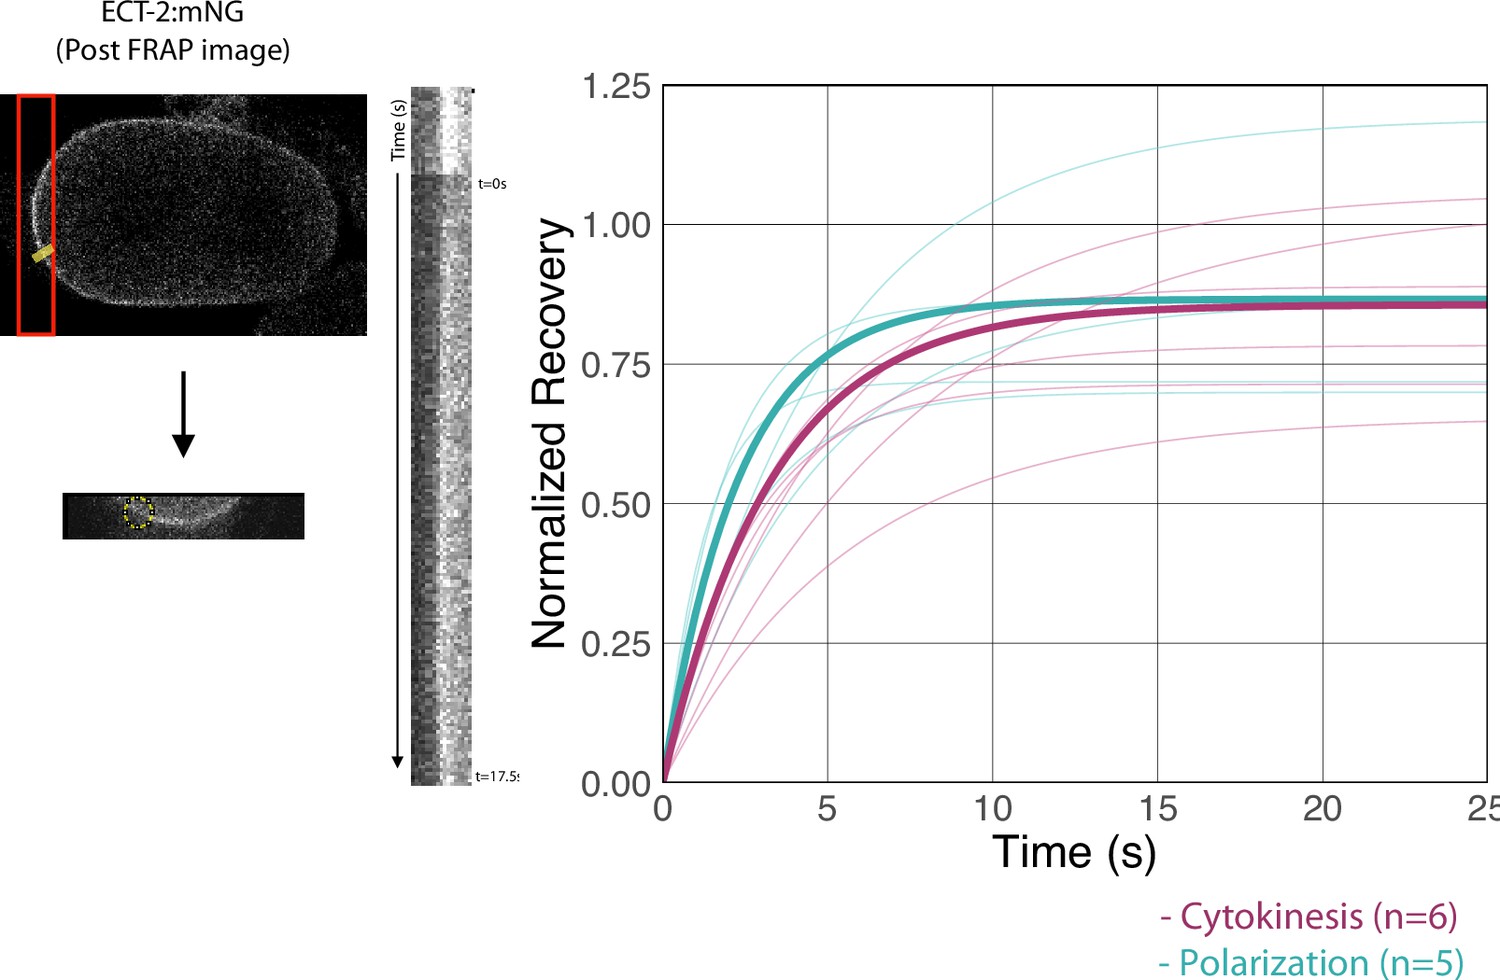
(A) Asymmetric accumulation of ECT-2 during polarization is reduced when cortical flows are reduced. Images from a time-lapse series show ECT-2 localization during polarization in a wild-type, nmy-2(RNAi), or nop-1(it142) embryo. The pronuclei are labeled with a blue circle and the asterisks label the approximate locations of the asters. Green arrowheads depict local reduction in ECT-2 as the centrosome is opposed to the posterior cortex. Graphs show the anterior:posterior accumulation ratio, anterior accumulation, and posterior accumulation of ECT-2 over time. The box plot depicts the posterior ECT-2 boundary at the time point of maximal asymmetry. Source data is available (Figure 3—source data 1). (B) Asymmetric ECT-2 accumulation is independent of its activators during cytokinesis. Images are stills from time-lapse movies depicting endogenous ECT-2 localization in wild-type, nop-1(it142), cyk-4(RNAi), and nop-1(it142); cyk-4(RNAi) embryos with time 0 as anaphase onset. Asterisks label the approximate locations of the asters. Graphs measure ECT-2 accumulation relative to average cytoplasm intensity. The boundary length of ECT-2 accumulation was measured at the most asymmetrical time point. Source data is available (Figure 3—source data 1). (C) The localization of endogenously tagged ECT-2 during cytokinesis is hyper-asymmetric in zyg-9(b244) embryos. Images from a time-lapse series show the distribution of ECT-2:mNG in either wild-type or zyg-9(b244). zyg-9 loss of function results in a posteriorly localized small transverse spindle. Times shown are relative to NEBD which is approximately ~125 s prior to anaphase onset. Red asterisks label the approximate locations of the asters. The NMY-2:GFP images depict the time-dependent changes in cortical myosin in wild-type and zyg-9(RNAi) embryos. The images shown are maximum intensity projections of ~25 time points acquired over ~50 s during early anaphase. Each time point is itself a maximum intensity projection of four images separated by 1 µm in Z. Graphs measure ECT-2 accumulation relative to average cytoplasm intensity. Source data is available (Figure 3—source data 1). (D) Cortical ECT-2 exchanges rapidly. Fluorescence recovery after photobleaching (FRAP) recovery of ECT-2 at the anterior cortex during cytokinesis and on the cortex during polarization. A region of the cortex was imaged and a small ROI was bleached. Twenty-five images were taken at 100 ms intervals before the region was bleached followed by 175 images at 100 ms intervals to document the recovery. The kymograph qualitatively shows the FRAP recovery and the graph shows fitted curves of the recovery of each embryo measured. Recovery was fitted to y=a*(1-exp(-b*x)). The bold lines are the averages of the embryos at either polarization or cytokinesis as indicated (T1/2 ~ 3 s). Source data is available (Figure 3—source data 1).
-
Figure 3—source data 1
This file contains the source data for Figure 3A–C is as described in legend to Figure 1—source data 1.
This file also contains the source data for Figure 3D which includes the individual and average a and b coefficients used to plot the fluorescence recovery after photobleaching (FRAP) data.
- https://cdn.elifesciences.org/articles/83992/elife-83992-fig3-data1-v2.zip
Figure 3—figure supplement 1
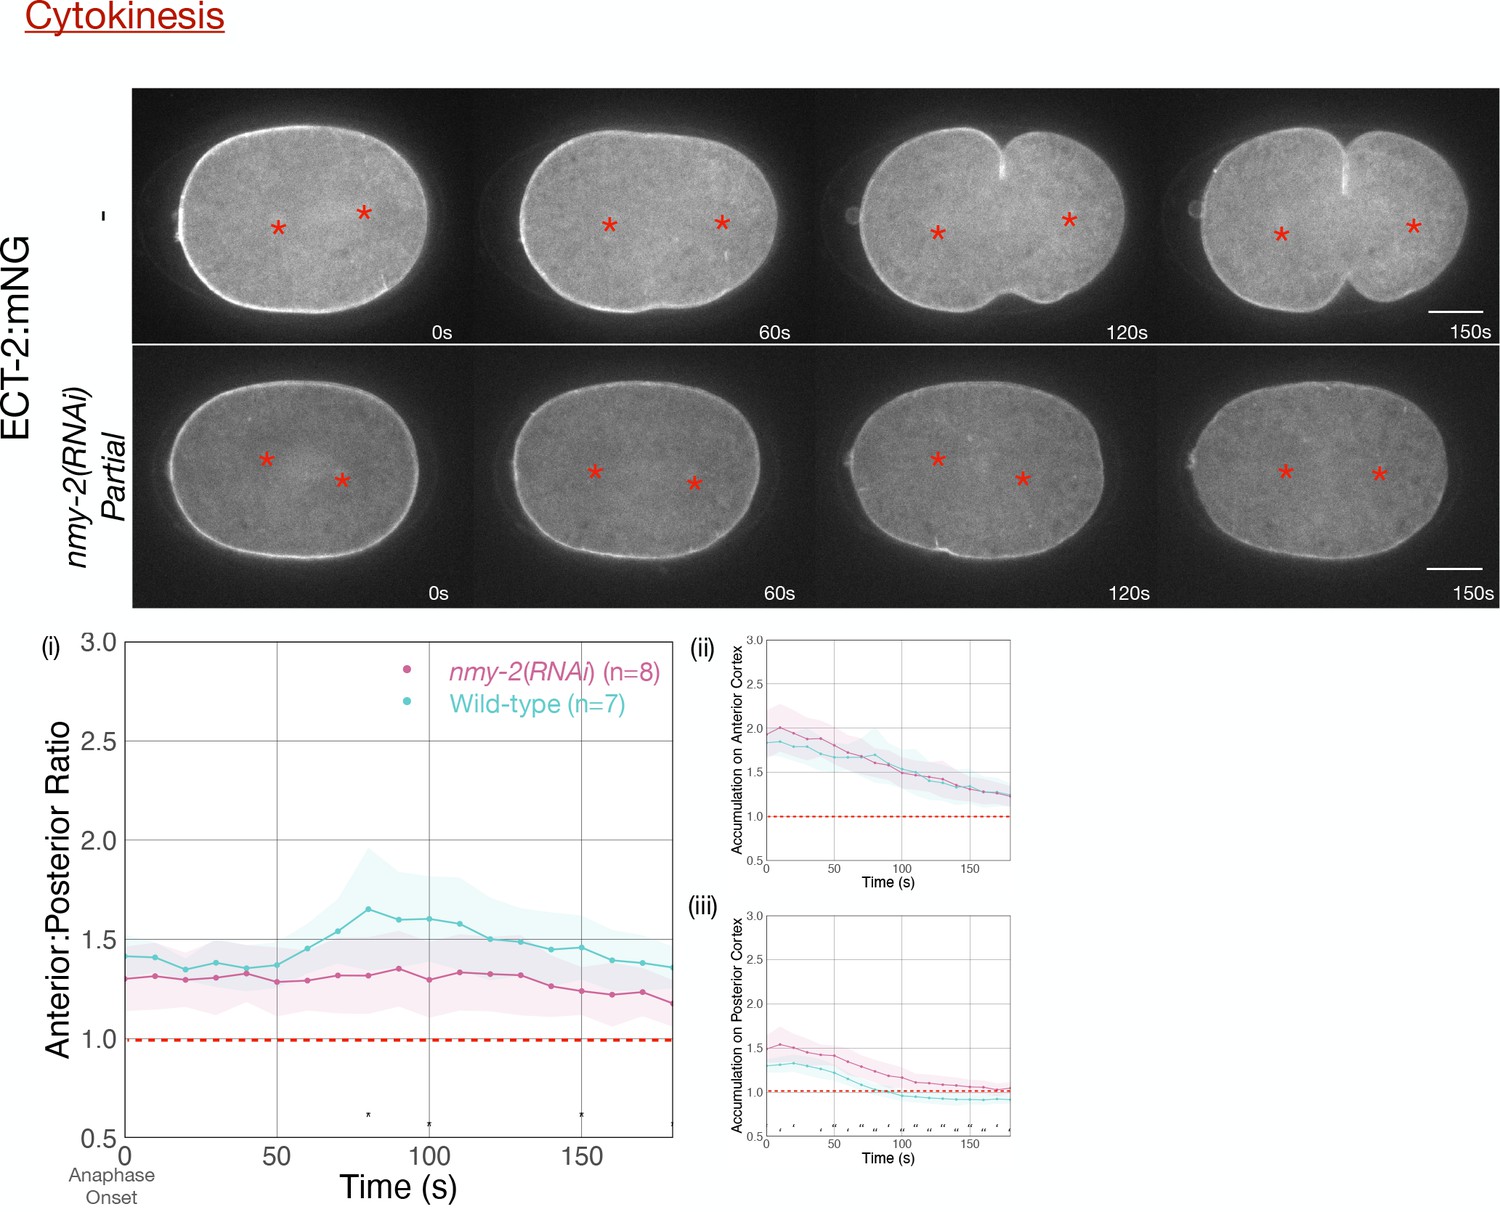
Asymmetric ECT-2 accumulation is reduced in embryos partially depleted of NMY-2.
Red asterisks label the approximate locations of the asters. Embryos that failed to furrow during pseudocleavage, but which furrowed during cytokinesis were included in the analysis. Graphs measure ECT-2 accumulation relative to average cytoplasm intensity. Source data is available (Figure 3—figure supplement 1—source data 1).
-
Figure 3—figure supplement 1—source data 1
The source data is as described in legend to Figure 1—source data 1.
- https://cdn.elifesciences.org/articles/83992/elife-83992-fig3-figsupp1-data1-v2.zip
Figure 3—figure supplement 2
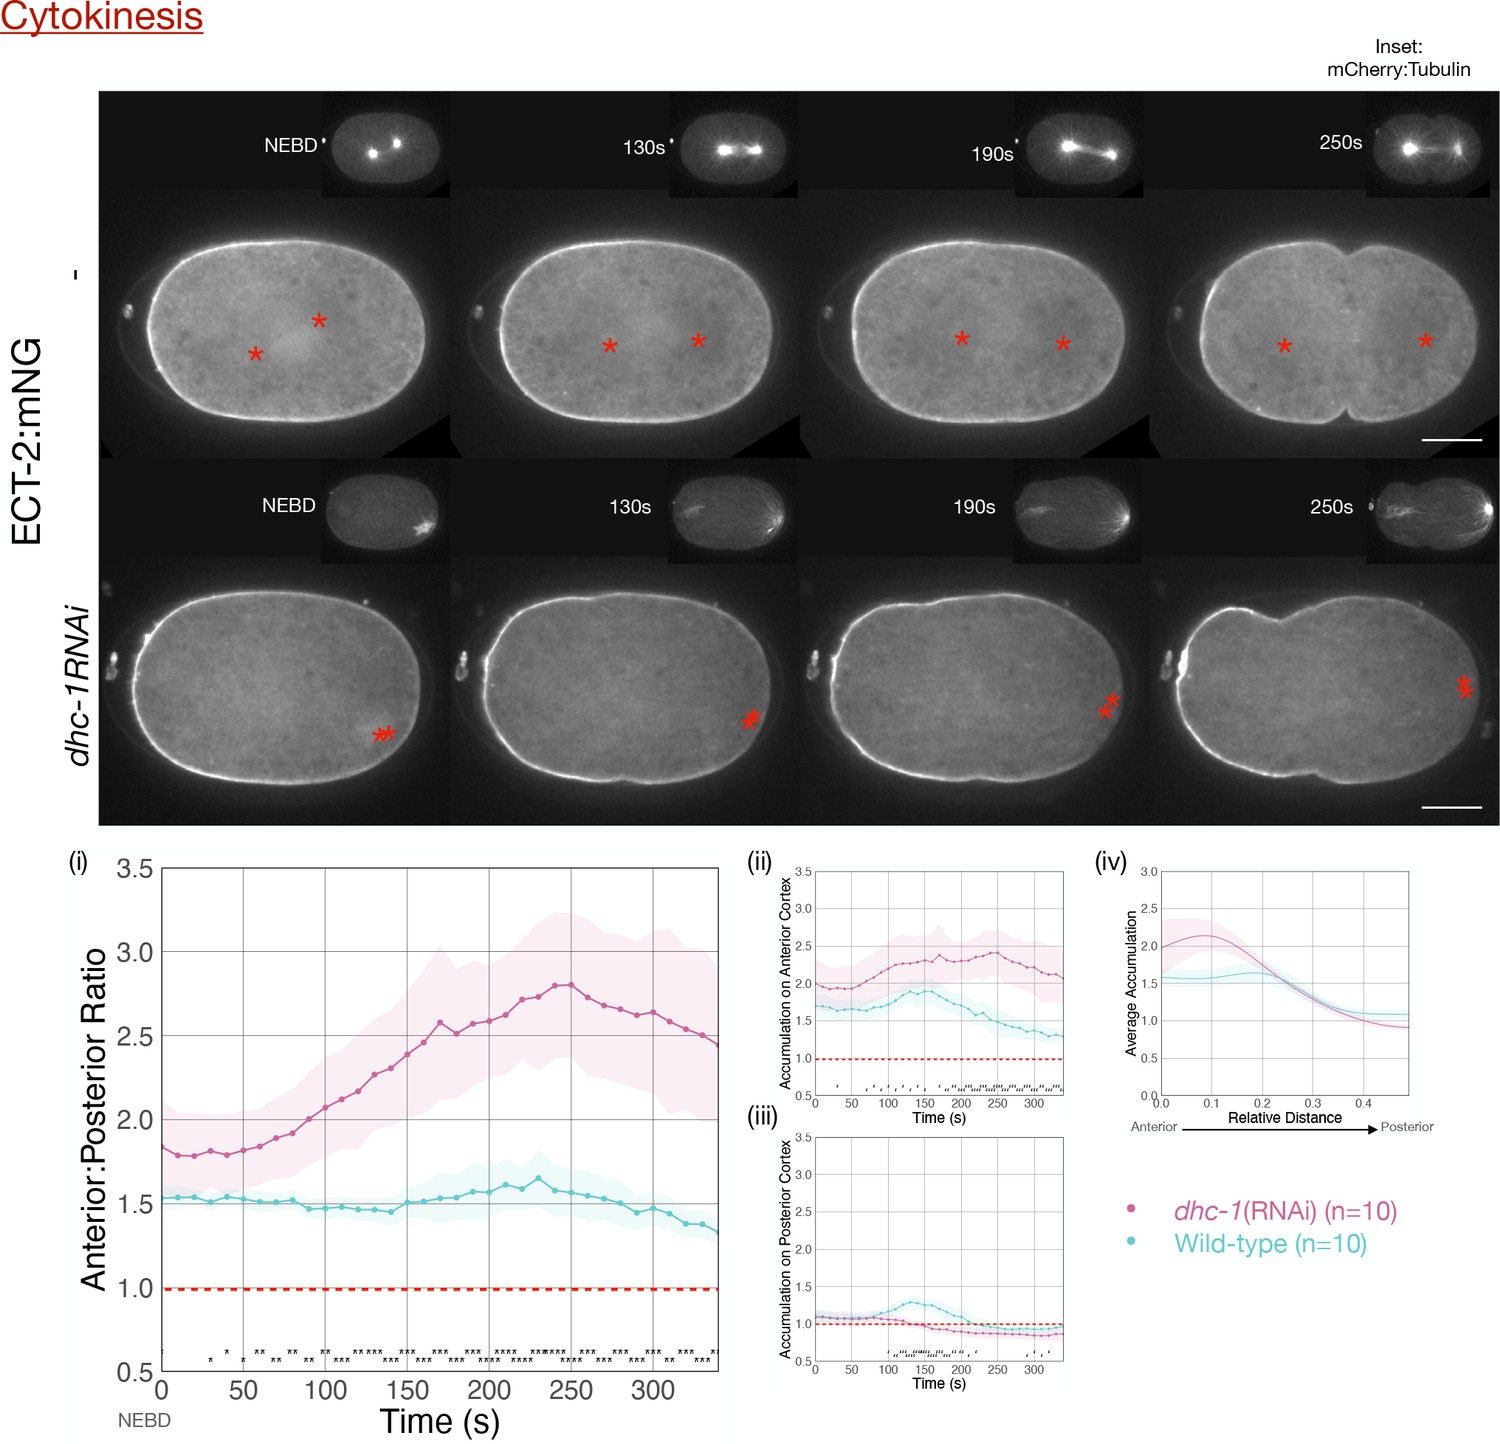
ECT-2 asymmetry does not require dynein heavy chain function.
Images from a time-lapse series show the distribution of ECT-2:mNG in either wild-type or embryos depleted of dynein heavy chain, DHC-1, which results in a collapsed and posteriorly localized spindle (insets depict mCherry:Tubulin). Times shown are relative to NEBD. Quantitation of the accumulation of ECT-2:mNG normalized to cytoplasmic levels. Source data is available (Figure 3—figure supplement 2—source data 1).
-
Figure 3—figure supplement 2—source data 1
The source data is as described in legend to Figure 1—source data 1.
- https://cdn.elifesciences.org/articles/83992/elife-83992-fig3-figsupp2-data1-v2.zip
Figure 3—figure supplement 3
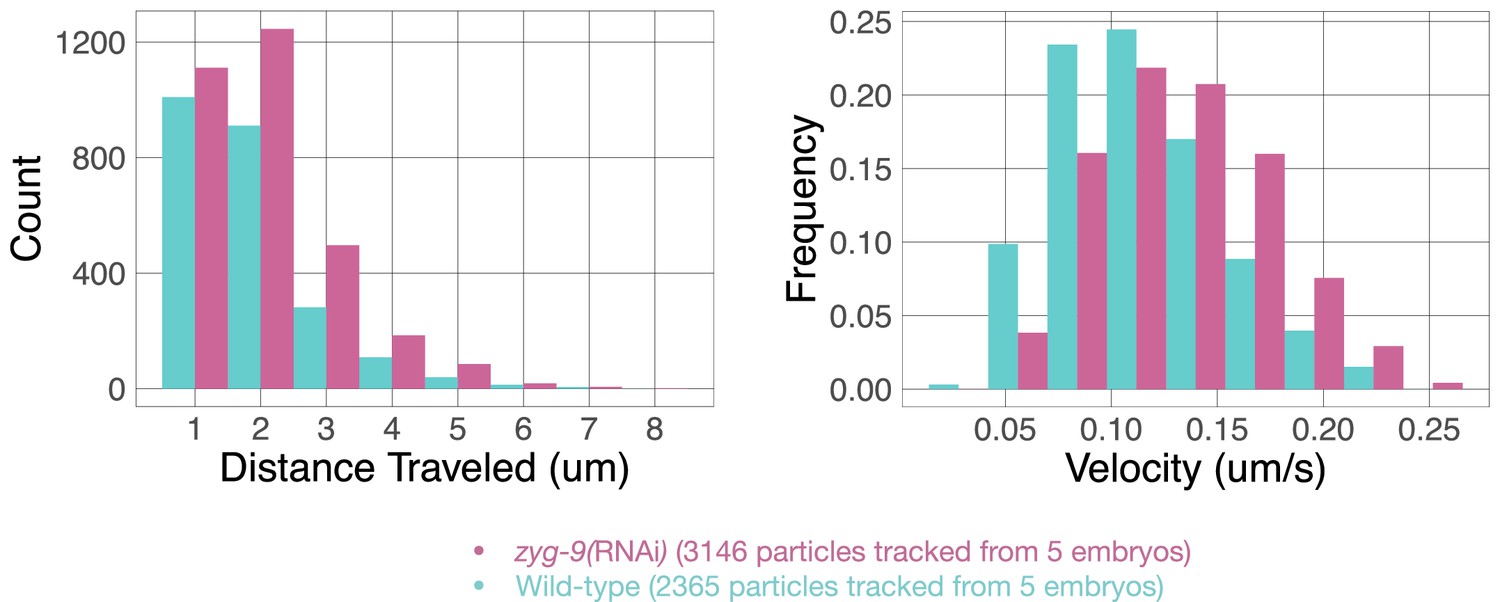
NMY-2:GFP particles were tracked post anaphase onset in wild-type and ZYG-9-depleted embryos using TrackMate in Fiji.
Particles that travel >1 µm were tracked and their velocities and distances traveled were recorded, binned, and plotted in histograms. Source data is available (Figure 3—figure supplement 3—source data 1).
-
Figure 3—figure supplement 3—source data 1
This source data table contains the velocities and distance traveled of each myosin particle tracked.
- https://cdn.elifesciences.org/articles/83992/elife-83992-fig3-figsupp3-data1-v2.zip
Figure 3—figure supplement 4
Fluorescence recovery after photobleaching (FRAP) recovery of the anterior and posterior furrows in an ECT-2:mNG zyg-9(RNAi) embryo.
Shown is an image of an embryo taken after FRAP was completed. A region of the anterior furrow was bleached and a time lapse of the recovery was taken followed by a region of the posterior furrow was bleached and another time lapse was taken to document the recovery. The graph shows fitted curves the recoveries of individual embryos as well as the average fitted curve in bold. The fit curves reflect the equation y=a*(1-exp(-b*x)) where the averages of a and b acquired from a set of anterior and posterior furrows (n=7 and 4 embryos, respectively). Source data is available (Figure 3—figure supplement 4—source data 1).
-
Figure 3—figure supplement 4—source data 1
This source data table includes the individual and average a and b coefficients used to plot the zyg-9(RNAi) fluorescence recovery after photobleaching (FRAP) data.
- https://cdn.elifesciences.org/articles/83992/elife-83992-fig3-figsupp4-data1-v2.zip
Figure 4 with 2 supplements
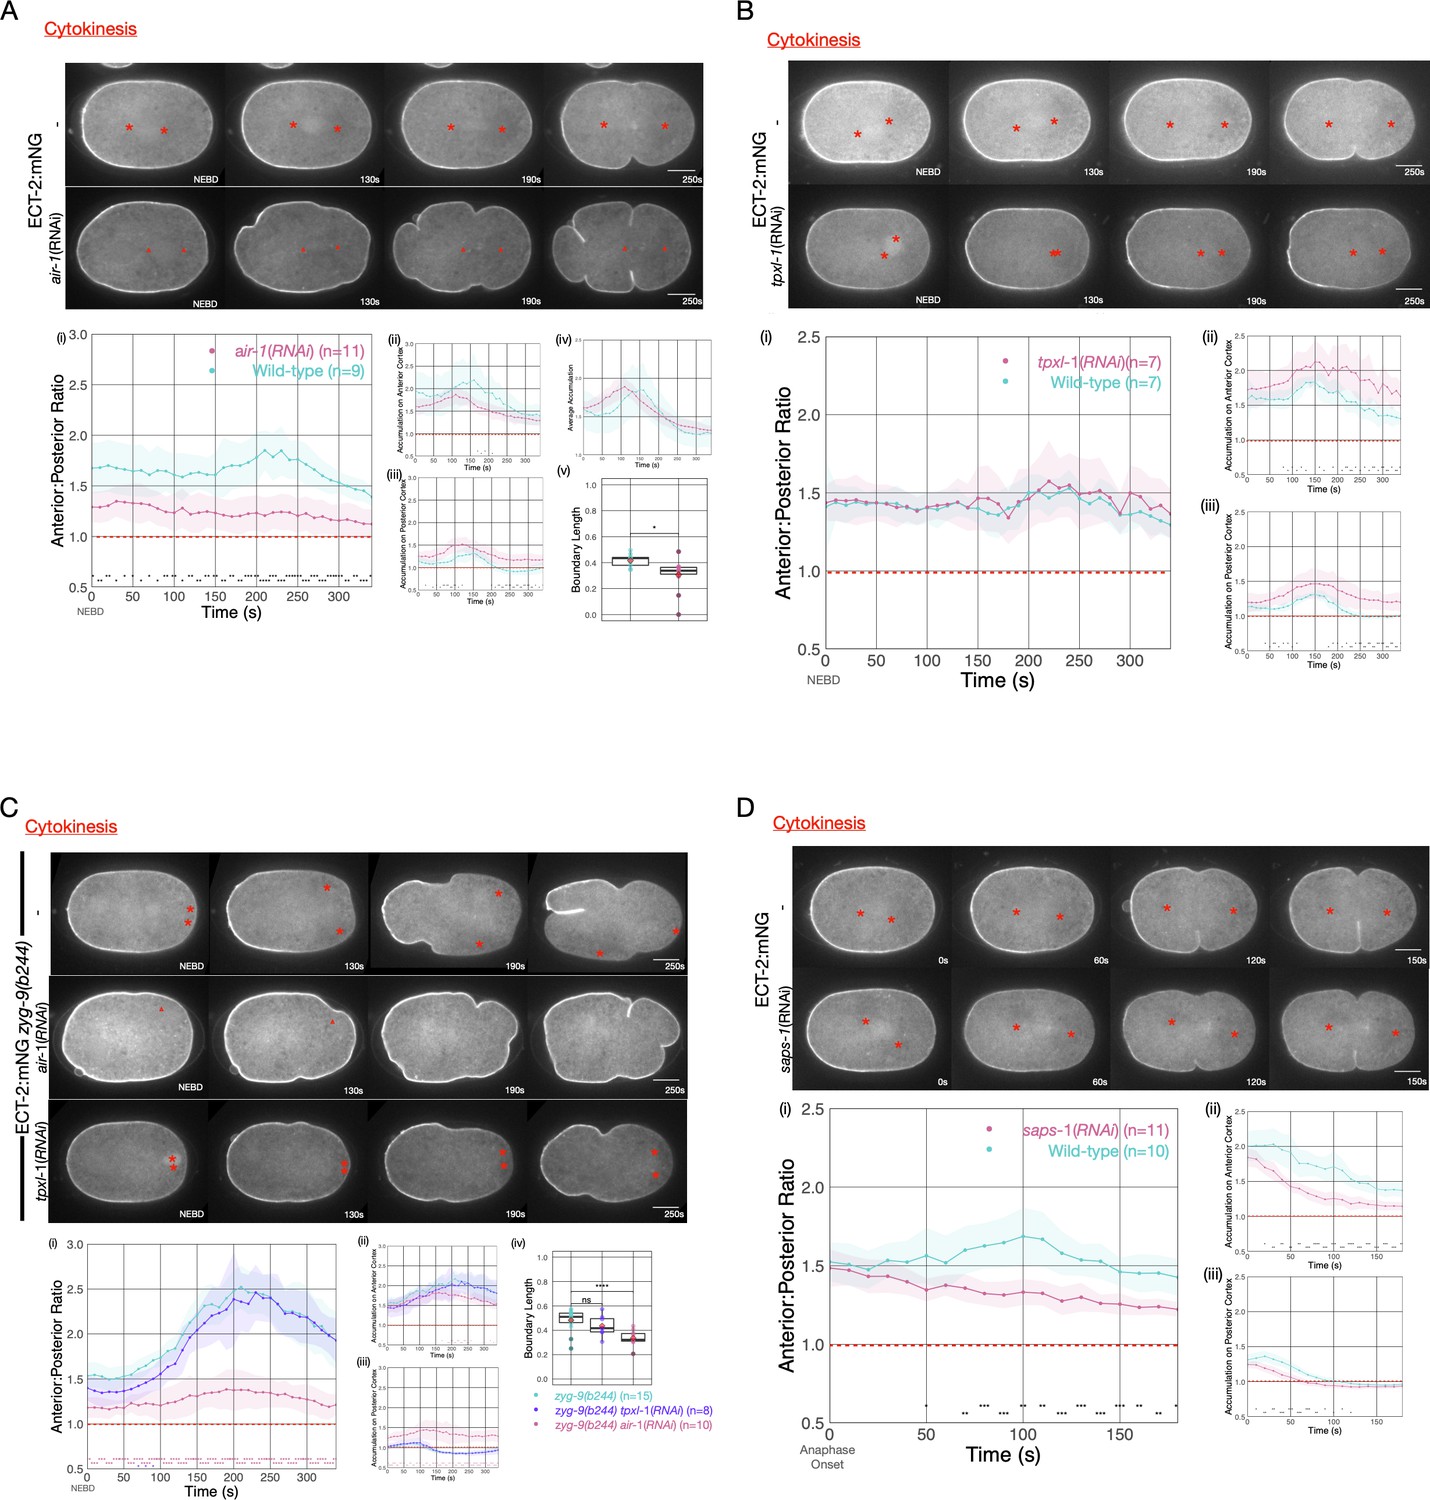
Asymmetric ECT-2 accumulation requires AIR-1.
(A) AIR-1 promotes asymmetric cortical accumulation of ECT-2. Images from a time-lapse series show the localization of endogenously tagged ECT-2 during cytokinesis in either wild-type or embryos depleted of Aurora A kinase, AIR-1, by RNAi. The red asterisks mark the approximate location of the asters while the red triangles mark the center of the unorganized asters. Quantitation of the accumulation of cortical ECT-2:mNG. Note that NEBD is delayed in AIR-1-depleted embryos resulting in contractility at an earlier time point (Hachet et al., 2007; Portier et al., 2007). Source data is available (Figure 4—source data 1). (B) TPXL-1 contributes to inhibition of ECT-2 accumulation. Images from a time-lapse series show the accumulation of ECT-2:mNG in either a wild-type or tpxl-1(RNAi) embryo. Graphs quantify the cortical accumulation of ECT-2 relative to cytoplasm. Source data is available (Figure 4—source data 1). (C) AIR-1, but not TPXL-1, is required for inhibition of ECT-2 accumulation. ECT-2 was imaged in a zyg-9(b244) background in control embryos or embryos depleted of AIR-1 or TPXL-1. Images are shown from a time-lapse acquisition of a representative embryo with NEBD set as time 0. The graphs depict ECT-2 accumulation relative to the cytoplasm and the box plot quantifies the boundary length of ECT-2 inhibition. Note that NEBD is delayed in AIR-1-depleted embryos resulting in contractility at an earlier time point. Source data is available (Figure 4—source data 1). (D) ECT-2 cortical accumulation is reduced when AIR-1 activity is increased by saps-1(RNAi). Images from a time-lapse series show the accumulation of ECT-2:mNG in either a wild-type or saps-1(RNAi) embryo with anaphase onset as time 0. Quantitation shows ECT-2 accumulation over time. Source data is available (Figure 4—source data 1).
-
Figure 4—source data 1
The source data is as described in legend to Figure 1—source data 1.
- https://cdn.elifesciences.org/articles/83992/elife-83992-fig4-data1-v2.zip
Figure 4—figure supplement 1
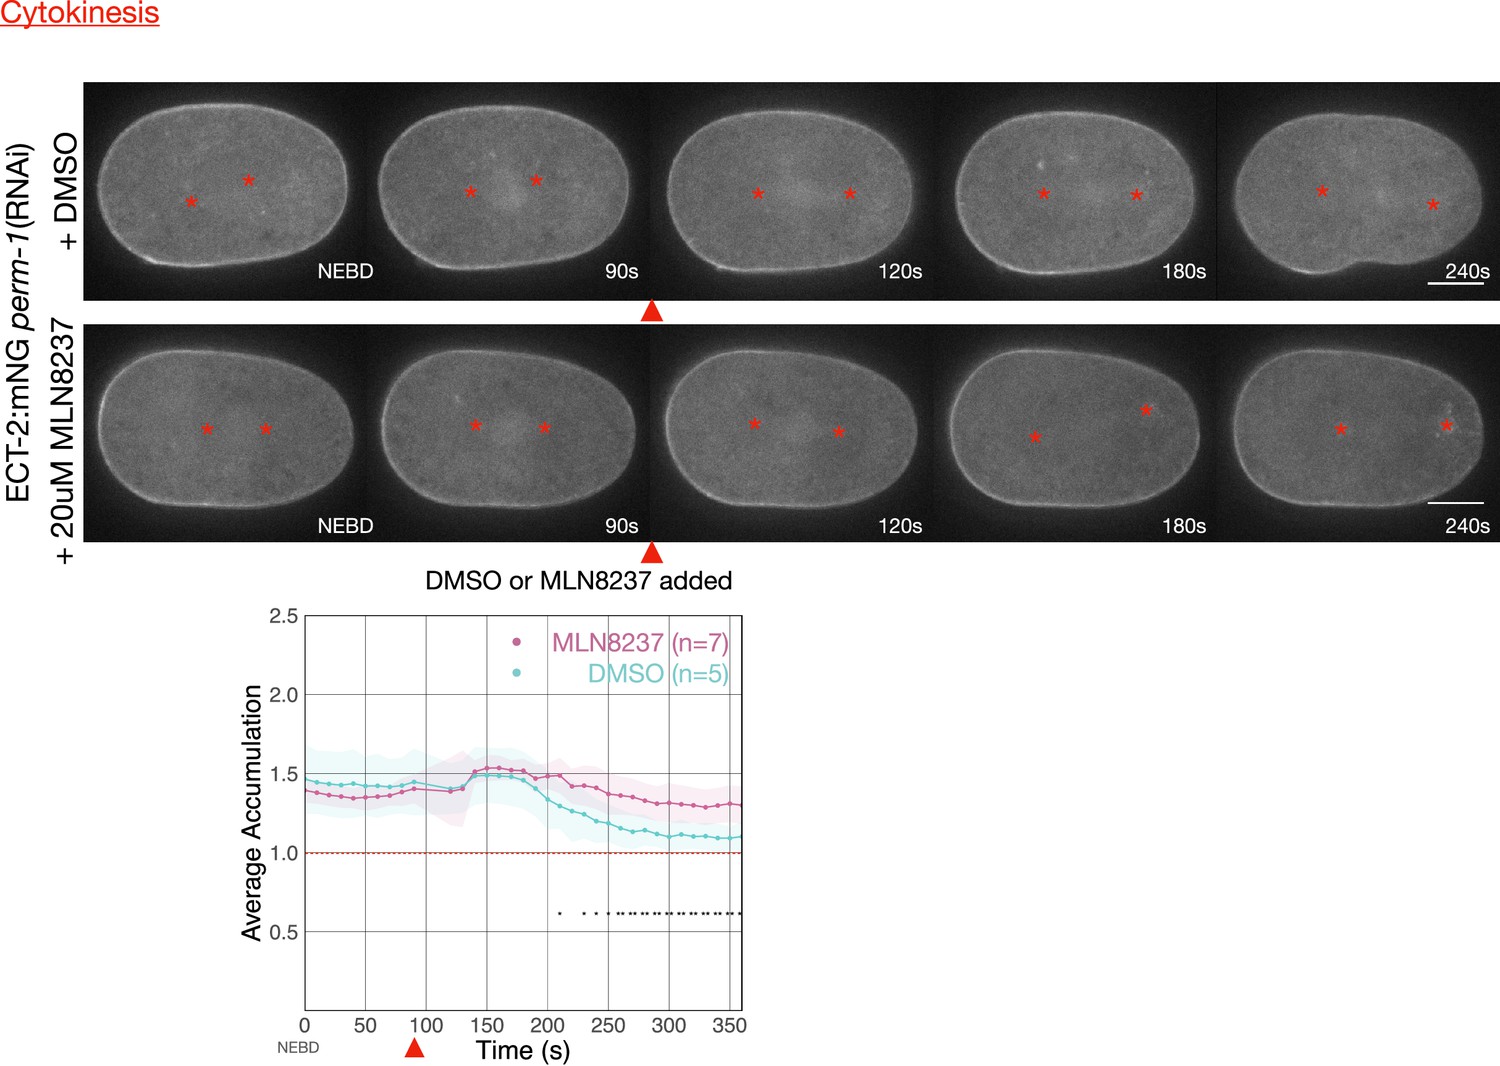
Addition of the AIR-1 inhibitor, MLN8237, causes an acute increase in cortical levels of ECT-2:mNG.
Time series were taken of embryos depleted of PERM-1. At about 90 s post NEBD, either DMSO or 50 µM MLN8237 in embryonic medium was flowed into the imaging chamber. Graphs show total cortical ECT-2 accumulation over time. Source data is available (Figure 4—figure supplement 1—source data 1).
-
Figure 4—figure supplement 1—source data 1
The source data is as described in legend to Figure 1—source data 1.
- https://cdn.elifesciences.org/articles/83992/elife-83992-fig4-figsupp1-data1-v2.zip
Figure 4—figure supplement 2
Cortical asymmetry of ECT-2 is lost in air-1 + par-2(RNAi) embryos.
ECT-2:mNG embryos were imaged under the following conditions: L4440 (empty vector), par-2(RNAi) + L4440, air-1(RNAi) + L4440, and par-2 + air-1(L4440). Images are shown from time-lapse acquisitions of representative embryos with NEBD set as time 0. The graphs depict ECT-2 accumulation relative to the cytoplasm. Note that the L4440 and par-2(RNAi) + L4440 data and that shown in Figure 2—figure supplement 1 are derived from the same set of embryos. Source data is available (Figure 4—figure supplement 2—source data 1).
-
Figure 4—figure supplement 2—source data 1
The source data is as described in legend to Figure 1—source data 1.
- https://cdn.elifesciences.org/articles/83992/elife-83992-fig4-figsupp2-data1-v2.zip
Figure 5 with 2 supplements
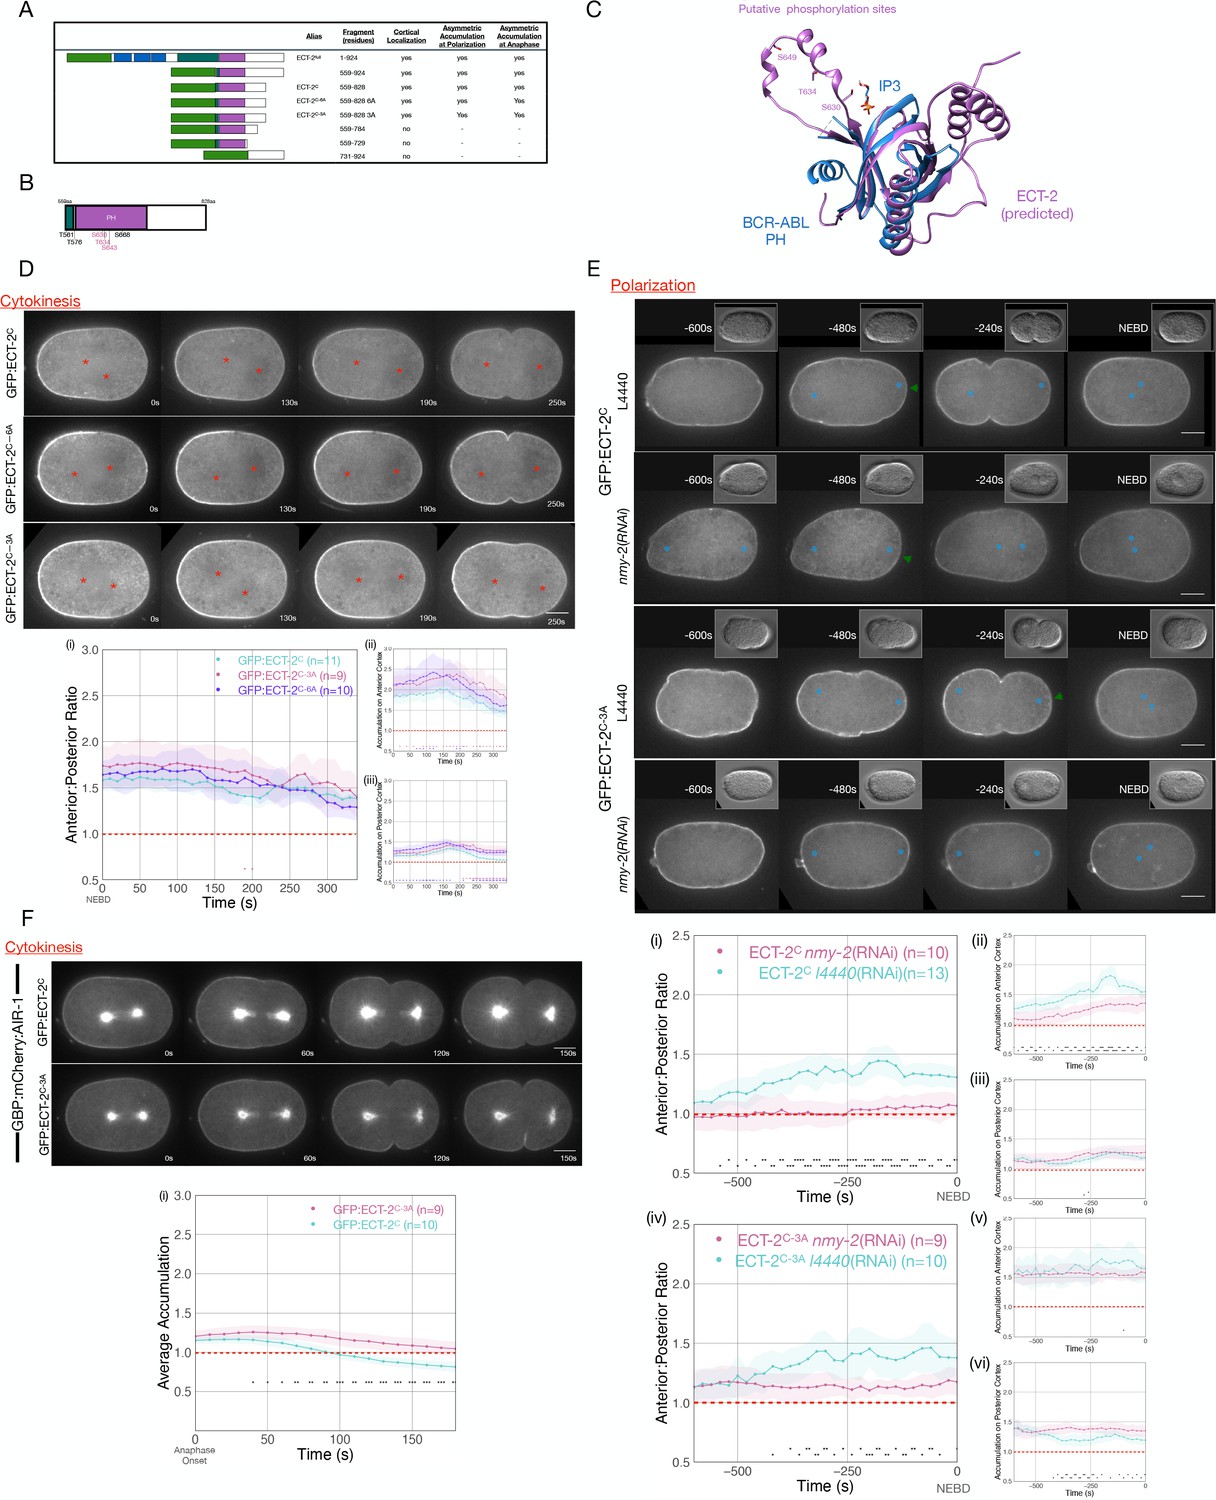
Phosphorylation of ECT-2 regulates its asymmetric cortical accumulation.
(A) Schematic of GFP:ECT-2 truncations tested in this study and summary of their localization patterns. (B) Schematic of ECT-2C with locations of mutated residues. Residues in the loop in the PH domain are colored purple. (C) Alpha Fold prediction of the ECT-2 PH domain prediction (AF-Q9U364-F1) aligned with the crystal structure of the PH domain of Bcr-Abl (PDB 5OC7). (D) Stills from representative time series of GFP:ECT-2C either wild-type, 3A, or 6A mutants and the quantitation of accumulation of each transgene with NEBD as time 0. Source data is available (Figure 5—source data 1). (E) Asymmetric accumulation of GFP:ECT-2C-3A is lost when cortical flows are reduced. Images shown are from time-lapse acquisitions of either control or NMY-2-depleted embryos from transgenic lines expressing either GFP:ECT-2C or GFP:ECT-2C-3A. Graphs (i) – (iii) quantify GFP:ECT-2C wild-type accumulation over time and graphs (iv)–(vi) quantify GFP:ECT-2C-3A accumulation over time, both with t=0 set as NEBD. Green arrowheads depict local reduction in ECT-2 as the centrosome is opposed to the posterior cortex. Source data is available (Figure 5—source data 1). (F) GFP:ECT-2C-3A is more refractory than GFP:ECT-2C-WT to GBP:mCherry:AIR-1 during cytokinesis. Panels show stills from time series of embryos co-expressing either GFP:ECT-2C-WT or GFP:ECT-2C-3A with GBP:mCherry:AIR-1. The graphs reflect GFP:ECT-2C cortical accumulation over time starting at anaphase onset. ECT-2 accumulation on the spindle was excluded from measurements. Source data is available (Figure 5—source data 1).
-
Figure 5—source data 1
The source data is as described in legend to Figure 1—source data 1.
- https://cdn.elifesciences.org/articles/83992/elife-83992-fig5-data1-v2.zip
Figure 5—figure supplement 1
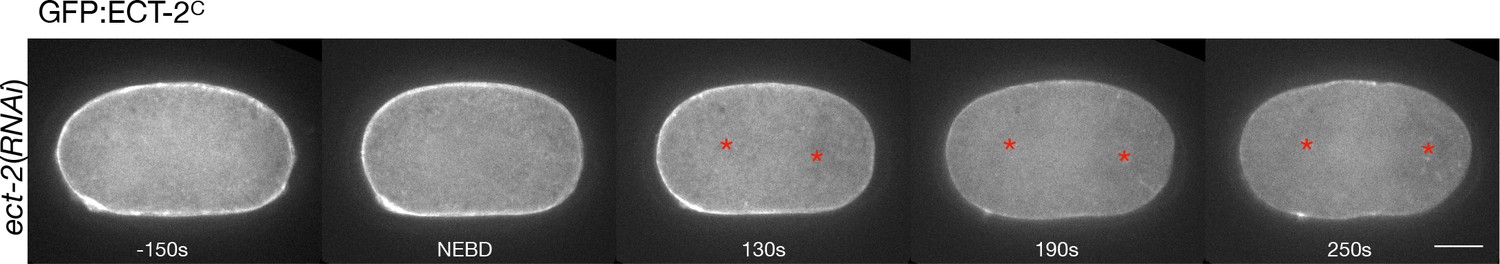
Endogenous ECT-2 was depleted in a GFP:ECT-2C expressing embryo.
Stills at the indicated time points are shown from a representative embryo. Red asterisks on the stills are approximate locations of the the asters, which were identified by Nomarski images taken concurrently with the GFP images.
Figure 5—figure supplement 2
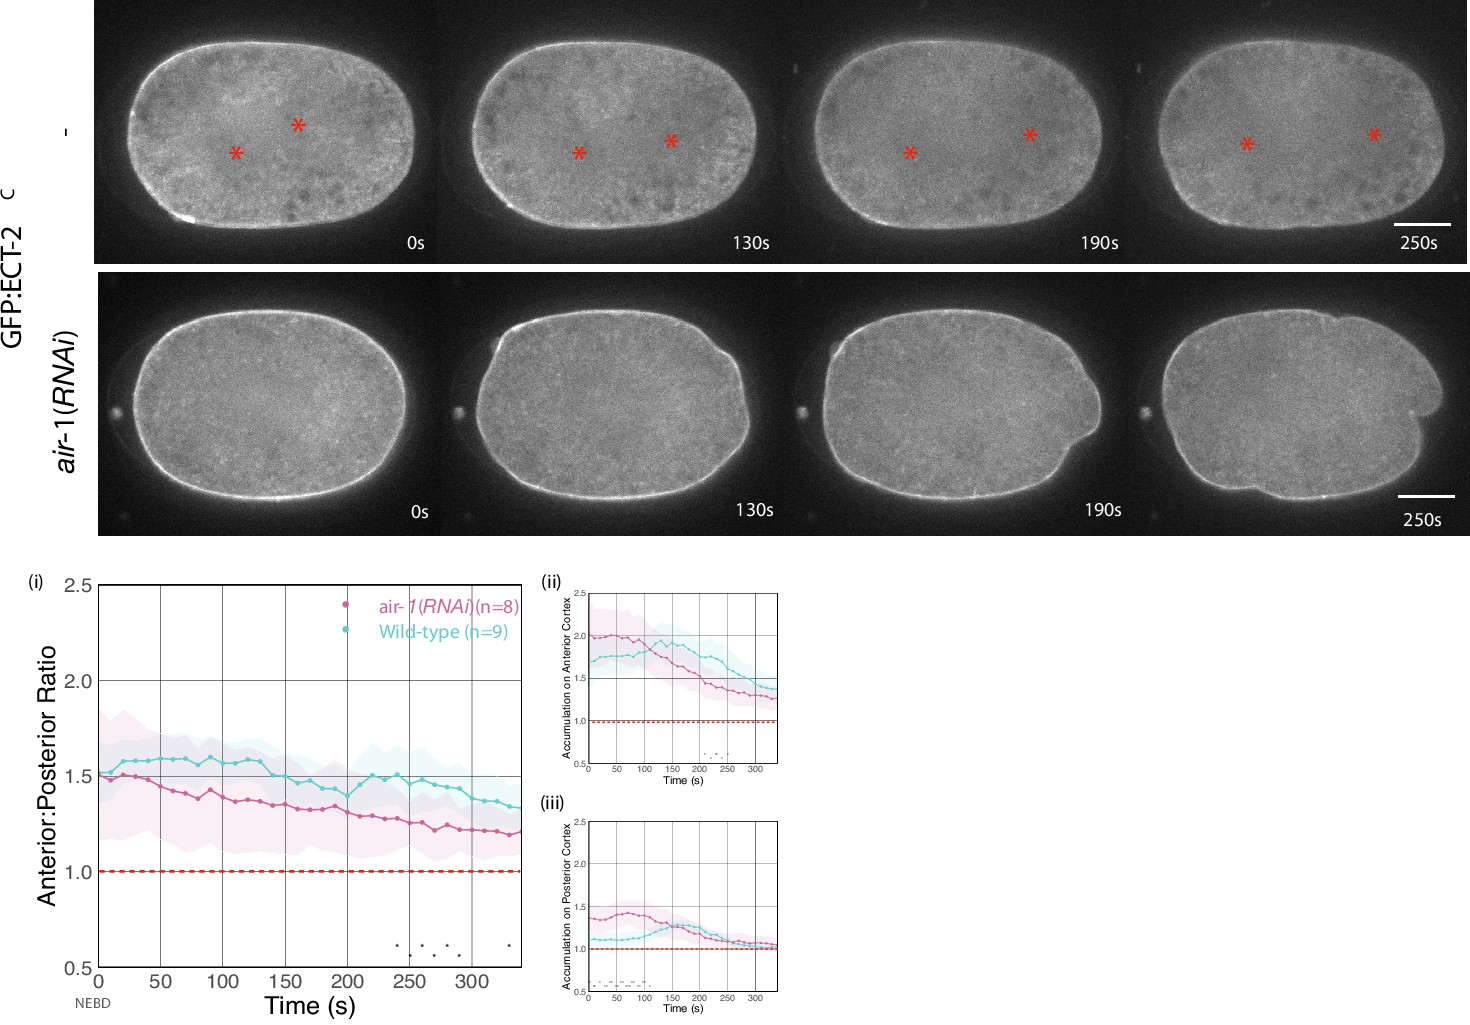
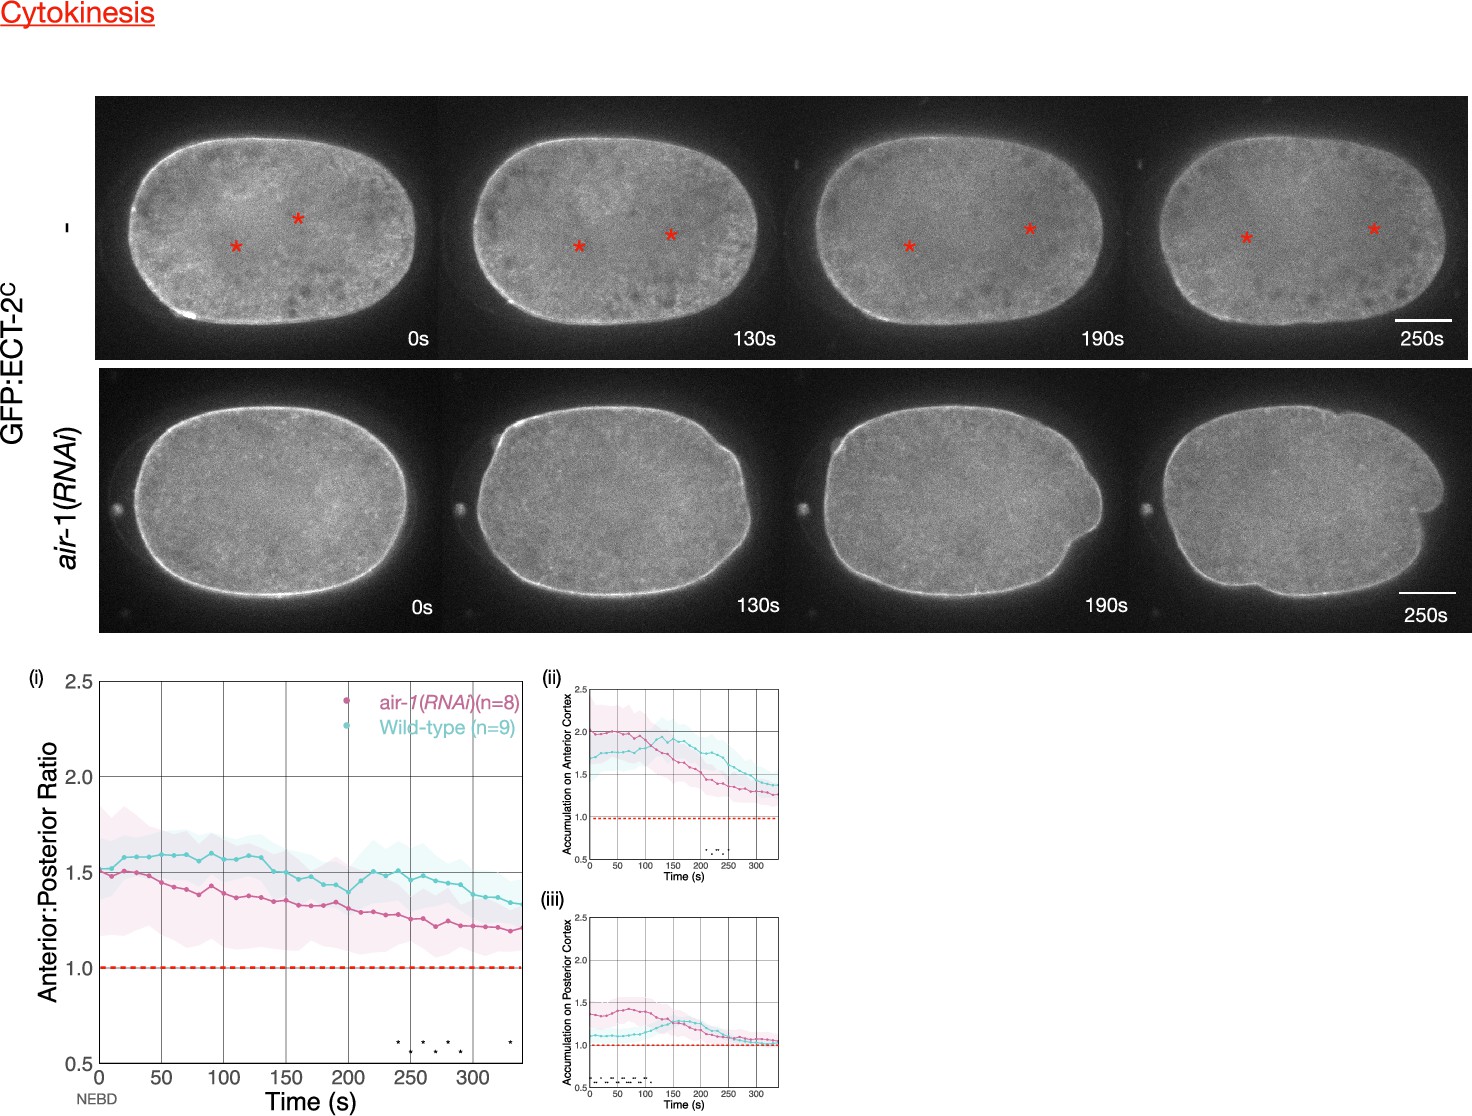
AIR-1 inhibits cortical accumulation of GFP:ECT-2C.
GFP:ECT-2C was imaged as a time series. Shown are still images of GFP:ECT-2C from either a wild-type or AIR-1-depleted embryo. Graphs depict GFP:ECT-2C accumulation over time starting at NEBD. Note that NEBD is delayed in AIR-1-depleted embryos resulting in contractility at an earlier time point. Source data is available (Figure 5—figure supplement 2—source data 1).
-
Figure 5—figure supplement 2—source data 1
The source data is as described in legend to Figure 1—source data 1.
- https://cdn.elifesciences.org/articles/83992/elife-83992-fig5-figsupp2-data1-v2.zip
Figure 6
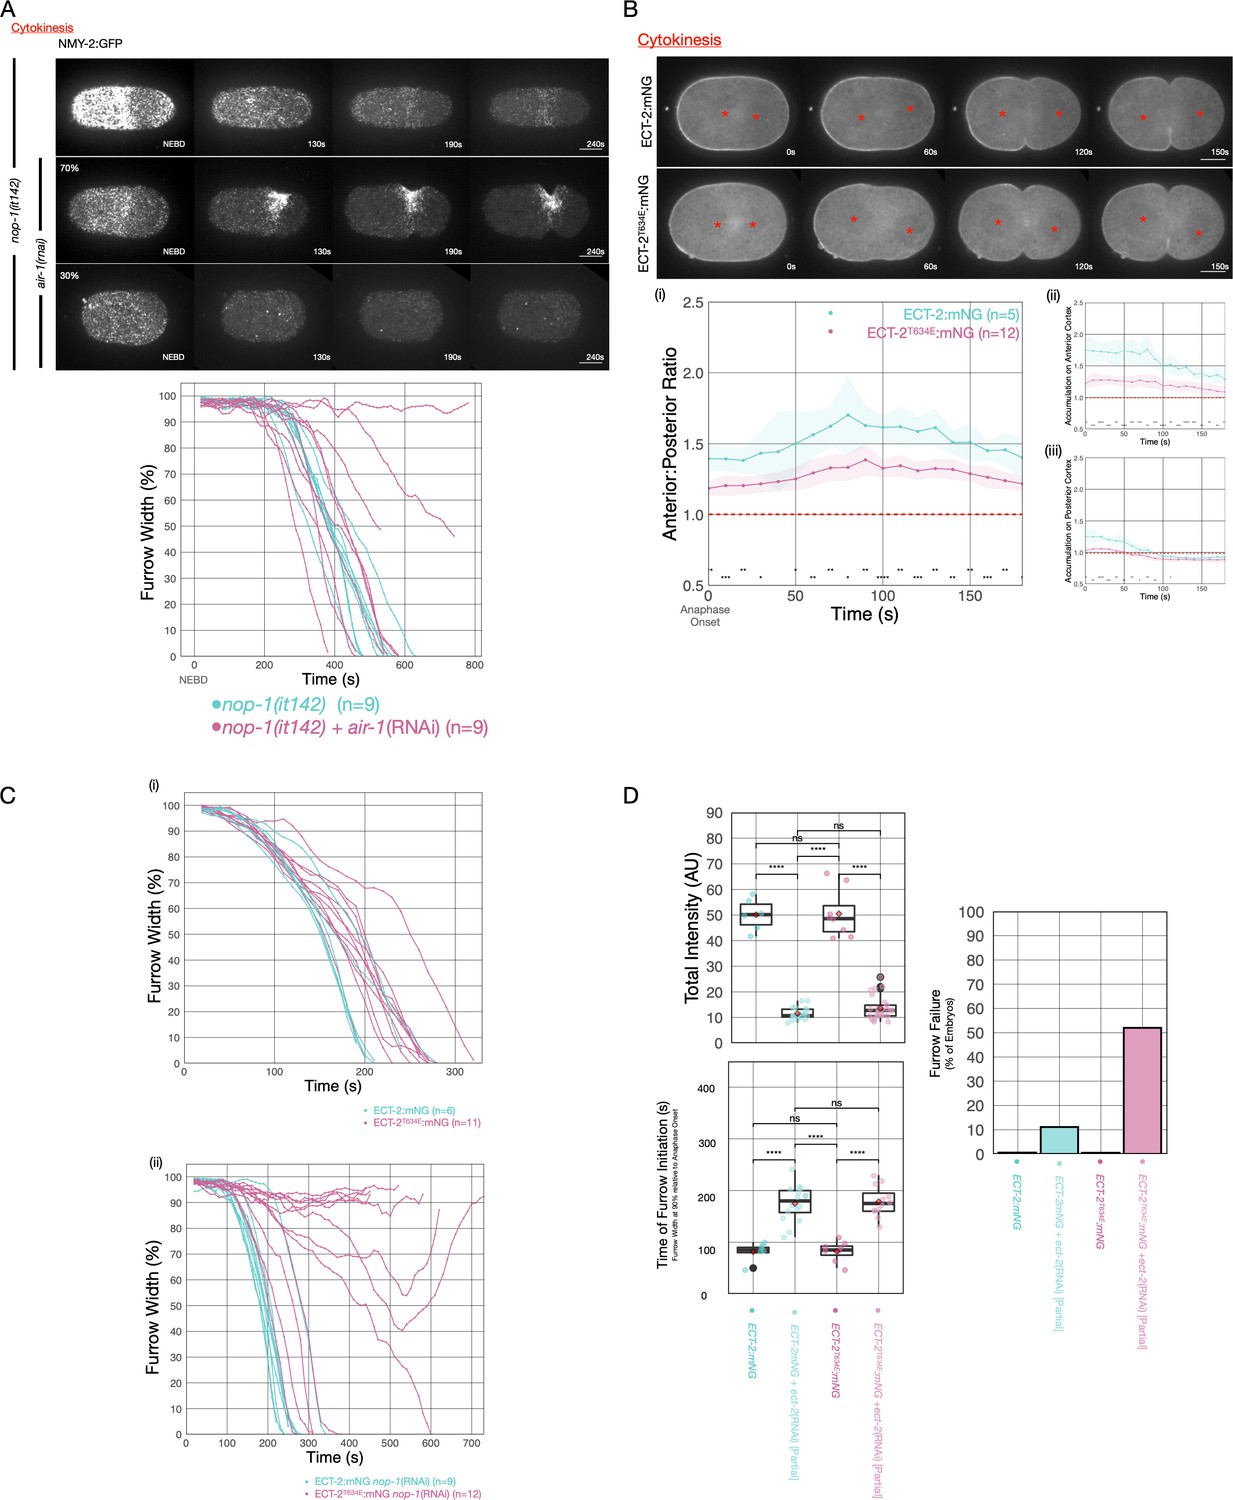
AIR-1 is involved in centralspindlin-dependent furrowing.
(A) Furrowing is variable in nop-1(it142); air-1(RNAi) embryos. Shown are cortical maximum intensity projections 6 μm deep of NMY-2:GFP; nop-1(it142) embryos with or without depletion of AIR-1. Furrow width as a function of time starting at NEBD in individual embryos is shown graphically using a rolling average period of three time points. Note that NEBD is delayed in AIR-1-depleted embryos resulting in contractility at an earlier time point. Source data is available (Figure 6—source data 1). (B) ECT-2T634E exhibits reduced cortical accumulation. Embryo images from time series of ECT-2:mNG or ECT-2T634E:mNG expressing embryos in strains co-expressing mCherry:Tubulin. (i–iii) Graphs represent ECT-2 accumulation as a function of time with anaphase onset as time 0 s. Source data is available (Figure 6—source data 1). (C) ECT-2T634E slows furrow ingression and affects central spindle-dependent furrowing. (i) Furrow kinetics of ECT-2:mNG or ECT-2T634E:mNG in strains co-expressing mCherry:Tubulin. Graphs represent the extent of furrow ingression of individual embryos as a function of time starting at anaphase onset using a rolling average of three time points. (ii) Furrow kinetics of ECT-2:mNG or ECT-2T634E:mNG in strains co-expressing mCherry:Tubulin. Graphs represent the extent of furrow ingression of individual embryos as a function of time starting at anaphase onset using a rolling average of three time points. Source data is available (Figure 6—source data 1). (F) ECT-2T634E:mNG is more dosage sensitive than ECT-2:mNG. (i) Average total intensity of ECT-2 in embryos measured and graphed as box whisker plots for control embryos or embryos partially depleted of ECT-2. Furrow kinetics of control or partially depleted ECT-2 embryos expressing ECT-2:mNG or ECT-2T634E:mNG co-expressing NMY-2:mKate were measured and used to determine (ii) the time between anaphase onset and furrow initiation (ingression to 90% furrow width) and (iii) the fraction of embryos that failed division. All non-depleted embryos completed division. Source data is available (Figure 6—source data 1).
-
Figure 6—source data 1
This source data table contains (I) the measurements of furrow width at each time point of each embryo.
These data are plotted in Figure 6A and Figure 6Ci, ii. The progression of furrowing of individual embryos are graphed as a function of time. (II) The source data for Figure 6B is as described in legend to Figure 1—source data 1. (III) This source data contains the normalized ECT-2-mNG intensities of each embryo. Individual embryos are plotted as well as a box plot summarizing the data, and (IV) the data table containing the duration between anaphase onset and the time at which each embryo reached 10% furrow ingression (furrow width is 90% of initial width). Individual embryos are plotted as well as a box plot summarizing the data.
- https://cdn.elifesciences.org/articles/83992/elife-83992-fig6-data1-v2.zip
Figure 7
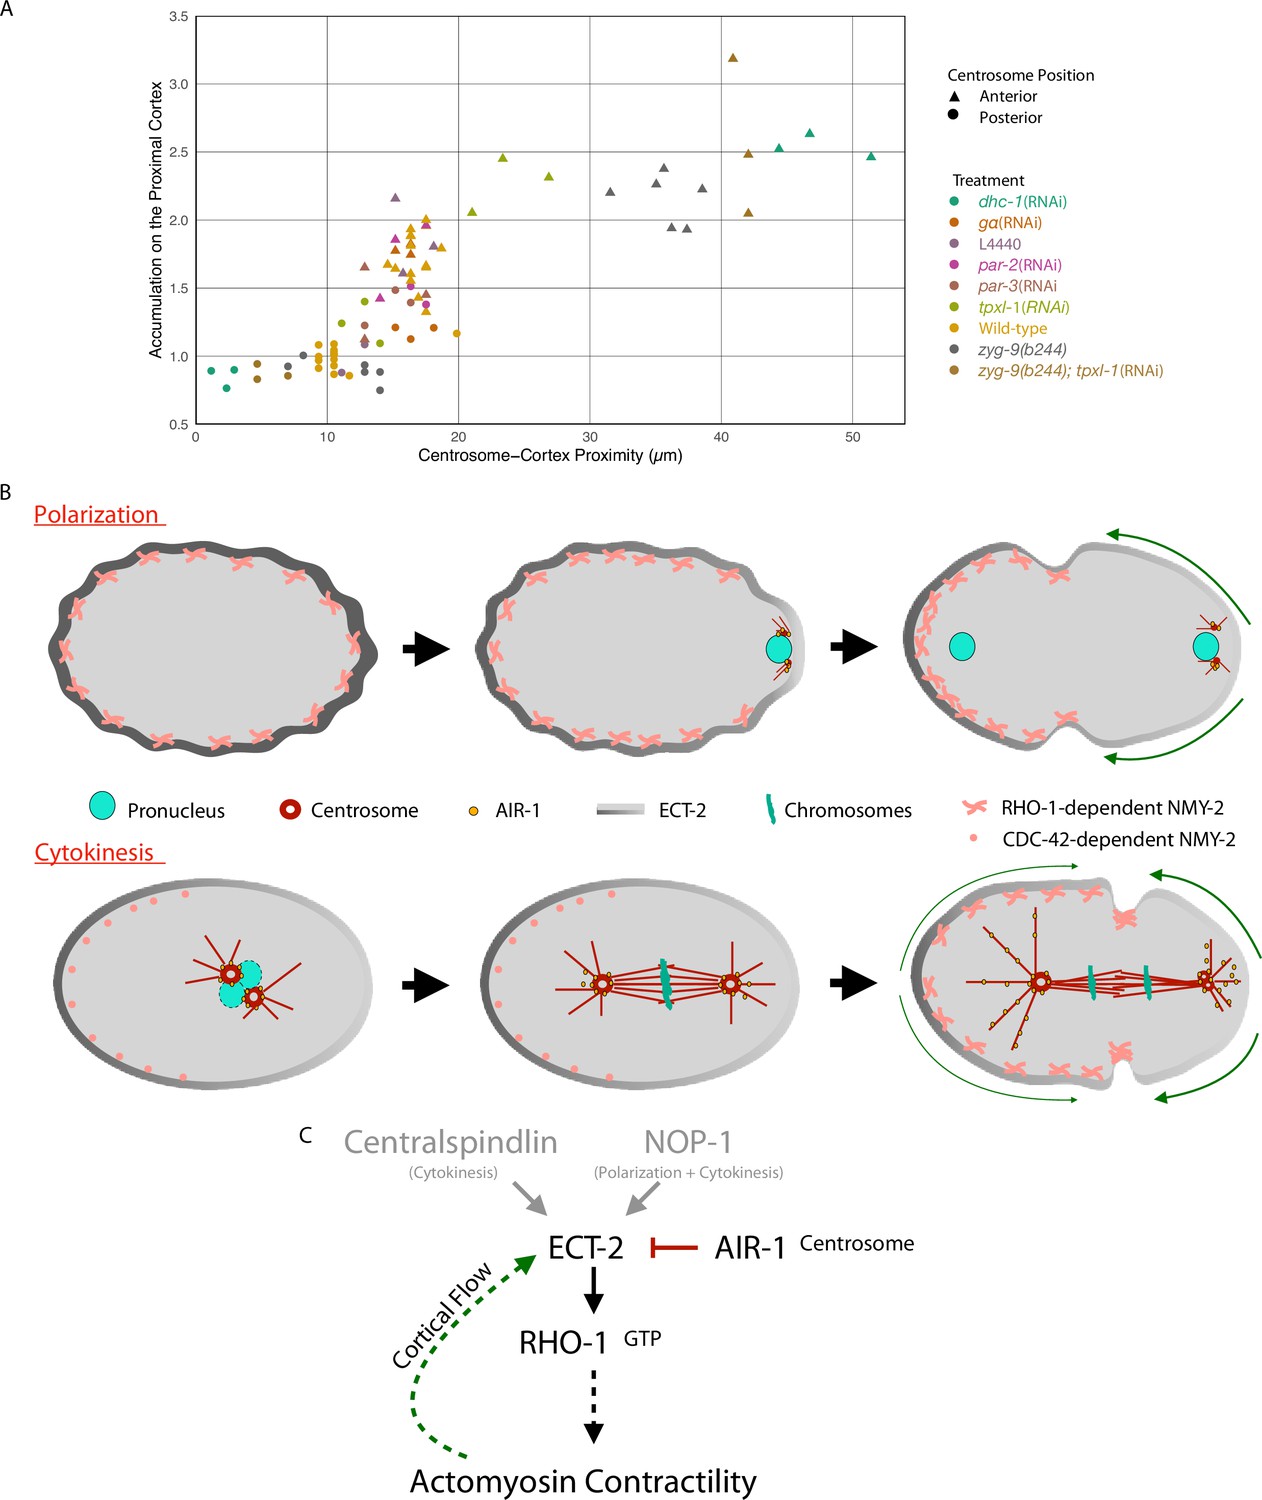
Model of local symmetry breaking of cortical ECT-2 and amplification by cortical flows.
(A) Summary graph of cortical ECT-2 accumulation at the time of maximal ECT-2 asymmetry as a function of distance between the centrosome and the proximal cortex. Centrosome-cortex distance was measured using either a mCherry:Tubulin or Nomarski image. Three embryos from each treatment listed in the legend were chosen at random. Source data is available (Figure 7—source data 1). (B) During both polarization and cytokinesis, centrosome-derived AIR-1 locally inhibits cortical ECT-2 accumulation, triggering symmetry breaking and generation of cortical flows directed away from the site of symmetry breaking. ECT-2 dynamically associates with components that undergo cortical flow, leading to its further depletion from the posterior cortex and its anterior accumulation. During polarity establishment, the centrosomes are small and closely apposed to the cortex, whereas during anaphase the centrosomes are large and accumulate significant AIR-1 that modulate cortical association of ECT-2. During polarization, the pseudocleavage furrow forms at the boundary between low and high ECT-2 and myosin levels; in cytokinesis, this site correlates with the centralspindlin-dependent furrow that correlates with the spindle midzone. (C) Proposed genetic pathway (D).
-
Figure 7—source data 1
This data lists the distance of each anterior or posterior centrosome to its respective membrane (anterior or posterior) and the amount of ECT-2 accumulation on the respective membrane.
Individual centrosomes were plotted.
- https://cdn.elifesciences.org/articles/83992/elife-83992-fig7-data1-v2.zip
Author response image 1
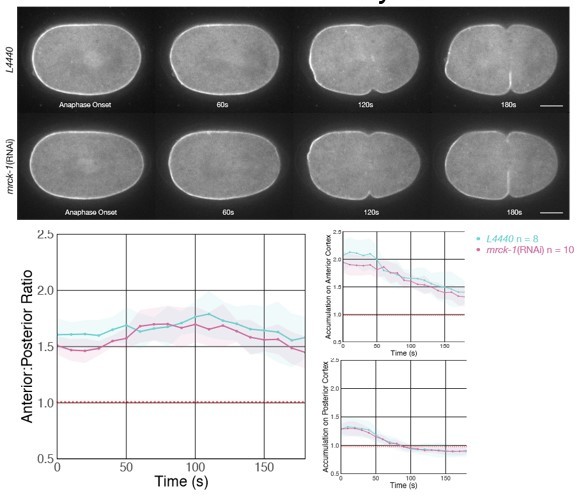
Depletion of MRCK-1 does not affect the distribution of cortical ECT-2 during anaphase.
MRCK-1 depletion was confirmed by observing the loss of the cortical cap of co-expressed NMY-2:mKate during metaphase.
Author response image 2
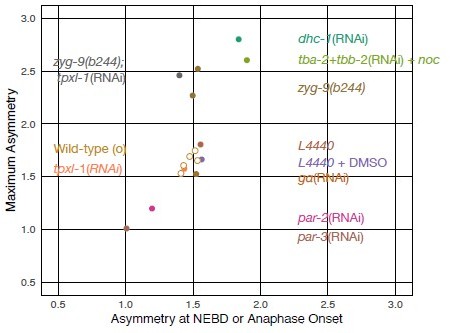
Summary figure comparing the average degree of ECT-2 asymmetry at NEBD/Anaphase Onset vs the maximal asymmetry of ECT-2 during anaphase.
These values are not correlated.
Additional files
-
Supplementary file 1
List of Caenorhabditis elegans strains used in this study.
- https://cdn.elifesciences.org/articles/83992/elife-83992-supp1-v2.zip
-
Supplementary file 2
List of plasmids used in this study.
- https://cdn.elifesciences.org/articles/83992/elife-83992-supp2-v2.zip
-
Supplementary file 3
List of oligonucleotides used in this study.
- https://cdn.elifesciences.org/articles/83992/elife-83992-supp3-v2.zip
-
MDAR checklist
- https://cdn.elifesciences.org/articles/83992/elife-83992-mdarchecklist1-v2.pdf
Download links
A two-part list of links to download the article, or parts of the article, in various formats.
Downloads (link to download the article as PDF)
Open citations (links to open the citations from this article in various online reference manager services)
Cite this article (links to download the citations from this article in formats compatible with various reference manager tools)
Aurora A and cortical flows promote polarization and cytokinesis by inducing asymmetric ECT-2 accumulation
eLife 11:e83992.
https://doi.org/10.7554/eLife.83992


