Long-range DNA end resection supports homologous recombination by checkpoint activation rather than extensive homology generation
- Program in Biological Sciences, Columbia University, United States
- Department of Microbiology & Immunology, Columbia University Irving Medical Center, United States
- Department of Genetics & Development, Columbia University Irving Medical Center, United States
Figures
Figure 1 with 3 supplements
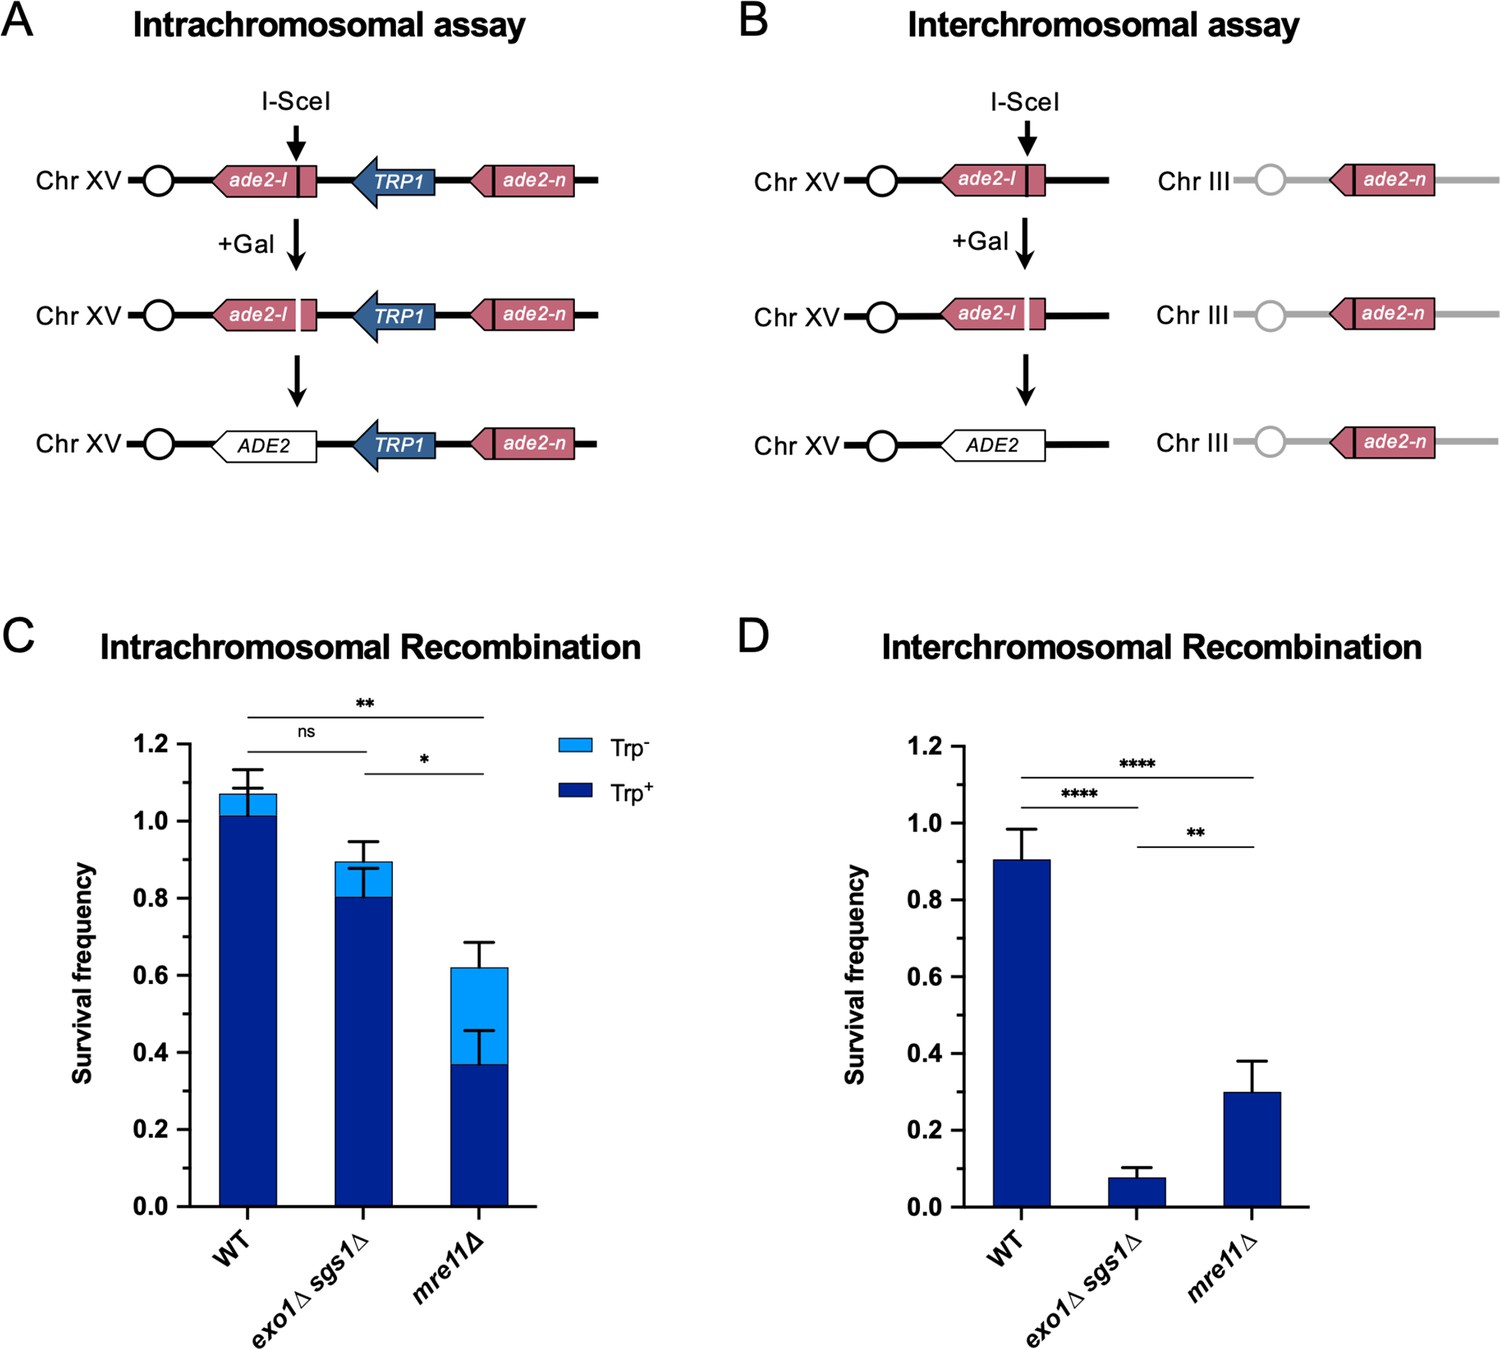
Long-range end resection is necessary for interchromosomal repair but not for intrachromosomal repair.
(A) Representation of the intrachromosomal assay. The reporter contains an ade2-I allele with an I-SceI recognition site and an ade2-n allele with a frameshift mutation oriented as direct repeats on Chr XV. The vertical black lines indicate the sites of the mutations. The galactose-inducible I-SceI endonuclease is integrated at the LYS2 locus on Chr II (not shown). After break formation, the ade2-I allele uses the ade2-n allele to restore a functional ADE2 allele, most of the time accompanied by retention of the TRP1 marker. Other outcomes are shown in Figure 1—figure supplement 1. (B) The interchromosomal assay contains the same ade2 alleles as in the intrachromosomal assay, except ade2-n is located on Chr III. Survival frequency in response to constitutive I-SceI expression for the intrachromosomal strains (C) and interchromosomal strains (D). Intrachromosomal repair products are categorized as Trp+ or Trp-. Bars represent mean values from at least 3 plating assays per genotype. Error bars represent standard deviation. Significance values are indicated by: ns- not significant, * p<0.05, ** p<0.01, *** p<0.001, **** p<0.0001 based on a two-tailed t-test. Source data are available in Figure 1—source data 1.
-
Figure 1—source data 1
This file contains all the source data for Figure 1 and related figure supplements.
- https://cdn.elifesciences.org/articles/84322/elife-84322-fig1-data1-v2.zip
Figure 1—figure supplement 1
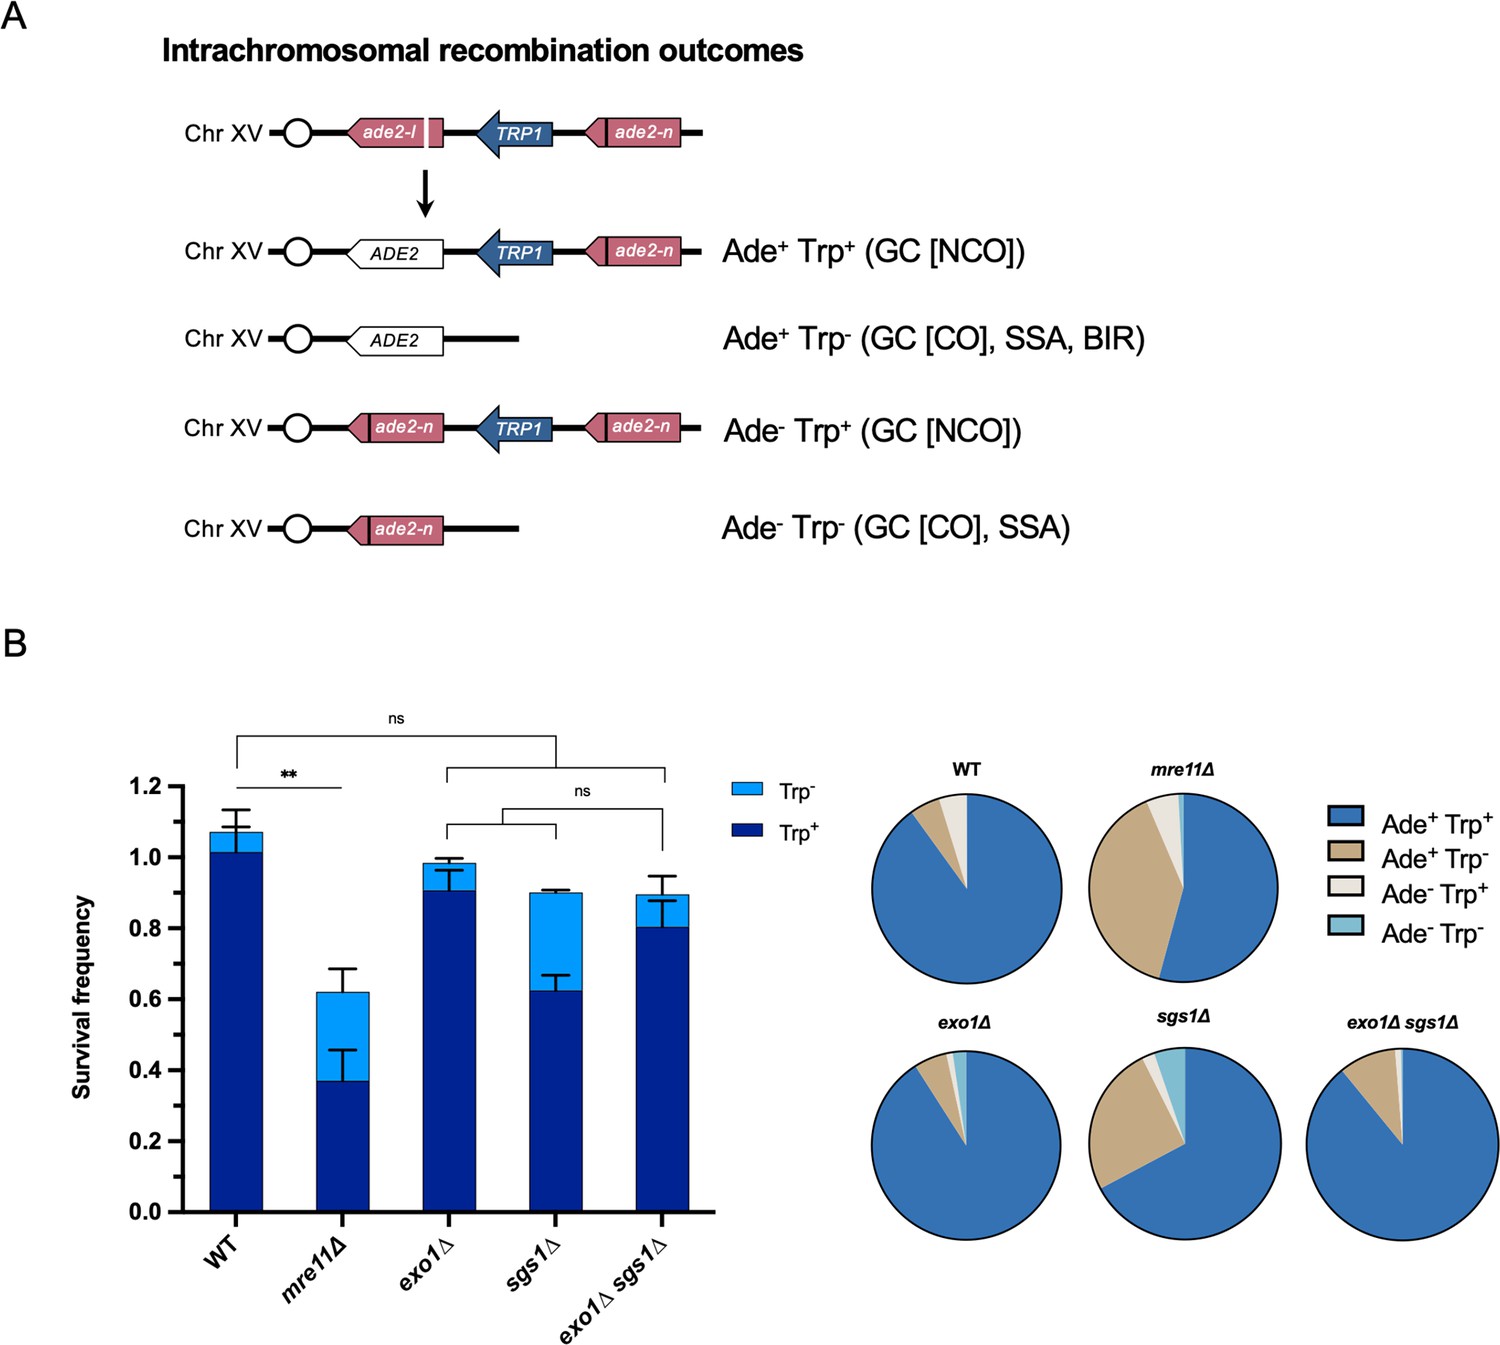
Each of the long-range resection nucleases can independently facilitate intrachromosomal repair.
(A) Detectable repair outcomes for the intrachromosomal assay. Cells that survive the DSB can be categorized as Ade+ or Ade- based on colony color, and Trp+ or Trp- based on growth on –Trp media. In parentheses, the repair pathways leading to each outcome are noted. GC = gene conversion; NCO = non-crossover; CO = crossover; SSA = single strand annealing; BIR = break induced replication. (B) Survival frequency in the plating assay for the intrachromosomal strains (left) and proportion of repair outcomes in the same strains (right). Mean values from at least three plating assays per genotype are shown and error bars represent standard deviation. Significance values are indicated by: ns- not significant, ** p<0.01 based on a two-tailed t-test. Source data are available in Figure 1—source data 1.
Figure 1—figure supplement 2

Each of the long-range resection nucleases can independently facilitate Rad51-independent intrachromosomal repair.
Survival frequency in the plating assay for the intrachromosomal rad51∆ strains (left) and proportion of repair outcomes in the same strains (right). Mean values from at least three plating assays per genotype are shown and error bars represent standard deviation. Significance values are indicated by: ns- not significant, ** p<0.01, *** p<0.001 based on a two-tailed t-test. Source data are available in Figure 1—source data 1.
Figure 1—figure supplement 3

Each of the long-range resection nucleases can independently facilitate interchromosomal repair.
Mean values from at least three plating assays per genotype are shown and error bars represent standard deviation. Significance values are indicated by: ns- not significant, *** p<0.001, **** p<0.0001 based on a two-tailed t-test. Source data are available in Figure 1—source data 1.
Figure 2 with 2 supplements
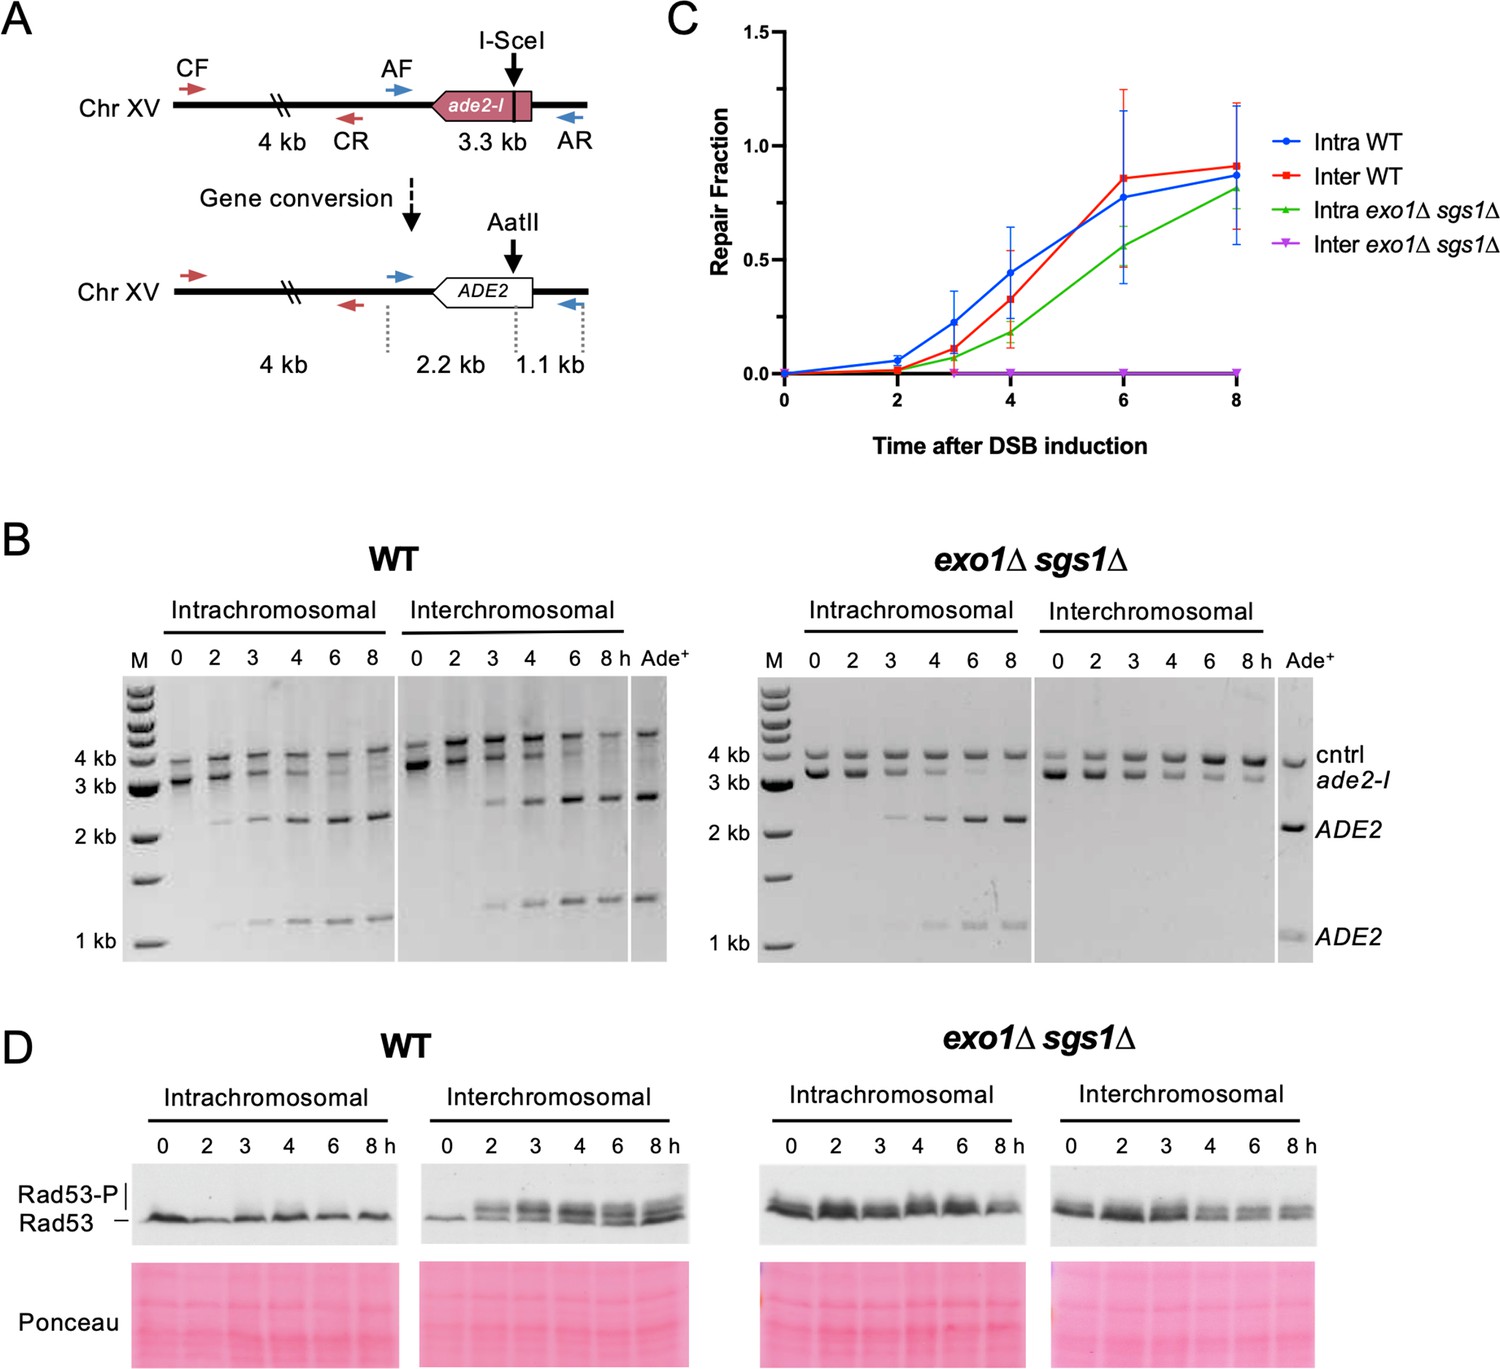
Interchromosomal repair is slower than intrachromosomal repair and is coupled to checkpoint activation.
(A) Schematic for the PCR assay used to measure repair in both the intra- and interchromosomal strains. Primers AF (MK193) and AR (MK197) amplify the ade2/ADE2 allele. These two primers generate a 3.3 kb product before repair, and 2.2 kb and 1.1 kb products after repair and digestion with AatII. Primers CF (MK238) and CR (MK239) were used as a control and generate a 4 kb product, regardless of repair status. (B) Representative results for the PCR-based assay. DNA from an Ade+ colony was used as a reference for 100% repair. M refers to 1 kb size ladder (New England BioLabs). Time after DSB induction is indicated. (C) Quantification of the repair products for the assay shown in B. Mean of three biological replicates is plotted and error bars represent standard deviation. (D) Western blots to detect Rad53 phosphorylation (top) and corresponding Ponceau S staining (bottom). Source data are available in Figure 2—source data 1.
-
Figure 2—source data 1
This file contains all the source data for Figure 2 and related figure supplements.
- https://cdn.elifesciences.org/articles/84322/elife-84322-fig2-data1-v2.zip
Figure 2—figure supplement 1

I-SceI cutting kinetics.
I-SceI cutting efficiency in WT and exo1∆ sgs1∆ cells as measured by qPCR with primers flanking the cut site in strains with the ade2-I allele only. Points represent the mean of 2 biological replicates and error bars represent standard deviation. Source data are available in Figure 2—source data 1.
Figure 2—figure supplement 2

Rad53 phosphorylation in the absence of Exo1 and Sgs1 is dependent on Rad9 and Rad24.
Western blots for Rad53 phosphorylation (top) and corresponding Ponceau S staining (bottom) for the indicated strains. For exo1∆ sgs1∆ rad24∆, two repeats of 0 and 4 hr timepoints are shown. For exo1∆ sgs1∆ rad9∆, two samples without DSB induction are shown (0 h). As a comparison, WT and exo1∆ sgs1∆ strains are included. Source data are available in Figure 2—source data 1.
Figure 3 with 1 supplement
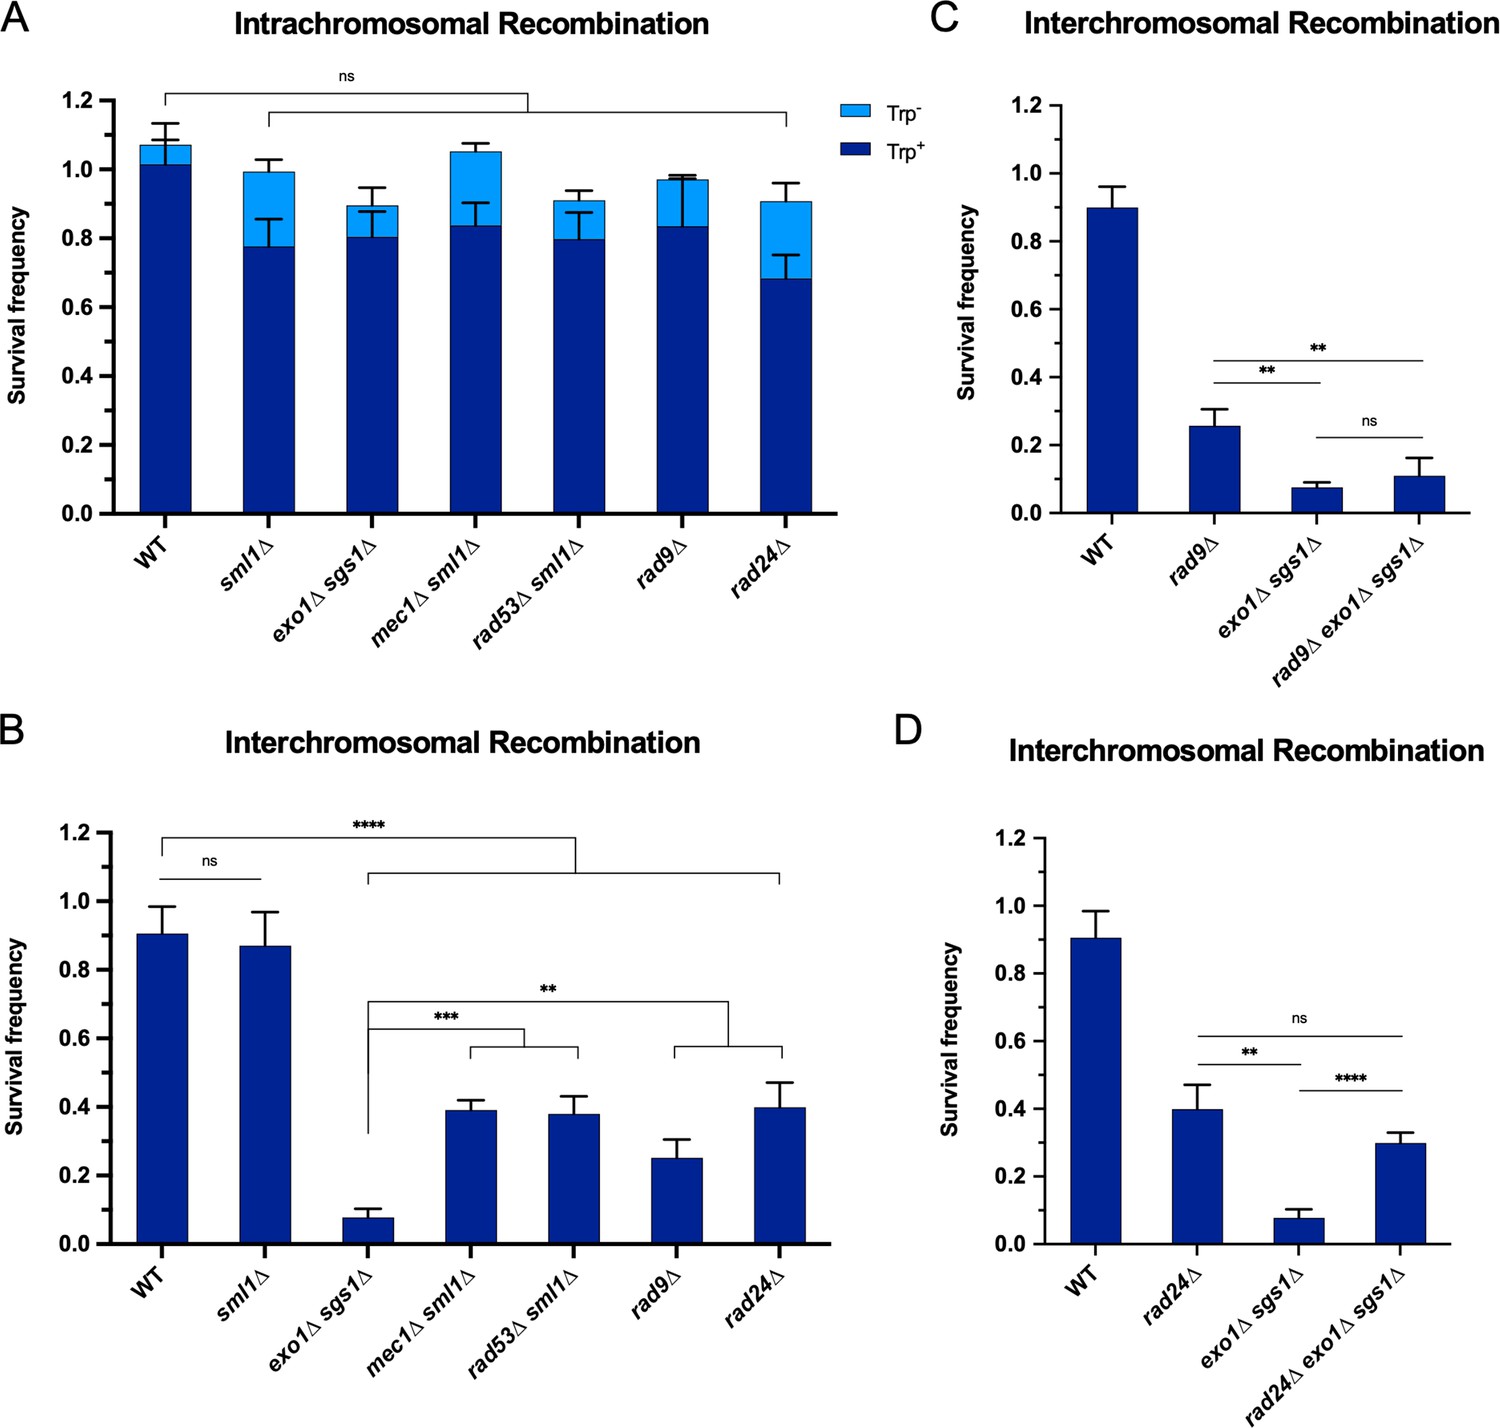
The requirement for long-range resection in interchromosomal recombination correlates with an increased requirement for the DNA damage checkpoint.
Survival frequency in the plating assay for the intrachromosomal strains (A) and interchromosomal strains (B–D) with the indicated genotypes. Intrachromosomal repair products are categorized as Trp+ or Trp-. Bars represent mean values from at least three plating assays per genotype. Error bars represent standard deviation. Significance values are indicated by: ns- not significant, ** p<0.01, *** p<0.001, **** p<0.0001 based on a two-tailed t-test. (C and D) contain overlapping data with B, so only relevant statistics are shown. Source data are available in Figure 3—source data 1.
-
Figure 3—source data 1
This file contains all the source data for Figure 3 and related figure supplements.
- https://cdn.elifesciences.org/articles/84322/elife-84322-fig3-data1-v2.zip
Figure 3—figure supplement 1
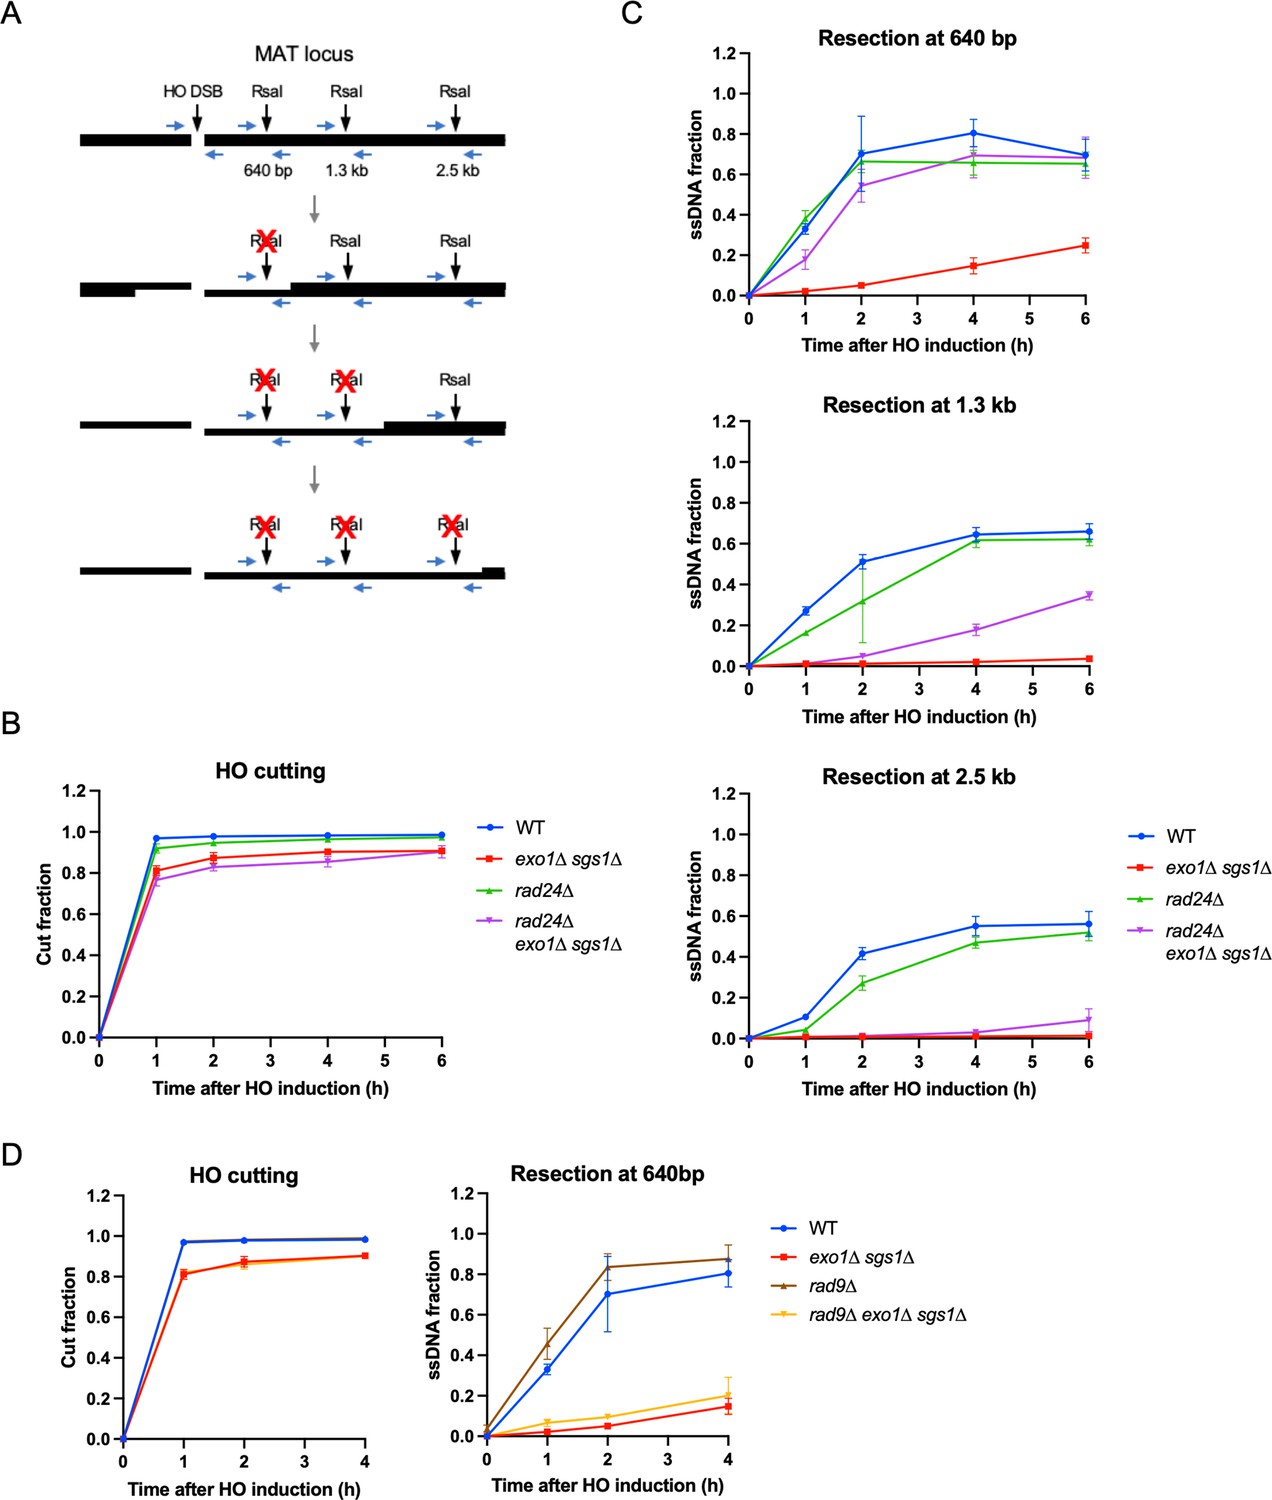
Loss of RAD24, but not RAD9 suppresses the resection defect of exo1∆ sgs1∆ cells.
(A) Schematic of the qPCR-based resection assay. The HO cut site, along with three RsaI cut sites used to measure resection are indicated. Oligos are represented as horizontal blue arrows. Resection past an RsaI site leads to its inactivation. (B) HO cutting efficiency as measured by qPCR with primers flanking the HO cut site as shown in (A). (C) Measurement of ssDNA at 640 bp, 1.3 kb and 2.5 kb from the HO DSB using the qPCR-based resection assay. (D) HO cutting efficiency and measurement of ssDNA at 640 bp from the HO DSB as described for B and C. For B-D, each point represents the mean of three biological replicates and error bars represent standard deviation. Source data are available in Figure 3—source data 1.
Figure 4 with 2 supplements
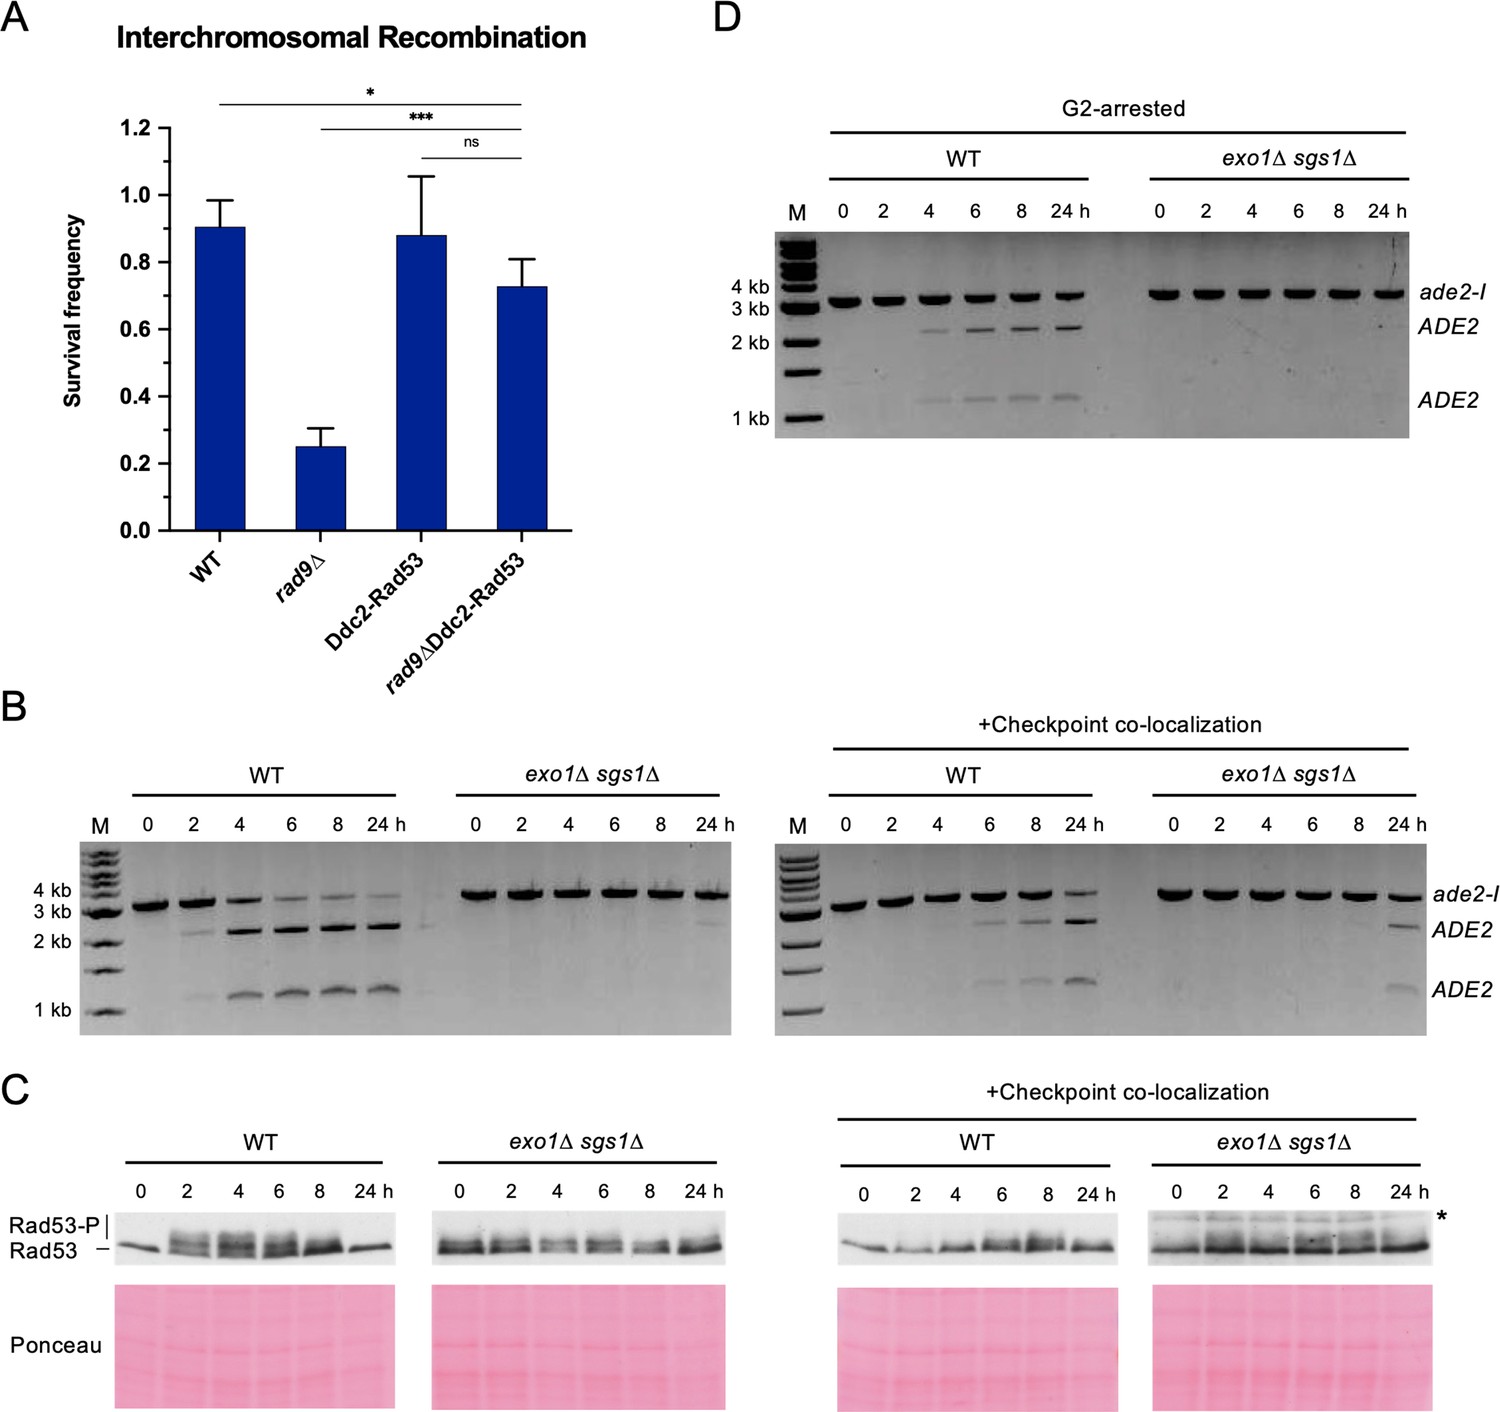
Restoring the checkpoint can rescue an interchromosomal recombination defect.
(A) Survival frequency in the plating assay for the interchromosomal strains with the indicated genotypes. Bars represent mean values from at least three plating assays per genotype. Error bars represent standard deviation. Significance values are indicated by: ns- not significant, * p<0.05, *** p<0.001, based on a two-tailed t-test. (B) Representative results from the PCR assay in interchromosomal assay strains with and without the Ddc1/Ddc2 co-localization system. The DSB and checkpoint were transiently induced with galactose for 3 hr and cells were collected at the indicated time points. (C) Western blots for Rad53 phosphorylation (top) and corresponding Ponceau S staining (bottom) for strains with and without the Ddc1/Ddc2 co-localization system. The asterisk denotes a non-specific band detected by the HA antibody. (D) Representative result from the PCR assay in G2-arrested cells. WT and exo1∆ sgs1∆ strains containing the interchromosomal assay were arrested with nocodazole for 2 hr prior to transient (3 hr) DSB induction (to). Samples were collected at the indicated time points. For (B) and (D), M refers to 1 kb size ladder (New England BioLabs). Source data are available in Figure 4—source data 1.
-
Figure 4—source data 1
This file contains all the source data for Figure 4 and related figure supplements.
- https://cdn.elifesciences.org/articles/84322/elife-84322-fig4-data1-v2.zip
Figure 4—figure supplement 1

Checkpoint restoration in exo1∆ sgs1∆ interchromosomal assay strains.
(A) Survival frequency in the plating assay for the interchromosomal strains with the indicated genotypes. Bars represent mean values from at least two plating assays per strain. Error bars represent standard deviation. Significance values are indicated by: * p<0.05, ** p<0.01, *** p<0.001, **** p<0.0001 based on a two-tailed t-test. (B) HO cutting efficiency as measured by qPCR with primers flanking the HO cut site (top) and measurement of ssDNA at 640 bp from the HO DSB using the qPCR-based resection assay (bottom) as in Figure 3—figure supplement 1. Each point represents the mean of four biological replicates and error bars represent standard deviation. Source data are available in Figure 4—source data 1.
Figure 4—figure supplement 2
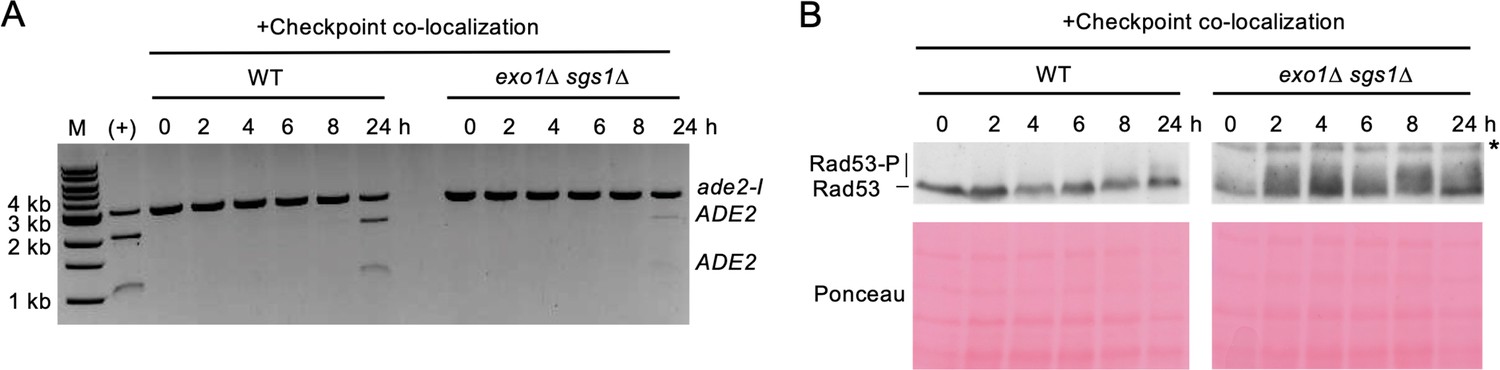
Artificial checkpoint restoration in exo1∆ sgs1∆ interchromosomal strains.
(A) Results from the PCR assay in interchromosomal assay strains with the Ddc1/Ddc2 co-localization system. The DSB and checkpoint were transiently induced with galactose for 5 hr and cells were collected at the indicated time points. A positive control for AatII digestion was included for reference. M refers to 1 kb size ladder (New England BioLabs). (B) Western blots for Rad53 phosphorylation (top) and corresponding Ponceau S staining (bottom) for the same timecourse as in A. The asterisk denotes a non-specific band detected by the HA antibody. Source data are available in Figure 4—source data 1.
Figure 5 with 2 supplements
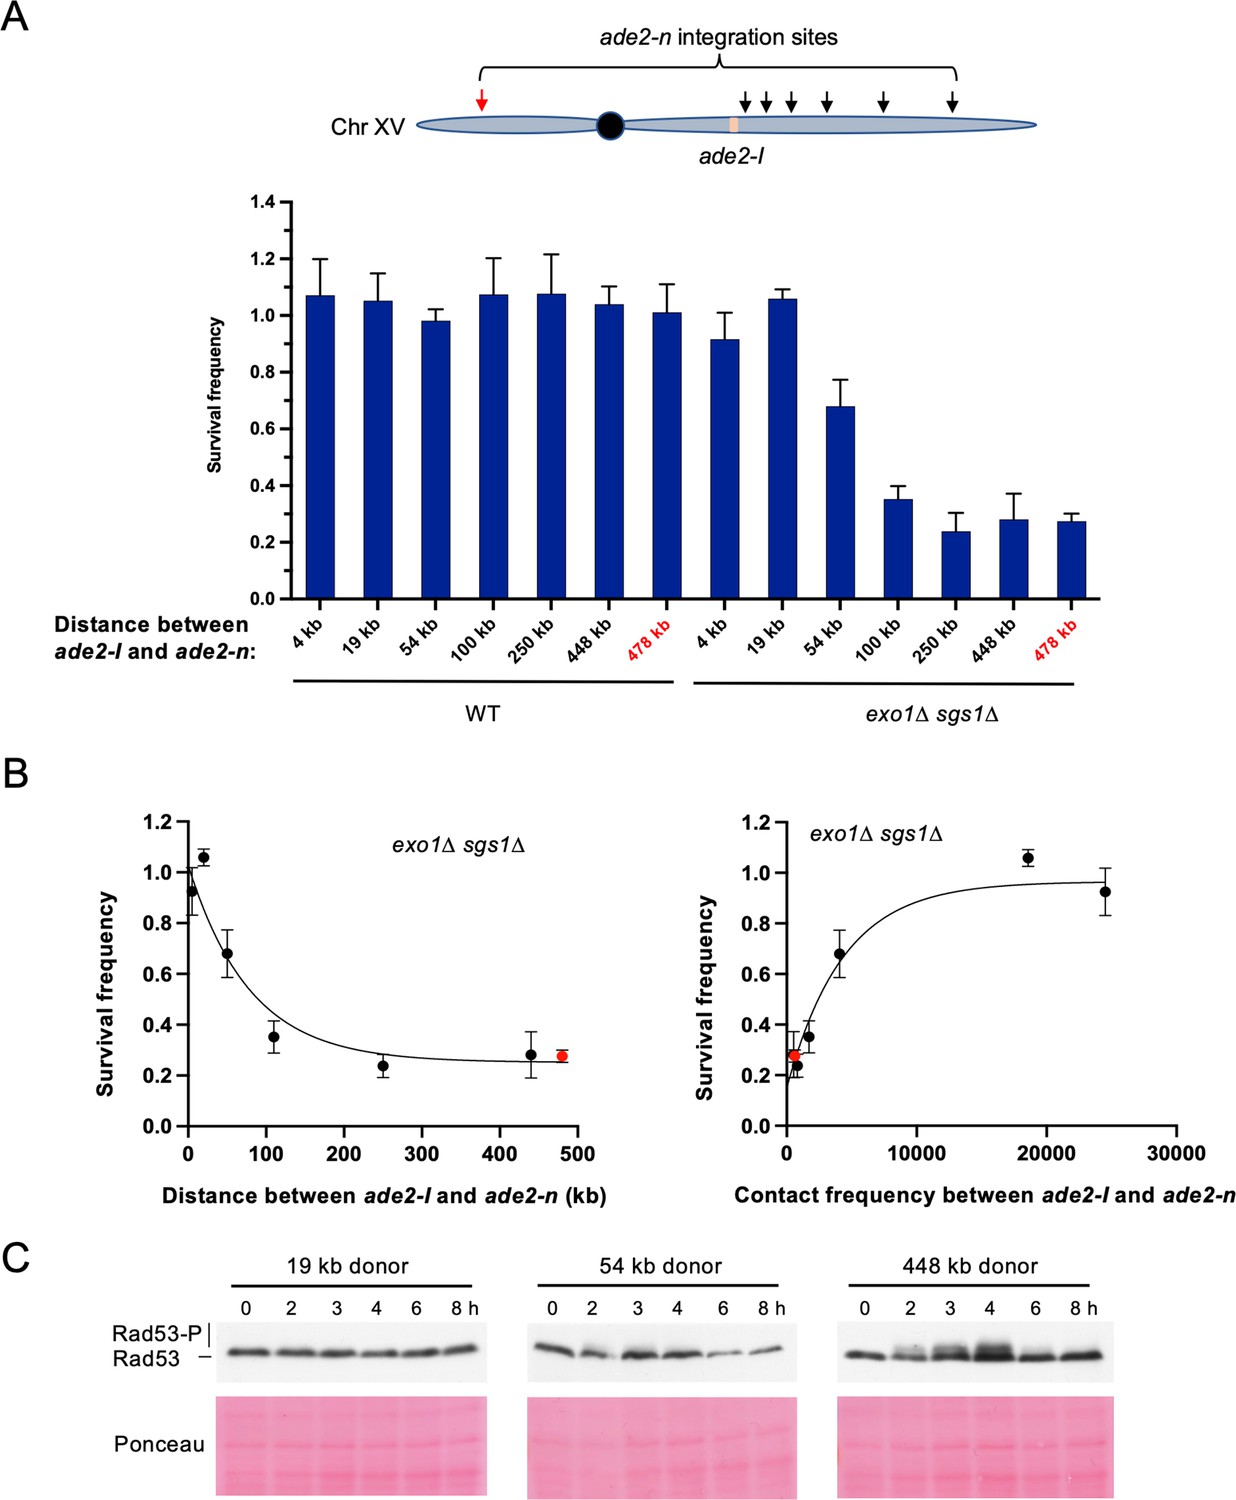
Repair template proximity dictates the requirement for long-range resection.
(A) Schematic of Chr XV with the ade2-n insertion sites indicated with arrows and the ade2-I DSB allele in beige (top). Below are the survival frequencies for the plating assay for intrachromosomal strains. On the left are survival frequencies for WT strains and on the right are survival frequencies for exo1∆ sgs1∆ strains. The donor site on the left arm of Chr XV is indicated in red. The 4 kb donor is the intrachromosomal site used in all other experiments. Bars represent mean values from at least three plating assays per genotype. Error bars represent standard deviation. (B) Correlations between survival and linear distance between ade2-I and ade2-n alleles (left) and between survival and total contact frequency between ade2-I and ade2-n (right) (exo1∆ sgs1∆ strains). Nonlinear, one-phase decay regressions were applied in Prism, which are represented by the curves in each graph. Total contact frequencies are based on data from Lazar-Stefanita et al., 2017. (C) Western blots for Rad53 phosphorylation (top) and corresponding Ponceau S staining (bottom) for WT strains of the indicated ade2-n locations. Source data are available in Figure 5—source data 1.
-
Figure 5—source data 1
This file contains all the source data for Figure 5 and related figure supplements.
- https://cdn.elifesciences.org/articles/84322/elife-84322-fig5-data1-v2.zip
Figure 5—figure supplement 1

Interchromosomal contact frequency does not significantly impact recombination efficiency.
Survival frequency in the recombination plating assay for interchromosomal strains. Repair allele location is denoted by chromosome and high/low contact frequency with the DSB allele is indicated. Bars represent mean values from at least three plating assays per genotype. Error bars represent standard deviation. Significance values are indicated by: * p<0.05, ** p<0.01, *** p<0.001, **** p<0.0001 based on a two-tailed t-test. Source data are available in Figure 5—source data 1.
Figure 5—figure supplement 2

Rad51 over-expression partially rescues the interchromosomal recombination defect of long-range resection deficient cells.
Survival frequency in the plating assay for the interchromosomal strains with the indicated genotypes, plus empty vector (EV) or Rad51 over-expression plasmid (OE). Bars represent mean values from at least eight plating assays per strain. Error bars represent standard deviation. Significance values are indicated by: * p<0.05, **** p<0.0001 based on a two-tailed t-test. Source data are available in Figure 5—source data 1.
Figure 6
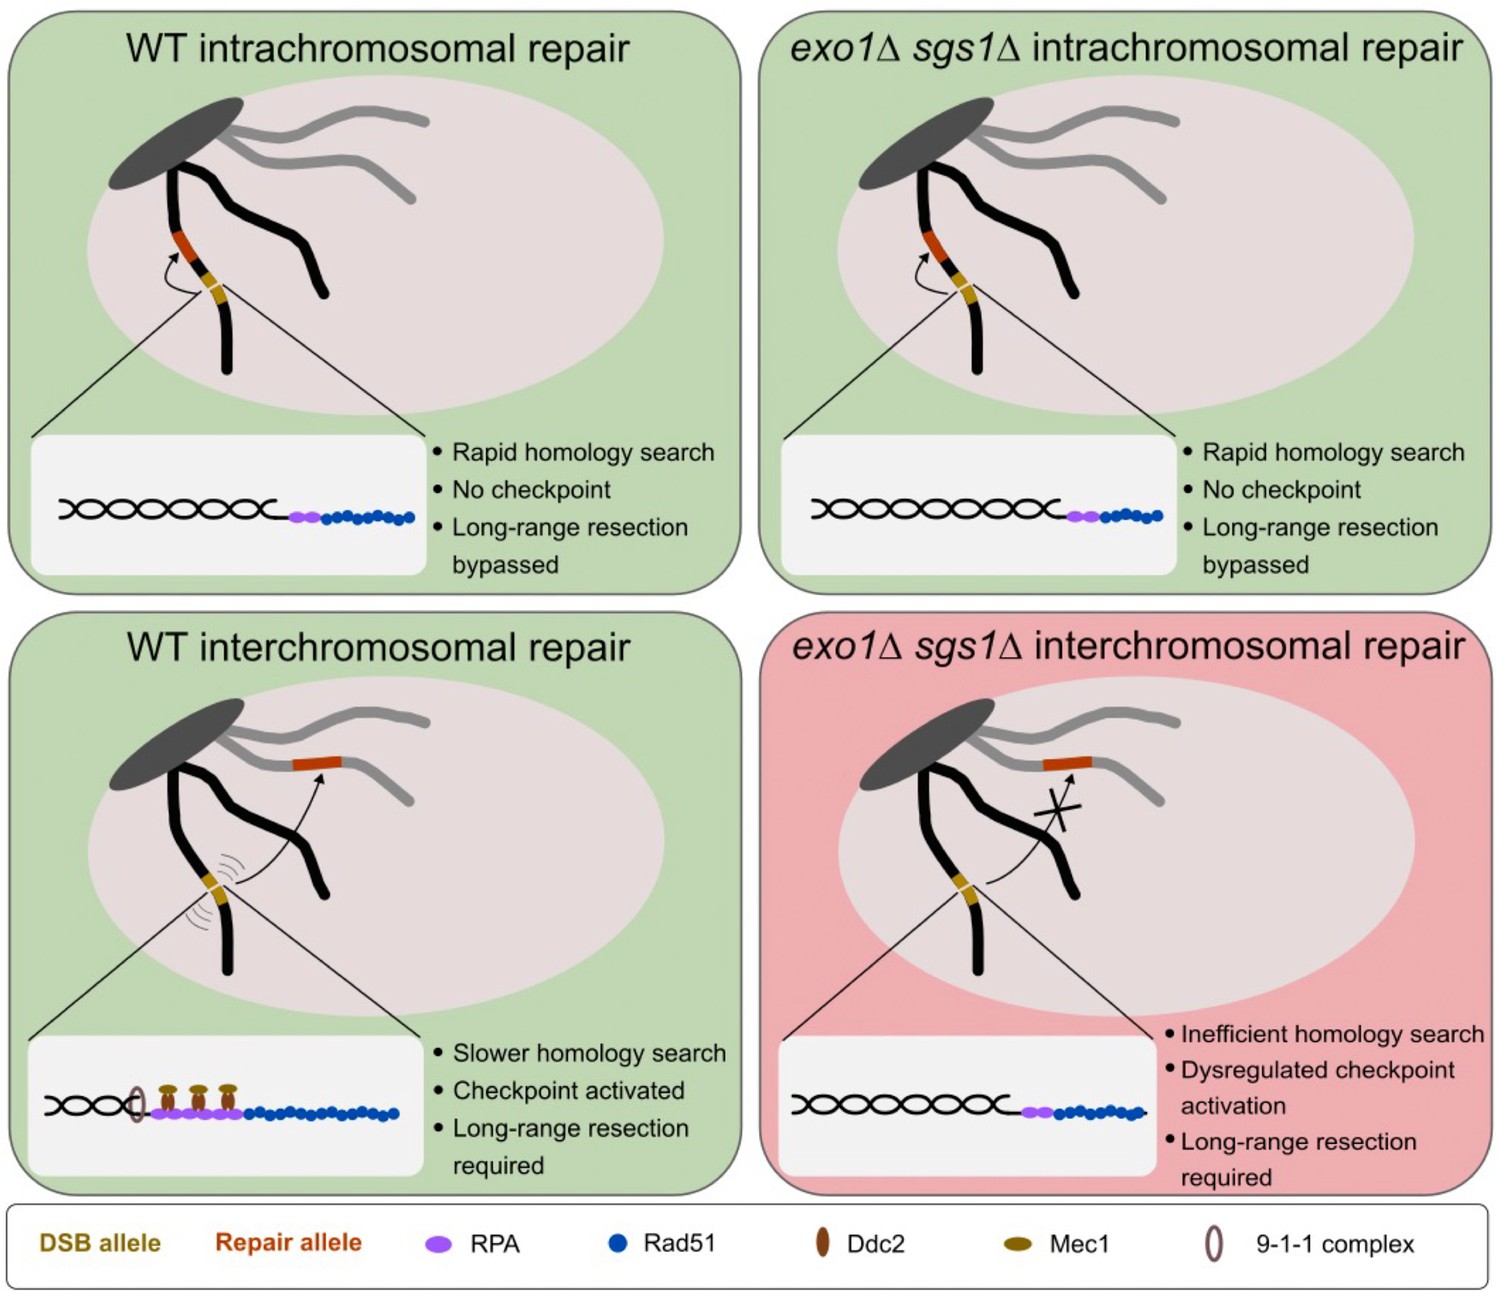
Model for the requirement for long-range resection in recombination.
In intrachromosomal recombination, short resection tracts are sufficient to facilitate the homology search and repair due to the close proximity of the DSB allele (yellow) and repair allele (orange) (top panels). An intramolecular repair event is represented, but an inter-sister repair event is also possible. In interchromosomal recombination (or distal intrachromosomal recombination), the homology search takes longer. Therefore, resection tracts continue to be extended and the DNA damage checkpoint is activated in WT cells (bottom left panel). This would pause the cell cycle and activate mobility, facilitating the homology search and repair. However, in the absence of long-range resection, checkpoint activation is impaired, likely leading to a mobility defect and a failure to delay cell cycle progression (bottom right panel). This would result in cell death as cells would divide with a broken chromosome. The large light gray oval represents the nucleus and the dark gray oval represents clustered centromeres. Only two chromosomes are shown for simplicity.
Author response image 1

Interchromosomal recombination in the presence of slx4S486A.
(A) Results from the recombination plating assay using a modified interchromosomal strain expressing Cas9 and an ISceI-targeted gRNA rather than GAL-I-SceI. Bars represent average survival frequency and error bars indicate standard deviation of five biological replicates per genotype. ns, not significant. (B) Rad53 western blot (top) and Ponceau S staining (bottom) for the indicated strains 0 and 4 h ajer Cas9 induction.
Tables
Key resources table
| Reagent type (species) or resource | Designation | Source or reference | Identifiers | Additional information |
|---|---|---|---|---|
| strain, strain background (Saccharoymces cerevisiae, W303) | Various | Various | Various | See Materials and Methods section |
| antibody | α-Rad53 (Mouse, monoclonal) | M.Foiani | Clone EL7 | (1:500) |
| antibody | α-HA [12CA5] (Mouse, monoclonal) | Roche (thru Millipore Sigma) | SKU# 11583816001 | (1:1000) |
| other | α-mouse IgG kappa BP-HRP | Santa Cruz Biotechnology | Cat# sc-516102 | HRP-conjugated recombinant binding protein (1:5000) |
| recombinant DNA reagent | pRG205MX (DNA plasmid) | Gnügge et al., 2016 | Available on Addgene (Plasmid #64535) | LEU2 shuttle vector |
| recombinant DNA reagent | pAG25 (DNA plasmid) | Addgene | Cat# 35121 | NatMX plasmid |
| recombinant DNA reagent | ade2-n-LEU2MX (DNA plasmid) | This study | pLS515 | See Materials and methods section |
| recombinant DNA reagent | ade2-n-NatMX (DNA plasmid) | This study | pLS617 | See Materials and methods section |
| recombinant DNA reagent | pRS423 (DNA plasmid) | Christianson et al., 1992 | Empty vector (EV) | |
| recombinant DNA reagent | pRS423-RAD51 (DNA plasmid) | This study | pLS506 | See Materials and methods section |
| recombinant DNA reagent | pAFS52 (DNA plasmid) | Straight et al., 1996 | 256 x LacO plasmid with TRP1 marker | |
| sequence-based reagent | Primers for ADE2 recombination assay and qPCR primers for measuring cutting efficiency and resection | Various | Various | See Materials and methods section |
| commercial assay or kit | MasterPure Yeast DNA Purification Kit | BiosearchTechnologies | Cat# MPY80200 | |
| commercial assay or kit | SsoAdvanced Universal SYBR Green Supermix | Bio-Rad | Cat# 1725274 | |
| commercial assay or kit | Qubit 1 X dsDNA High Sensitivity Assay Kit | Invitrogen | Cat# Q33231 | |
| commercial assay or kit | SuperSignal West Femto Max Sensitivity ECL | ThermoFisher | Cat# 34096 | |
| commercial assay or kit | Phusion High Fidelity DNA Polymerase kit | New England BioLabs | Cat# 0530 L | |
| chemical compound, drug | Trichloroacetic acid (TCA) | Sigma | Cat# T0699-100mL | |
| chemical compound, drug | Dimethyl Sulfoxide (DMSO) | Fisher Scientific | Cat# D128-1 | |
| chemical compound, drug | Nocodazole | AbMole | Cat# M3194 | |
| chemical compound, drug | 2% Bis Solution | Bio-Rad | Cat# 1610142 | |
| chemical compound, drug | 40% Acrylamide Solution | Bio-Rad | Cat# 1610140 | |
| chemical compound, drug | N,N,N’,N’-Tetramethyl-ethylenediamine (TEMED) | Sigma | Cat# T9281-25mL | |
| chemical compound, drug | Ponceau S | Sigma | P3504-10G | |
| chemical compound, drug | β-estradiol | Sigma | Cat# E8875 | |
| software, algorithm | Prism V9.0 | GraphPad | ||
| other | Glass beads, acid washed | Sigma | Cat# G8772 | Beads for cell lysis (See Materials and Methods section) |
| other | AatII | New England BioLabs | Cat# R0117L | Restriction enzyme |
| other | BamHI-HF | New England BioLabs | Cat# R3136S | Restriction enzyme |
| other | BglII | New England BioLabs | Cat# R0144S | Restriction enzyme |
| other | EcoRV-HF | New England BioLabs | Cat# R3195S | Restriction enzyme |
| other | rCutSmart buffer | New England BioLabs | Cat# B6004S | Restriction enzyme buffer |
| other | NEBuffer r3.1 | New England BioLabs | Cat# B6003S | Restriction enzyme buffer |
| other | 1 kb ladder | New England BioLabs | Cat# N3232L | DNA size ladder |
| other | iBlot 2 PVDF Mini Stacks | Invitrogen | Cat# IB24002 | PVDF western membrane and dry transfer stack |
| other | FastPrep-24 5 G homogenizer | MP-Biomedicals | Cat# 6005500 | Sample prep system (See Materials and methods section) |
Additional files
-
Supplementary file 1
Yeast Strains.
All yeast strains used in this study.
- https://cdn.elifesciences.org/articles/84322/elife-84322-supp1-v2.xlsx
-
Supplementary file 2
Oligonucleotides.
Oligonucleotides used for recombination assays and generation of ectopic recombination strains.
- https://cdn.elifesciences.org/articles/84322/elife-84322-supp2-v2.xlsx
-
MDAR checklist
- https://cdn.elifesciences.org/articles/84322/elife-84322-mdarchecklist1-v2.docx
Download links
A two-part list of links to download the article, or parts of the article, in various formats.
Downloads (link to download the article as PDF)
Open citations (links to open the citations from this article in various online reference manager services)
Cite this article (links to download the citations from this article in formats compatible with various reference manager tools)
Long-range DNA end resection supports homologous recombination by checkpoint activation rather than extensive homology generation
eLife 12:e84322.
https://doi.org/10.7554/eLife.84322


