Divergent functions of two clades of flavodoxin in diatoms mitigate oxidative stress and iron limitation
- School of Oceanography, University of Washington, United States
- Molecular Engineering Graduate Program, University of Washington, Seattle, WA, United States
Figures
Figure 1 with 1 supplement
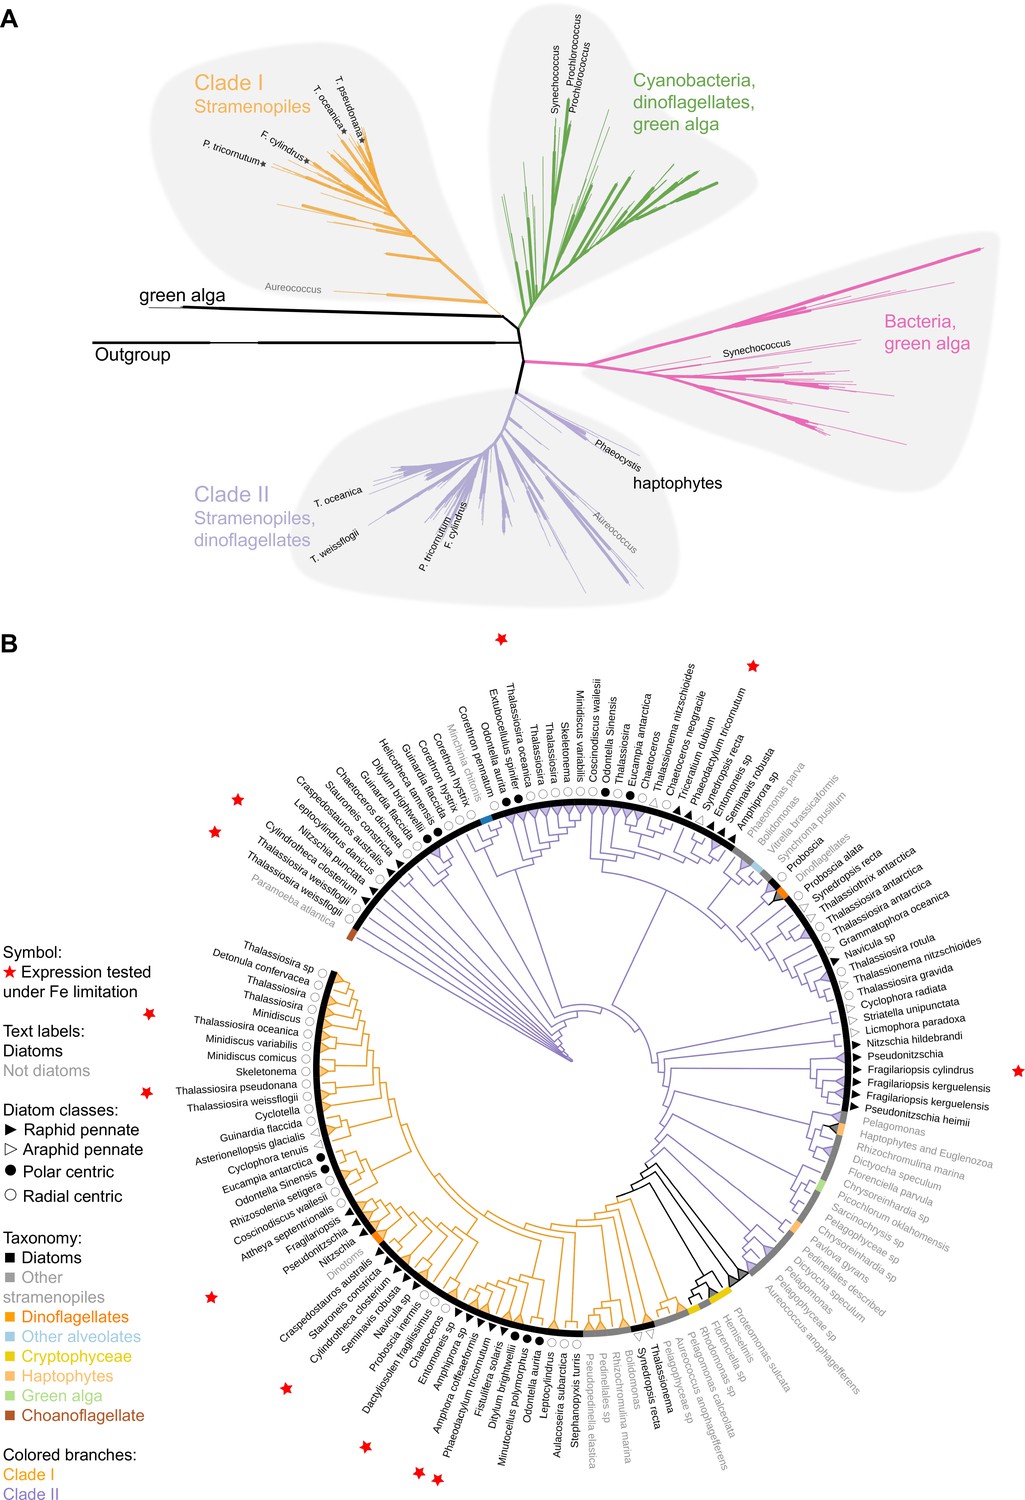
Phylogeny of flavodoxins in marine microorganisms.
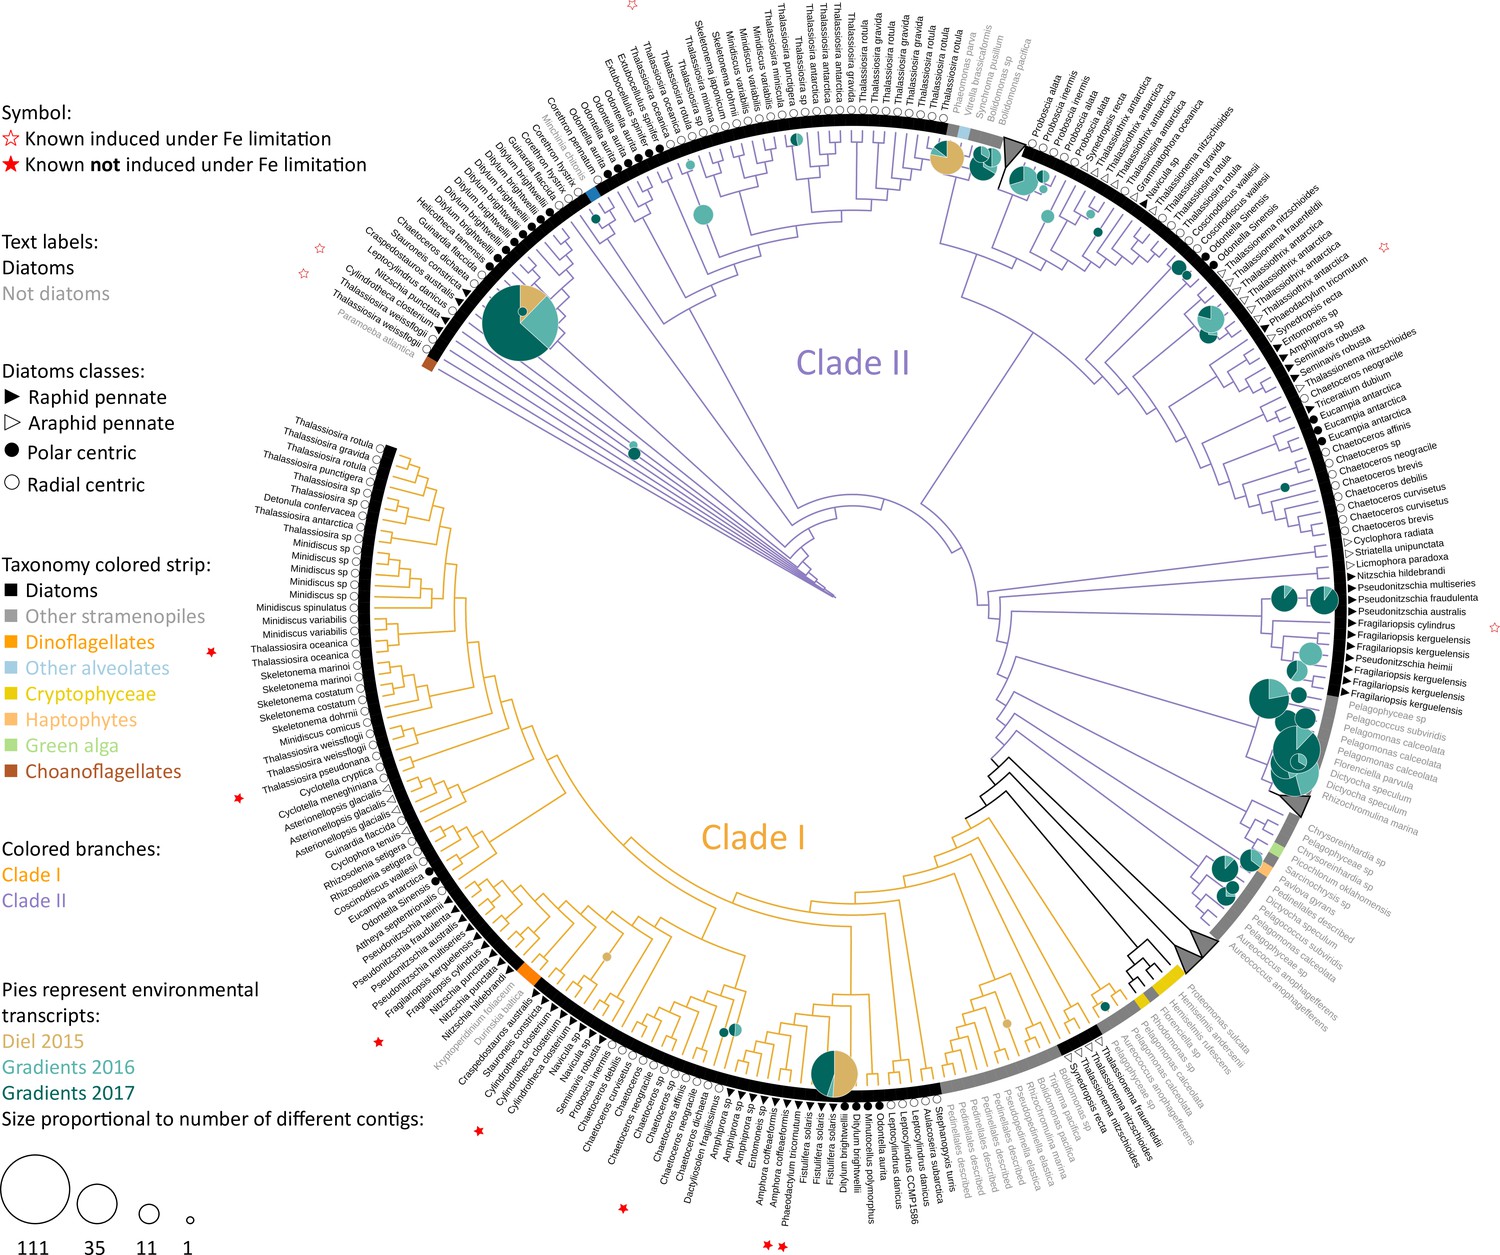
( A) Maximum-likelihood (RAxML) phylogenetic tree of photosynthetic flavodoxins (see Figure 1—figure supplement 1A for the full tree, Figure 1—figure supplement 1B for taxonomic annotation); non-photosynthetic flavodoxins as well as flavodoxin domains in other proteins are collapsed as an ‘outgroup.’ Thick branch lines represent bootstrap support greater than 0.7. Different clades are marked with colors: clade I (orange), clade II (purple), bacteria/green algae clade (pink), cyanobacteria/ dinoflagellate/green alga clade (green). Labeled taxa indicated with black labels were experimentally tested for response to iron limitation; tested flavodoxins indicated with black starts were not induced (Supplementary files 1 and 2). Aureococcus (indicated in gray) has not been experimentally tested in response to iron limitation. (B) Unrooted maximum-likelihood (RAxML) phylogenetic tree of clade I and II flavodoxins with 56 additional stramenopile strains (listed in Supplementary file 1b). Thick branch lines represent bootstrap support greater than 0.7. Branches collapsed (indicated with triangles at tips) for non-stramenopiles and at genus level within stramenopiles (see Figure 1—figure supplement 1C for the full tree). Branch colors represent clade (I, II, orange and purple, respectively). Colored strip represents taxonomy, dinoflagellates with diatom endosymbionts are labeled ‘dinotoms.’ Red stars represent flavodoxins with expression experimentally tested under iron limitation.
Figure 1—figure supplement 1
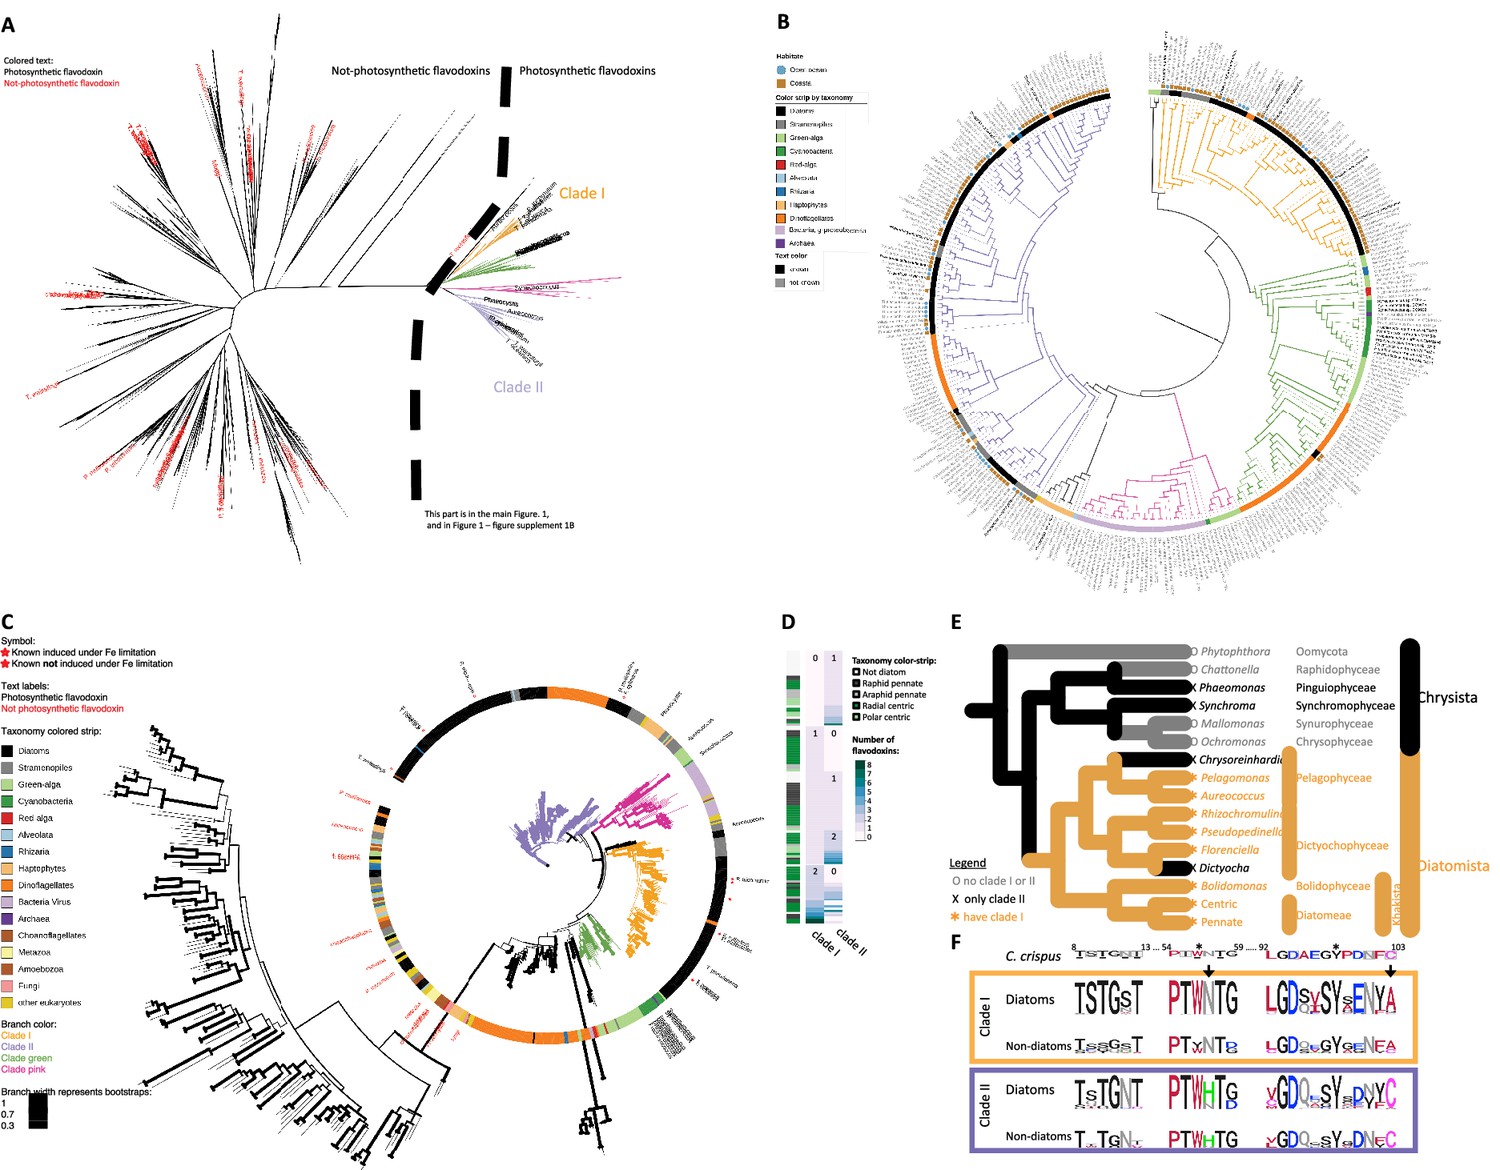
Flavodoxins in publicly available databases.
(A) Maximum-likelihood (RAxML) tree of flavodoxins. Names of organisms with non-photosynthetic flavodoxins proteins or proteins with flavodoxin domains labeled in red and previously identified photosynthetic flavodoxins labeled in black. Photosynthetic flavodoxins (right side of dashed line) are presented in Figure 1A. Thick branch lines represent bootstrap support greater than 0.7. Different clades are colored as in Figure 1: clade I (orange), clade II (purple), bacteria/green algae clade (pink), cyanobacteria/ dinoflagellate/green algae clade (green). (B) Photosynthetic flavodoxins of the same maximum-likelihood (RAxML) phylogenetic tree presented in (A). Thick branch lines represent bootstrap support greater than 0.7. Clades are marked with colored branches as in (A). Colored strip represents taxonomy, color-coded on the figure. Isolate habitat of stramenopiles is indicated: blue circles (open ocean), brown full rectangles (coastal), brown open rectangles (other – benthic, hypersaline, freshwater or tidal mud), see Supplementary file 1b for isolate location. Taxonomic labels are black for previously identified photosynthetic flavodoxins and gray for other species. (C) Unrooted maximum-likelihood (RAxML) phylogenetic tree of clade I and II flavodoxins after inclusion of 56 stramenopile strains (see Supplementary file 1b for list of added strains). Thickness of the branch lines represent bootstrap support (see legend). Clades are marked with colored branches as in panels (A) and (B). Colored strip represents taxonomy. Non-photosynthetic flavodoxins as well as flavodoxin domains in other proteins labeled in red, previously identified photosynthetic flavodoxins labeled in black. Red stars represent flavodoxins with expression experimentally tested under iron limitation. This is the full tree of Figure 1B. (D) Number of clade I or clade II flavodoxins detected in different stramenopile species, as also shown in Supplementary file 1b. Each row represents an individual species. The right column indicates the taxonomy of each examined species (right column; white – non-diatom stramenopiles, diatoms: gray – pennates, dark – raphid, light – araphid, green: centric, dark – radial, light – polar). The center column indicates the number clade I flavodoxins; the right column indicates the number of clade II flavodoxins per species (white = 0 detected copies, darkest green = 8 detected copies per species). (E) Schematic phylogeny within the stramenopiles group, adapted from Derelle et al., 2016, Pinguiophyceae placed according to Kawachi et al., 2002. Groups with detected clade I flavodoxins are marked with orange asterisk, groups with only clade II flavodoxins detected are marked with black X, groups with no flavodoxin detected are marked with gray circle. The branches are colored accordingly. Notably, the different groups are not evenly represented in our dataset. There are 67 centric diatoms (13 with no clade I flavodoxin), while there are 3 Chrysophyceae and 1 Dictyocha. (F) Conserved FMN-binding sites in stramenopiles flavodoxins. Top row: conserved sequences surrounding the FMN molecule according to structure of a red alga Chondrus crispus flavodoxin (Fukuyama et al., 1992). Amino acids are numbered according to C. crispus. Asterisks indicate the residues whose side chains flank the FMN, amino acids whose side chains form hydrogen bond with the FMN are underlined, amino acids whose backbone form a hydrogen bond with the FMN are marked with gray rectangles. Middle, bottom rows: sequence logos detailing alignment conservation among each clade of flavodoxins of diatoms, and other stramenopiles. Black arrows indicate amino acids 57 and 103 discussed in the text. Sequence logos were created with the R package Ggseqlogo (Wagih, 2017) using alignments present in Supplementary file 2; supplementary fasta file 4.
Figure 2 with 1 supplement
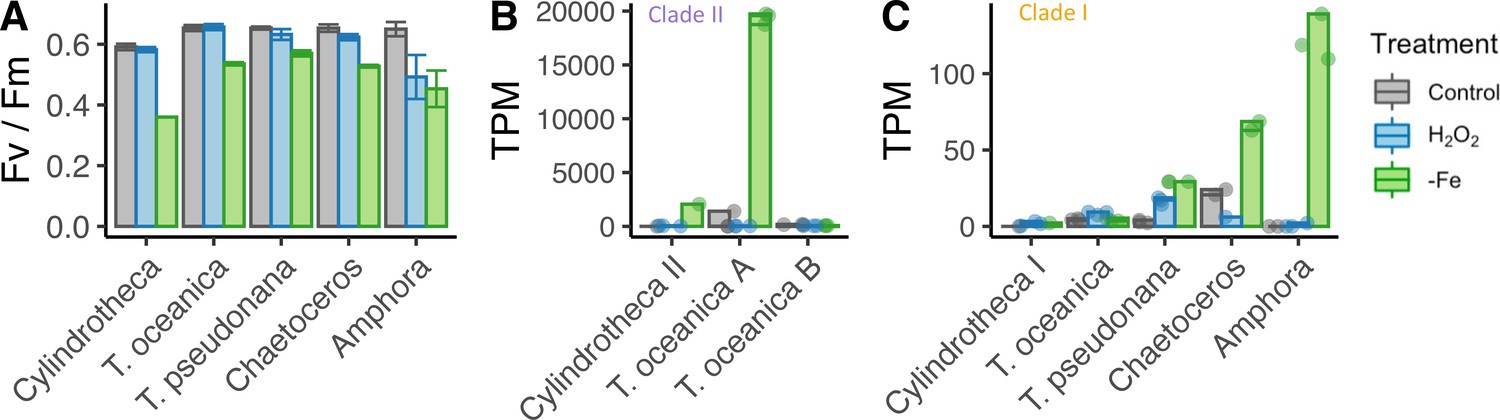
Iron limitation and oxidative stress in diatom cultures.
( A) Photosynthetic efficiency (Fv/Fm) of five diatom species, before harvesting the cells for each transcriptome, error bars represent the standard deviation of biological triplicates. Transcripts per million (TPM) of clade II (B) and clade I (C) flavodoxins in response to iron limitation and H2O2 treatment. T. oceanica clade II flavodoxins, previously named FLDA1 and FLDA2 (Whitney et al., 2011), are marked here as A and B, respectively. Cylindrotheca encodes one flavodoxin from each clade, marked here I and II according to the clade. Note the different Y axis scales in panels (B) and (C). Individual measurements are marked in circles, maximal values in colored bars.
Figure 2—figure supplement 1
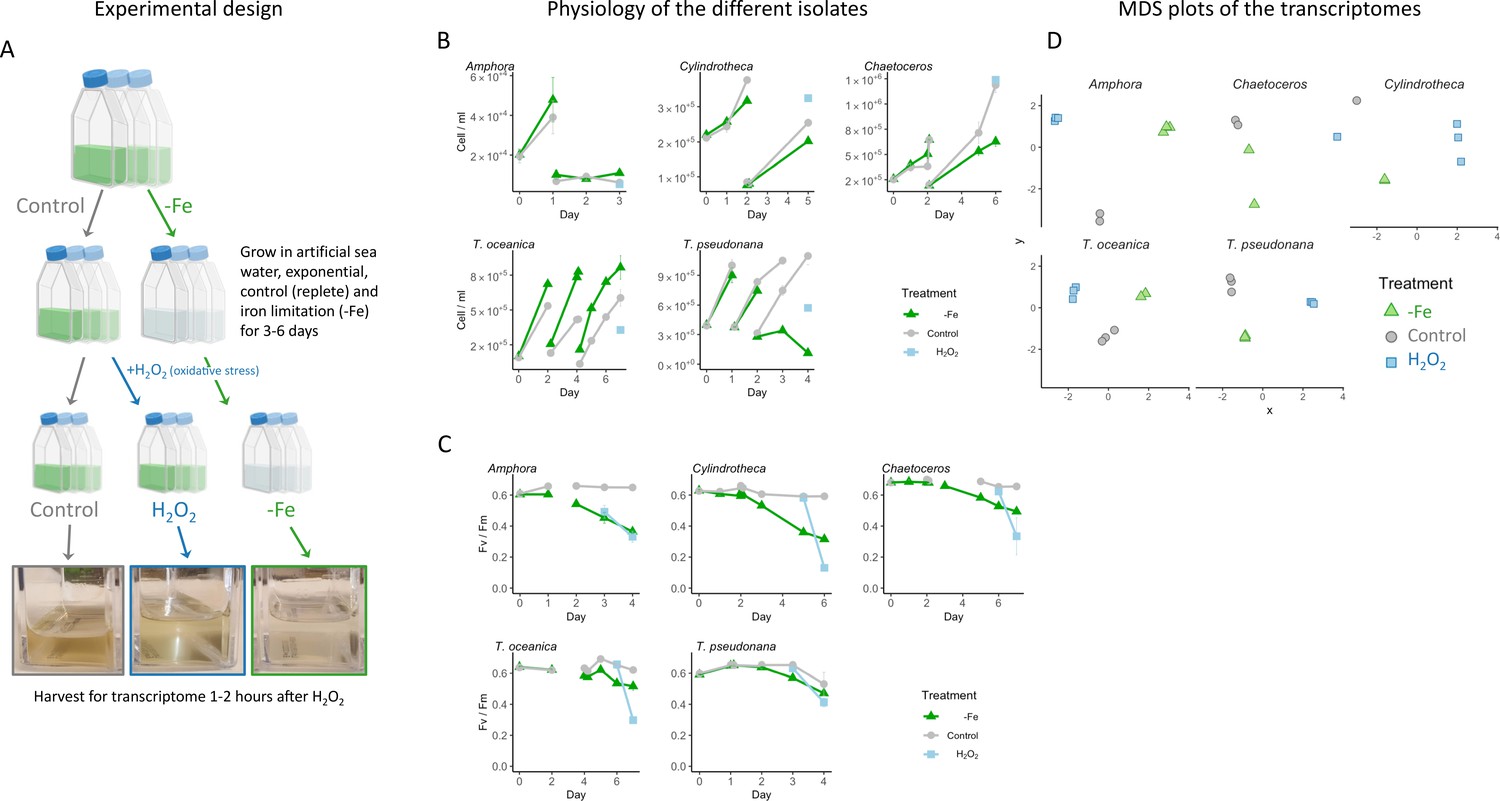
Diatoms cultures transcriptomes.
(A) Experimental design and pictures of representative flasks at the time of harvesting for transcriptomes. The full experiment was done in biological triplicates for each treatment. For each measurement, samples were taken from the triplicates. (B) Cell counts, measured by flow cytometry of the five diatom species during the experiment. Iron replete (control, gray circles), iron limited (-Fe, green triangles), line breaks indicate culture dilution into the same growth media. A subset of replete cultures was treated with H2O2 ~ 1.5 hr before harvest for transcriptomes (light blue squares). (C) Photosynthetic efficiency (Fv/Fm) of the same experiment. Colors and symbols as in (B). (D) Multidimensional scaling plot (MDS) of the five diatom transcriptomes, generated by EdgeR (Robinson et al., 2010). Colors and symbols as in (B) and (C). Some samples were not sequenced due to RNA loss during library preparation: one control Amphora, two control, one iron limitation Cylindrotheca, one control, one iron limitation, two H2O2-treated Chaetoceros.
Figure 3 with 1 supplement
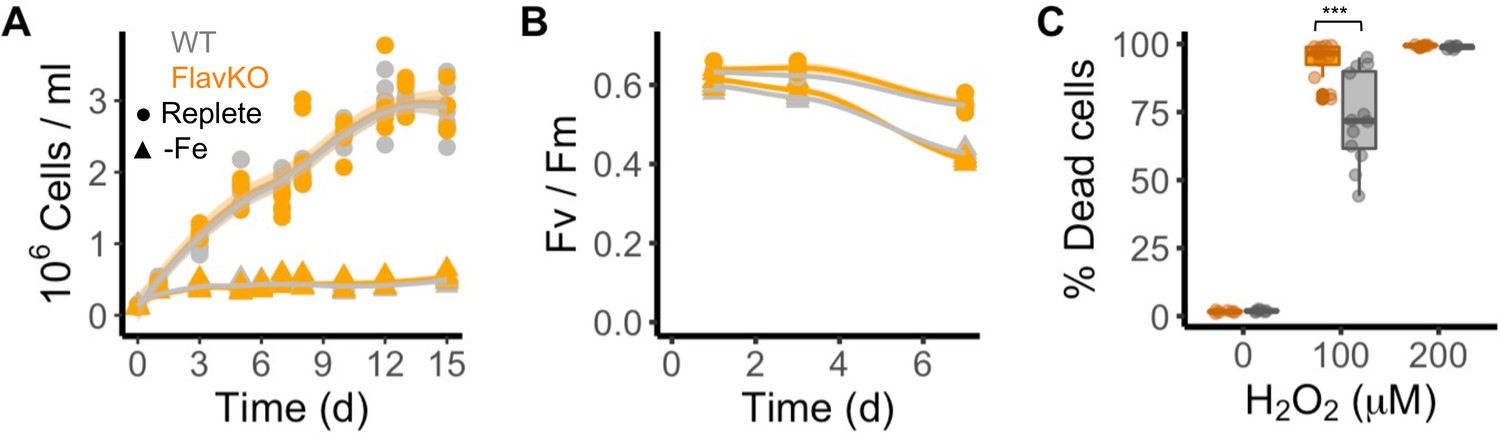
Response of T. pseudonana flavodoxin KO and WT lines to iron limitation and oxidative stress.
Three independent WT (gray) and flavodoxin KO (orange) lines were grown under iron- replete (circles) and iron-limiting (triangles) conditions for several days. (A) Cell abundance, measured by flow cytometry. (B) Photosynthetic efficiency, measured by phytoPAM. Individual measurements marked in symbols, means of triplicates in lines. (C) Percentage of Sytox Green-positive (dead) cells, measured by flow cytometry 24 hr after treatment with 0, 100, or 200 µM H2O2. Box plots combine two independent experiments, ANOVA between WT and KO (indicated with ***), significant 9 • 10–5.
Figure 3—figure supplement 1
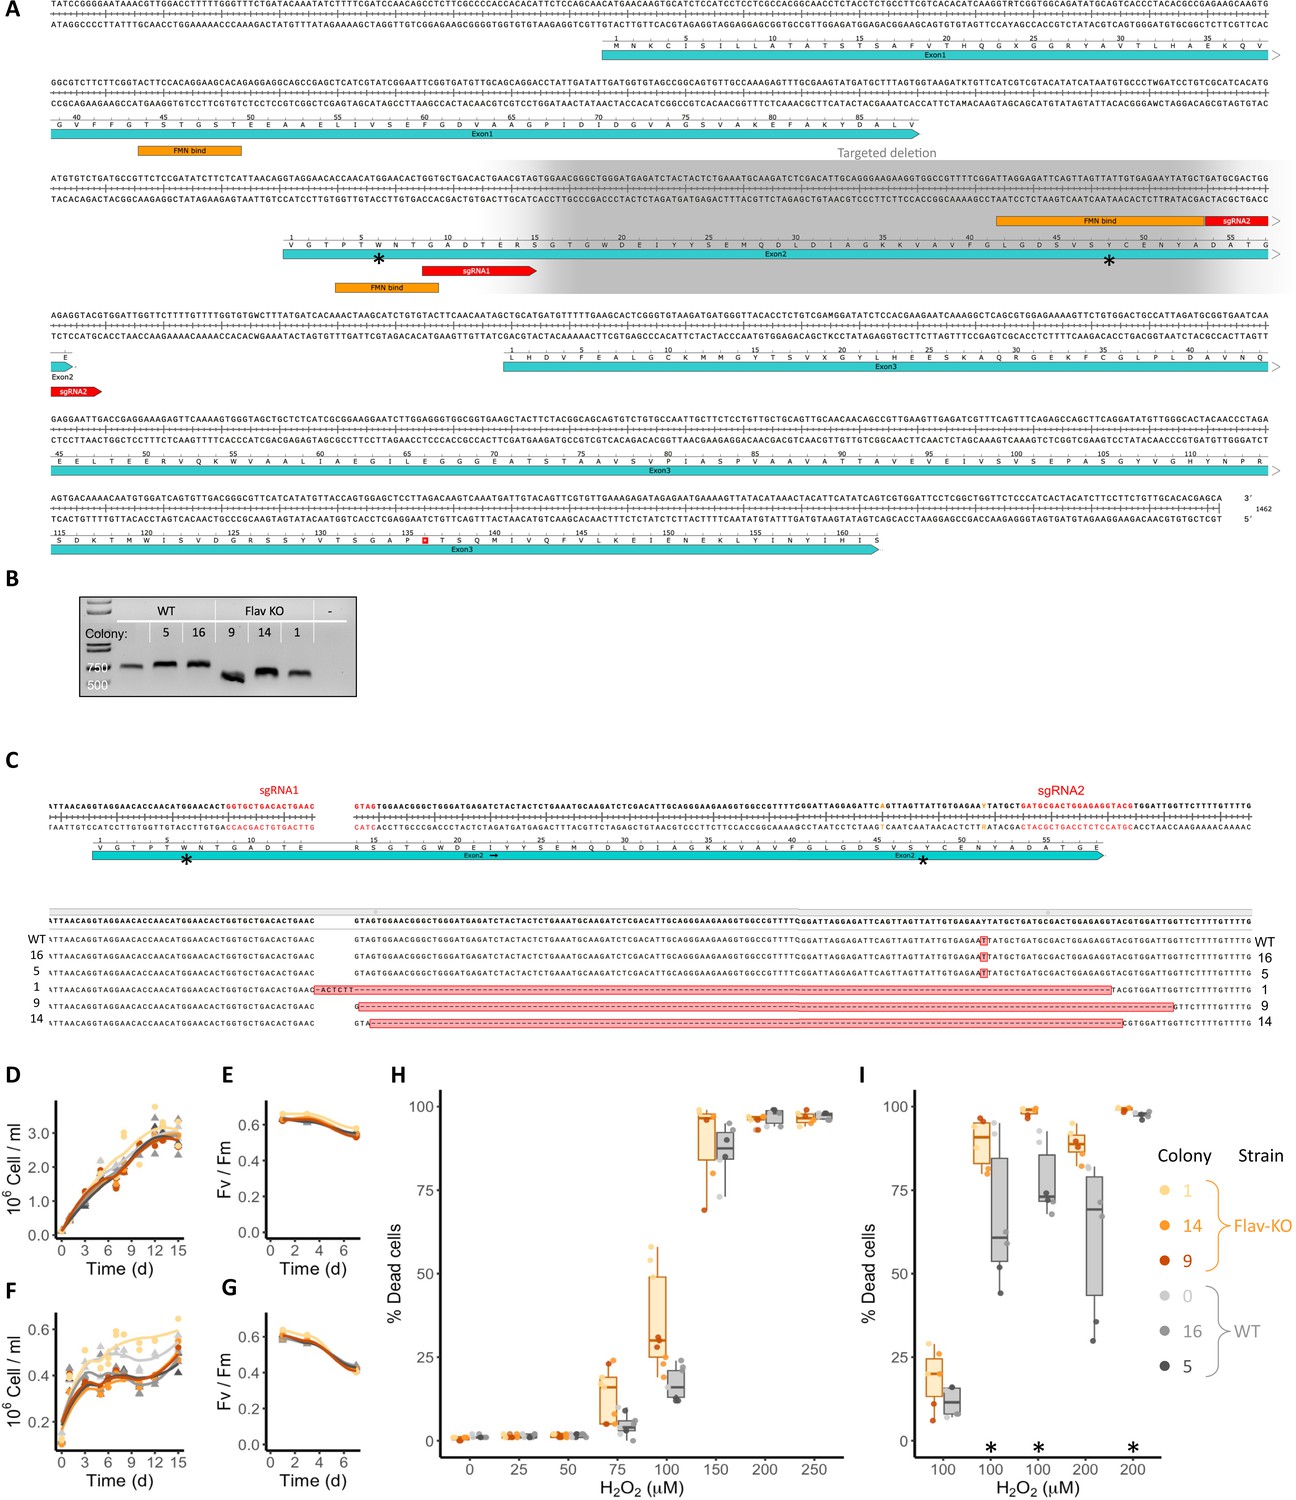
Flavodoxin knock-outs in T. pseudonana.
(A) T. pseudonana flavodoxin (TpFlav) DNA and amino acid sequence, exons (teal), FMN-binding sites (orange), amino acids with side chains that flank the FMN (*) and sgRNAs (red) are marked. Targeted deletion in gray background. FMN-binding sites according to C. crispus flavodoxin (Fukuyama et al., 1992). (B) PCR products from the deletion area of TpFlav in WT and KO cell lines. Lanes from left to right: DNA ladder (size in bp), WT, two WT-like clones (5, 16), three knock-out (Flav KO) clones (9, 14,1), negative control. Uncropped gel in Figure 3—figure supplement 1—source data 1. (C) Sequence of targeted deletion in TpFlav in WT, WT-like (16, 5), Flav KO (1, 9, 14) cells, aligned to the DNA and amino acid sequence. Amino acids with side chains that flank the FMN (*) and sgRNAs (red) are marked. The deletion is marked by red background. Alignments generated and visualized with the SnapGene software. (D–I) The three independent T. pseudonana WT (grays) and Flav KO (oranges) cell lines were grown under iron- replete (D, E, H, I) or iron-limiting (F, G) conditions for several days. (D, F) Cell abundance, measured by flow cytometry for 15 d. (E, G) Photosynthetic efficiency, measured by phytoPAM for 3 out of the 15 d. Individual measurements are marked in symbols, WT, circles, KO, triangles, means of each clone triplicates are indicated with lines. (H, I) Percentage of Sytox Green-positive (dead) cells, measured by flow cytometry 24 hr after treatment with different concentrations of H2O2. Orange and gray box plots represent a Flav-KO and WT, respectively, single measurements are marked, color-coded by the individual colonies. (H) Results of a single dose–response experiment. (I) Results from five additional experiments with only 100 or 200 µM H2O2, experiments marked with an asterisk are summarized in Figure 3C.
-
Figure 3—figure supplement 1—source data 1
Uncropped gel of Figure 3—figure supplement 1B.
Full unedited gel.
- https://cdn.elifesciences.org/articles/84392/elife-84392-fig3-figsupp1-data1-v2.zip
-
Figure 3—figure supplement 1—source data 2
Uncropped gel of Figure 3—figure supplement 1B.
Full gel with the bands clearly labeled.
- https://cdn.elifesciences.org/articles/84392/elife-84392-fig3-figsupp1-data2-v2.zip
Figure 4 with 1 supplement
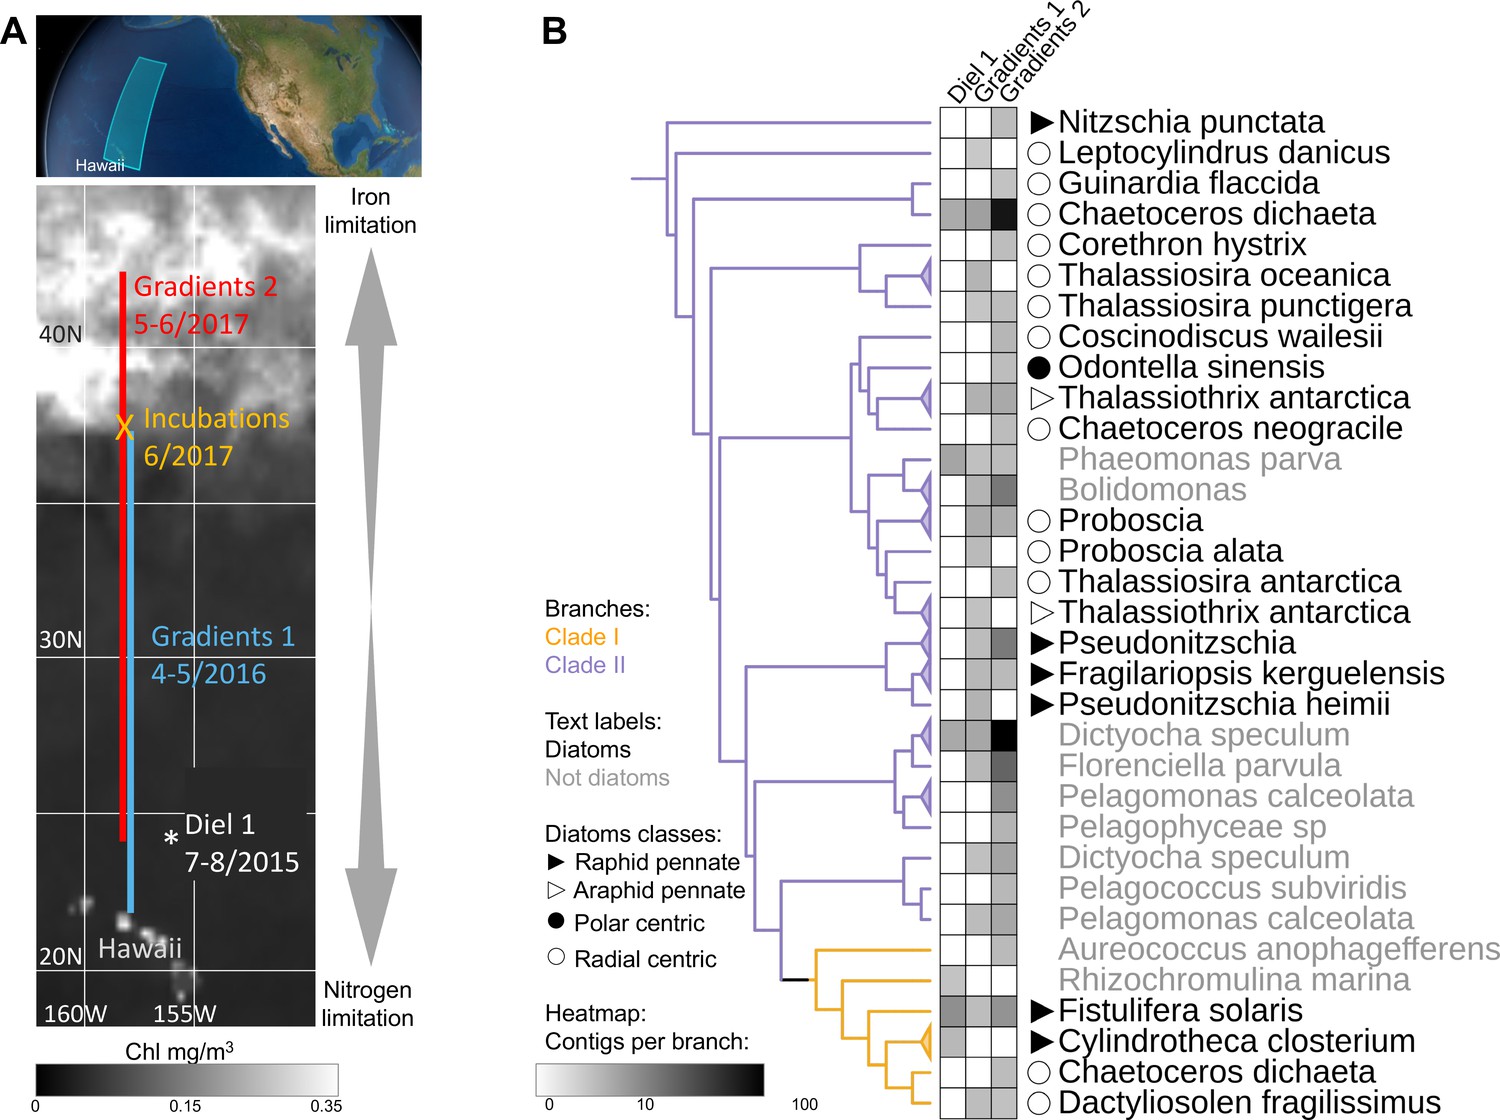
Detection of the two flavodoxin clades in the North Pacific.
(A) Overview of sampling area with a background of satellite, average chlorophyl estimate, from May 9 to June 26, 2017. Data provided by the Ocean Colour Thematic Center at the Copernicus Marine environment monitoring service (CMEMS) and visualized with SimonsCMAP (Ashkezari et al., 2021). Cruise dates (month/year) and locations and the site of the on-deck incubation during Gradients 2 are marked. (B) Heatmap representing the number of stramenopiles clade I or II flavodoxin contigs detected in each cruise placed on the flavodoxin reference phylogenetic tree. Branches consisting of species (and strains) from the same genus were collapsed and marked with triangles at the edges and labeled according to the highest taxonomic rank. The uncollapsed clade I and clade II region of the reference tree with environmental placements is shown in Figure 4—figure supplement 1. Branch colors represent clade I (orange) and clade II (purple). The genus and species names are in black for diatoms or gray for other stramenopiles.
Figure 4—figure supplement 1
Flavodoxins in the North Pacific Ocean maximum-likelihood (RAxML) tree of flavodoxins, with placements of environmental reads from the North Pacific Ocean.
This tree is also represented in Figure 1B, Figure 1—figure supplement 1C, and Figure 4B. Branches are orange for clade I, purple for clade II. Colored strip represents taxonomy, color-coded on the figure. Black symbols represent diatom class: closed triangles – raphid pennates; open triangles – araphid pennates; closed circles – polar centrics; open circles – radial centrics. The genus and species names are in black for diatoms or gray for all other species. Stars represent flavodoxins with expression experimentally tested, open stars indicate induction under iron limitation, red-filled stars indicate no induction under iron limitation. Environmental reads (contigs) placed confidently (like_weight_ratio > 0.8) at genus level or below are shown with pie charts color-coded by cruise. Pie size is proportional to total number of contigs.
Figure 5 with 1 supplement
Transcriptional patterns of diatom flavodoxin genes in the North Pacific.
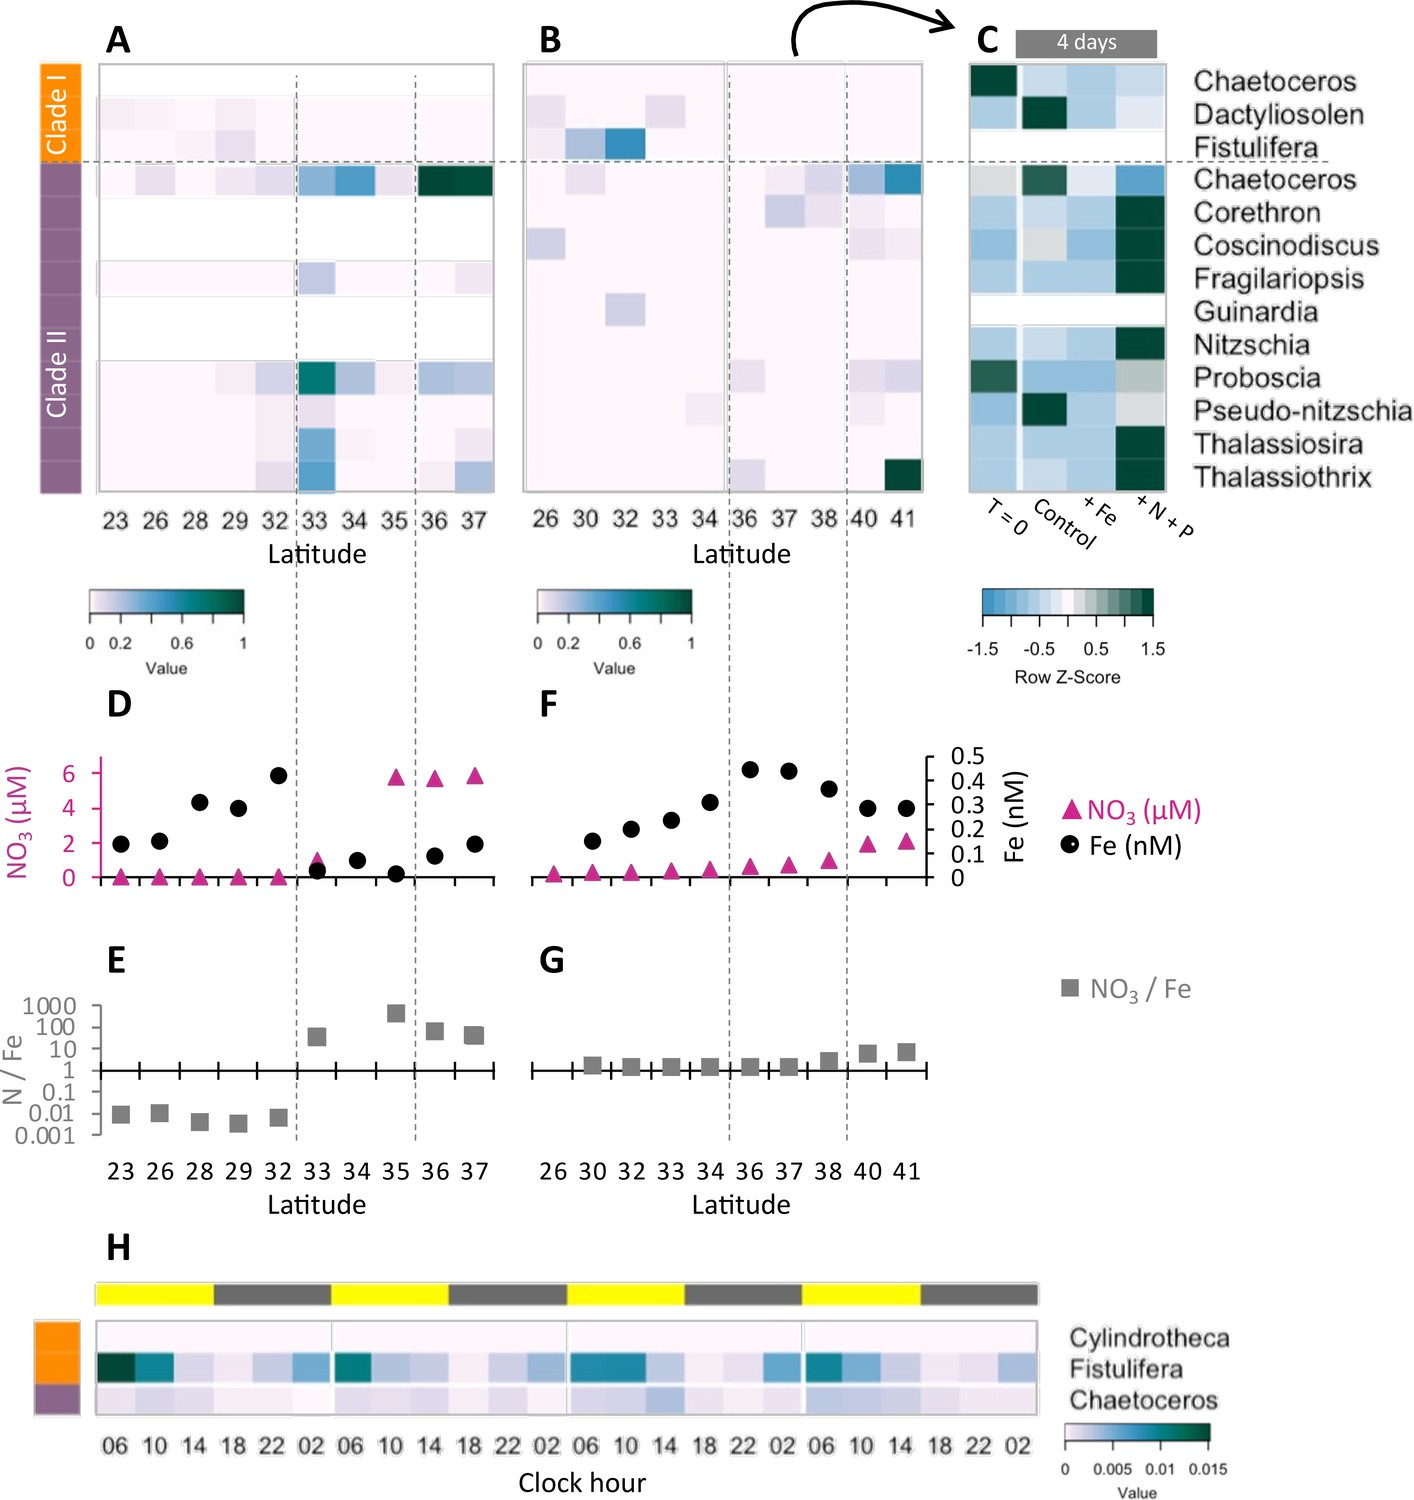
(A, B) Heatmaps of relative diatom flavodoxins transcription across the Gradients 1 transect (A) or Gradients 2 transect (B). Flavodoxin sequence reads per liter were summed at the genus level and normalized to the cumulative number of reads per liter. White rows indicate where flavodoxin transcripts were not detected. (C, E) Total dissolved iron (Fe, black circles) and nitrate (NO3, pink triangles) concentrations across Gradients 1 (C) and Gradients 2 (E) transects (Gradoville et al., 2020; Juranek et al., 2020; Park et al., 2022; Pinedo-González et al., 2020). (D, F) Nitrate to iron ratio (gray rectangles) of these transects. (G) Flavodoxin transcription following nutrient enrichment incubations conducted at Gradients 2, 37°N. Water were sampled at T = 0 and incubated with no added nutrients (Control) or with 1 nM FeCl3 (+Fe), or 5 µM NO3 and 0.5 µM PO4 (+N +P) and sampled for metatranscriptomes after 4 d. Transcripts per liter are row normalized. (H) Diatom relative flavodoxin transcript abundance across the diel cycle, sampled during the Diel 1 cruise. Upper bar represents day (yellow) or night (gray). Side bars represent flavodoxin clade I (orange) or clade II (purple). Note color scale differs from those of (A, B, G).
Figure 5—figure supplement 1
Transcriptional patterns of flavodoxin genes in the North Pacific Ocean.
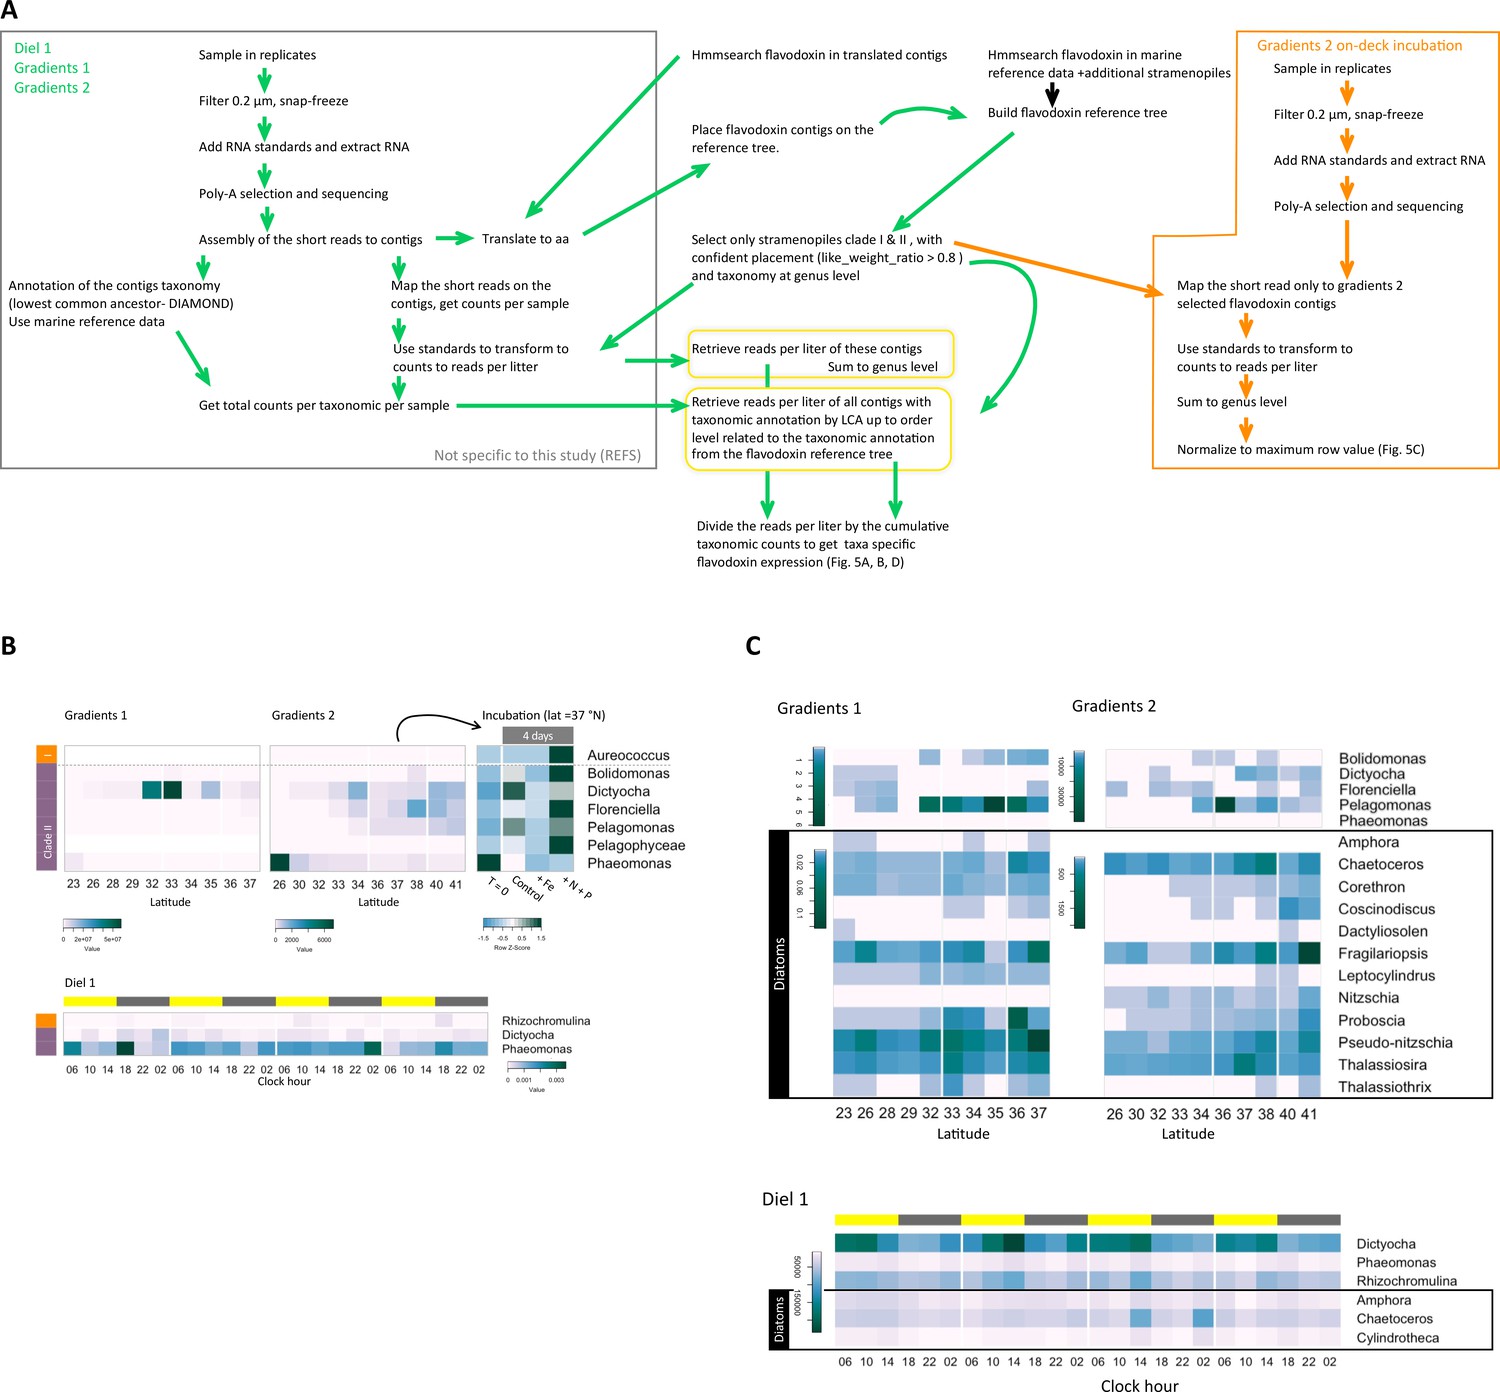
(A) Metatranscriptomes workflow chart for detection, annotation, and quantification of environmental flavodoxins. Left gray box represents analysis carried out prior to this study: RNA extraction, sequencing, assembly, annotation, and quantification (Coesel et al., 2021; Durham et al., 2019; Groussman et al., 2021; Lambert et al., 2022). Central part represents the specific search, annotation, and quantification of flavodoxins. Green arrows represents steps common to analysis of metatranscriptomes from Diel 1, Gradients 1 and 2, the datasets used to quantify flavodoxin reads are highlighted in yellow boxes. Right orange box represents the process specific to the Gradients 2 on-deck incubations. (B) Heatmaps of relative transcript abundances of non-diatom stramenopile flavodoxins across the Gradients 1 and Gradients 2 transects, the on-deck incubation experiment, and the Diel 1 cruise. Flavodoxin sequence reads per liter were summed at the genus level and normalized to the cumulative number of reads per liter at the order level to compare between genera. Note the different color-scale ranges. In the incubation experiment, transcripts per liter were summed at the genus level and normalized to cumulative number of reads per liter at the genus level to compare within each genus. Upper bar represents daytime (yellow) or night (gray). Side bars represent flavodoxin clade I (orange) or clade II (purple). Each panel was color-scaled separately for better visualization (see separate color keys). White rows indicate genera-level flavodoxins that were not detected in a given cruise. (C) Cumulative counts per genus across the Gradients transects and the Diel 1 cruise. Stramenopiles genera with detected flavodoxins are presented. Each cruise and diatom or non-diatoms are color-scaled separately for visualization.
Additional files
-
Supplementary file 1
Supplementary tables.
(a) Diatoms flavodoxins expression from the literature. Species name, original paper, and the specific information about flavodoxin gene ID and the expression in each paper are indicated. (b) Information about the species and strains with clade I or clade II flavodoxins. Includes sequence id, taxonomy, data type (genome or transcriptome), isolate location and growth temperature (from culture collections NCMA or RCC when possible, from manuscript describing the isolate when possible). Reference for relevant transcriptome when available, number of flavodoxins from each clade in the phylogenetic trees (# clade I/II). Number of similar flavodoxins that were remove from the alignment due to high sequence similarity (Removed* clade I/II). Strains presented in Figure 1A (yes), or within the stramenopiles added for Figure 1B. (c) Diatom species, with information about the exact isolates, growth, and harvesting conditions for the different transcriptomes done in this study. (d) Stramenopiles flavodoxins transcription in the North Pacific, data presented in Figure 5. Stramenopiles flavodoxins transcription across the Gradients 1 transect, R/V Kaimikai O Kanaloa, KOK1606 (April/May 2016), and Gradients 2 transect, R/V Langseth, MGL1704. Flavodoxin sequence reads per liter were summed at the genus level and normalized to the cumulative number of reads per liter at the order level to compare between genera. Stramenopiles flavodoxin transcription following nutrient enrichment incubations conducted at Gradients 2, station 11, 37°N. Water samples were sample at T = 0 and incubated with no added nutrients (Control) or with 1 nM FeCl3 (+Fe), or 5 µM NO3 and 0.5 µM PO4 (+N + P) sampled for metatranscriptomes after 4 d. Transcripts per liter were summed at the genus level. (e). Primers used for Golden Gate cloning, plasmid verification, and deletion scan and sequencing of T. pseudonana flavodoxin gene.
- https://cdn.elifesciences.org/articles/84392/elife-84392-supp1-v2.xlsx
-
Supplementary file 2
Supplementary fasta files.
Supplemental fasta file 1: Amino acid sequence alignments of flavodoxin PF00258 and P. tricornutum, T. pseudonana, and T. oceanica, used to generate the hmm-profile. Supplemental fasta file 2:Amino acid sequence alignments of flavodoxins used to create the phylogenetic tree in Figure 1A. Supplemental fasta file 3: Amino acid sequence alignments of flavodoxins used to create the phylogenetic tree in Figure 1B. Supplemental fasta file 4: Amino acid sequence alignments of stramenopiles flavodoxins aligned to Chondrus crispus flavodoxin, used for Figure 1—figure supplement 1F. All the above are aligned and trimmed. Supplemental fasta file 5: Flavodoxins sequences used to detect flavodoxins in Amphora, Cylindrotheca, and Chaetoceros transcriptomes, and detected flavodoxins in those species.
- https://cdn.elifesciences.org/articles/84392/elife-84392-supp2-v2.zip
-
MDAR checklist
- https://cdn.elifesciences.org/articles/84392/elife-84392-mdarchecklist1-v2.pdf
Download links
A two-part list of links to download the article, or parts of the article, in various formats.
Downloads (link to download the article as PDF)
Open citations (links to open the citations from this article in various online reference manager services)
Cite this article (links to download the citations from this article in formats compatible with various reference manager tools)
Divergent functions of two clades of flavodoxin in diatoms mitigate oxidative stress and iron limitation
eLife 12:e84392.
https://doi.org/10.7554/eLife.84392


