The Calpain-7 protease functions together with the ESCRT-III protein IST1 within the midbody to regulate the timing and completion of abscission
- Department of Biochemistry, University of Utah School of Medicine, United States
- Department of Oncological Sciences, Huntsman Cancer Institute, University of Utah, United States
Figures
Figure 1 with 4 supplements
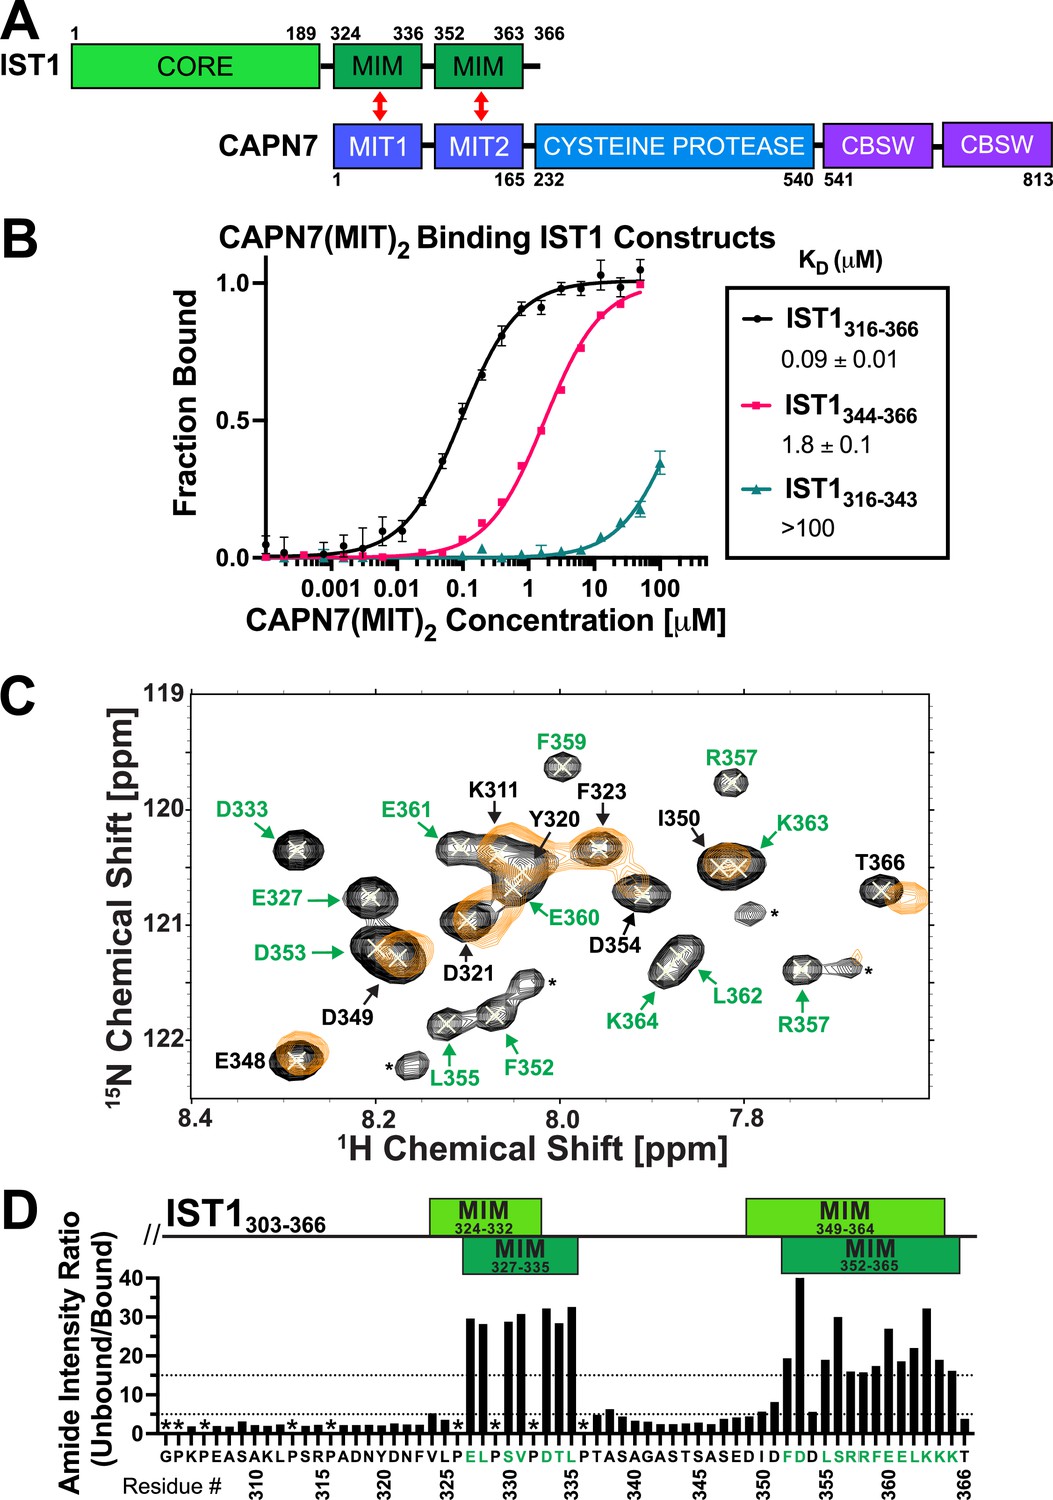
CAPN7 binds IST1 through tandem microtubule-interacting and trafficking (MIT) domains.
(A) Domain organization of CAPN7 and IST1, depicting the binding interaction between tandem MIT domains of CAPN7 and MIT-interacting motif (MIM) elements of IST1 (red double-headed arrows). Domain definitions: CORE, helical ESCRT-III core domain of IST1 that functions in filament formation; CBSW, tandem calpain-type beta sandwich domains of CAPN7. (B) Fluorescence polarization anisotropy binding isotherms showing CAPN7(MIT)2 binding to IST1 constructs spanning tandem or individual MIM elements (IST316-366, IST1316-343, and IST1344-366, respectively). Isotherm data points and dissociation constants (KD) are averages ± standard error of the mean from three independent experiments. Error bars on the IST1344-366 isotherm are entirely masked by the data symbols. (C) NMR mapping of the CAPN7(MIT)2 binding sites on IST1303-366. Sections of overlaid HSQC spectra of free IST1303-366 (black contours) and IST1303-366 saturated with 1.3 molar equivalents of CAPN7(MIT)2 (orange contours) are shown. Amide NH resonances in the unbound state (black contours) that lack bound state resonances (orange contours) correspond to residues that experience large intensity perturbations upon CAPN7 binding (amino acid residue labels in green). In contrast, strong resonances that overlap well in both the unbound and bound states (black and orange contours) correspond to residues that experience smaller intensity perturbations upon CAPN7 binding (amino acid residue labels in black) (see Figure 1—figure supplement 2 for the entire spectra). (D) Amide intensity ratios (unbound/bound) for each residue of the IST1303-366 peptide. Small ratios (<5, 30 residues, lower dotted line) correspond to residues that remain dynamic in the complex, whereas large ratios (>15, 20 residues, upper dotted line) correspond to residues whose dynamics are reduced upon complex formation (and therefore likely contact CAPN7(MIT)2 and/or become ordered upon binding). Proline residues were not scored (asterisks). IST1 MIM elements show either the bounds of interpretable electron density from the crystal structure of the complex (top boxes, light green, see Figure 2 and Figure 2—figure supplement 1) or the bounds of the complex as defined by NMR resonance intensity changes (bottom boxes, dark green, see (C) and Figure 1—figure supplement 2).
Figure 1—figure supplement 1
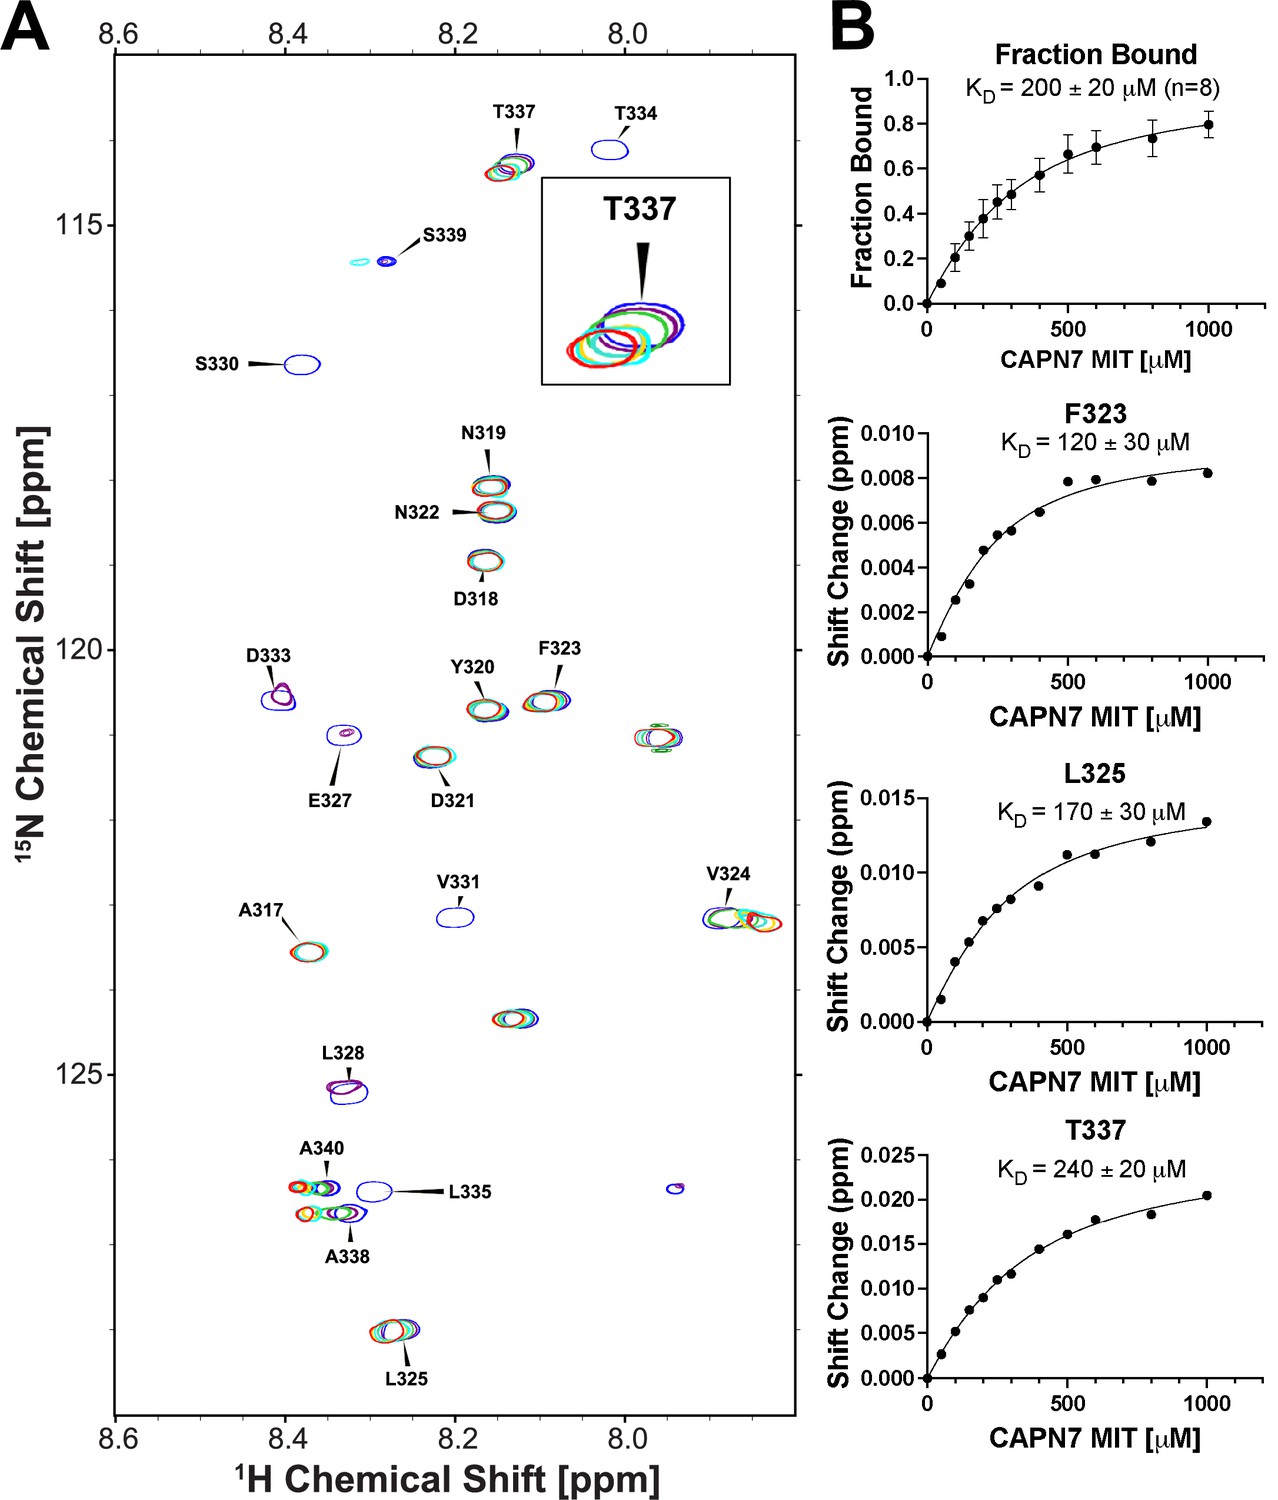
NMR titration of 15N-labeled IST1314-343 with unlabeled CAPN71-75.
(A) Overlaid 2D [1H,15N]-HSQC NMR spectra showing 15N-labeled IST1314-343 resonances across a CAPN71-75 titration. Resonances are color coded from blue (no CAPN71-75) to red (five molar equivalents of CAPN71-75). Five residues displayed chemical shift changes and fast-exchange kinetics that were suitable for fitting to binding isotherms: F323, L325, T337, A338, and A340. Inset image: magnified view of the overlaid T337 resonance showing fast-exchange kinetics. (B) Top panel: binding isotherm obtained from a global fit of the spectral shifts from the five fast-exchange residues listed in (A) above. Only 1H shifts were analyzed for the A338 and A340 resonances because their 15N shifts were too small to fit. Bottom panels: binding isotherms demonstrating the quality of fits from 1H and 15N chemical shifts from three individual residues. Shift change (y-axis) refers to the combined 1H and 15N chemical shifts (see ‘Materials and methods’ for calculation).
Figure 1—figure supplement 2
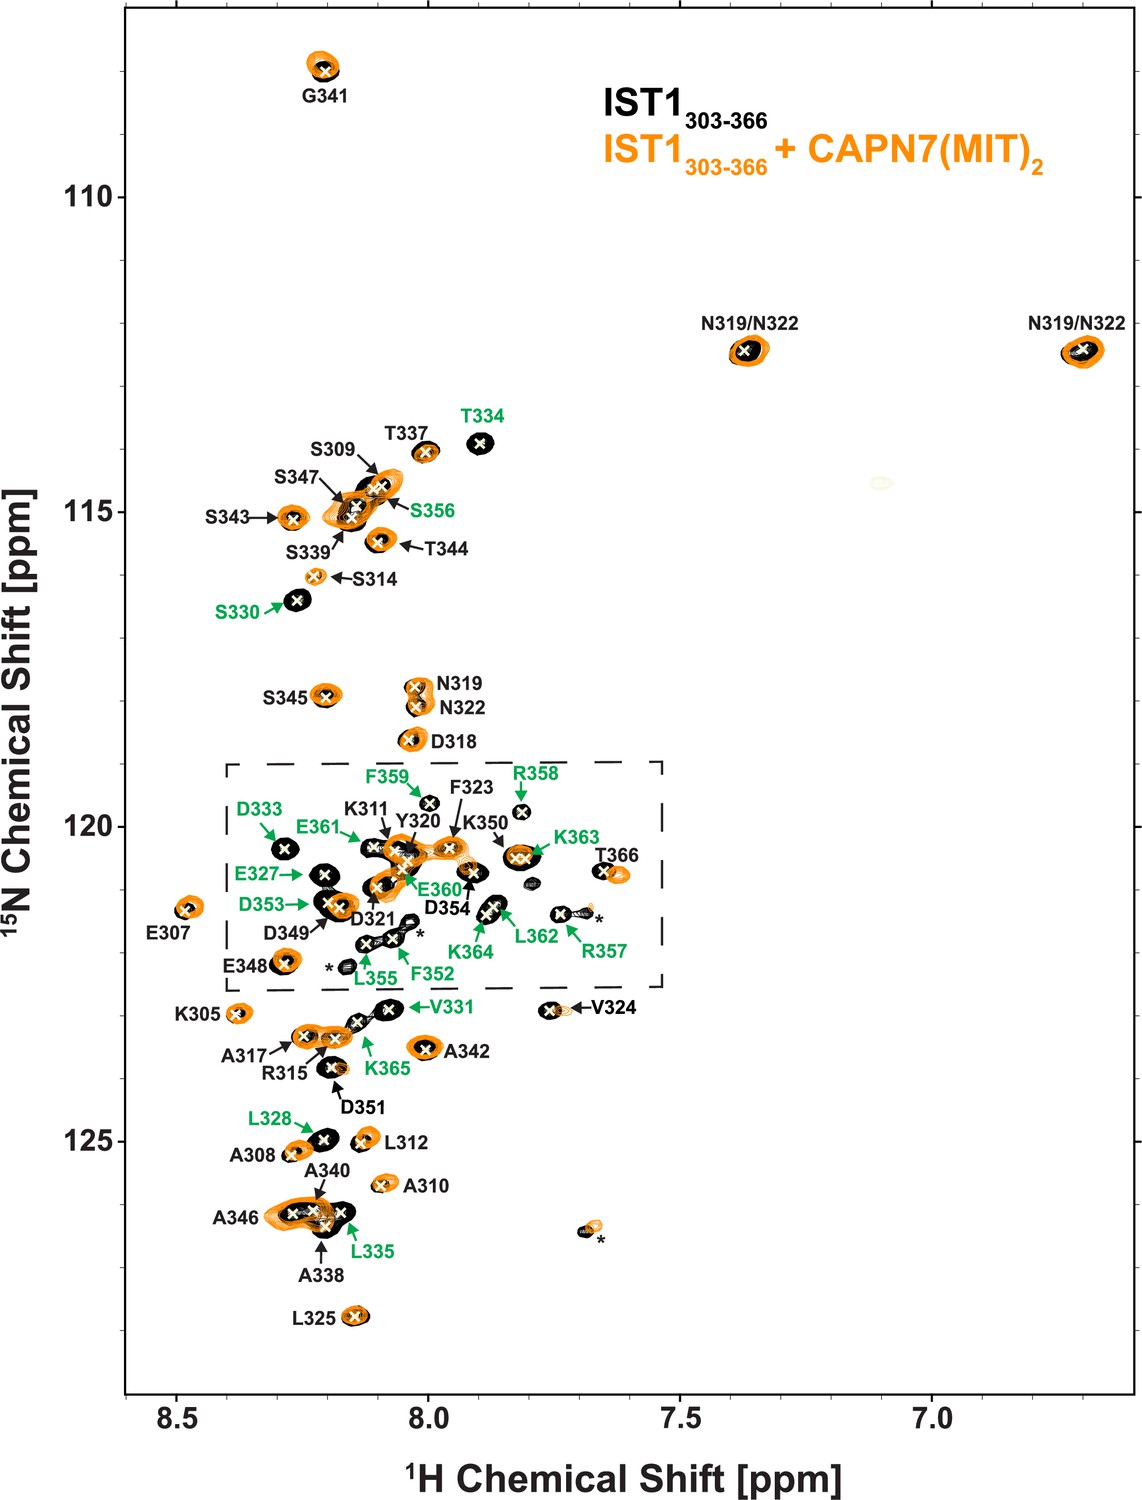
NMR spectra of free and CAPN7(MIT)2-bound 15N-labeled IST1303-366.
Overlaid 2D [15N,1H]-HSQC spectra from uniformly 15N-labeled IST1303-366 in the absence (black contours) and presence (orange contours) of a 1.3-fold molar excess of CAPN7(MIT)2. Resonance color coding matches Figure 1B (the boxed region in this figure). Asterisks denote unassigned NH signals arising from proline cis/trans isomerization or degradation.
Figure 1—figure supplement 3
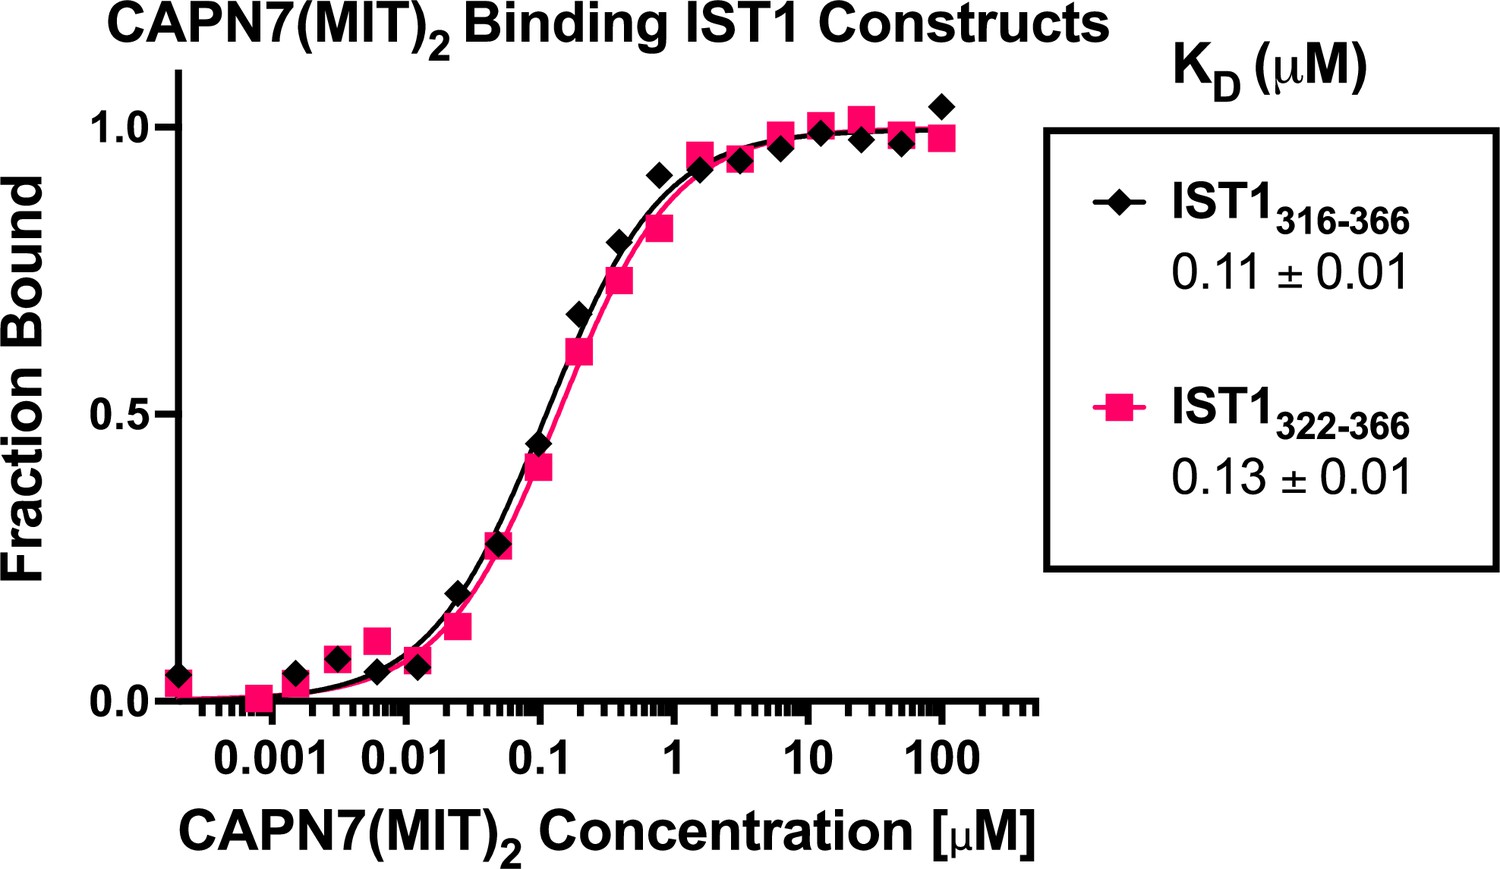
CAPN7(MIT)2 binds equally well to IST1316-366 and the minimal IST1322-366 construct.
Fluorescence polarization anisotropy binding isotherms showing CAPN7(MIT)2 binding to fluorescently labeled peptides spanning IST1316-366 or the minimal construct defined by NMR chemical shift mapping (IST1322-366). Isotherm data points and dissociation constants (KD) are averages ± standard error of the mean from three independent experiments.
Figure 1—figure supplement 4
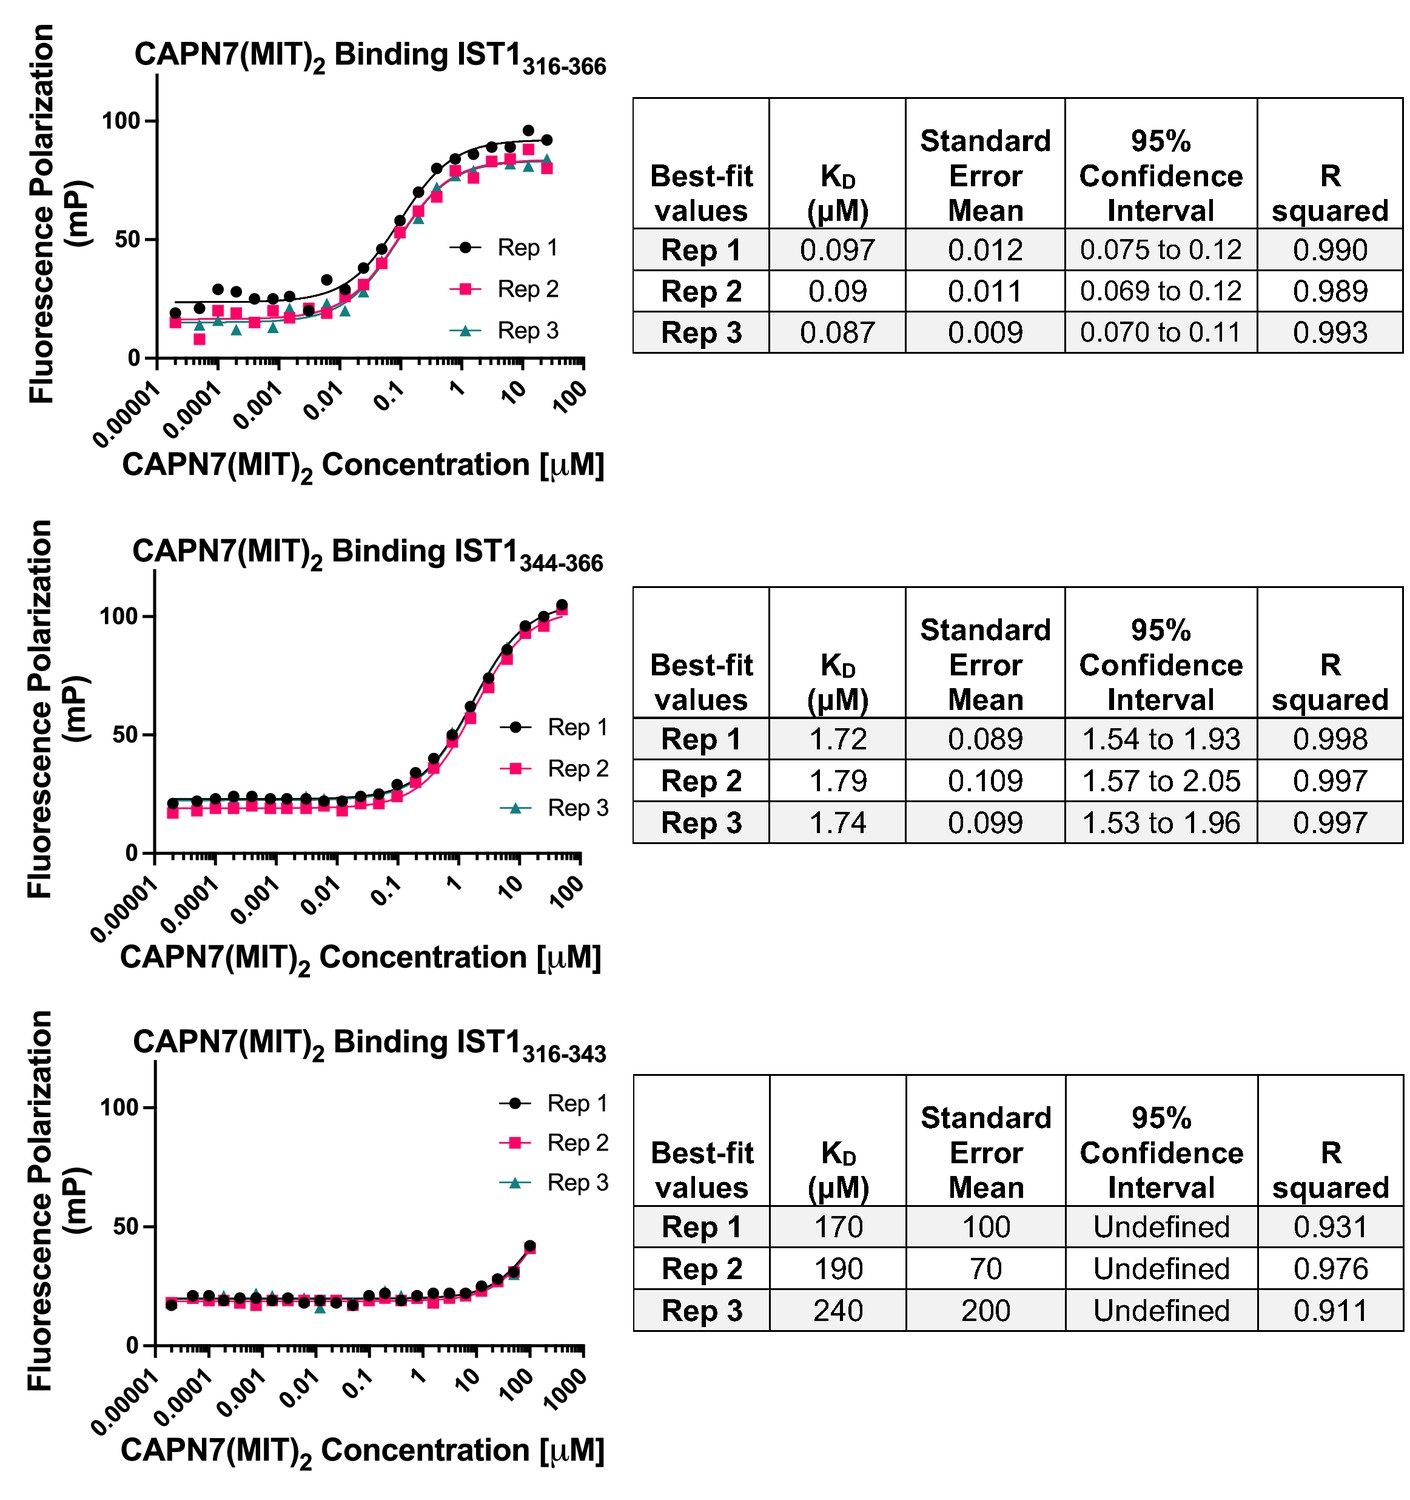
Raw fluorescence polarization anisotropy binding isotherms, best-fit models, and associated statistics corresponding to the normalized binding isotherms presented in Figure 1B.
Figure 2 with 3 supplements
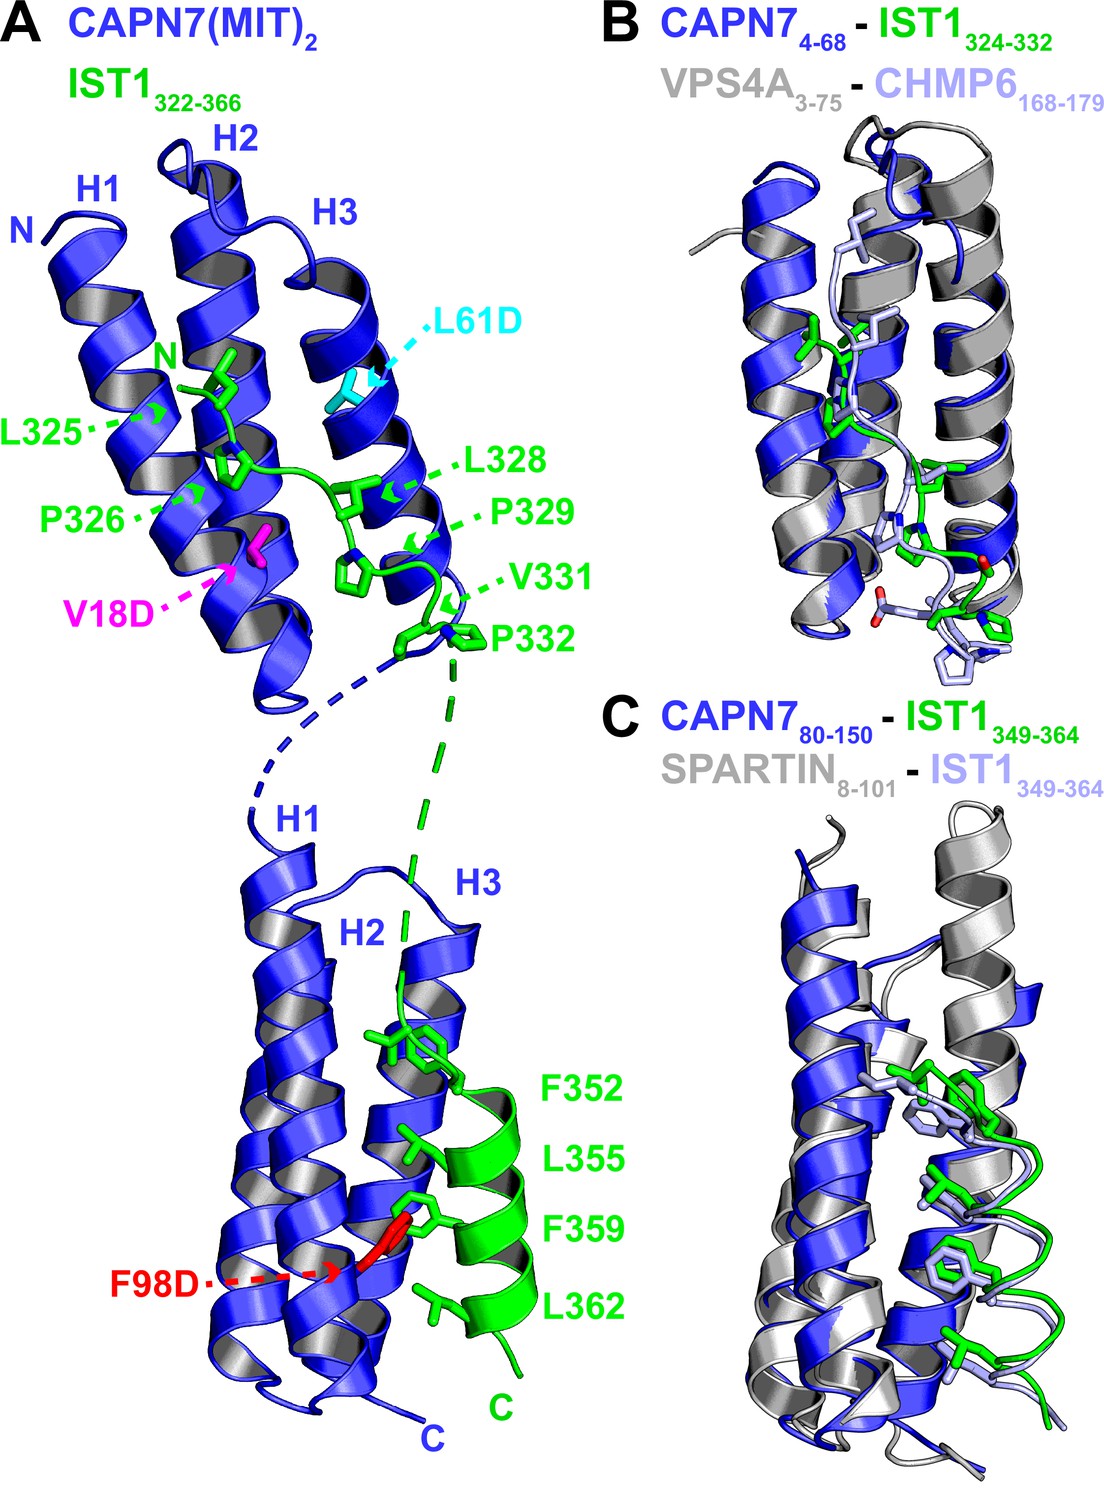
Crystal structure of the CAPN7(MIT)2-IST1322-366 complex.
(A) Ribbon representation of CAPN7(MIT)2 (blue) in complex with IST1322-366 (green, with buried core interface sidechains shown) (PDB 8UC6). Locations of residues that were mutated in CAPN7(MIT)2 are shown in magenta, turquoise, and red. Dashed lines show CAPN7 and IST1 residues that lack well-defined electron density (see ‘Materials and methods’). (B) Structure of the CAPN74-68–IST1324-332 complex (blue and green) overlaid with the structure of VPS4A3-75-CHMP6168-179 MIM complex (gray and light blue, PDB 2K3W). Note the similar binding type 2 MIT-MIM binding modes. (C) Structure of the CAPN780-150-IST1352-363 complex (blue and green) overlaid with the structure of SPARTIN8-101-IST1352-363 complex (gray and light blue, PDB 4U7I). Note the similar type 3 MIT-MIM binding modes.
Figure 2—figure supplement 1
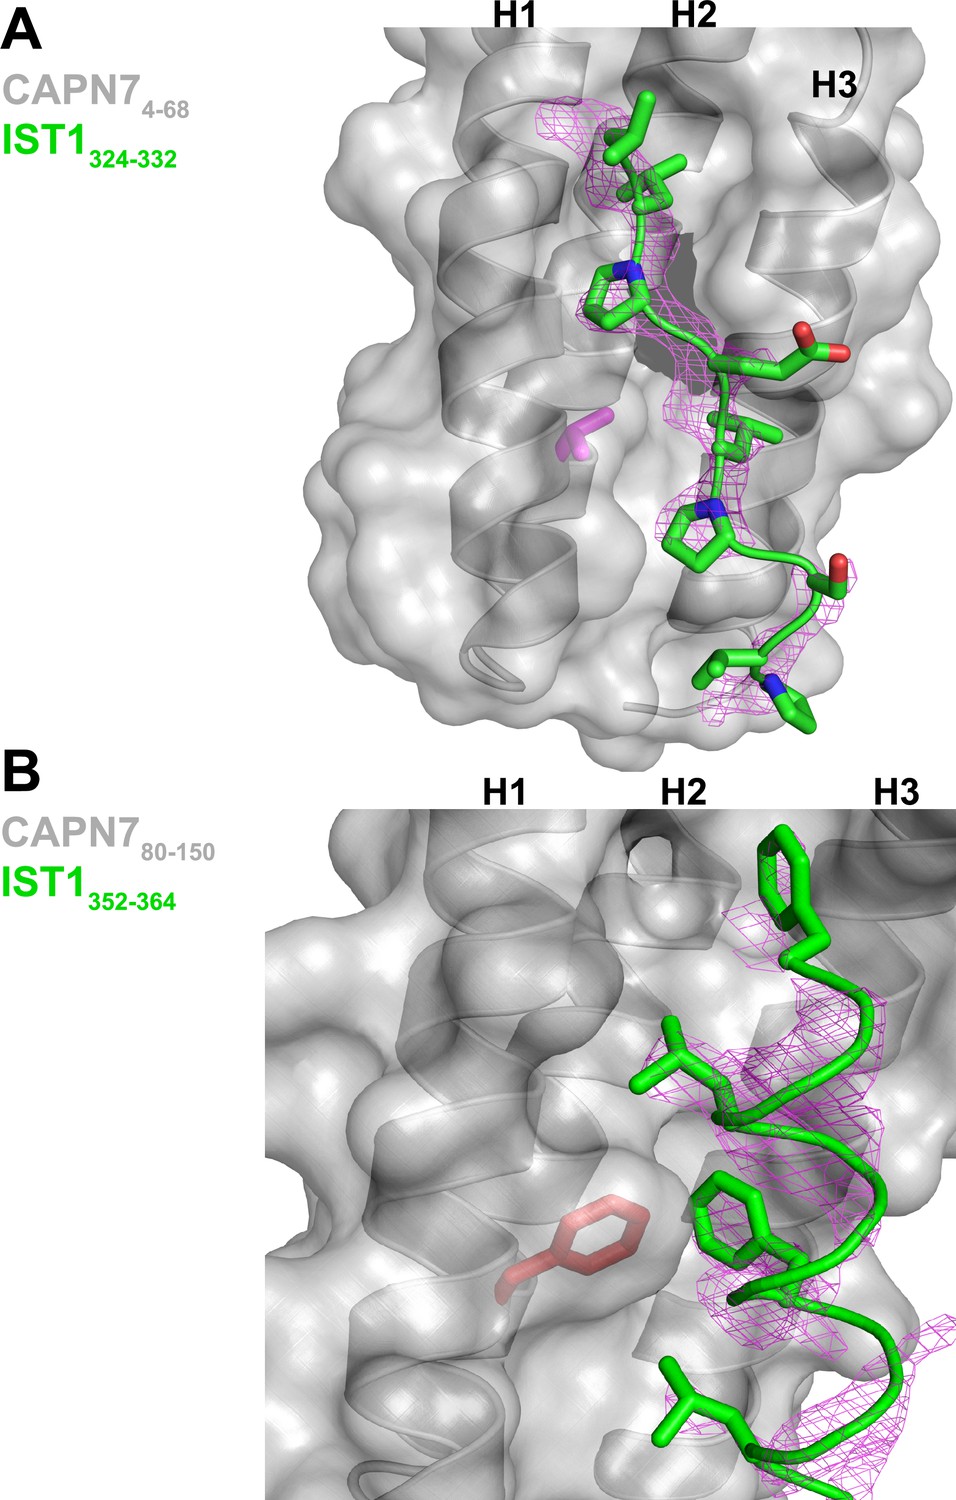
Unbiased electron density omit map for IST1322-366.
(A) IST1324-332 Fo-Fc omit map (magenta, contoured at 2.0 σ) overlaid with the CAPN74-68-IST1324-332 complex. The CAPN7 Val18 residue is highlighted in magenta. (B) IST1349-364 Fo-Fc omit map (magenta, contoured at 2.0 σ) overlaid with the CAPN780-150– IST1349-364 complex. The CAPN7 Phe98 residue is highlighted in red.
Figure 2—figure supplement 2
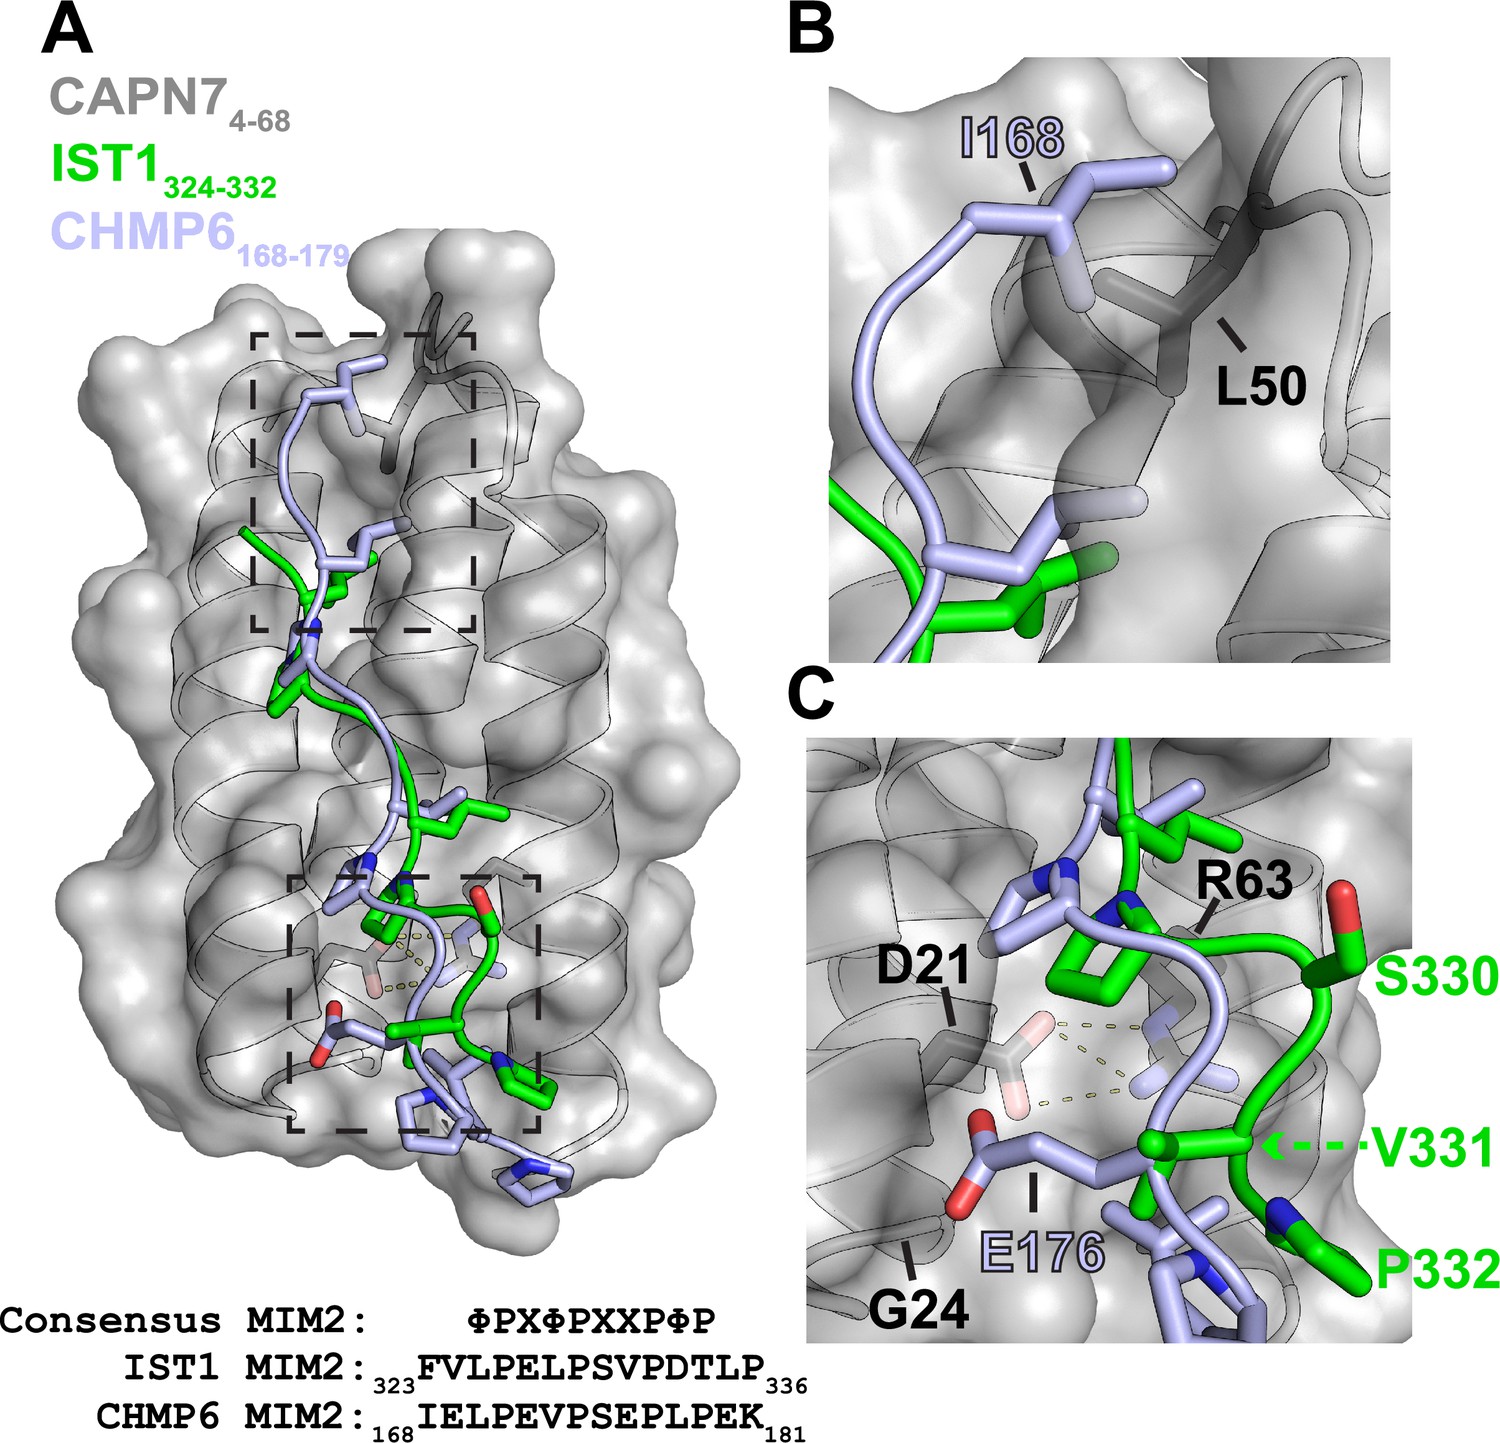
Alignment of IST1325-336 and CHMP6168-179 in the CAPN74-68 binding groove.
(A) Structural alignment of the CAPN74-68–IST1324-332 complex (gray and green) with CHMP6168-179 (light blue) from the VPS4A3-75-CHMP6168-179 complex (PDB 2K3W). CAPN74-68 is shown as a surface representation in gray with relevant sidechains shown in black. Note the similarities in the core binding region of IST1324-332 and CHMP6168-179. Dashed boxes show regions magnified to highlight the sequence divergence of IST1324-332 and CHMP6168-179 in panels (B) and (C). Bottom: sequence alignment between IST1, CHMP6, and the consensus type 2 MIM (MIM2) sequence (Kojima et al., 2016) (Φ represents hydrophobic residues and X polar residues). (B) Zoomed view of the N-terminal region of CHMP6168-179 to highlight the clash that would occur between Ile168 and Leu50 of CAPN7. IST1324-332 has no modeled residues in this region owing to a lack of interpretable electron density. (C) Zoomed view of the C-terminal region of CHMP6168-179 to highlight how Glu176 would make unfavorable interactions in the hydrophobic groove of CAPN7. VPS4A has a Lys23 in place of CAPN7 Gly24, which instead stabilizes CHMP6 Glu176 via salt bridge formation.
Figure 2—figure supplement 3
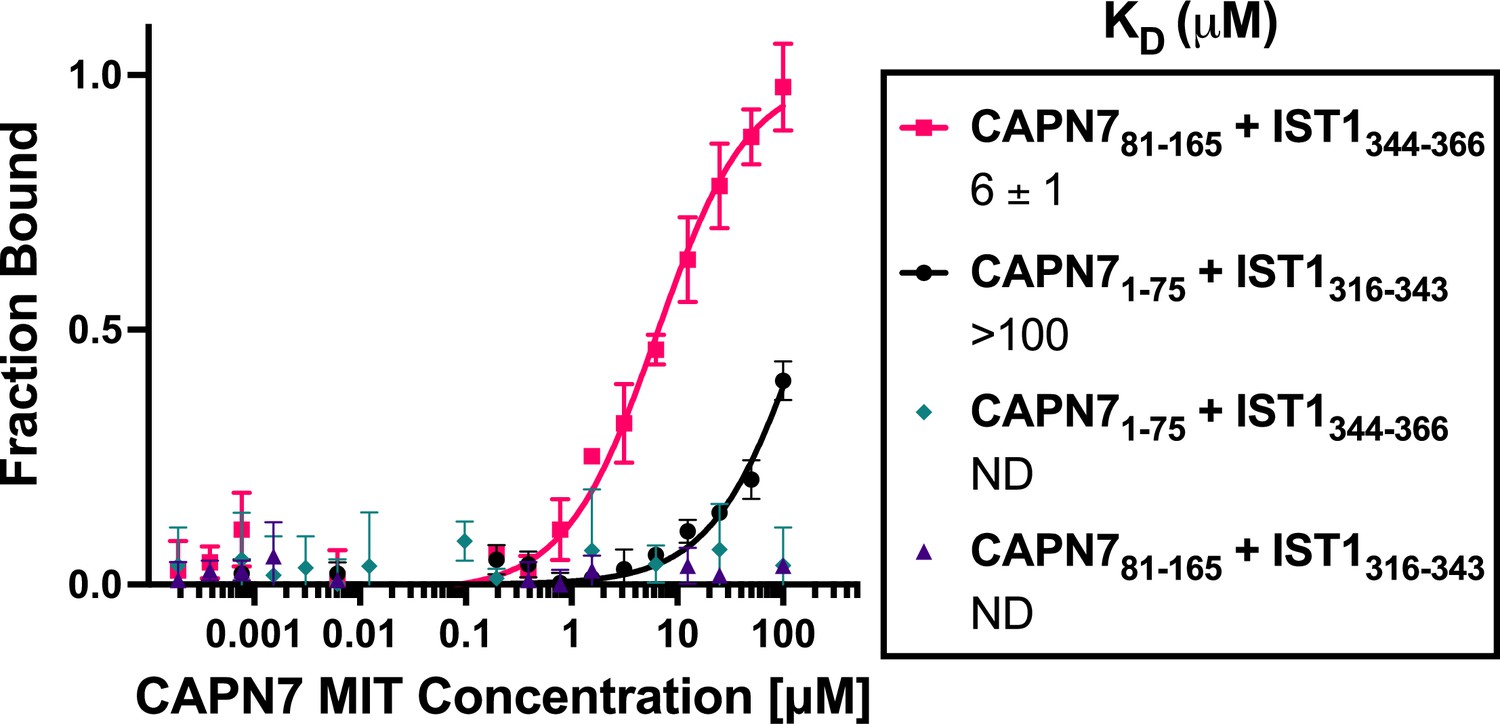
Binding isotherms for individual CAPN7 microtubule-interacting and trafficking (MIT) domains binding to individual IST1 MIT-interacting motif (MIM) elements.
Fluorescence polarization anisotropy binding isotherms show individual CAPN7 MIT domains binding to individual fluorescently labeled IST1 peptides spanning the N-terminal (IST1316-343) or C-terminal (IST1344-366) MIM elements. Isotherm data points and dissociation constants (KD) are averages ± standard error of the mean from three independent experiments. ND: not determined (see ‘Materials and methods’).
Figure 3 with 3 supplements
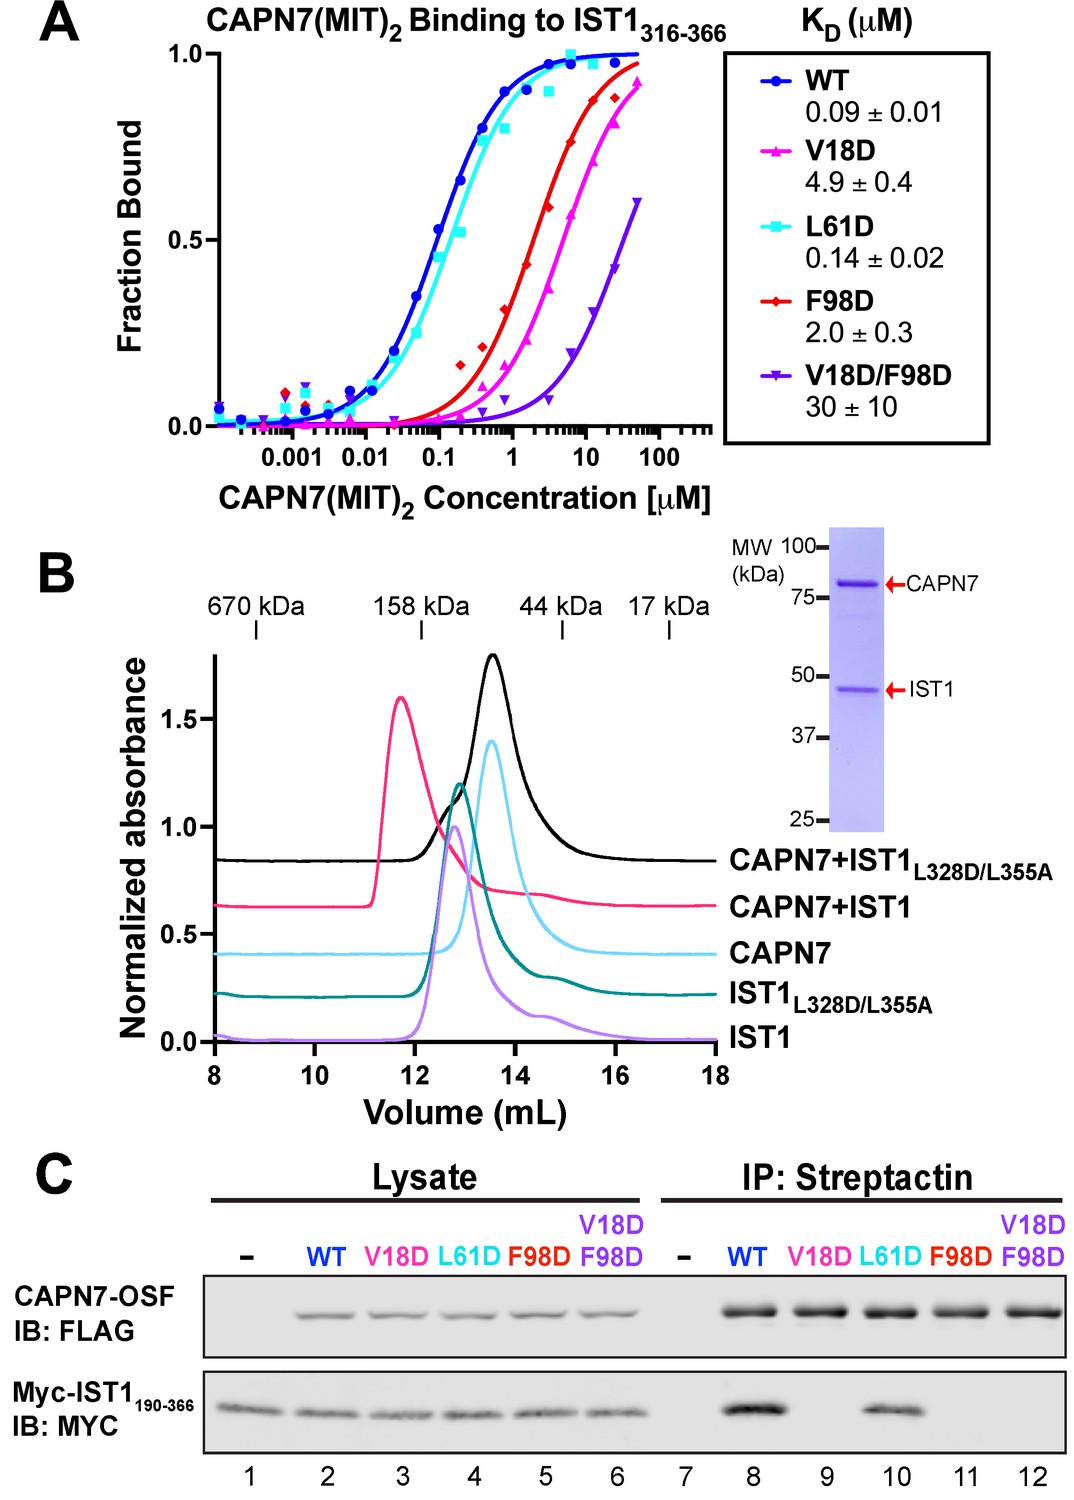
Mutational analyses of the CAPN7-IST1 complex.
(A) Fluorescence polarization anisotropy binding isotherms showing CAPN7(MIT)2 constructs binding to IST1316-366. Isotherm data points and dissociation constants are means from three independent experiments ± standard error of the mean. WT, V18D, and F98D binding isotherms are reproduced from Wenzel et al., 2022 for comparison. (B) Size-exclusion chromatography binding analyses of free proteins or 1:1 mixtures of full-length CAPN7 with WT (black) or L328D/L355A mutant (green) full-length IST1. Note that the IST1 mutations disrupt CAPN7-IST1 complex formation. Inset image shows a Coomassie-stained SDS-PAGE gel of the peak fraction from the CAPN7+ IST1 chromatogram. (C) Co-immunoprecipitation of Myc-IST1190-366 with the indicated full-length CAPN7-OSF constructs from extracts of transfected HEK293T cells.
-
Figure 3—source data 1
Annotated and uncropped Coomassie-stained SDS-PAGE for Figure 3B.
- https://cdn.elifesciences.org/articles/84515/elife-84515-fig3-data1-v2.zip
-
Figure 3—source data 2
Annotated and uncropped western blots and raw images for Figure 3C.
- https://cdn.elifesciences.org/articles/84515/elife-84515-fig3-data2-v2.zip
Figure 3—figure supplement 1
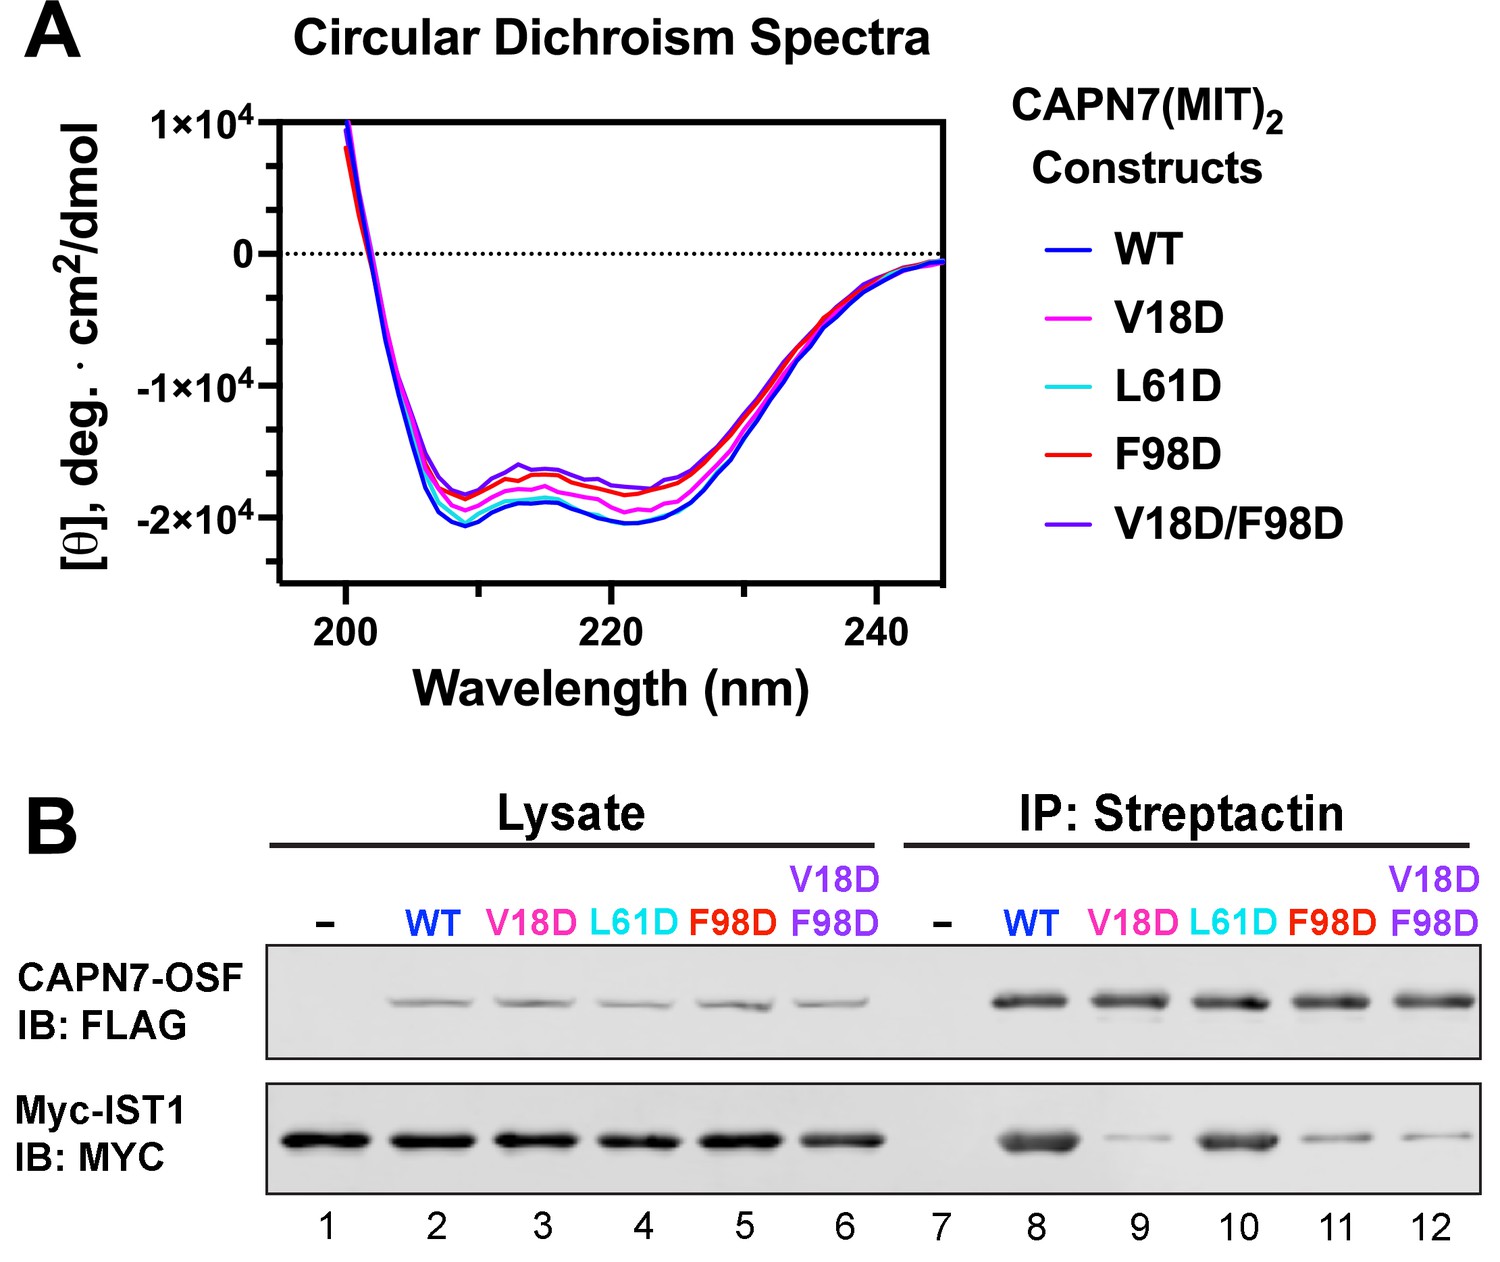
Circular dichroism spectra of recombinant CAPN7(MIT)2 proteins and co-immunoprecipitation of full-length CAPN7 and full-length IST1 from cells.
(A) Circular dichroism spectra of purified, recombinant wt and mutant CAPN7(MIT)2 proteins. Spectra are displayed as the mean of triplicate measurements. (B) Co-immunoprecipitation of full-length Myc-IST1 and the indicated full-length CAPN7-OSF proteins from extracts of transfected HEK293T cells. Note that the full-length Myc-IST1 showed modest levels of background binding, even when the IST1-binding MIT domains of CAPN7 were mutated.
-
Figure 3—figure supplement 1—source data 1
Annotated and uncropped western blots and raw images for Figure 3—figure supplement 1B.
- https://cdn.elifesciences.org/articles/84515/elife-84515-fig3-figsupp1-data1-v2.zip
Figure 3—figure supplement 2
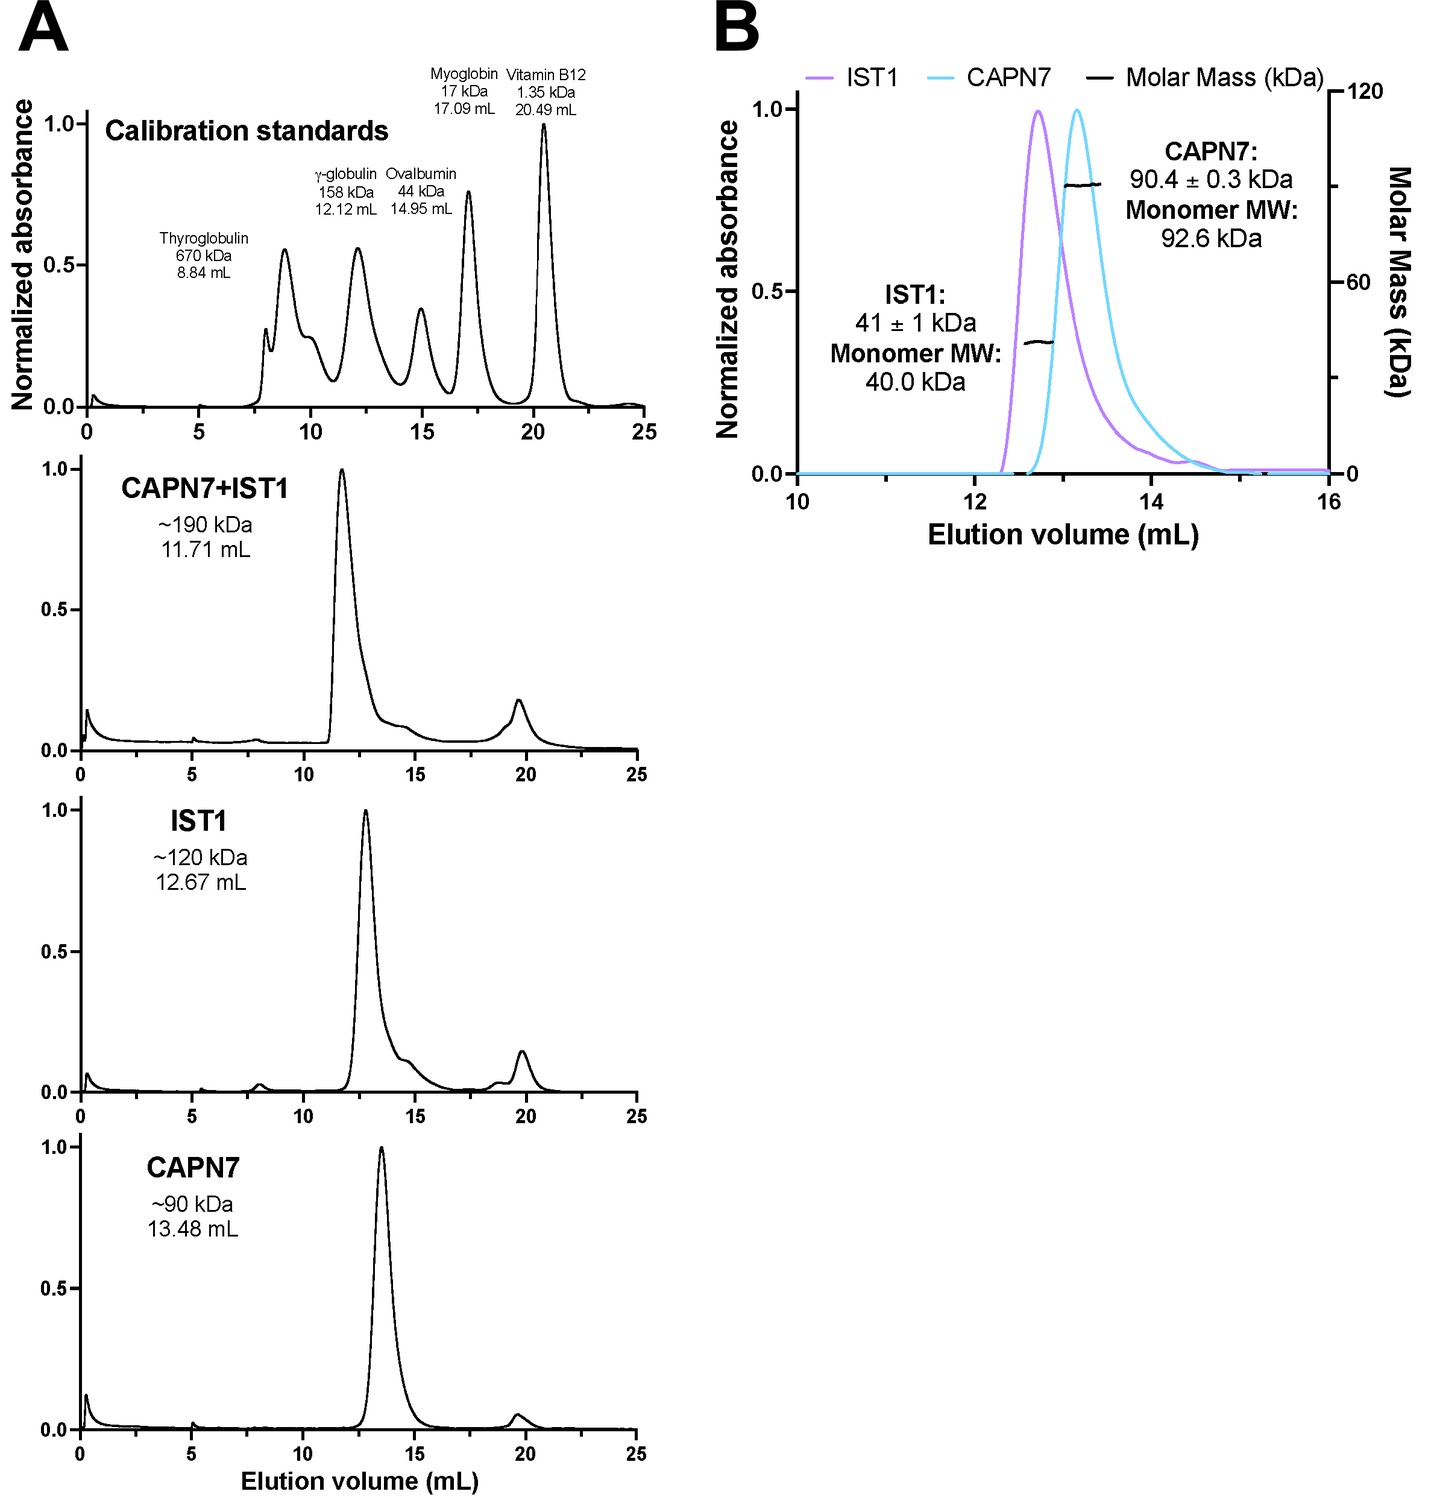
Size-exclusion chromatographic analyses of CAPN7 and IST1 complex formation.
(A) Calibration and individual protein chromatograms showing the elution volume of each peak and its corresponding molecular weight estimation from the calibration on a S200 Superdex column. Note that IST1 appears to elute at 120 kDa despite its mass of 40 kDa. (B) SEC-MALS analysis of IST1 and CAPN7 showing that both proteins elute as monomers from the S200 Superdex column.
Figure 3—figure supplement 3
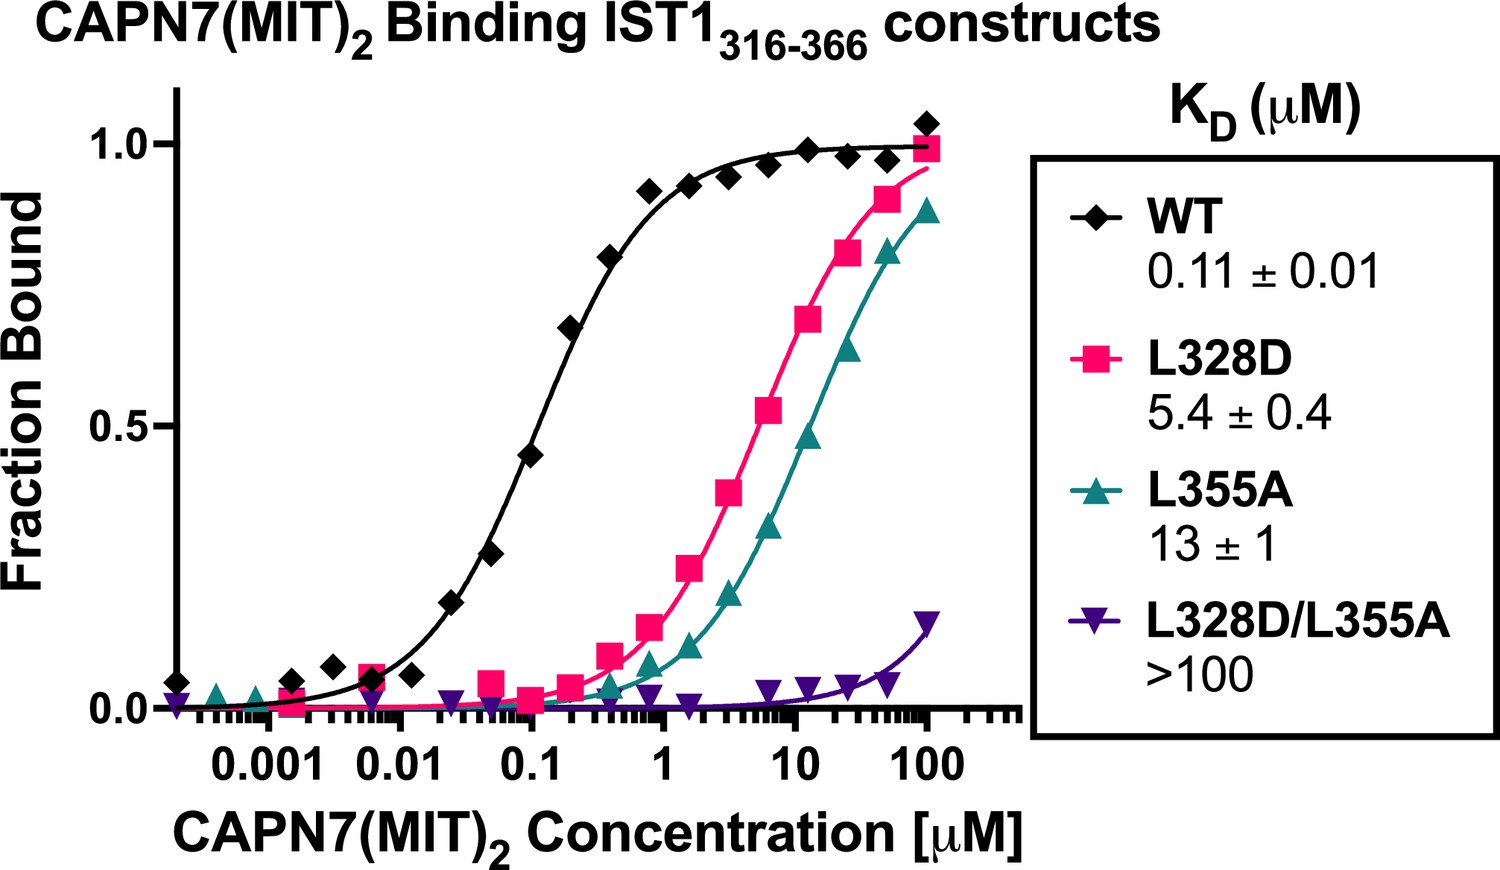
CAPN7(MIT)2 binding to IST1316-366 is diminished by mutations in either IST1 MIT-interacting motif (MIM) element.
Fluorescence polarization anisotropy binding isotherms showing CAPN7(MIT)2 binding to a fluorescently labeled wt IST1 peptide spanning both MIM elements (IST1316-366), or to IST316-366 peptides with mutations in either the N-terminal (L328D), C-terminal (L355A), or both (L328D/L355A) MIM elements. Isotherm data points and dissociation constants (KD) are averages ± standard error of the mean from three independent experiments.
Figure 4 with 1 supplement
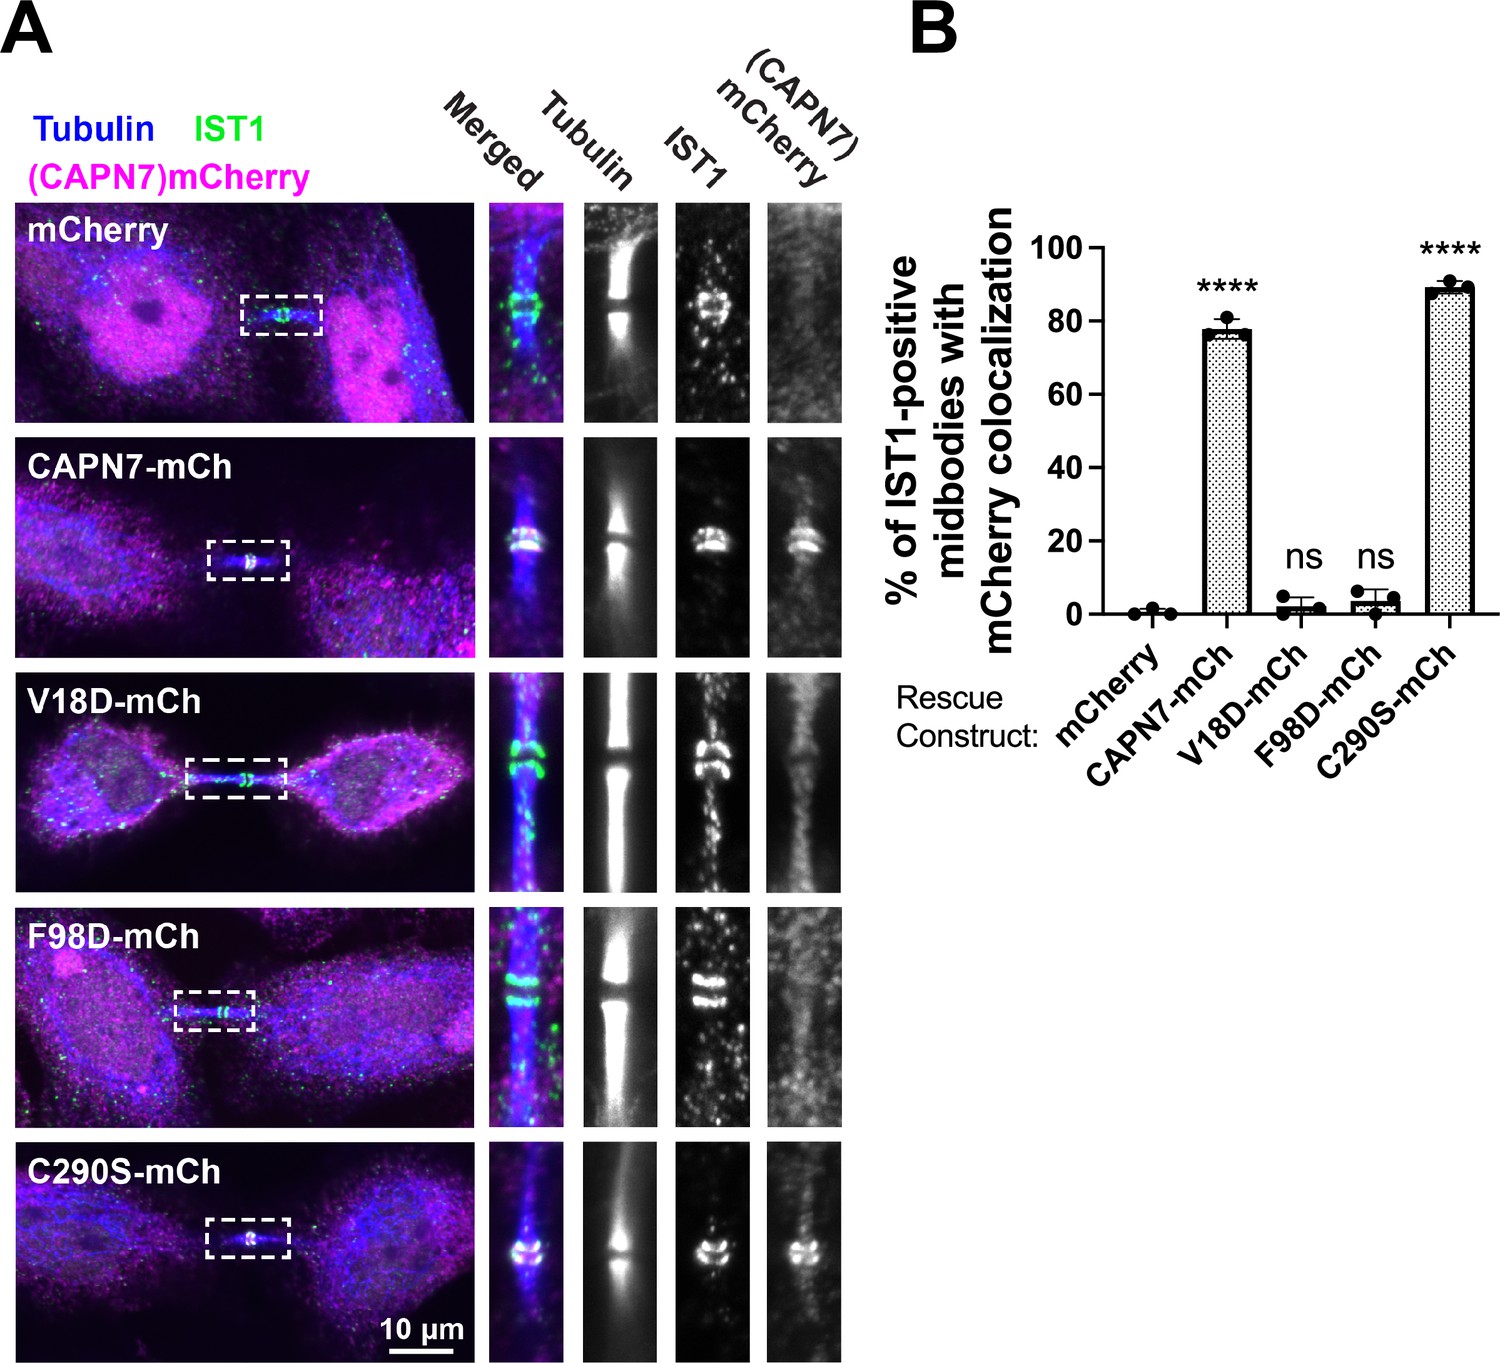
IST1 binding is required for CAPN7 midbody localization.
(A) Representative immunofluorescence images showing the extent of midbody colocalization of mCherry-CAPN7 constructs (or the mCherry control), with endogenous IST1 in synchronous, NoCut checkpoint-active cells. Endogenous CAPN7 was depleted with siRNA while siRNA-resistant CAPN7-mCherry constructs were inducibly expressed. (B) Quantification of the colocalization of mCherry-CAPN7 constructs with endogenous IST1 at midbodies (corresponding to the images in A). Colocalization was scored blinded as described in ‘Materials and methods.’ Bars represent the mean and standard error of the mean from three independent experiments where > 50 IST1-positive midbody-stage cells were counted per experiment. Statistical analyses were performed using unpaired t-tests that compared the percentage of rescue constructs that colocalized with IST1 at midbodies to the mCherry alone control. ****p<0.0001, ns (not significant) p>0.05.
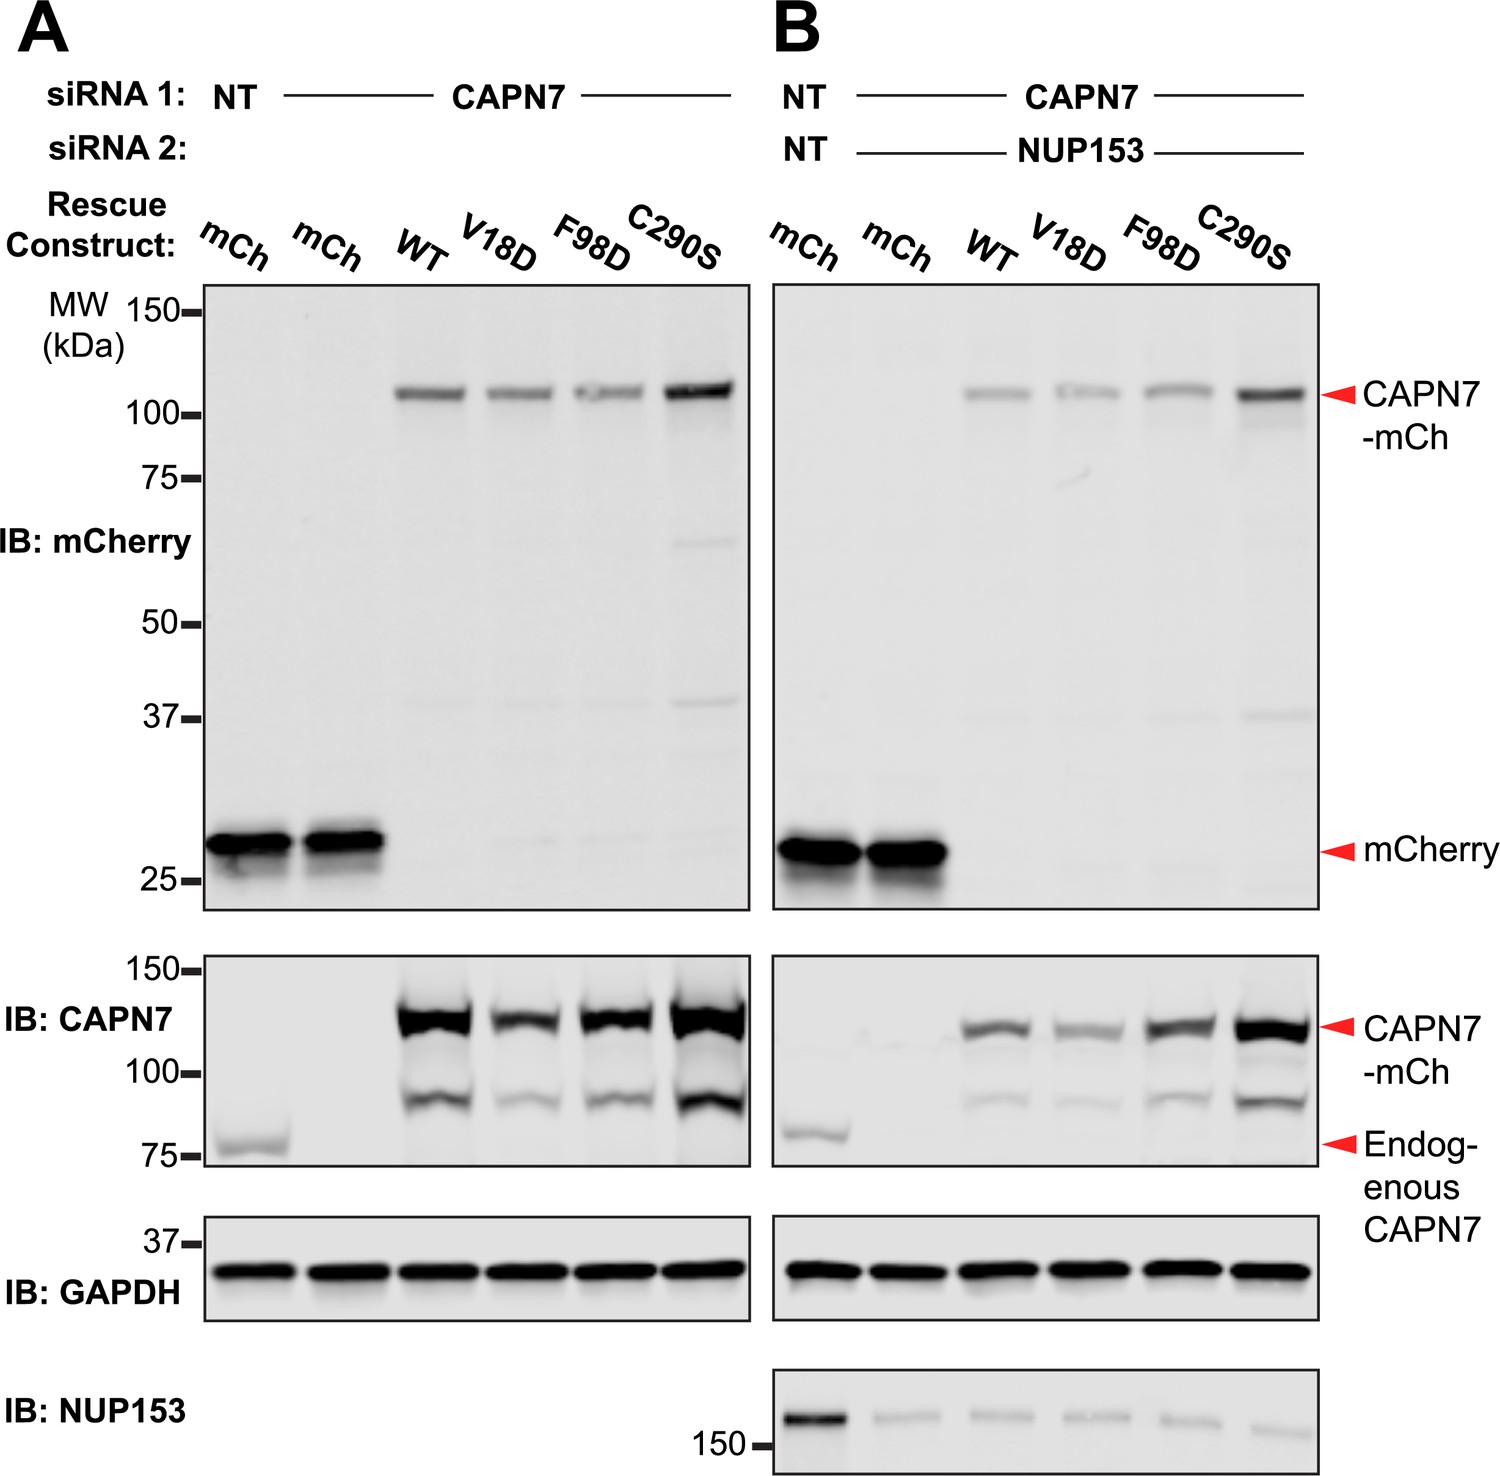
Figure 4—figure supplement 1
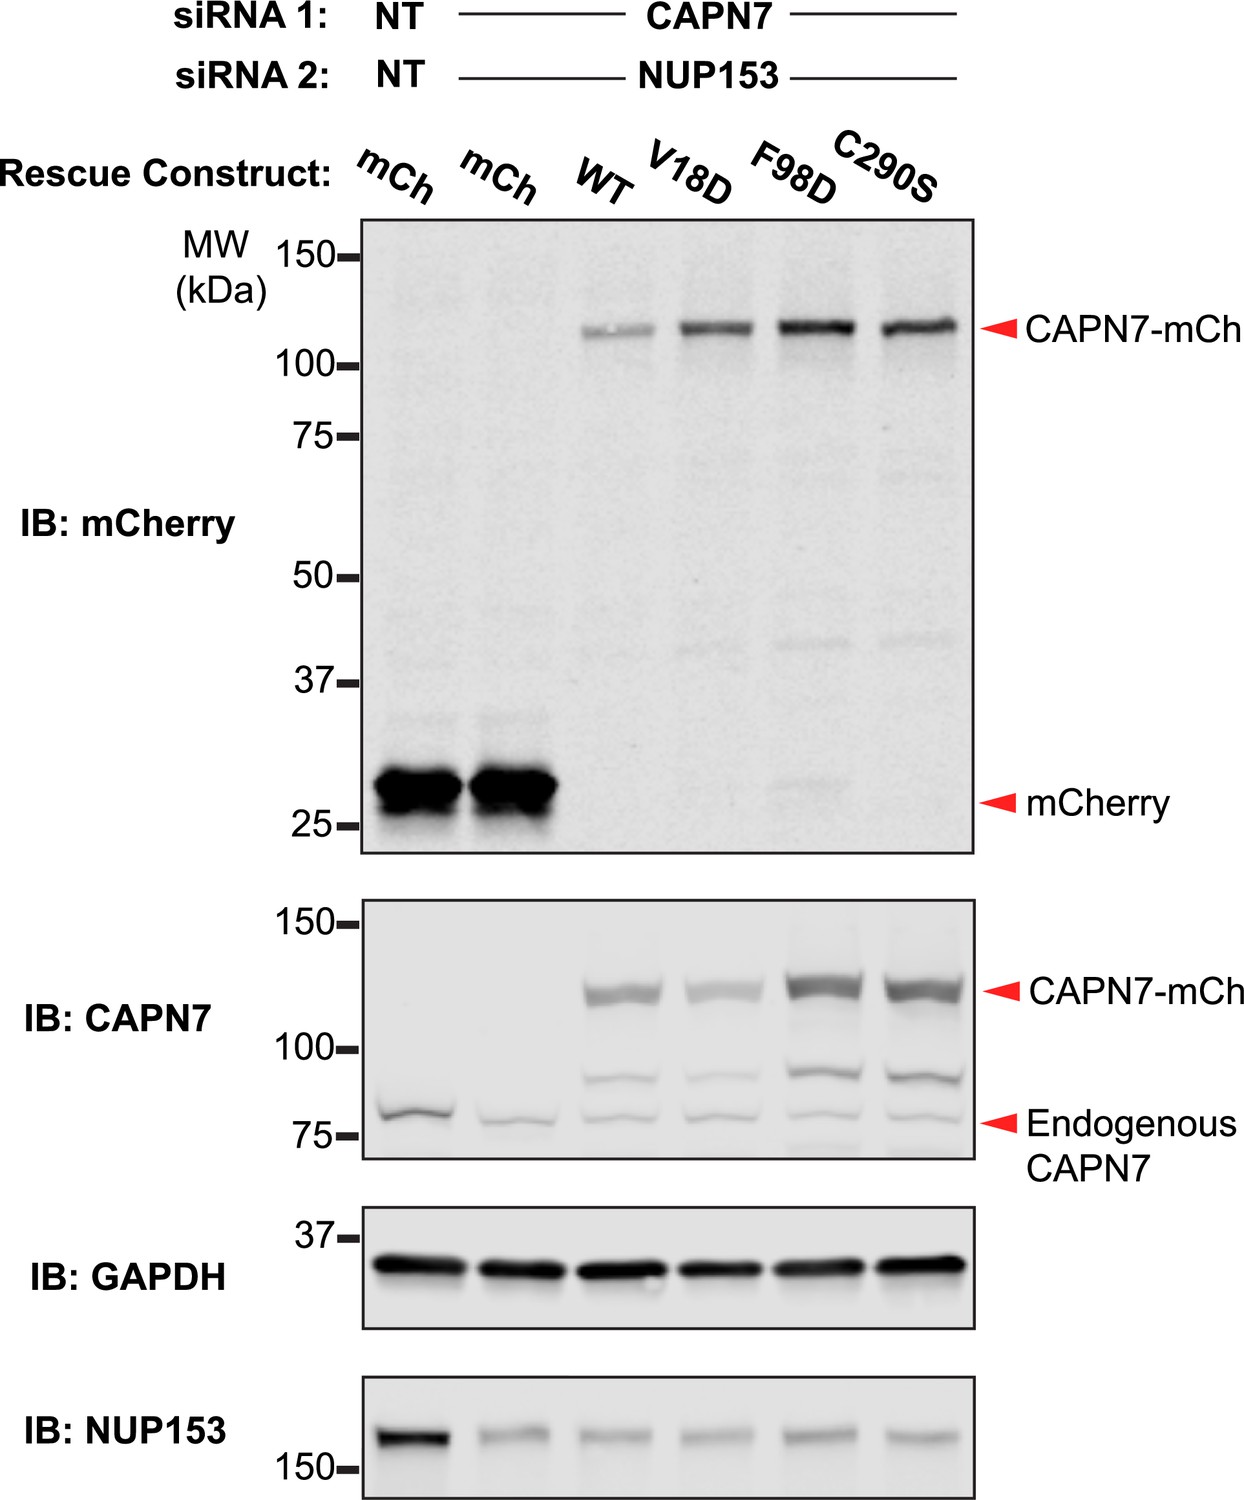
Western blot confirmation of rescue construct expression and siRNA knockdown efficiency.
Western blot analyses showing CAPN7-mCherry protein expression levels and knockdown efficiencies of endogenous CAPN7 and Nup153 in the experiments shown in Figure 4A and B. siNT is a non-targeting sequence (see ‘Materials and methods’).
-
Figure 4—figure supplement 1—source data 1
Annotated and uncropped western blots and raw images for Figure 4—figure supplement 1.
- https://cdn.elifesciences.org/articles/84515/elife-84515-fig4-figsupp1-data1-v2.zip
Figure 5 with 1 supplement
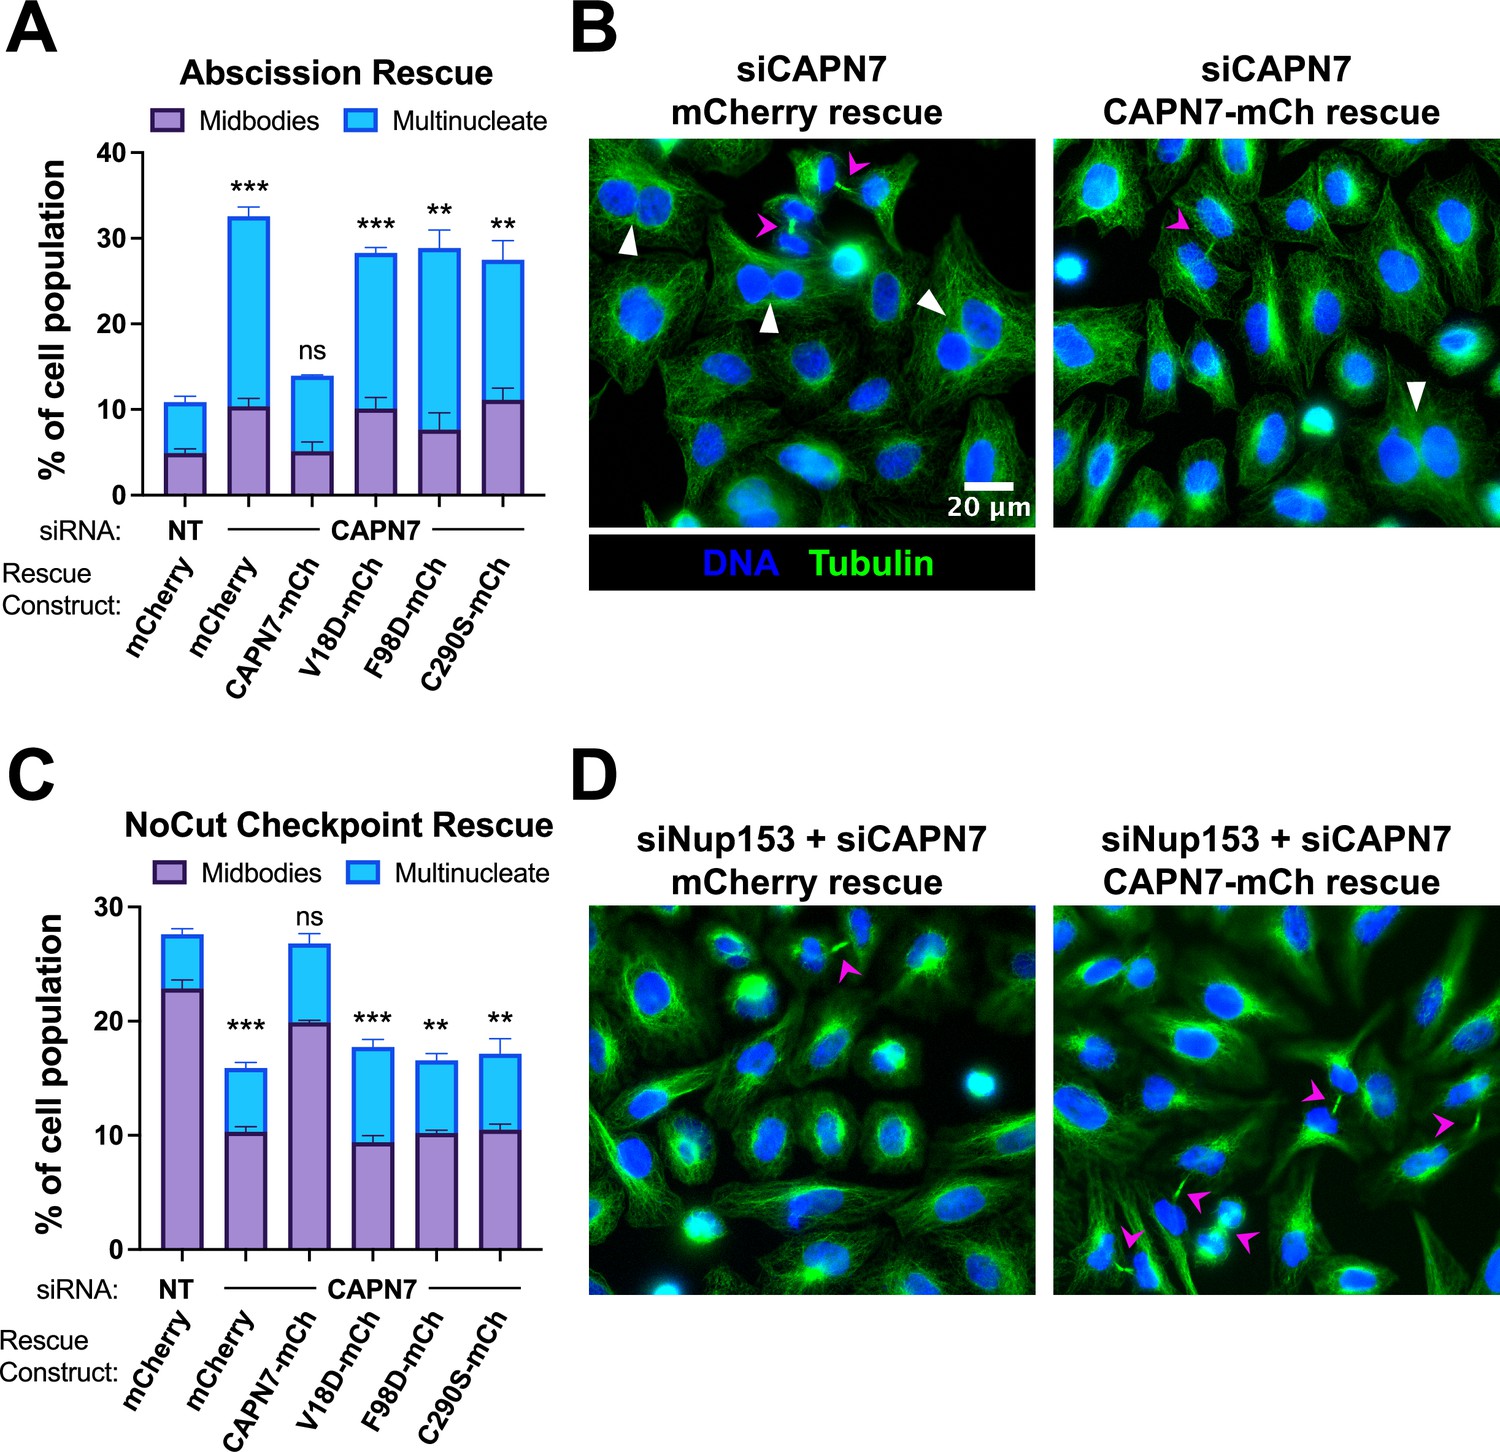
IST1-binding and catalytic activity are required for CAPN7 abscission and NoCut functions.
(A, C) Quantification of midbody-stage and multinucleate HeLa cells from unperturbed asynchronous cultures (A), or cells in which NoCut checkpoint activity was sustained by Nup153 depletion (C). (B, D) Representative images from the quantified datasets in (A and C), respectively. Midbodies are marked with magenta arrows, and multinucleate cells are marked with white arrowheads. In all cases, cells were depleted of endogenous CAPN7, followed by expression of the designated DOX-inducible ‘rescue’ construct. Bars represent the mean and standard error of the mean from three independent experiments where >300 cells were counted per experiment. Statistical analyses were performed using unpaired t-tests comparing the sum of midbody-stage and multinucleate cells for each individual treatment to the same sum in siNT (non-targeting) control-treated cells. ***p<0.001, **p<0.01, ns (not significant) p>0.05.
Figure 5—figure supplement 1
Western blot confirmation of rescue construct expression and siRNA knockdown efficiency.
(A, B) Western blot analyses showing mCherry-CAPN7 protein expression levels and knockdown efficiencies of endogenous CAPN7 and Nup153 in the experiments shown in Figure 5A and C, respectively.
-
Figure 5—figure supplement 1—source data 1
Annotated and uncropped western blots and raw images for Figure 5—figure supplement 1.
- https://cdn.elifesciences.org/articles/84515/elife-84515-fig5-figsupp1-data1-v2.zip
Figure 6
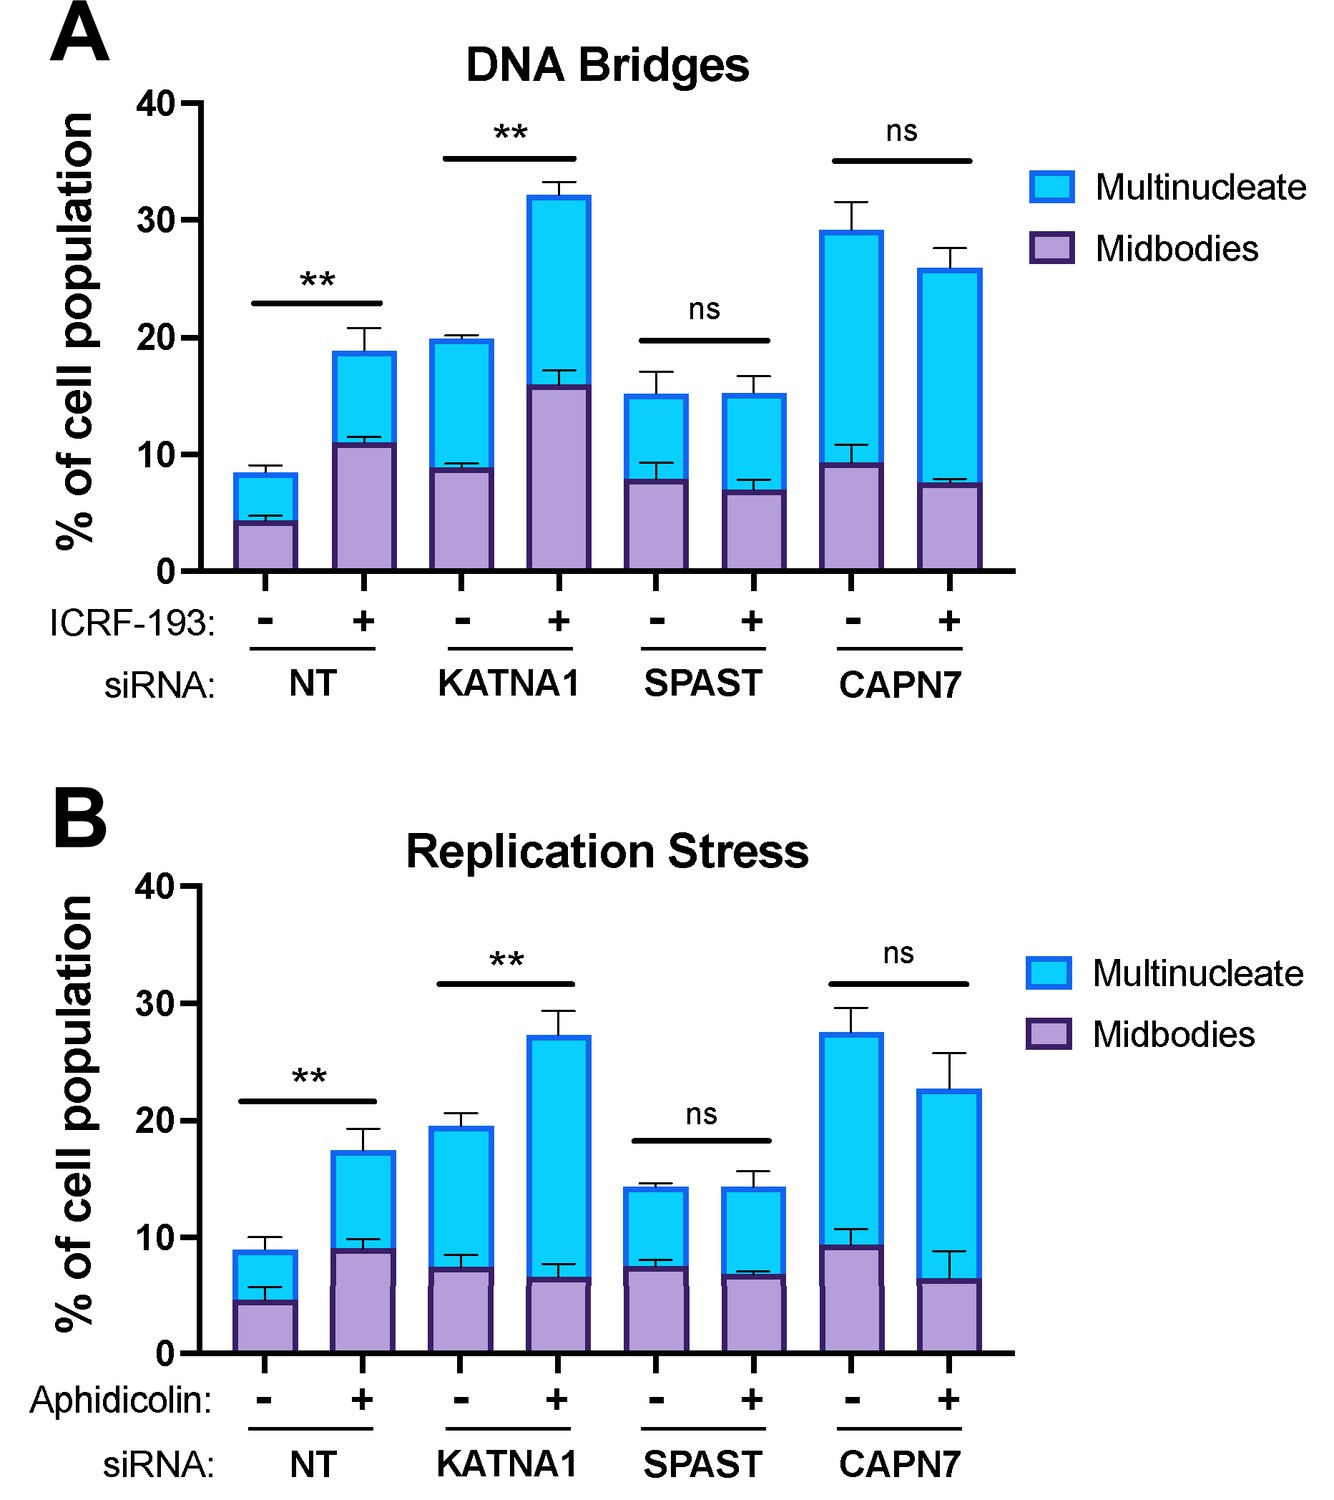
CAPN7 and SPAST are required to maintain the NoCut checkpoint in response to DNA bridges and replication stress.
Quantification of midbody-stage and multinucleate HeLa cells from asynchronous cultures in which NoCut checkpoint activity was sustained by inducing DNA bridges with ICRF-193 treatment (A) or replication stress with aphidicolin treatment (B), following siRNA treatments to deplete the indicated proteins. Bars represent the mean and standard error of the mean from three independent experiments where >300 cells were counted per experiment. Statistical analyses were performed using unpaired t-tests comparing the sum of midbody-stage and multinucleate cells for each siRNA treatment with or without NoCut checkpoint maintenance with the indicated drug. **p<0.01, ns (not significant) p>0.05.
Author response image 1
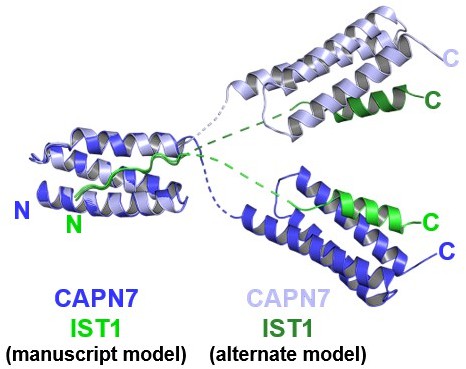
Mock figure showing the structure model presented in the manuscript, overlaid with another possible model with alternative connectivity between the two copies of the complex within the crystallographic asymmetric unit.
The two structures were aligned to the first MIT domain to highlight the divergence between possible interdomain linkers and C-terminal domain positions.
Tables
Table 1
CAPN7(MIT)2–IST1322-366 complex (PDB: 8UC6) crystallographic data and refinement statistics.
| Data collection, integration, and scaling | |
|---|---|
| Programs | XDS, AIMLESS |
| Source/wavelength (Å) | SSRL 14–1/1.19499 |
| Space group (unit cell dimensions) | P6522 (87.84, 87.84, 183.89, 90.0, 90.0, 120.0) |
| Resolution (high-resolution shell) (Å) | 40.0–2.70 (2.83–2.70) |
| # reflections measured | 1,398,023 |
| # unique reflections | 12,228 |
| Redundancy (high-resolution shell) | 114 (104) |
| Completeness (high-resolution shell) (%) | 100.0 (99.9) |
| <I/σI> (high-resolution shell) | 11.0 (1.5) |
| <CC1/2> | 0.998 (0.650) |
| Rpim (high-resolution shell) | 0.080 (0.666) |
| Mosaicity (°) | 0.12 |
| Refinement | |
| Program | Phenix.refine |
| Resolution (Å) | 40.0–2.70 |
| Resolution (Å) – (high-resolution shell) | (2.81–2.70) |
| # reflections | 12,169 |
| # reflections in Rfree set excluded from refinement | 1221 |
| Rcryst | 0.211 (0.284) |
| Rfree | 0.285 (0.371) |
| RMSD: bonds (Å)/angles (°) | 0.008/0.976 |
| B-factor refinement | Group B |
| <B> (Å2): all atoms/# atoms | 49/2,779 |
| <B> (Å2): water molecules/#water | 46/42 |
| Φ/ψ most favored (%)/additionally allowed (%) | 97/1.8 (0.9 outlier) |
-
CC1/2, correlation coefficient; Rpim, precision-indicating merging R-factor; RMSD, root-mean-square deviation.
Key resources table
| Reagent type (species) or resource | Designation | Source or reference | Identifiers | Additional information |
|---|---|---|---|---|
| Cell line (Homo sapiens) | Hela-N | Maureen Powers Lab | HeLa cells selected for transfectability | |
| Cell line (Homo sapiens) | HEK293T | ATCC | CRL-3216 | |
| Antibody | Anti-FLAG (M2, mouse monoclonal) | Sigma | F1804 | WB (1:5000) |
| Antibody | Anti-MYC (4A6, mouse monoclonal) | Millipore | 05-724 | WB (1:2500) |
| Antibody | Anti-RFP (rat monoclonal) | ChromoTek | 5F8 | IF (1:500) |
| Antibody | Anti-RFP (mouse monoclonal) | ChromoTek | 6G6 | WB (1:1000) |
| Antibody | Anti-alpha-tubulin (DM1A, mouse monoclonal) | Cell Signaling Technologies | DM1A | IF (1:2000) |
| Antibody | Anti-alpha-Tubulin (chicken polyclonal) | Synaptic Systems | 302 206 | IF (1:1000) |
| Antibody | Anti-CAPN7 (rabbit polyclonal) | Proteintech | Cat# 26985-1-AP | IF (1:500) WB (1:4000) |
| Antibody | Anti-IST1 (rabbit polyclonal) | Sundquist Lab/Covance | UT560 | IF (1:1000) |
| Antibody | Anti-NUP153 (SA1) (mouse monoclonal) | Brian Burke | WB (1:50) | |
| Antibody | Anti-NUP50 (rabbit polyclonal) | Mackay et al., 2010 | WB (1:2500) | |
| Antibody | Anti-GAPDH (mouse monoclonal) | Millipore | ||
| Sequence-based reagent | siNT | Mackay et al., 2010 | siRNA | GCAAAUCUCCGAUCGUAGA |
| Sequence-based reagent | siCAPN7 | Wenzel et al., 2022 | siRNA | GCACCCAUACCUUUACAUU |
| Sequence-based reagent | siNUP153 | Mackay et al., 2010 | siRNA | GGACUUGUUAGAUCUAGUU |
| Chemical compound, drug | Doxycycline Hyclate | Sigma | 324385 | 1–2 µg/mL |
| Chemical compound, drug | Thymidine | CalBiochem | CAS 50-89-5 | 2 mM |
| Chemical compound, drug | Oregon Green 488 maleimide | Life Technologies/Molecular Probes | O6034 | Fluorescent label for peptides |
| Software, algorithm | Fiji | NIH | RRID:SCR_002285 | |
| Software, algorithm | Prism 9 | GraphPad |
Additional files
-
Supplementary file 1
ESI-MS mass confirmation of purified proteins.
- https://cdn.elifesciences.org/articles/84515/elife-84515-supp1-v2.docx
-
Supplementary file 2
Plasmids.
- https://cdn.elifesciences.org/articles/84515/elife-84515-supp2-v2.docx
-
Supplementary file 3
siRNA sequences.
- https://cdn.elifesciences.org/articles/84515/elife-84515-supp3-v2.docx
-
Supplementary file 4
Antibodies.
- https://cdn.elifesciences.org/articles/84515/elife-84515-supp4-v2.docx
-
MDAR checklist
- https://cdn.elifesciences.org/articles/84515/elife-84515-mdarchecklist1-v2.pdf
Download links
A two-part list of links to download the article, or parts of the article, in various formats.
Downloads (link to download the article as PDF)
Open citations (links to open the citations from this article in various online reference manager services)
Cite this article (links to download the citations from this article in formats compatible with various reference manager tools)
The Calpain-7 protease functions together with the ESCRT-III protein IST1 within the midbody to regulate the timing and completion of abscission
eLife 12:e84515.
https://doi.org/10.7554/eLife.84515


