Transcriptional control of motor pool formation and motor circuit connectivity by the LIM-HD protein Isl2
- School of Life Sciences, Gwangju Institute of Science and Technology, Oryong-dong, Buk-gu, Republic of Korea
- Fermentation Regulation Technology Research Group, World Institute of Kimchi, Republic of Korea
- Jeonbuk Department of Inhalation Research, Korea Institute of Toxicology, Republic of Korea
- Department of Neurology, Samsung Medical Center, Sungkyunkwan University School of Medicine, Republic of Korea
- Department of Biochemistry, College of Medicine, Dong-A University, Republic of Korea
- Korea Brain Research Institute, Republic of Korea
- Department of Brain and Cognitive Sciences, Korea Advanced Institute of Science and Technology (KAIST), Republic of Korea
Figures
Figure 1
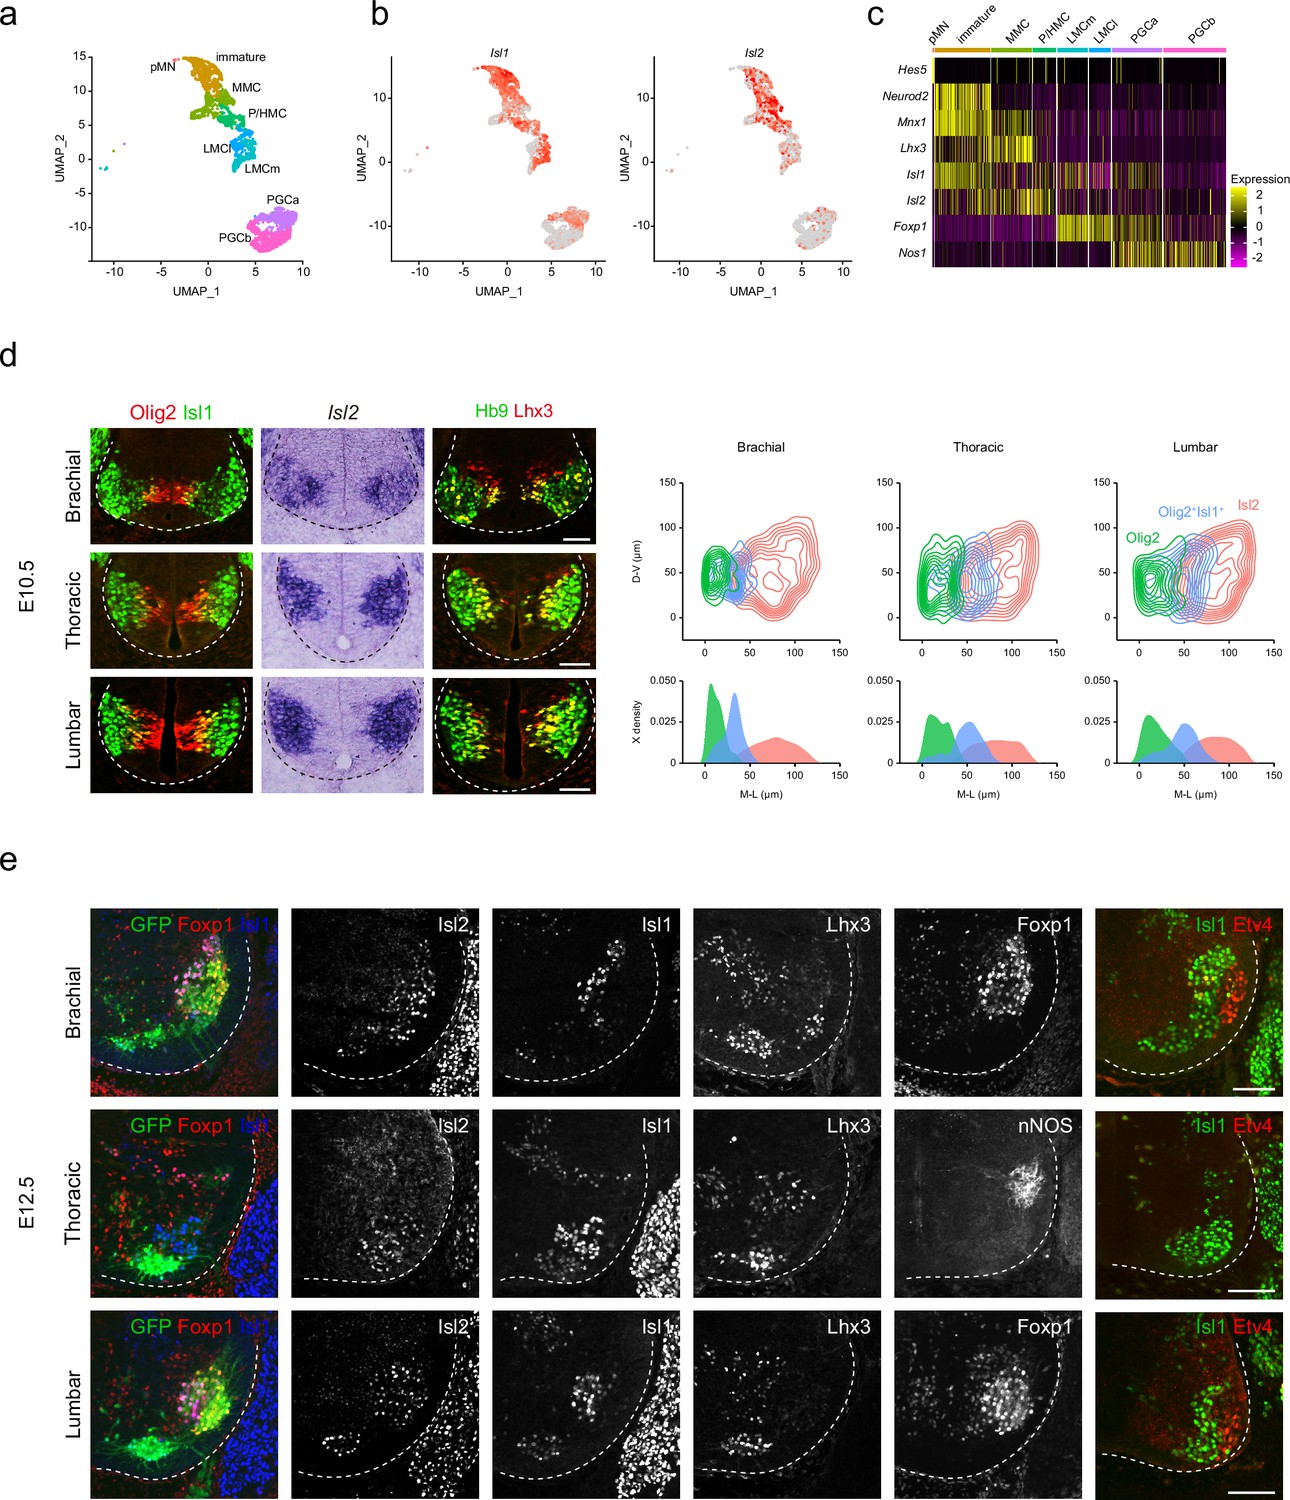
Spatiotemporal dynamics of Isl2 expression and heterogeneity of motor neurons (MNs).
(a) Uniform Manifold Approximation and Projection (UMAP) visualization of scRNA-seq data based on et al.’s study, highlighting distinct MN lineages: pMN progenitors, immature MNs, MMC, P/HMC, LMCm, LMCl, PGCa, and PGCb neurons, each depicted in distinct clusters. (b) UMAP representation showing the differential expression of Isl1 and Isl2, across MN clusters. (c) Heatmap demonstrating the dynamic gene expression profiles of Isl1, Isl2, and other marker genes within MN clusters. (d) Expression of Olig2, Isl1, Isl2, Hb9, and Lhx3 in E10.5 spinal cords. Contour plots and medio-lateral density plots highlighting Olig2+ MN progenitors (green), Olig2+Isl1+ newborn MNs (blue), Isl2+ MNs (pink) across all spinal cord levels. Scale bars, 50 μm. (e) Expression of Isl1, Isl2, Lhx3, Foxp1, nNOS, Etv4, and Hb9::GFP in E12.5 spinal cords. Scale bars, 100 μm.
Figure 2 with 1 supplement
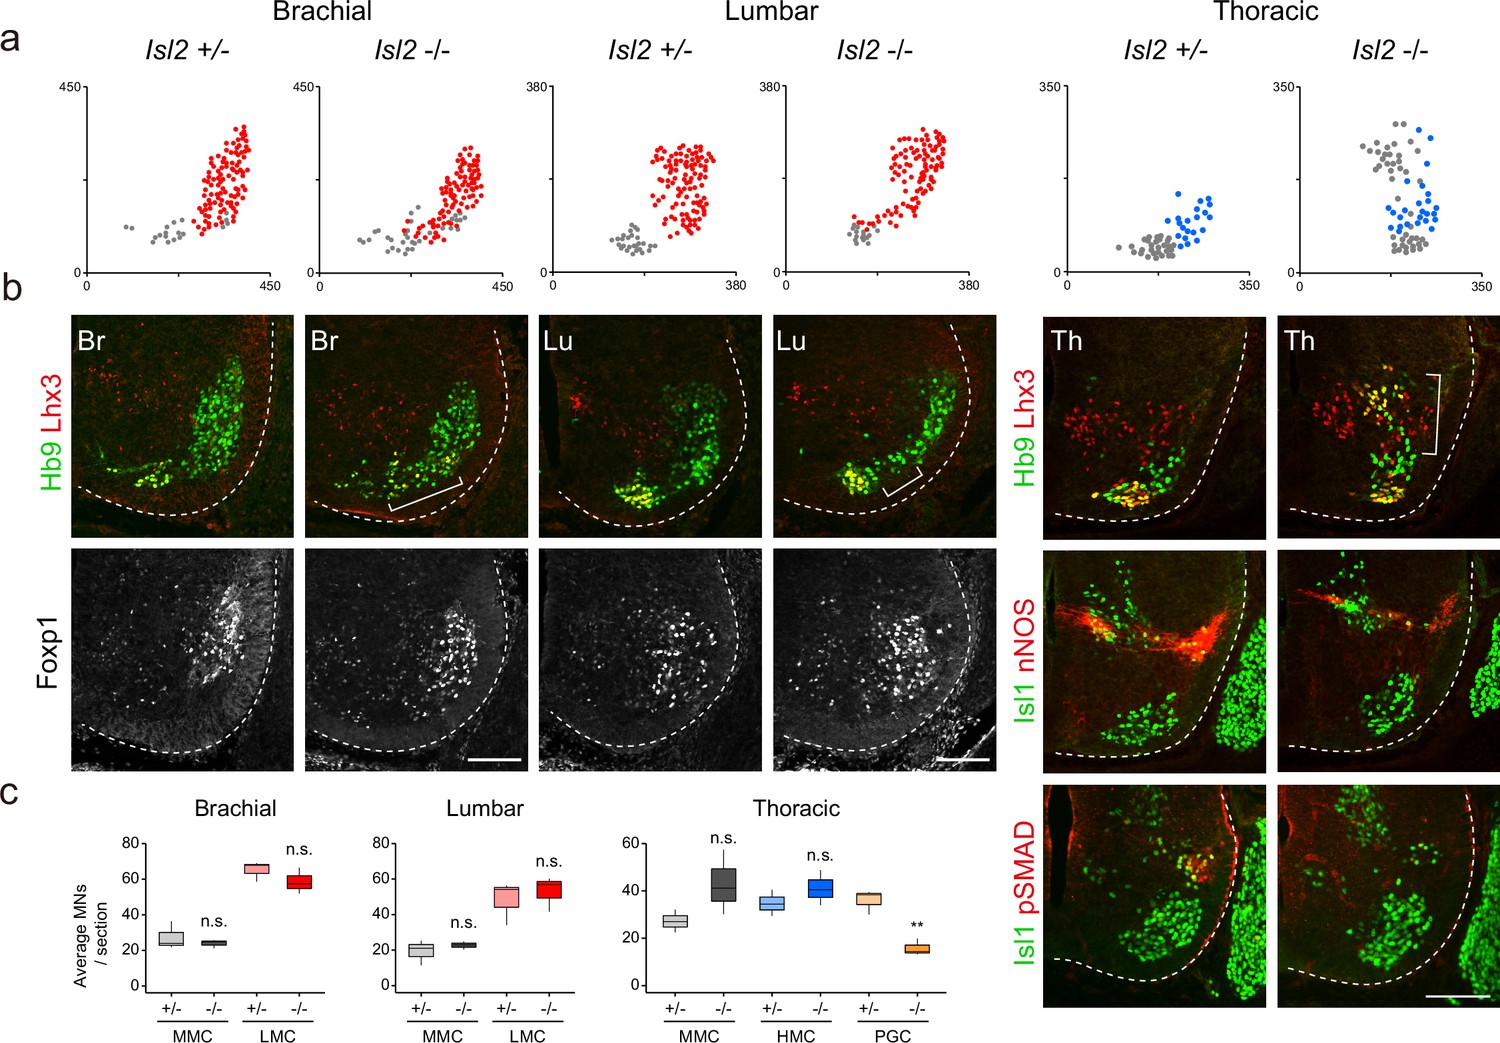
Disrupted motor column organization in Isl2-null mice.
(a) Spatial representation of motor neuron (MN) subtypes: median motor column (MMC) (gray, Lhx3+Hb9+), lateral motor column (LMC) (red, Foxp1+), and preganglionic column (PGC) (blue, Isl1+ nNOS+) neurons from the images in b. X and y coordinates denote the medial-to-lateral and ventral-to-dorsal axes, respectively, in μm. (b) Expression of Hb9, Lhx3, Foxp1, Isl1, nNOS, and pSMAD in E13.5 mouse embryonic spinal cords. Brackets mark ectopic MNs observed in Isl2-null mice. (c) Quantification of MMC (gray), LMC (red), hypaxial motor column (HMC) (blue), and PGC (yellow) neurons across brachial (C6–C8), lumbar (L2–L4), and thoracic spinal segments. Average MN number per mouse. Box plots illustrate distribution with median (center line), first and third quartiles (box boundaries), and 10th-90th percentiles (whiskers). Data from three mice per group, analyzed using unpaired Student’s t-test; **p<0.01; n.s. indicates not significant. Refer to Supplementary file 2 and source data for detailed statistics. Scale bars, 100 μm.
-
Figure 2—source data 1
Quantification of motor neuron (MN) subtypes at E13.5 in Isl2 +/- and Isl2-null mice, categorized by brachial, lumbar, and thoracic levels.
- https://cdn.elifesciences.org/articles/84596/elife-84596-fig2-data1-v2.xlsx
Figure 2—figure supplement 1

Analysis of ectopic motor neurons (MNs) in Isl2 knockout (KO) mice.
(a) Representative immunofluorescence images of ectopic MNs in E13.5 Isl2 KO mice, labeled with various motor neuronal markers. High-magnification insets highlight median motor column (MMC) (arrowheads), LMCl (white circles), and unidentified (white dotted circles) cells within ectopic MN region. Scale bars, 100 μm (low-magnification images) and 25 μm (high-magnification images). (b) Schematic summary depicting the types of ectopic MNs in Isl2-deficient mice. (c) Distribution analysis of MMC (GFP+Lhx3+), LMC (GFP+Foxp1+), and LMCl (GFP+Lhx1+) cells among the analyzed ectopic MNs within ectopic MN region (n=6 sections, three animals). The error bars represent SEM. Box plots illustrate distribution with median (center line), first and third quartiles (box boundaries), and 10th-90th percentiles (whiskers). Detailed numerical values are available in Supplementary file 2 and source data.
-
Figure 2—figure supplement 1—source data 1
Quantification of ectopic motor neurons (MNs) at E13.5 in the lumbar spinal cords in Isl2-null mice.
- https://cdn.elifesciences.org/articles/84596/elife-84596-fig2-figsupp1-data1-v2.xlsx
Figure 3 with 3 supplements
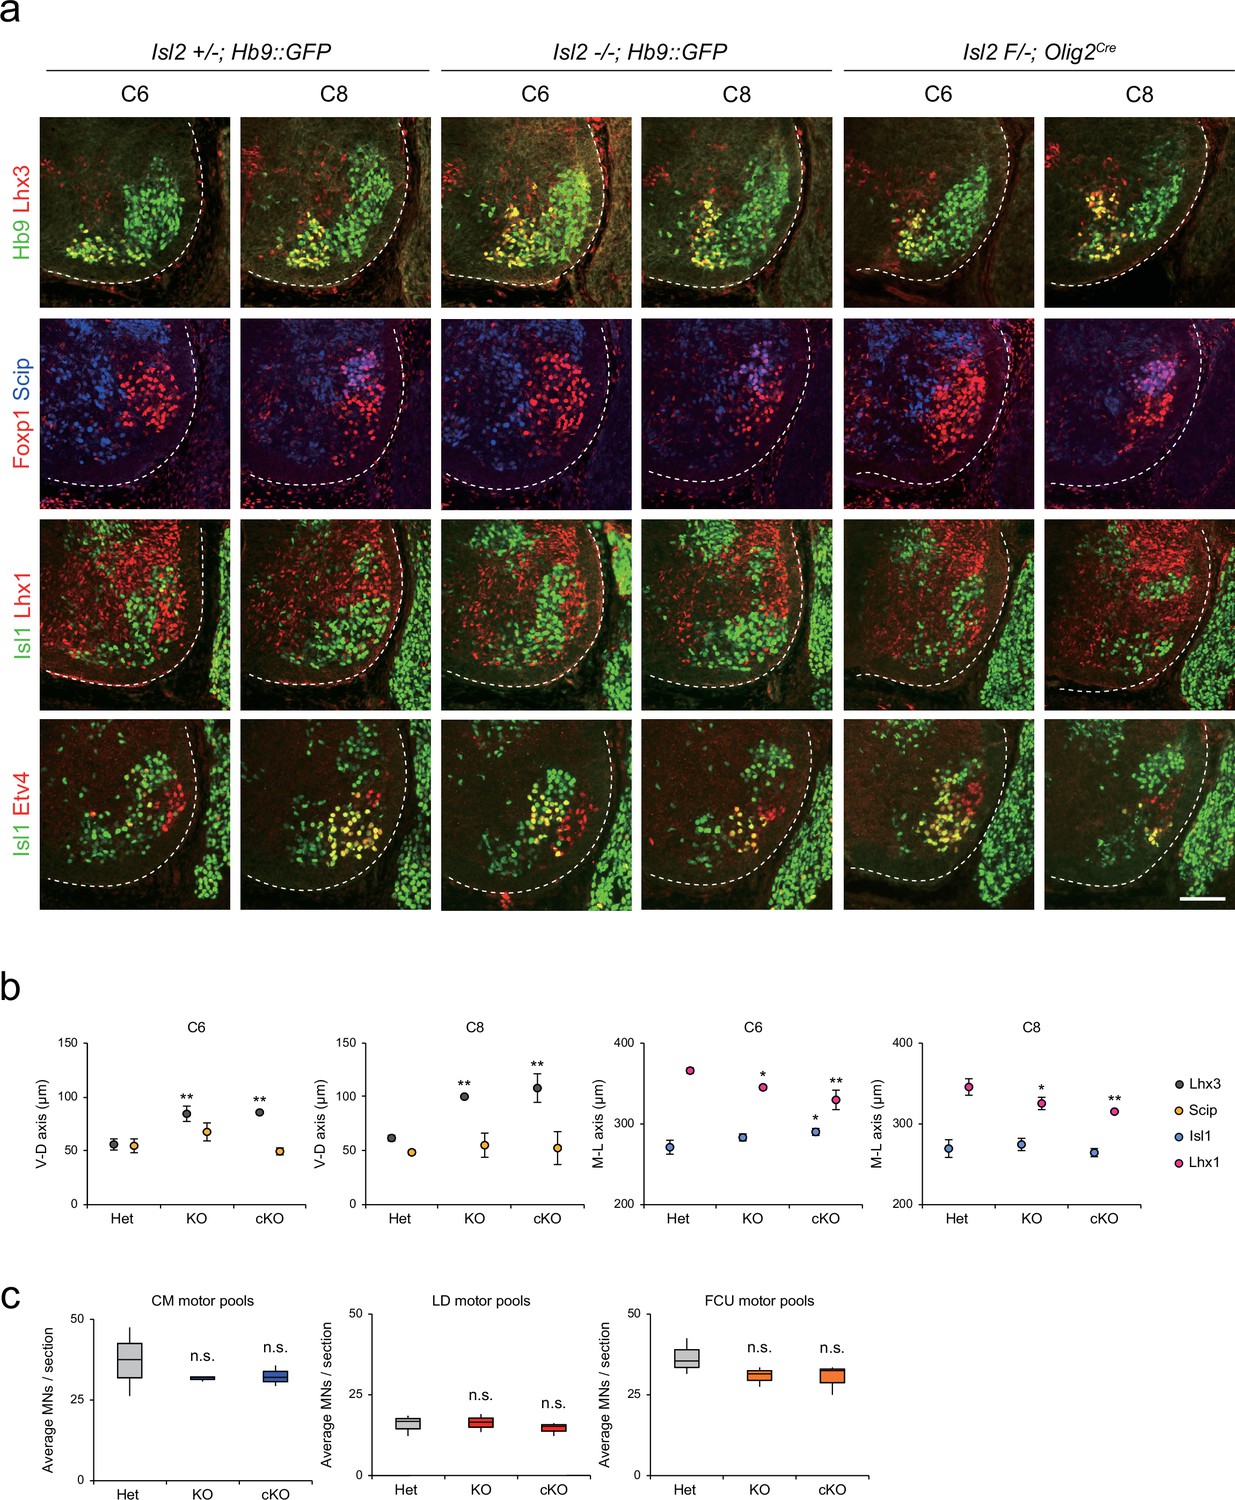
Distribution of lateral motor column (LMC) motor pools in brachial spinal cords of control and Isl2 mutant mice.
(a) Immunofluorescence images of motor neurons (MNs) labeled with Hb9, Lhx3, Foxp1, Scip, Isl1, Lhx1, and Etv4 in adjacent sections of C6 and C8 spinal cords from Het (+/-), Isl2 knockout (KO) (-/-), and Isl2 conditional knockout (cKO) (Isl2 F/-; Olig2Cre) mice. (b) Average ventro-dorsal distribution of MMC (Hb9+Lhx3+) and MMC/HMC (Hb9+Foxp1-Scip+) neurons, and medio-lateral distribution of LMCm (Hb9lowIsl1+) and LMCl (Hb9highLhx1+) neurons in embryos with each genotype. n=3 mice for each genotype; standard deviation (SD) is shown; one-way ANOVA with Bonferroni’s post hoc test; Het vs. KO or cKO, **p<0.01, *p<0.05. (c) Average cell count per embryo in flexor carpi ulnaris (FCU) (Foxp1+Scip+), cutaneous maximus (CM) (Isl1+Etv4+), and latissimus dorsi (LD) (Isl1−Etv4+) motor pools. Box plots illustrate distribution with median (center line), first and third quartiles (box boundaries), and 10th-90th percentiles (whiskers). One-way ANOVA with Bonferroni’s post hoc test; n.s. indicates not significant. See Supplementary file 2 and source data for detailed n and statistics. Scale bar, 100 μm.
-
Figure 3—source data 1
Average ventro-dorsal distribution of MMC (Hb9+Lhx3+) and MMC/HMC (Hb9+Foxp1-Scip+) neurons as well as medio-lateral distribution of LMCm (Hb9lowIsl1+) and LMCl (Hb9highLhx1+) neurons (Figure 3b).
It also includes the average cell count per embryo in flexor carpi ulnaris (FCU) (Foxp1+Scip+), cutaneous maximus (CM) (Isl1+Etv4+), and latissimus dorsi (LD) (Isl1-Etv4+) motor pools (Figure 3c).
- https://cdn.elifesciences.org/articles/84596/elife-84596-fig3-data1-v2.xlsx
Figure 3—figure supplement 1

Generation of novel Isl2 flox mouse line.
(a) Schematic representation of the gene targeting strategy employed by Cyagen Biosciences (Guangzhou), Inc to generate Isl2 flox mice. Exons 2–4 were flanked by loxP sites, constituting the flox strategy. The knockout strategy (Thaler et al., 2004) involves the replacement of three exons with a neomycin cassette. Orange boxes represent exons, purple triangles denote loxP sites, and green trapezoids depict self-deletion anchor (SDA) sites. The blue lines denote the 5’ and 3’ homology arms approximately 2722 and 2933 kb long, respectively. The red line denotes the conditional knockout (cKO) region. The locations of genotyping primers are shown in red. The F1 Isl2flox-neo/+ mice were crossed with deleter mice to excise the Neo cassette from the germline. (b) Genotyping PCR results confirmed the successful generation of wild-type heterozygous and homozygous pups. (c) In situ hybridization images depicting Isl2 mRNA in Isl2 F/- and Isl2 F/-; Olig2Cre embryos at E12.5. Diminished Isl2 mRNA expression is observed in motor columns (arrowheads) but not in dorsal root ganglia (arrows). Scale bar, 100 μm.
-
Figure 3—figure supplement 1—source data 1
An unedited raw agarose gel picture and a labeled gel picture of genotyping PCR for Figure 3—figure supplement 1b.
- https://cdn.elifesciences.org/articles/84596/elife-84596-fig3-figsupp1-data1-v2.zip
Figure 3—figure supplement 2

Contour plots for motor neuron (MN) subtypes and motor pools in the brachial spinal cords.
(a) Contour or medio-lateral density plots illustrate the distribution of Hb9+ somatic MNs (sMNs, green), Hb9+Lhx3+ MMC neurons (gray), Hb9+Foxp1-Scip+ MMC/HMC neurons (yellow), Hb9+Foxp1+ LMC neurons (purple); Hb9lowIsl1+ LMCm neurons (skyblue), Hb9highLhx1+ LMCl neurons (magenta), Foxp1+Scip+ flexor carpi ulnaris (FCU) (orange), Isl1+Etv4+ cutaneous maximus (CM) (blue), and Isl1−Etv4+ latissimus dorsi (LD) (red) within C6 and C8 spinal cords of heterozygote, Isl2 knockout (KO), and Isl2 conditional knockout (cKO) mice. X and y coordinates on medial-to-lateral and ventral-to-dorsal axes in contour plots are shown in μm.
Figure 3—figure supplement 3

Spatial plots depict position of individual neurons comprising motor columns and motor pools indicated from three different animals shown in Figure 3.
(a) Scatter or medio-lateral density plots illustrate the distribution of Hb9+ somatic motor neurons (MNs) (sMNs, green), Hb9+Lhx3+ MMC neurons (gray), Hb9+Foxp1-Scip+ MMC/HMC neurons (yellow), Hb9+Foxp1+ LMC neurons (purple); Hb9lowIsl1+ LMCm neurons (skyblue), Hb9highLhx1+ LMCl neurons (magenta), Foxp1+Scip+ flexor carpi ulnaris (FCU) (orange), Isl1+Etv4+ cutaneous maximus (CM) (blue), and Isl1−Etv4+ latissimus dorsi (LD) (red) within C6 and C8 spinal cords of heterozygote, Isl2 knockout (KO), and Isl2 cKO mice. X and y coordinates on medial-to-lateral and ventral-to-dorsal axes in scatter plots are shown in μm.
Figure 4 with 2 supplements
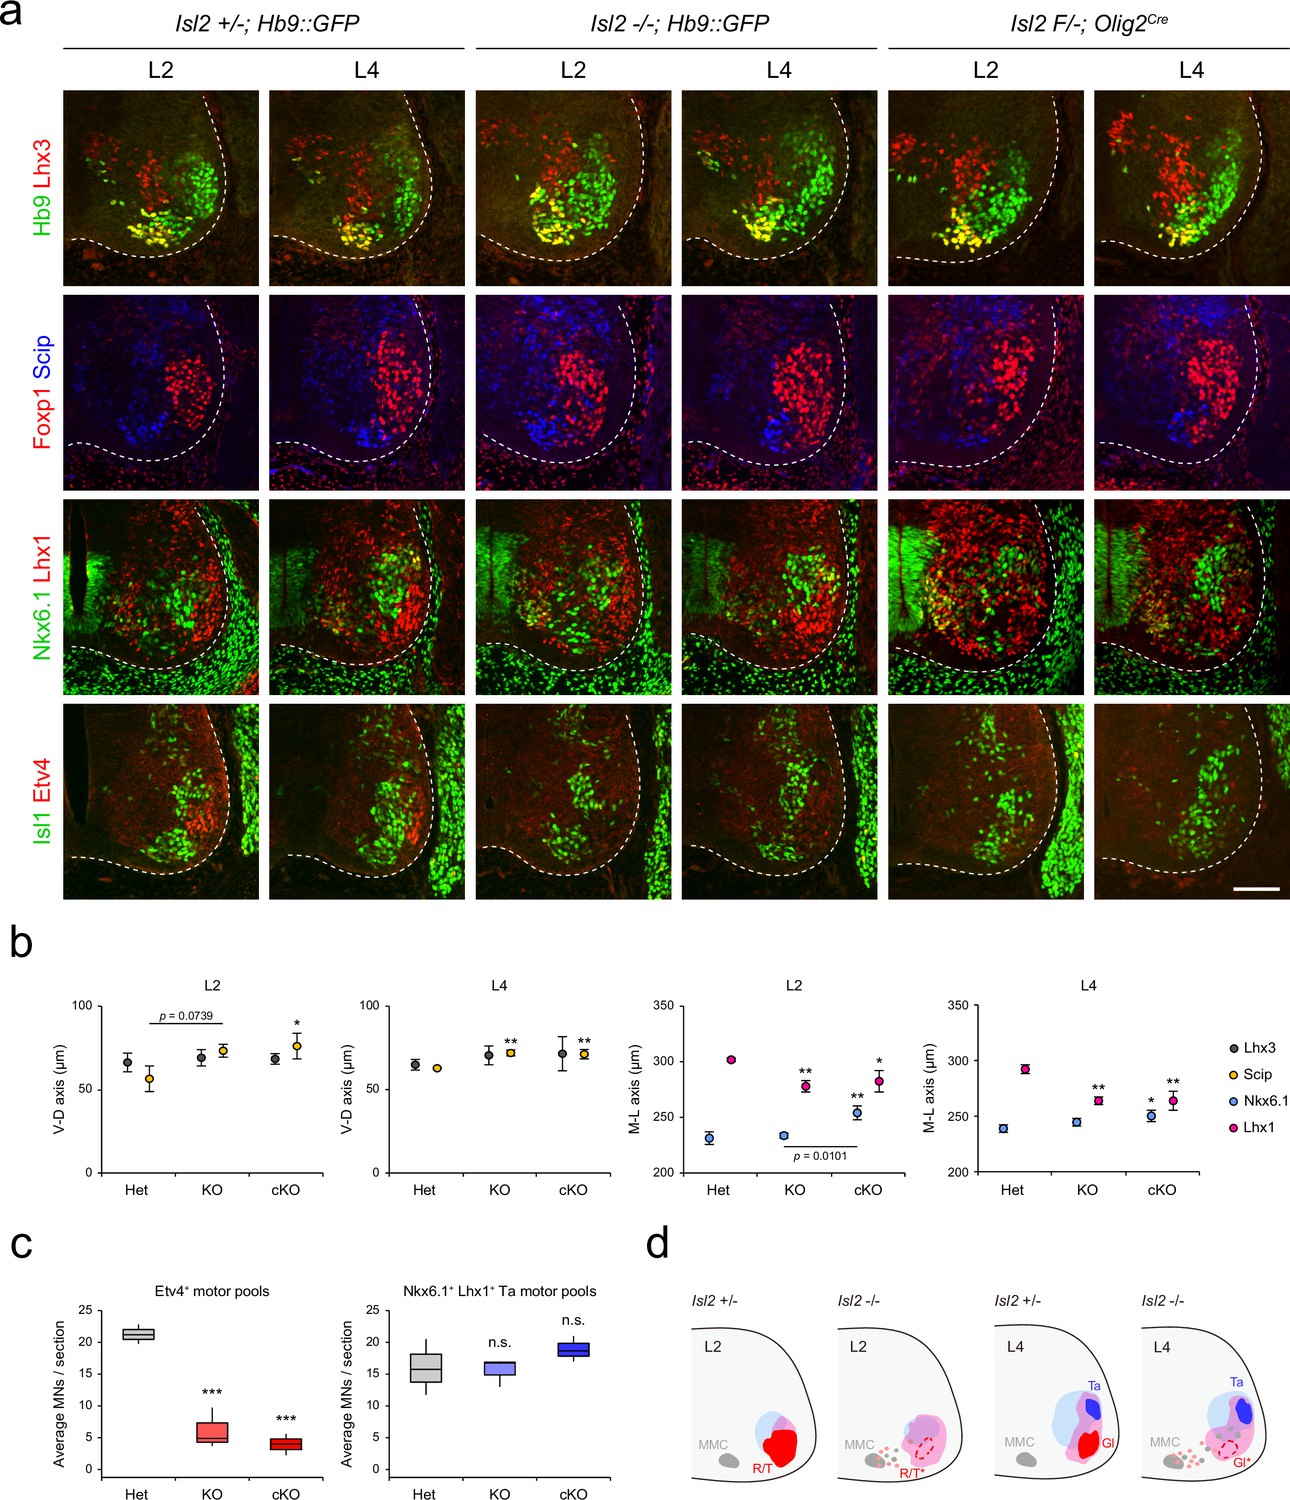
Altered lumbar motor column position in Isl2 mutant mice.
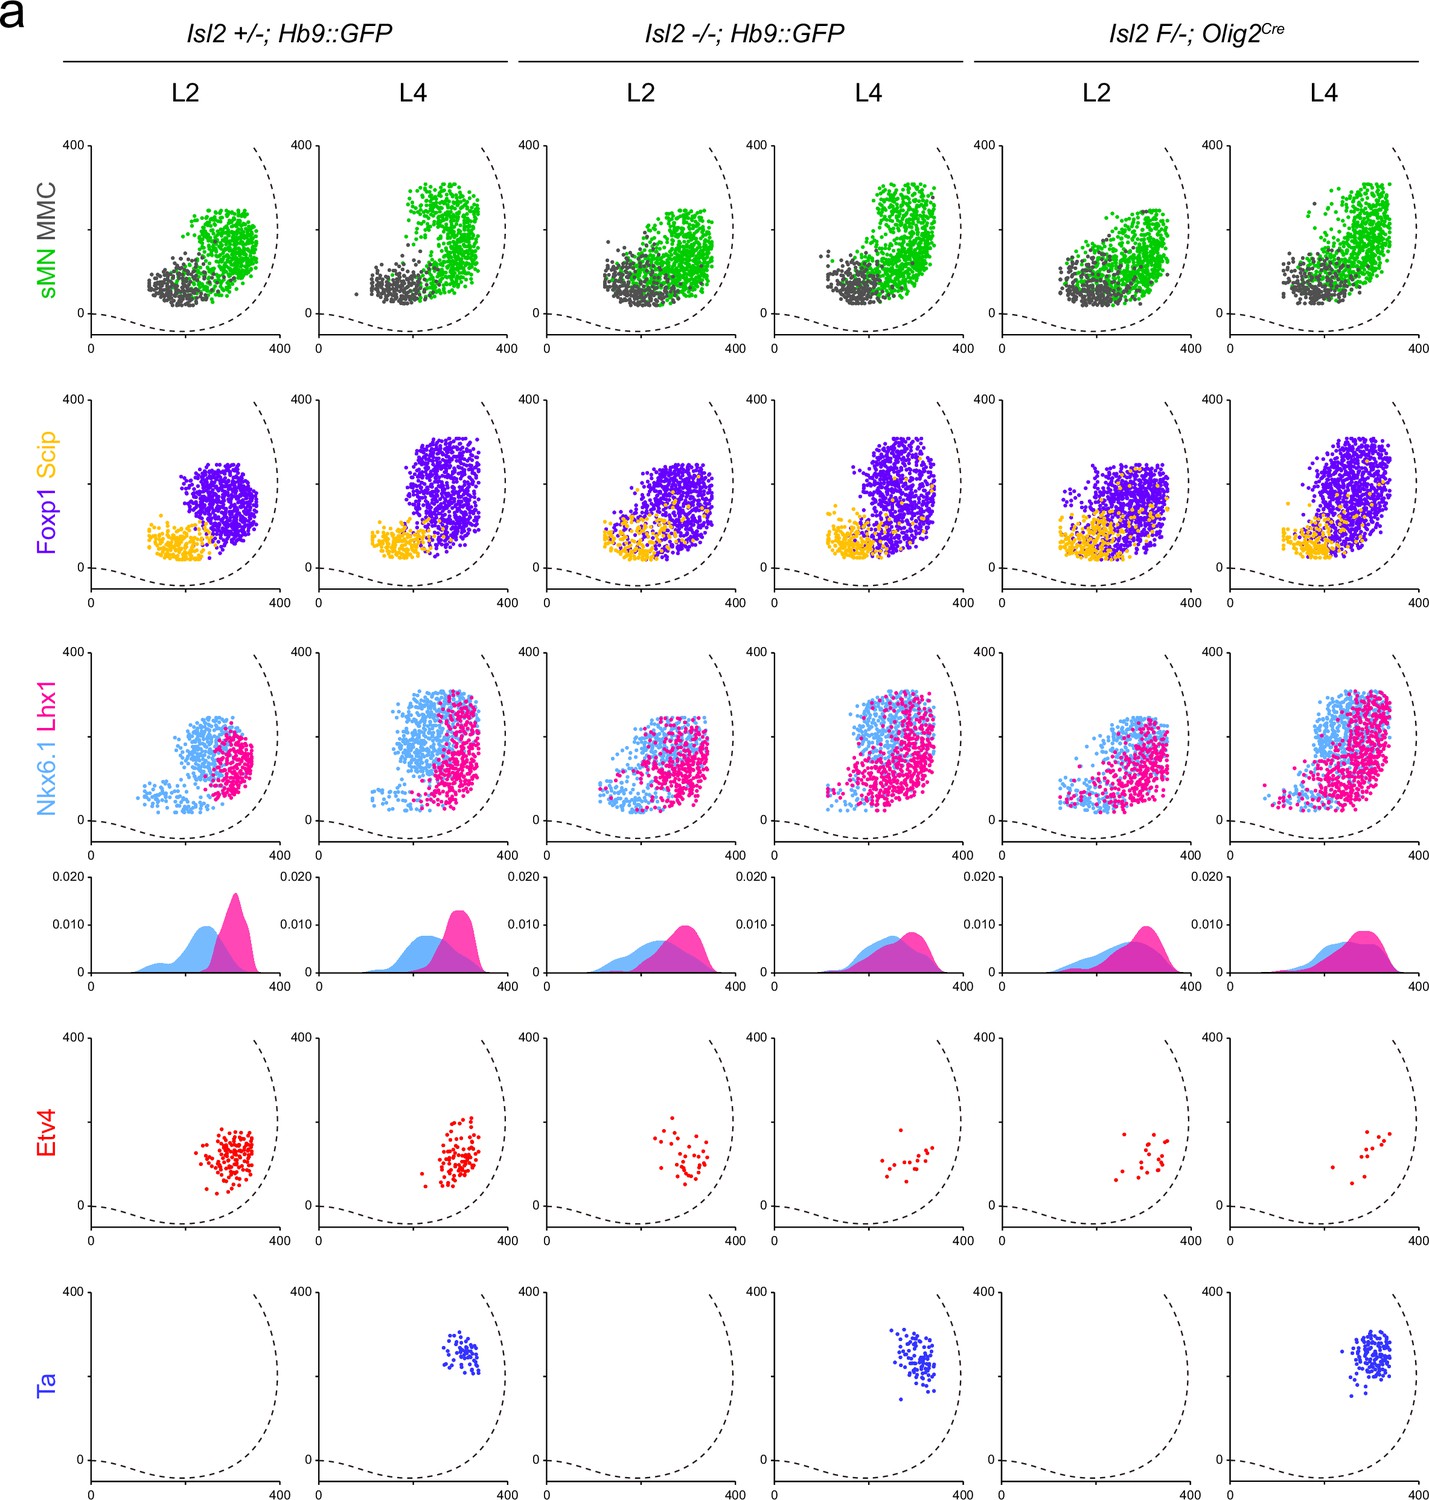
(a) Immunofluorescence images of motor neurons (MNs) labeled with Hb9, Lhx3, Foxp1, Scip, Nkx6.1, Lhx1, Isl1, and Etv4 in adjacent sections of L2 and L4 spinal cords from Het (+/-), Isl2 knockout (KO) (-/-), and Isl2 conditional KO (cKO) (Isl2 F/-; Olig2Cre) mice. (b) Average ventro-dorsal distribution of MMC (Hb9+Lhx3+) and MMC/HMC (Hb9+Foxp1-Scip+) neurons and medio-lateral distribution of LMCm (Hb9lowNkx6.1+) and LMCl (Hb9highLhx1+) neurons in heterozygote, Isl2 KO, and Isl2 cKO embryos. n=3 mice for each genotype; SD is shown; one-way ANOVA with Bonferroni’s post hoc test; **p<0.01, *p<0.05. See Supplementary file 2 and source data for detailed n and statistics. (c) The average cell count per embryo in Etv4+ rectus femoris (Rf)/tensor fasciae latae (Tfl)/gluteus (Gl) and Nkx6.1+Lhx1+ Ta motor pools. n=3 mice for each genotype; SEM is shown; one-way ANOVA with Bonferroni’s post hoc test, ***p<0.001, n.s.=not significant. Box plots illustrate data distribution with median (center line), first and third quartiles (box boundaries), and 10th-90th percentiles (whiskers). See Supplementary file 2 and source data for detailed n and statistics. (d) Summary diagram depicting the position of major lumbar motor pools: rectus femoris (R), tensor fascia latae (T), tibialis anterior (Ta), and Gl. Misspecified motor pools are marked with asterisks. Scale bar, 100 μm.
-
Figure 4—source data 1
Average ventro-dorsal distribution of MMC (Hb9+Lhx3+) and MMC/HMC (Hb9+Foxp1-Scip+) neurons, as well as the medio-lateral distribution of LMCm (Hb9lowNkx6.1+) and LMCl (Hb9highLhx1+) neurons (Figure 4b).
It also includes the average cell count per embryo in Etv4+ rectus femoris (Rf)/tensor fasciae latae (Tfl)/gluteus (Gl) and Nkx6.1+ Lhx1+ tibialis anterior (Ta) motor pools (Figure 4c).
- https://cdn.elifesciences.org/articles/84596/elife-84596-fig4-data1-v2.xlsx
Figure 4—figure supplement 1

Motor neuron (MN) subtypes and motor pool distribution in lumbar spinal cords.
(a) Contour plots and medio-lateral density plots display the spatial distribution of Hb9+ somatic MNs (sMNs, green), Hb9+Lhx3+ MMC neurons (gray), Hb9+Foxp1-Scip+ MMC/HMC neurons (yellow), Hb9+Foxp1+ LMC neurons (purple); Hb9lowNkx6.1+ LMCm neurons (skyblue), Hb9highLhx1+ LMCl neurons (magenta), Hb9+Isl1-Etv4+ rectus femoris (Rf)/tensor fasciae latae (Tfl) and gluteus (Gl) (red), and Hb9+Nkx6.1+Lhx1+ Ta (blue) across L2 and L4 spinal cords in heterozygote, Isl2 knockout (KO), and Isl2 conditional KO (cKO) mice. X and y coordinates on medial-to-lateral and ventral-to-dorsal axes in contour plots are shown in μm.
Figure 4—figure supplement 2
Spatial plots depict position of individual neurons comprising motor columns and motor pools indicated from three different animals shown in Figure 4.
(a) Scatter plots and medio-lateral density plots display the spatial distribution of Hb9+ somatic motor neurons (MNs) (sMNs, green), Hb9+Lhx3+ MMC neurons (gray), Hb9+Foxp1-Scip+ MMC/HMC neurons (yellow), Hb9+Foxp1+ LMC neurons (purple); Hb9lowNkx6.1+ LMCm neurons (skyblue), Hb9highLhx1+ LMCl neurons (magenta), Hb9+Isl1-Etv4+ rectus femoris (Rf)/tensor fasciae latae (Tfl) and gluteus (Gl) (red), and Hb9+Nkx6.1+Lhx1+ Ta (blue) across L2 and L4 spinal cords in heterozygote, Isl2 knockout (KO), and Isl2 conditional KO (cKO) mice. X and y coordinates on medial-to-lateral and ventral-to-dorsal axes in scatter plots are shown in μm.
Figure 5 with 2 supplements
Loss of Etv4 expression in Isl2-null motor neurons (MNs).
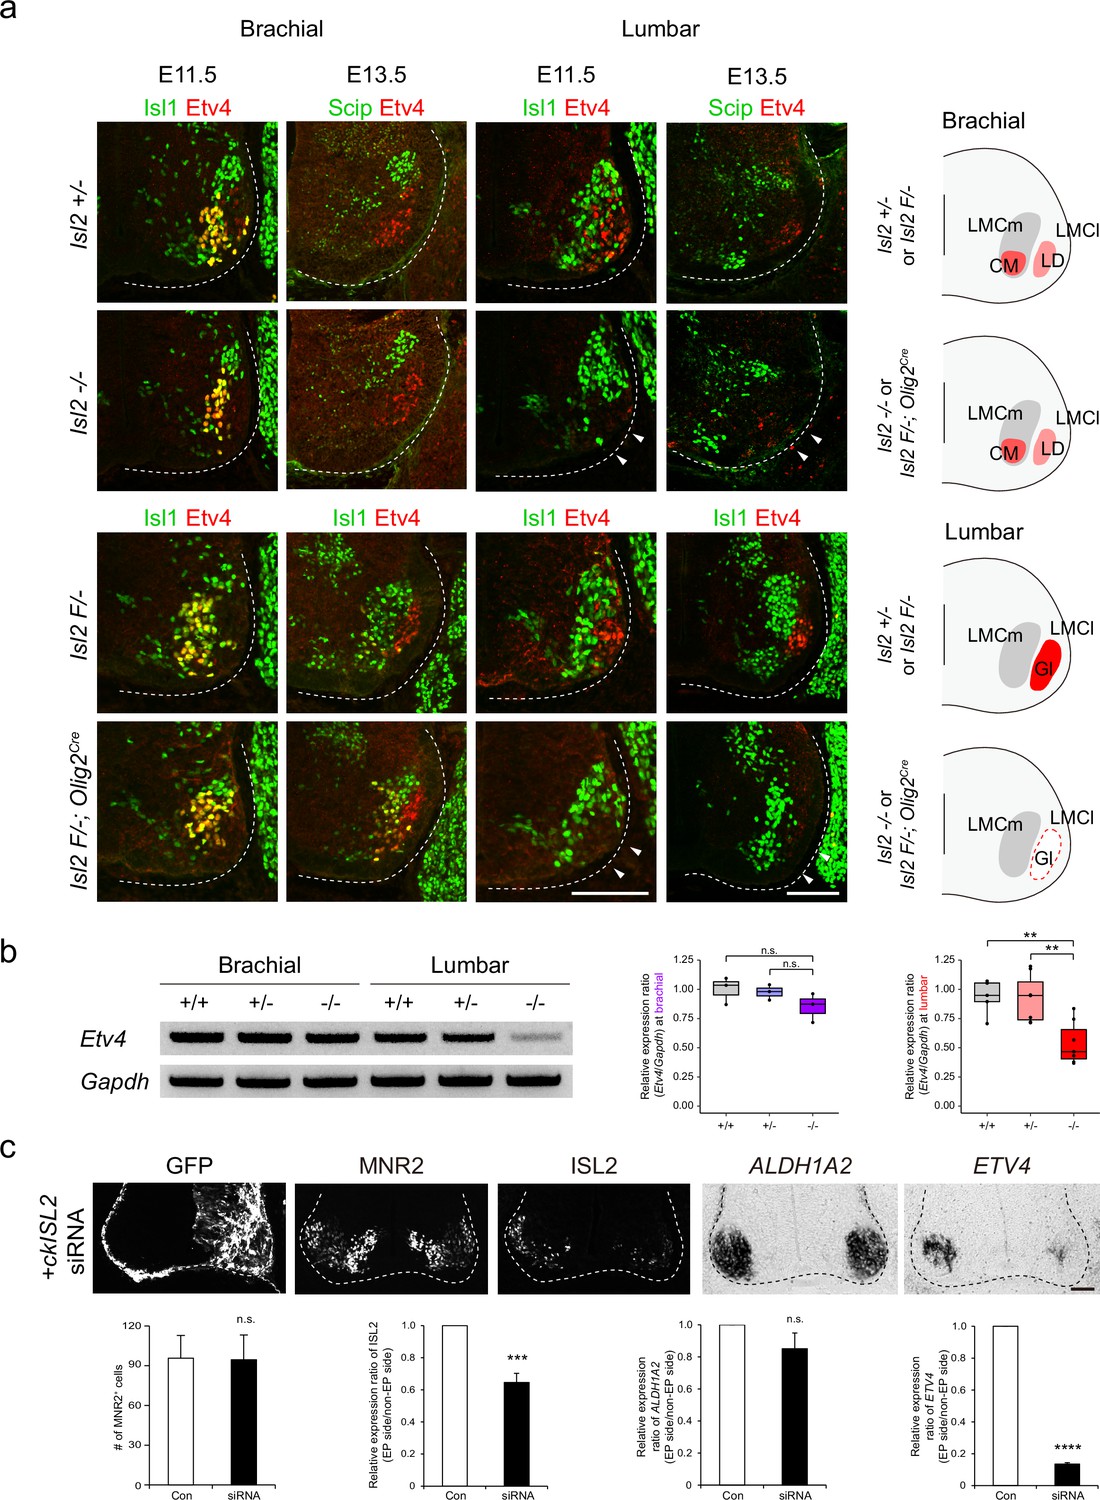
(a) Expression of Isl1, Scip, and Etv4 in brachial and lumbar spinal cords of Isl2 +/-, Isl2 knockout (KO), Isl2 F/−, and Isl2 F/−; Olig2Cre animals at E11.5 and E13.5. Note that Etv4 expression vanishes in lumbar, but not in brachial MNs (arrowheads). Summary diagram depicts the position of lateral motor column (LMC) motor pools innervating the cutaneous maximus (CM), latissimus dorsi (LD), and gluteus (Gl) muscles for each genotype. Scale bars, 100 μm. (b) RT-PCR results and quantification demonstrate reduced Etv4 transcript levels in E12.5 Isl2-null lumbar spinal cords. Relative expression of Etv4 at brachial: 1.00±0.06 for Isl2 +/+, 0.98±0.04 for Isl2 +/-, and 0.85±0.07 for Isl2 KO; p=0.2692 for Isl2 +/+ vs. Isl2 KO, p=0.3736 for Isl2 +/- vs. Isl2 KO; n=3 animals per genotype. Relative expression of Etv4 at lumbar: 1.00±0.08 for Isl2 +/+, 0.96±0.08 for Isl2 +/-, and 0.54±0.07 for Isl2 KO; p=0.0020 for Isl2 +/+ vs. Isl2 KO, p=0.0024 for Isl2 +/- vs. Isl2 KO; n=6–8 animals per genotype. Box plots illustrate distribution with median (center line), first and third quartiles (box boundaries), and 10th-90th percentiles (whiskers). One-way ANOVA with Tukey’s test; see Supplementary file 2 and source data for detailed n and statistics. **p<0.01, n.s.=not significant. (c) Expression of GFP, MNR2, ISL2, ALDH1A2, and ETV4 in HH stage 25 chick neural tubes, electroporated with siRNA against ISL2. Quantification analysis includes the average MNR2-expressing MNs per embryo (96±17 MNs for control, vs. 95±19 for siRNA-electroporated chick, p=0.9622), average fluorescent intensity of ISL2 expression per embryo (1.00 of relative expression ratio for control, vs. 0.65±0.06 for siRNA-electroporated side, p=0.0008), and average relative expression of ALDH1A2 per embryo (1.00 for control, vs. 0.85±0.10 for siRNA-electroporated side, p=0.3340), and average relative expression of ETV4 per embryo (1.00 for control, vs. 0.13±0.01 for siRNA-electroporated side, p<0.0001). Note that the ETV4 transcript was downregulated on the electroporated side (right; n=3–4 animals per group; SEM is shown; unpaired Student’s t-test; see Supplementary file 2 and source data for detailed n and statistics). ****p<0.0001, ***p<0.001, n.s.=not significant. Scale bars, 50 μm.
-
Figure 5—source data 1
Quantification of relative expression of Etv4 in brachial and lumbar spinal cords of wild-type, Isl2 +/- and Isl2-null embryos for Figure 5b.
- https://cdn.elifesciences.org/articles/84596/elife-84596-fig5-data1-v2.xlsx
-
Figure 5—source data 2
Quantification of MNR2+ cells and relative expression of ISL2, ETV4, ALDH1A2 in chick spinal cords, electroporated with siRNA against ISL2 for Figure 5c.
- https://cdn.elifesciences.org/articles/84596/elife-84596-fig5-data2-v2.xlsx
-
Figure 5—source data 3
Unedited raw agarose gel pictures and labeled gel pictures of RT-PCR results for Figure 5b.
- https://cdn.elifesciences.org/articles/84596/elife-84596-fig5-data3-v2.zip
Figure 5—figure supplement 1

Original unprocessed images of RT-PCR results in Figure 5b.
Original unprocessed RT-PCR images for Gapdh and Etv4 in brachial and lumbar spinal cords of E12.5 wild-type, Isl2 +/-, and Isl2-null embryos.
Figure 5—figure supplement 2

Assessment of siRNA knockdown (KD) efficiency of siRNA.
(a–b) Assessment of siRNA KD efficiency of siRNA in HEK293 cells transiently transfected with N-terminal truncated chick ISL2 (aa 38–356) with HA tag and either ckISL2 siRNA 461 or 605, as indicated. Both siRNAs efficiently downregulated ckISL2 protein expression, as determined by anti-HA immunoblot. siRNA 461 was used in Figure 5 experiments.
-
Figure 5—figure supplement 2—source data 1
Unprocessed blot and the labeled blot images for reference (Figure 5—figure supplement 2a–b).
- https://cdn.elifesciences.org/articles/84596/elife-84596-fig5-figsupp2-data1-v2.zip
Figure 6 with 1 supplement
Transcriptome analysis of Isl2-deficient brachial and lumbar motor neurons (MNs) at E12.5.
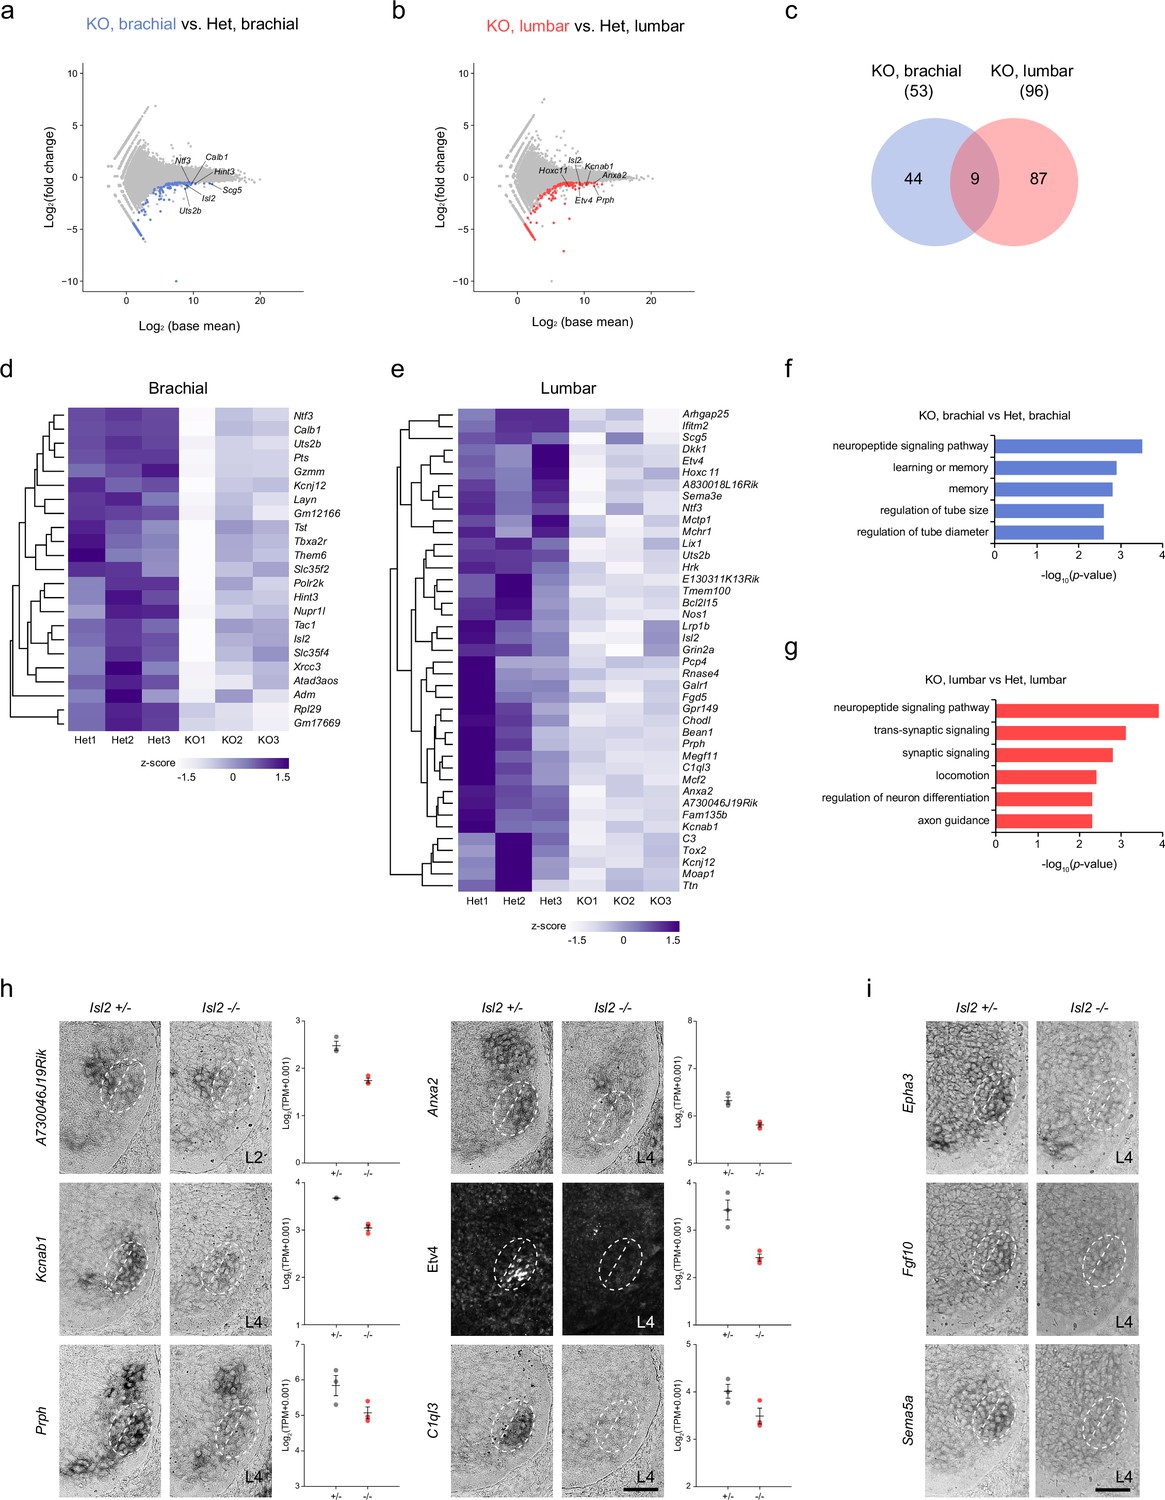
(a, b) MA plots highlighting top differentially expressed genes (DEGs) in brachial and lumbar MNs of E12.5 Isl2-null and Isl2 +/- embryos. (c) Venn diagram depicting the overlap of downregulated genes in brachial and lumbar MNs in Isl2-null embryos. (d, e) Heatmaps illustrating selected downregulated genes in the brachial and lumbar spinal cords of Isl2-deleted embryos. (f, g) Gene ontology (GO) analysis of downregulated DEGs at the brachial and lumbar levels in Isl2 knockout (KO) embryos. (h) In situ hybridization and immunohistochemistry of selected downregulated genes in E12.5 Isl2-deficient lumbar spinal cords. Dotted lines indicate the position of LMCm and LMCl. Data points of the graphs indicate normalized read counts from individual animals. SEM is shown. (i) Expression assessment of Epha3, Fgf10, and Sema5a, genes enriched in sb.LMCl.2 subcluster from scRNA-seq analysis in Figure 6—figure supplement 1. Scale bars, 50 μm.
Figure 6—figure supplement 1
Identification of lateral motor column (LMC) clusters in which the gene signatures relate to Isl2.
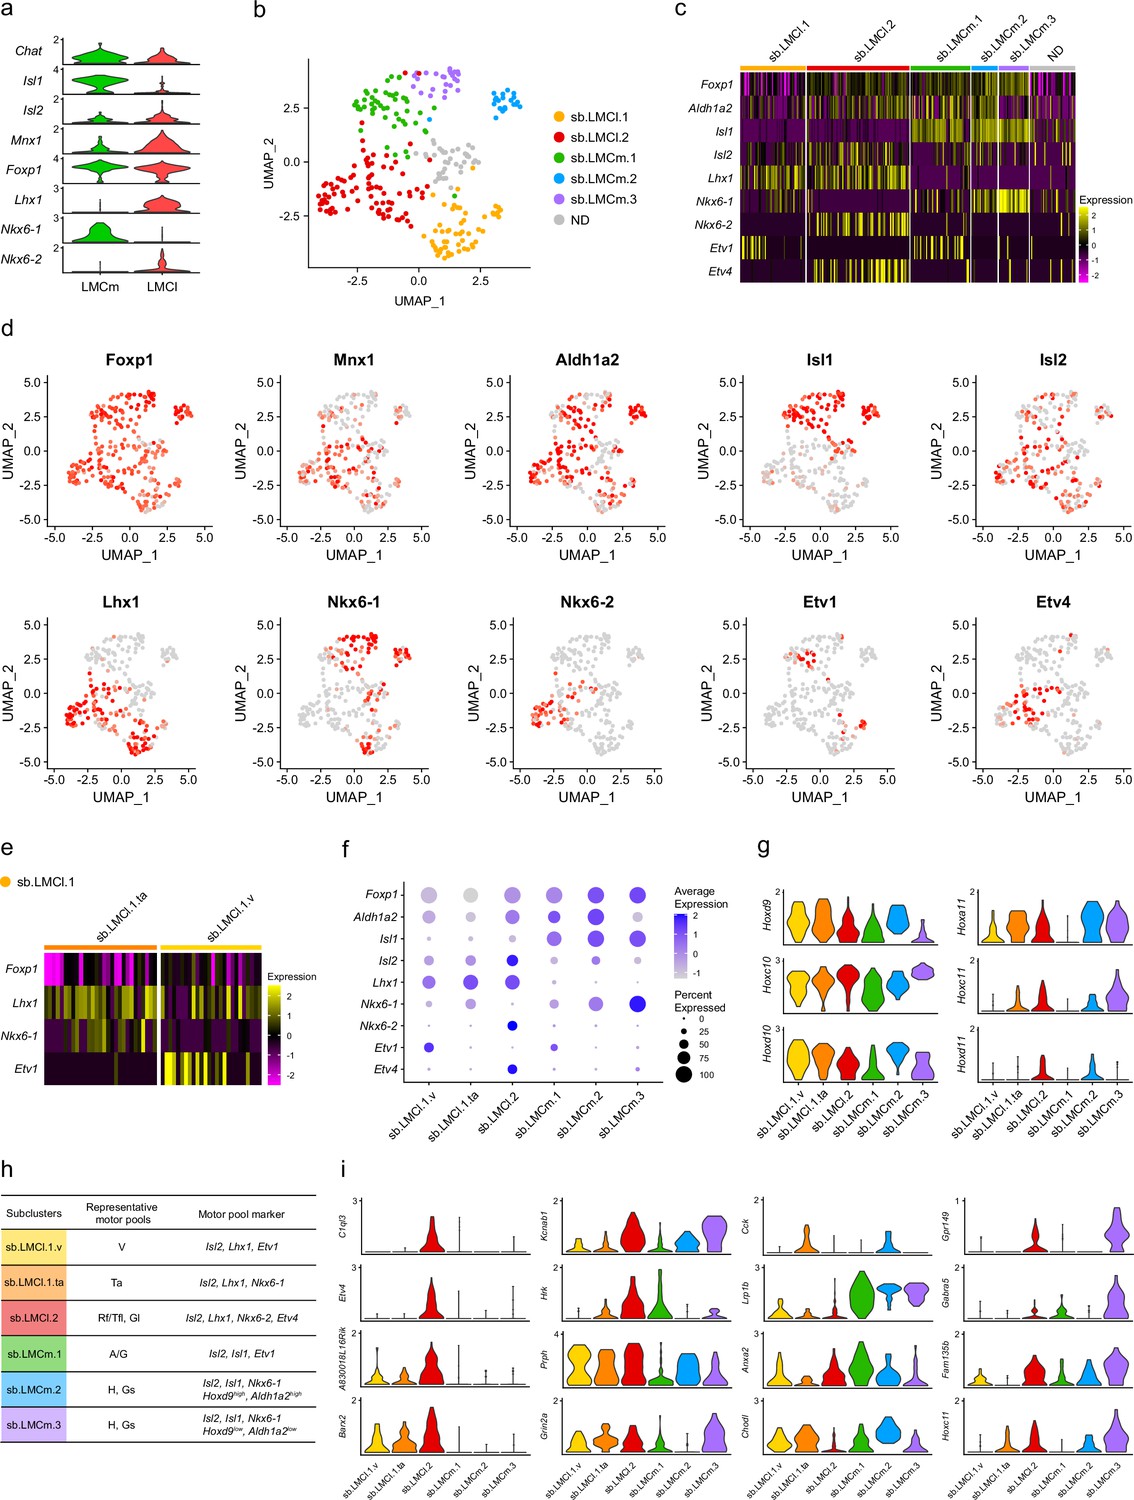
(a) scRNA-seq data based on Amin et al.’s study. Violin plots illustrating motor neuron (MN) subtype markers (Chat, Isl1, Isl2, Mnx1, Foxp1, Lhx1, Nkx6-1, and Nkx6-2) in LMCm and LMCl clusters. ND, not defined. (b) Uniform Manifold Approximation and Projection (UMAP) plot displaying lumbar LMC cluster cells. (c) Heatmap showing marker genes for MN subtypes and motor pools of six clusters. (d) UMAP plots showing gene expression of LMC and motor pool markers. (e) Heatmap showing marker genes for sb.LMCl.1.ta and sb.LMCl.1.v. (f) Dot plot showing expression patterns of MN markers of LMC subclusters. (g) Violin plots depicting Hox genes expression in LMC subclusters. (h) Summary of markers of LMC subclusters. (i) Violin plots illustrating selected differentially expressed genes (DEGs) downregulated in Isl2-deficient spinal cords.
Figure 7
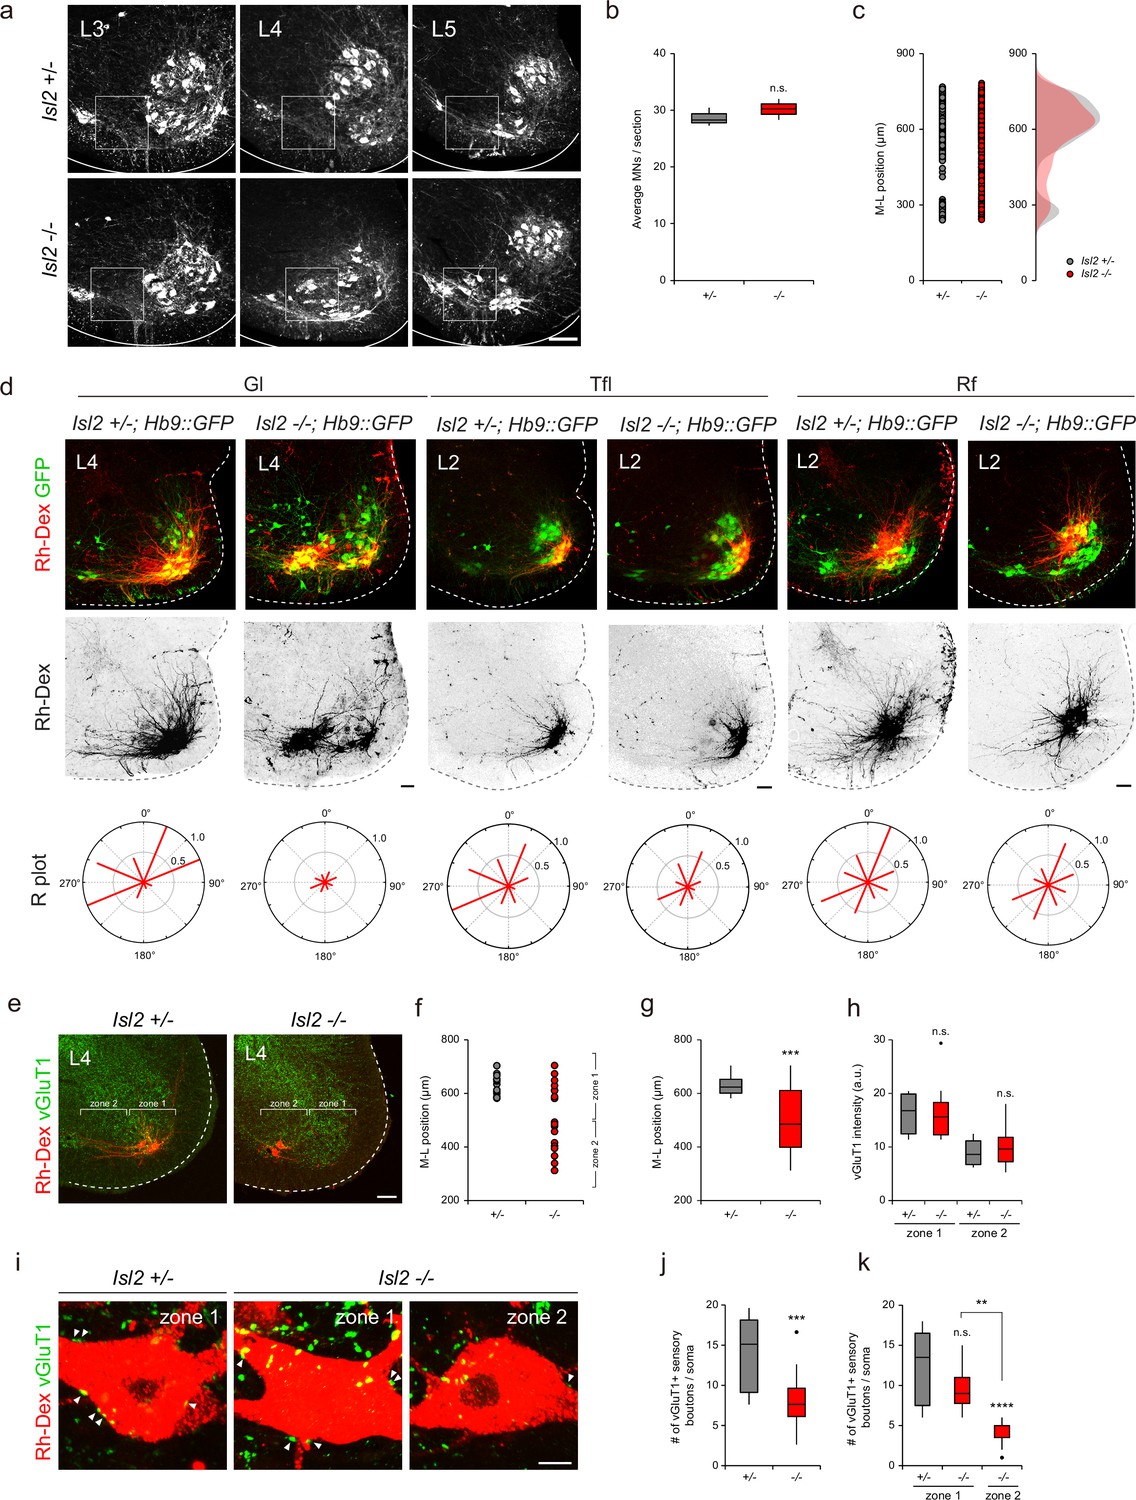
Impaired proprioceptive sensory nerve connectivity in the gluteus (Gl) motor pools of Isl2 mutant mice.
(a–c) Representative images of adult lumbar spinal cords immunostainined with ChAT antibody and quantification of average number of motor neurons (MNs) (b) and their medio-lateral distribution (c). (d) Representative dendritic arbors of Gl, tensor fasciae latae (Tfl), and rectus femoris (Rf) motor pools retrogradely labeled with rhodamine-dextran (Rh-Dex). Radial (R) plots show average dendritic membrane density per octant (red bars) from motor somata (six to eight adjacent sections per group, three animals per group). (e) Representative images of P21 Isl2 +/- and Isl2-null lumbar spinal cords with designated zone 1 and zone 2 regions. (f) Medio-lateral distribution of Rh-Dex-labeled Gl motor pools in Isl2 +/- and Isl2 KO mice. (g) Average medio-lateral position of Gl motor pools in Isl2 +/- and Isl2 knockout mice with box plot depicting the number of dextran-labeled Gl neurons. (h) Quantification of vGluT1 intensity in zone 1 and zone 2 in Isl2 +/- and Isl2 KO mice. (i) Representative images showing the contact of vGluT1+ Gl sensory boutons with Rh-Dex-labeled Gl MNs (arrowheads). (j) The number of sensory boutons per cell body (12.4±1.2 boutons for Isl2 +/-, vs. 6.4±0.8 boutons for Isl2 KO, p=0.0002). (k) The number of sensory boutons per cell body in zone 1 and zone 2 (12.4±1.2 boutons for zone 1 in Isl2 +/-, 9.5±1.0 boutons for zone 1 in Isl2 KO, and 4.2±0.5 for zone 2 in Isl2 KO). p=0.1488 for zone 1 in Isl2 +/- vs. zone 1 in Isl2 KO; p<0.0001 for zone 1 in Isl2 +/- vs. zone 2 in Isl2 KO; p=0.0062 for zone 1 in Isl2 KO vs. zone 2 in Isl2 KO. Box plots illustrate distribution with median (center line), first and third quartiles (box boundaries), and 10th-90th percentiles (whiskers).; unpaired Student’s t-test for b, g, h, j and one-way ANOVA with Tukey’s test for k; see Supplementary file 2 and source data for detailed n and statistics. ****p<0.0001, ***p<0.001, **p<0.01, n.s.=not significant. Scale bars: (a) 100 μm, (d) 100 μm, (e) 100 μm, (i) 10 μm.
-
Figure 7—source data 1
Average number of ChAT-expressing motor neurons (MNs) for Figure 7b.
- https://cdn.elifesciences.org/articles/84596/elife-84596-fig7-data1-v2.xlsx
-
Figure 7—source data 2
Quantification of the number of vGluT1+ sensory boutons per cell body and intensity in P21 Isl2 +/- and Isl2 knockout (KO) mice for Figure 7f–h and j–k.
- https://cdn.elifesciences.org/articles/84596/elife-84596-fig7-data2-v2.xlsx
Figure 8 with 3 supplements
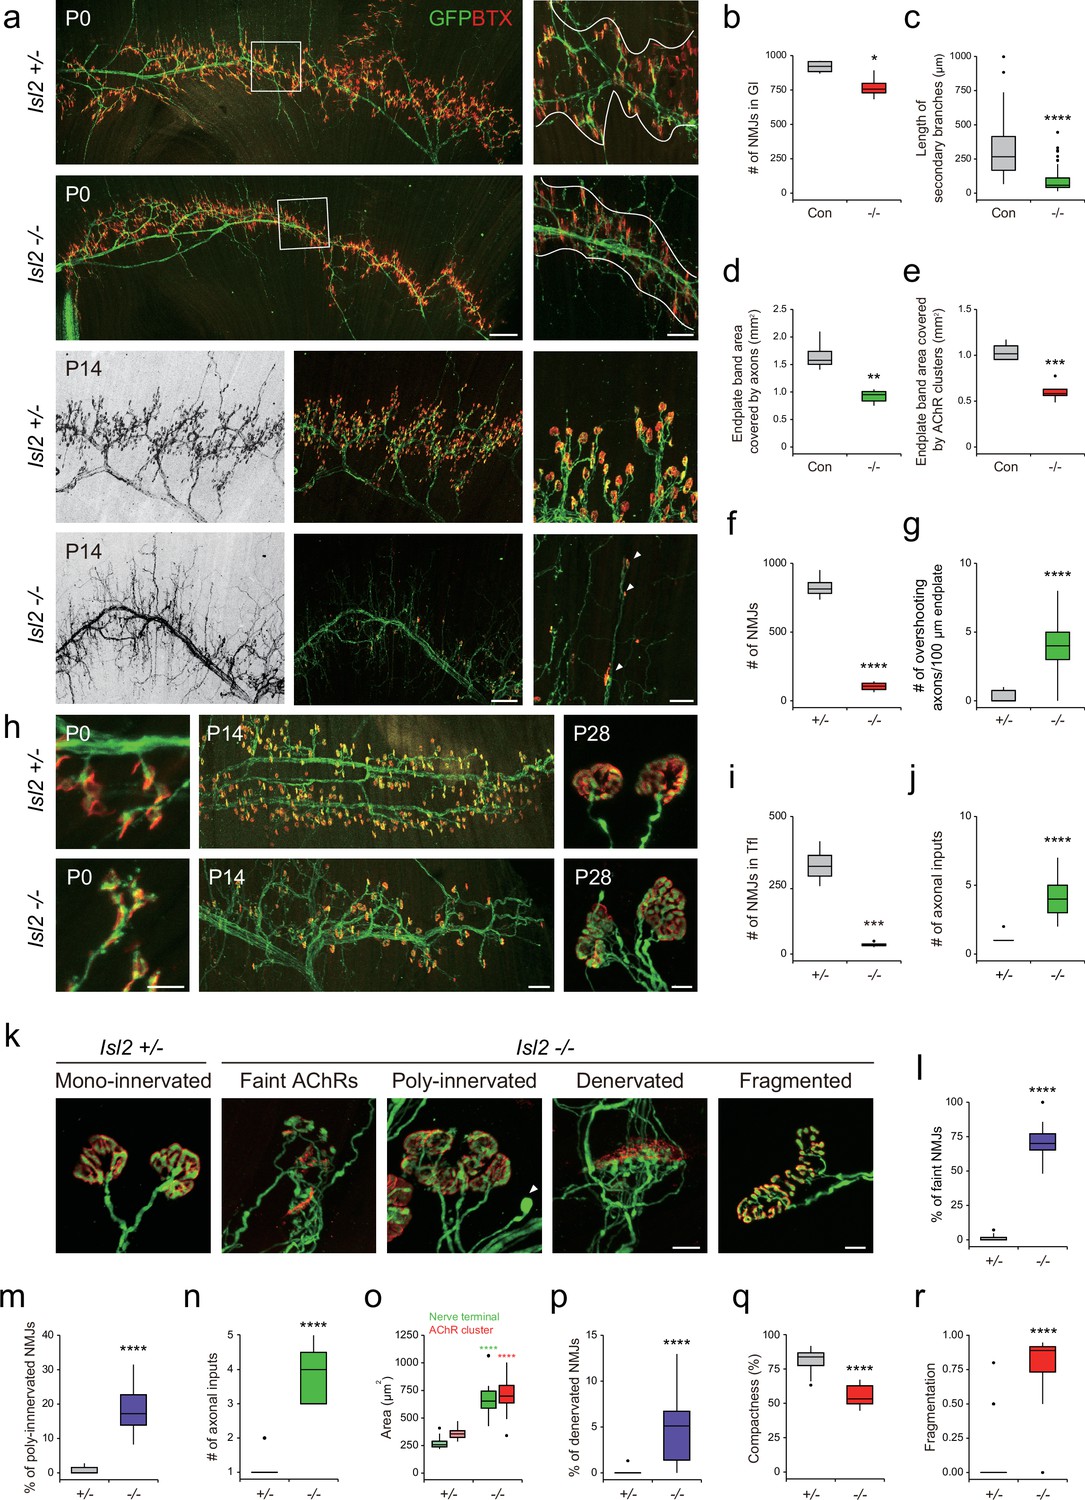
Reduced terminal motor axon branching in gluteus (Gl) muscles of Isl2 mutants.
(a) Visualization of motor axons and neuromuscular junctions (NMJs) in P0 and P14 Gl muscles with Hb9::GFP (green) and α-bungarotoxin (BTX, red) immunoreactivity. Higher magnification views are provided for the boxed regions. The NMJ region is delineated by white lines in P0. Arrowheads indicate atrophic NMJs on overshooting axons in P14. (b) Number of NMJs in P0 Gl muscles (919±23 NMJs for control, vs. 772±44 for Isl2 knockout [KO], p=0.0257, n=4 muscles per group, three animals). (c) Secondary branch length (313±17 μm for control, vs. 92±8 μm for Isl2 KO, p<0.0001, n=90–120 axons per group, three animals) in P0 Gl muscles. (d) End plate area covered by motor axons (1.66±0.15 mm2 for control, vs. 0.92±0.06 mm2 for Isl2 KO, p=0.0014, n=4–5 muscles per group, three animals) in P0 Gl muscles. (e) End plate area covered by AChR clusters (1.04±0.05 mm2 for control, vs. 0.61±0.05 mm2 for Isl2 KO, p=0.0005, n=4–5 muscles per group, three animals) in P0 Gl muscles. (f) The number of AChR clusters (828±45 NMJs for Isl2 +/-, vs. 104±18 for Isl2 KO, p<0.0001, n=4 muscles per group, three animals) in P14 Gl muscles. (g) Axons extending beyond AChR clusters at P14 (0.26±0.07 axons for Isl2 +/-, vs. 3.92±0.29 for Isl2 KO, p<0.0001, n=39–46 100 μm intervals of end plate per group, three animals). (h) Visualization of motor axons and NMJs in P0, P14, and P28 tensor fasciae latae (Tfl) muscles. (i) The number of NMJs at P14 Tfl muscles (324±35 NMJs for Isl2 +/- vs. 34±5 for Isl2 KO, p=0.0002, n=4 muscles per group, three animals). (j) The number of axonal inputs in P28 Tfl muscles (1.09±0.09 axons for Isl2 +/-, vs. 4.08±0.40 axons for Isl2 KO, p<0.0001, n=11–13 NMJs per group, three animals). (k) Representative examples of NMJs with morphological defects at higher magnification in Gl muscles at P14. For compactness and fragmentation analysis, P28 NMJs were analyzed. A swelling axon is indicated by an arrowhead. (l–r) Percentage of faint NMJs (1.12 ± 0.48% for Isl2 +/-, vs. 70.47 ± 3.22% for Isl2 KO, p<0.0001, n=16–17 random fields per group), polyinnervated NMJs (0.81 ± 0.26% for Isl2 +/-, vs. 18.49 ± 2.75% for Isl2 KO, p<0.0001, n=8–17 random fields per group), number of axonal inputs (1.05±0.05 axons for Isl2 +/-, vs. 3.91±0.25 axons for Isl2 KO, p<0.0001, n=11–22 NMJs per group), area of AChR clusters (357±11 μm2 for Isl2 +/-, vs. 701±57 μm2 for Isl2 KO, p<0.0001, n=11–22 NMJs per group) and nerve terminal (270±10 μm2 for Isl2 +/-, vs. 696±63 μm2 for Isl2 KO, p<0.0001, n=11–22 NMJs per group), percentage of denervated NMJs (0.08 ± 0.08% for Isl2 +/-, vs. 4.95 ± 1.04% for Isl2 KO, p<0.0001, n=16–17 random fields per group), compactness (81.78 ± 1.07% for Isl2 +/-, vs. 55.52 ± 1.99% for Isl2 KO, p<0.0001, n=15–39 NMJs per group) and fragmentation (0.06±0.03 for Isl2 +/-, vs. 0.78±0.06 for Isl2 KO, p<0.0001, n=15–39 NMJs per group) of AChR clusters were measured. n=3 animals per group; box plots illustrate distribution with median (center line), first and third quartiles (box boundaries), and 10th and 90th percentiles (whisker); unpaired Student’s t-test in b-f, and o; Mann-Whitney test in g, j, l-n and p-r; see Supplementary file 2 and source data for detailed n and statistics. ****p<0.0001, ***p<0.001, **p<0.01, *p<0.05, n.s.=not significant. Scale bars: (a) 200 μm (for low-magnification images) and 50 μm (for high-magnification images), (h) 20 μm in P0, 100 μm in P14, and 10 μm in P28. (k) 10 μm.
-
Figure 8—source data 1
Quantification of gluteus (Gl) neuromuscular junctions (NMJs) in Isl2 +/- and Isl2 knockout (KO) mice for Figure 8b–g and l–r.
- https://cdn.elifesciences.org/articles/84596/elife-84596-fig8-data1-v2.xlsx
-
Figure 8—source data 2
Quantification of tensor fasciae latae (Tfl) neuromuscular junctions (NMJs) in Isl2 +/- and Isl2 knockout (KO) mice for Figure 8i–j.
- https://cdn.elifesciences.org/articles/84596/elife-84596-fig8-data2-v2.xlsx
Figure 8—figure supplement 1
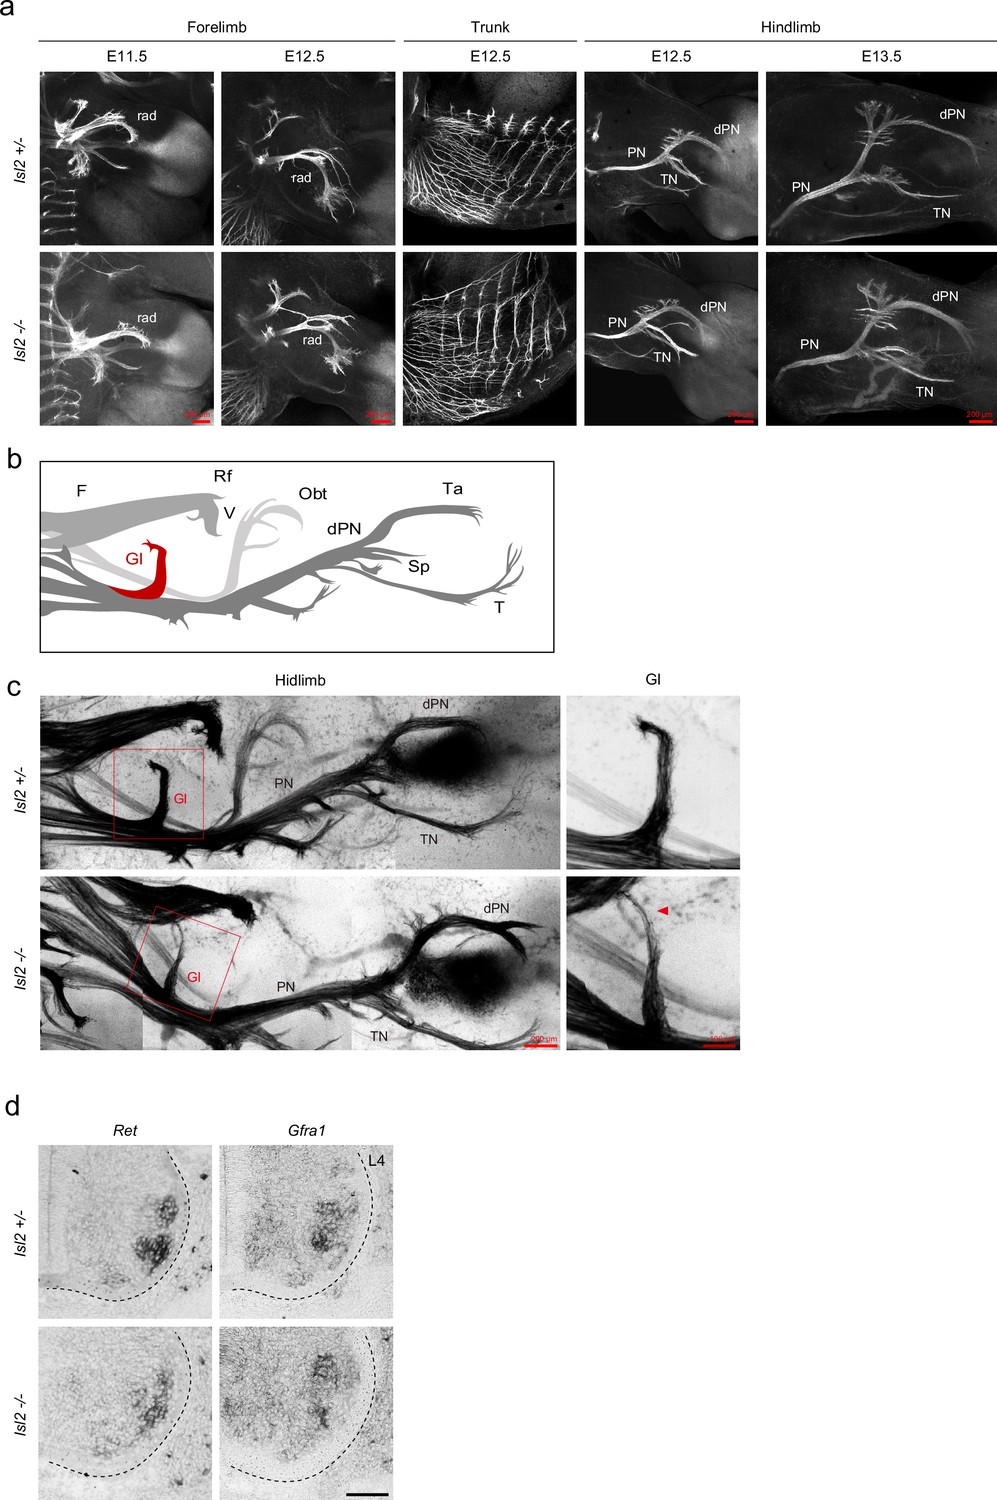
Normal motor nerve innervation in Isl2 mutant hindlimbs.
(a) Whole-mount immunostaining of GFP antibody in forelimbs and hindlimbs of E12.5 and E13.5 Isl2 +/- and Isl2 knockout (KO) embryos. (b) Diagram of nerve trunks in the hindlimb. Hb9-driven GFP-labeled axons show major nerve trunks leading to target muscles. The femoral (F) nerve trunk gives rise to branches targeting the rectus femoris (Rf) and vasti (V) muscles, while the peroneal (P) nerve trunk produces branches targeting the gluteus (Gl) and tibialis anterior (Ta) muscles. (c) E13.0 Isl2 +/- and Isl2 KO embryos showing spinal motor nerve projection labeled with Hb9::GFP. dPN, deep peroneal; F, femoral; Gl, gluteus; Obt, obturator; PN, peroneal nerve; rad, radial; Rf, rectus femoris; Sp, superficial peroneal; T, tibialis; Ta, tibialis anterior; TN, tibial nerve; V, vasti. (d) Expression of Ret and Gfrα1 in Isl2 +/- and Isl2 KO embryos. Scale bars as indicated and 100 μm in (d).
Figure 8—figure supplement 2

Reduced terminal motor axon branching and immature neuromuscular junctions (NMJs) in gluteus (Gl) muscles of Isl2 conditional knockout (cKO).
(a) Visualization of motor axons and NMJs in E18.5 Gl muscles with Thy1::YFP (green) and α-bungarotoxin (BTX, red) immunoreactivity. Scale bar, 200 μm. (b) Higher magnification views of various NMJs showing abnormal features, such as elongated NMJs (arrowheads) or NMJs in contact with primary axon shaft (arrow), in Isl2 cKO. Scale bar, 20 μm.
Figure 8—figure supplement 3

Organization of neuromuscular junctions (NMJs) in various hindlimb muscles of Isl2 mutants.
(a) NMJs in Vl, Vm, and Ta muscles of P0 control Hb9::GFP or Isl2 knockout (KO); Hb9::GFP animals were visualized using GFP (green) and α-bungarotoxin (BTX) staining. The boxed regions on the left are shown in higher magnification on the right. Vl, vastus lateralis; Vm, vastus medialis. Scale bars, 200 μm. (b) Neuromuscular junctions in the psoas major, rectus femoris, vastus lateralis, tibialis anterior, and gastrocnemius muscles of Isl2 +/-; Hb9::GFP or Isl2 KO; Hb9::GFP animals at P14 were visualized using GFP (green) and BTX staining. Scale bar, 50 μm.
Figure 9 with 1 supplement
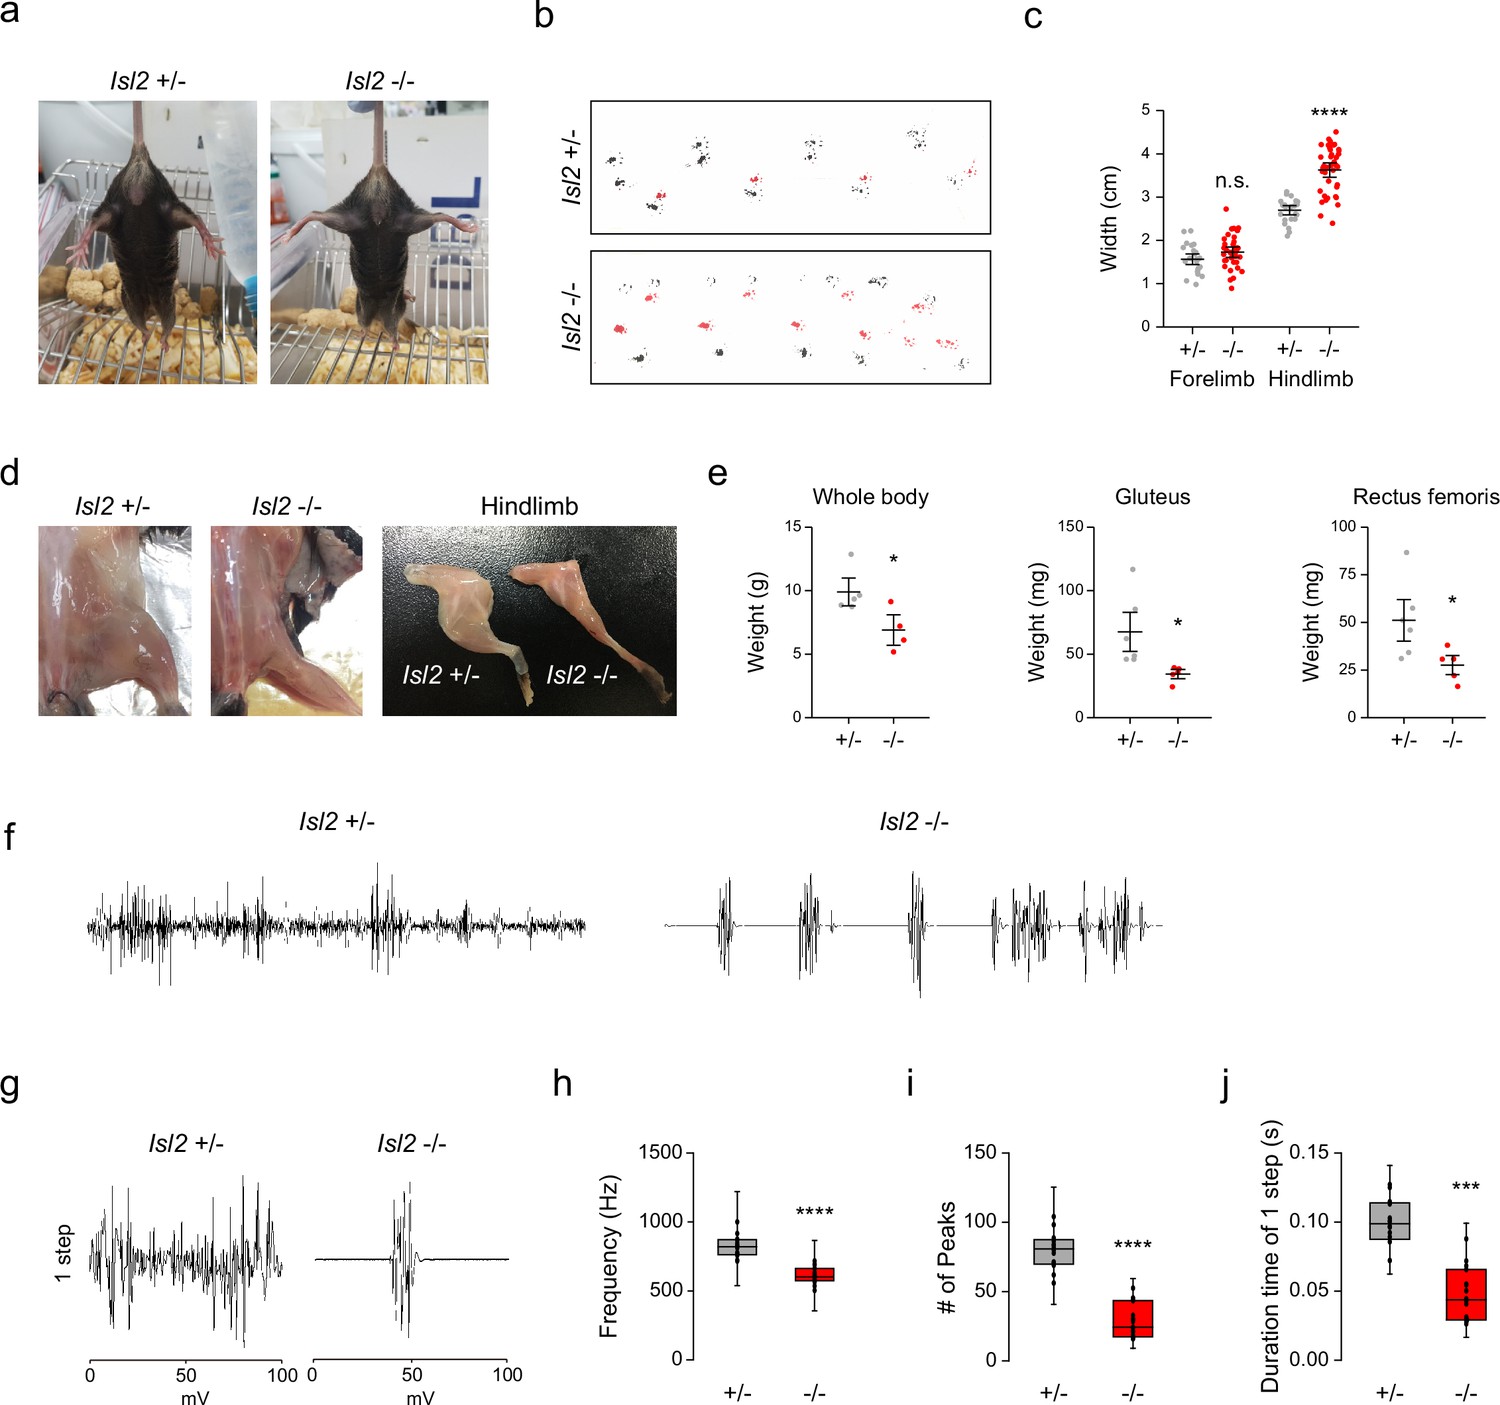
Hindlimb gait impairment in Isl2 mutants.
(a) Tail suspension test images showing rigid wide-open posture of the hindlimbs in Isl2 mutant mice. (b) Footprint patterns of 3-month-old Isl2 +/- and Isl2 knockout (KO) mice. (c) Measurement of the stride width of forelimbs (1.56±0.06 cm for Isl2 +/-, vs. 1.73±0.06 cm for Isl2 KO, p=0.0782) and hindlimbs (2.70±0.05 cm for Isl2 +/-, vs. 3.63±0.09 cm for Isl2 KO, p<0.0001). n=5–8 animals per genotype; SEM is shown; unpaired Student’s t-test; see Supplementary file 2 and source data for detailed n and statistics. ****p<0.0001, n.s.=not significant. (d) Gross appearance of lower limbs and dissected hindlimb samples of adult Isl2 +/- and Isl2 KO mice. (e) Measurement of body (9.9±0.8 g for Isl2 +/-, vs. 6.9±0.8 g for Isl2 KO, p=0.0339) and muscle weight for gluteus (GI) (67.6±12.6 mg for Isl2 +/-, vs. 34.3±2.7 mg for Isl2 KO, p=0.0316, n=5–6 muscles per group) and rectus femoris muscles (51.1±8.2 mg for Isl2 +/-, vs. 27.6±3.8 mg for Isl2 KO, p=0.0384, n=5–6 muscles per group). n=5 animals for heterozygote, n=4 animals for KO; SEM is shown; unpaired Student’s t-test; see Supplementary file 2 and source data for detailed n and statistics. *p<0.05. (f) Representative electromyographic (EMG) recordings of Gl muscles during free-walking. (g) Signature of individual footsteps. (h–j) Quantification of average frequency (861±18 Hz for Isl2 +/-, vs. 619±16 Hz for Isl2 KO, p<0.0001), number of single-motor-unit potentials (80±4 peaks for Isl2 +/-, vs. 42±3 peaks for Isl2 KO, p<0.0001), and burst activity duration (0.096±0.005 s for Isl2 +/-, vs. 0.068±0.005 s for Isl2 KO, p=0.0001) in EMG recordings of Gl muscles. Three animals per group; box plots illustrate distribution with median (center line), first and third quartiles (box boundaries), and 10th-90th percentiles (whiskers); unpaired Student’s t-test; see Supplementary file 2 and source data for detailed n and statistics. ****p<0.0001, ***p<0.001.
-
Figure 9—source data 1
Measurement of stride width of forelimbs and hindlimbs in footprint analysis of 3-month-old Isl2 +/- and Isl2 knockout (KO) mice for Figure 9c.
Measurement of body and muscle weight of the gluteus and rectus femoris muscles of Isl2 +/- and Isl2 KO mice for Figure 9e.
- https://cdn.elifesciences.org/articles/84596/elife-84596-fig9-data1-v2.xlsx
-
Figure 9—source data 2
Quantification of the average frequency, number of single-motor-unit potentials, and burst activity duration in electromyographic (EMG) recordings of the gluteus (Gl) muscles for Figure 9h–j.
- https://cdn.elifesciences.org/articles/84596/elife-84596-fig9-data2-v2.xlsx
Figure 9—figure supplement 1
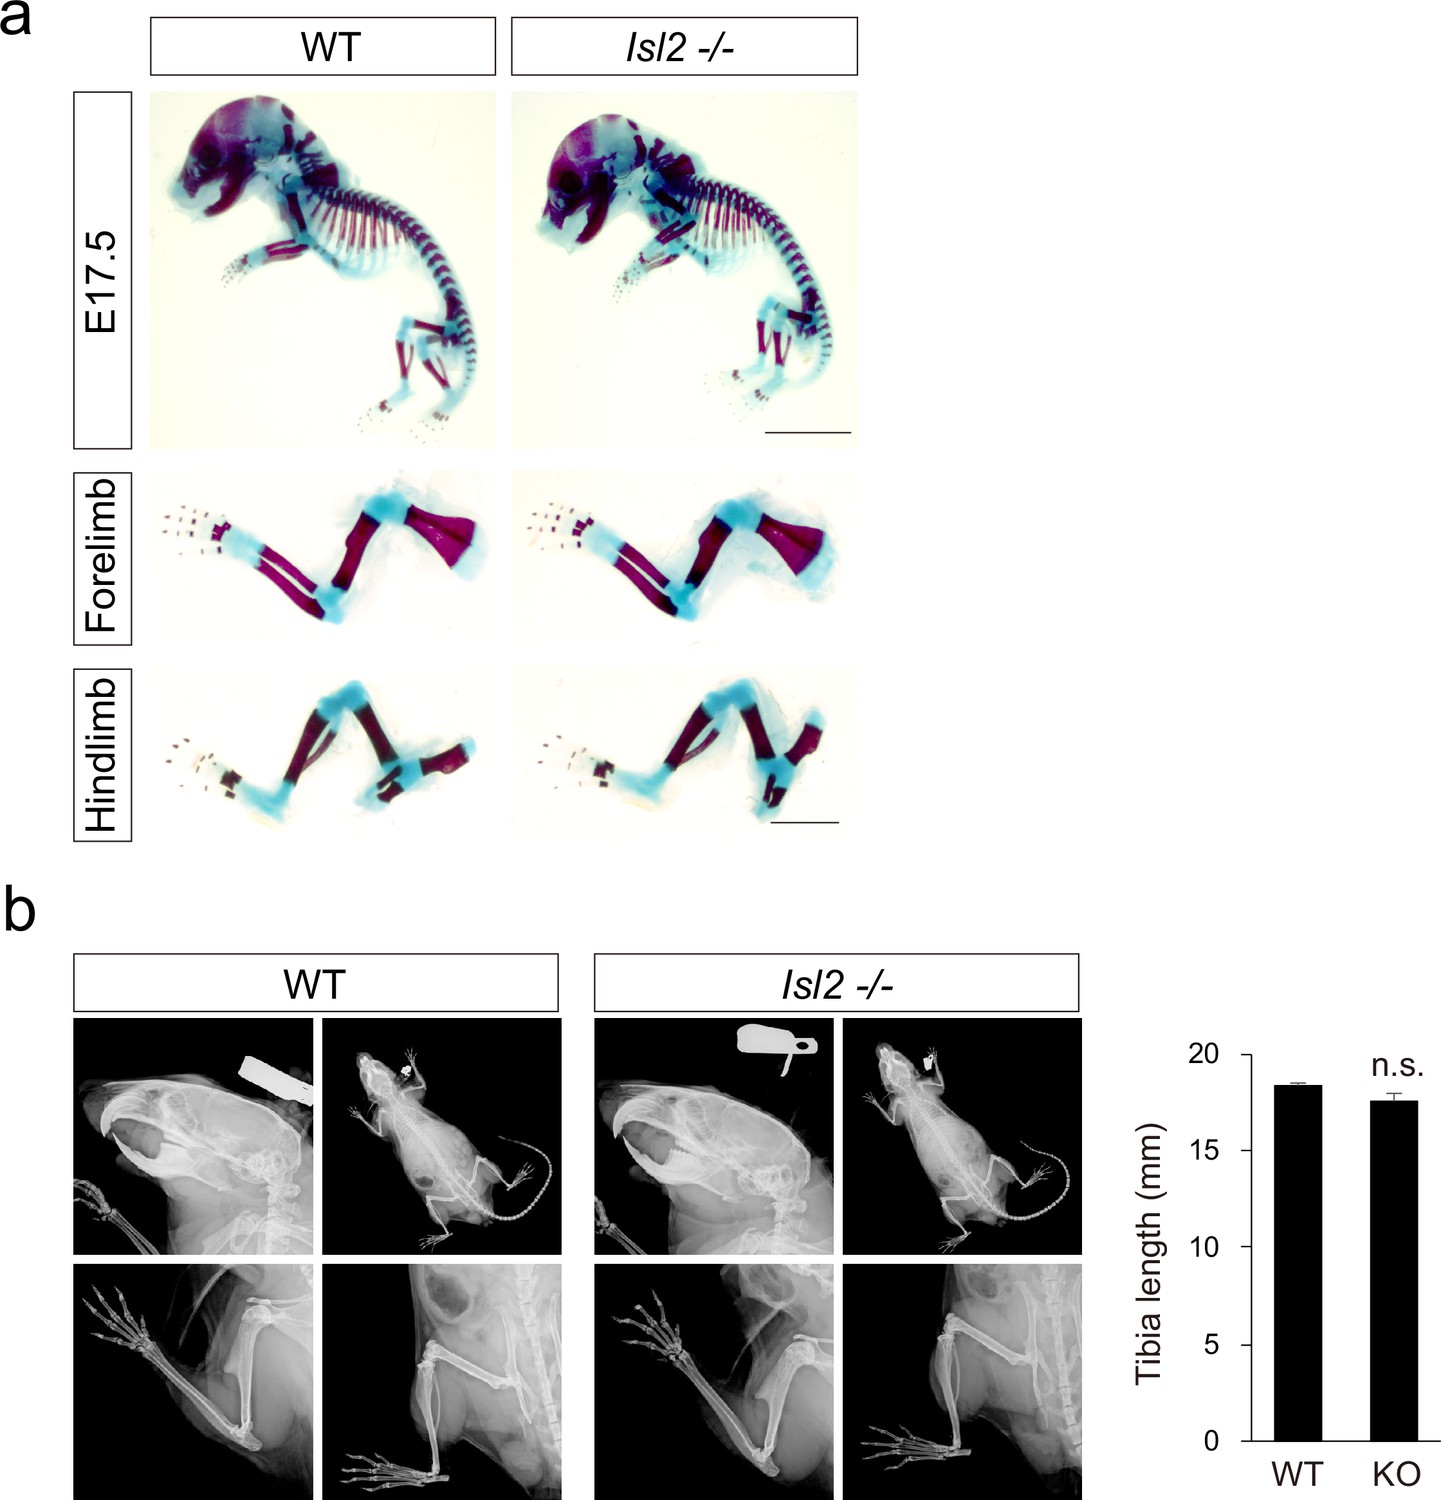
Skeletal analysis in Isl2 mutant mice.
(a) Alcian blue and Alizarin red staining revealing no skeletal abnormalities in E17.5 Isl2 knockout (KO) mice. (b) X-ray analysis indicating normal bone formation in adult Isl2 KO mice. Quantification of tibia length. 18.2±0.1 mm for WT, vs. 17.5±0.4 mm for Isl2 KO, p=0.1812 (left; WT, n=3 animals; KO, n=3 animals). SEM is shown; unpaired Student’s t-test; see Supplementary file 2 and source data for detailed n and statistics. n.s.=not significant.
-
Figure 9—figure supplement 1—source data 1
Quantification of tibia length in X-ray analysis for Figure 9—figure supplement 1b.
- https://cdn.elifesciences.org/articles/84596/elife-84596-fig9-figsupp1-data1-v2.xlsx
Author response image 1

Assessment of dendritic arbors in Ta motor pools and proprioceptive innervation in Gl muscles.
(a) Representative dendritic arbors of Ta motor pools retrogradely labeled with rhodamin-dextran (red). Radial plots show similar dendritic development in Isl2 KO. (b) Sensory innervation of muscle spindle of Gl muscles is normal in P28 Isl2 KO, visualized by YFP expression driven by Thy1::YFP.
Videos
Video 1
Example movie of a new born littermate Isl2F/+ and an Isl2 conditional knockout (cKO) mouse.
Video 2
Example movie of a P14 littermate control Isl2 +/- mouse and an Isl2 knockout (KO) mouse during walking.
Video 3
Example movie of an adult littermate Isl2 +/- and an Isl2 knockout (KO) mouse during walking.
Tables
Key resources table
| Reagent type (species) or resource | Designation | Source or reference | Identifiers | Additional information |
|---|---|---|---|---|
| Strain, strain background (Mouse, female) | C57BL/6J | Damul Science Co. | ||
| Genetic reagent (Mus musculus) | Isl2-/- | PMID:14766174 | MGI:3046260 | |
| Genetic reagent (M. musculus) | Isl2flox/flox | This paper | MGI:109156 | See Materials and methods, and Figure 3—figure supplement 1a |
| Genetic reagent (M. musculus) | Tg(Mnx1-GFP)1Slp | PMID:15201216 | MGI:3767834 | |
| Genetic reagent (M. musculus) | B6.Cg-Tg(Thy1-YFP)16Jrs/J | Jackson Laboratory PMID:11086982 | RRID:IMSR_JAX:003709 | |
| Genetic reagent (M. musculus) | Olig2tm1(cre)Tmj | PMID:18046410 | MGI:3774124 | |
| Cell line (human) | 293[HEK-293] | Korean Cell Line Bank | KCLB# 21573 | Verified using STR profiling and confirmed to be mycoplasma-free |
| Antibody | Anti-Olig2 (guinea pig polyclonal) | Jessell lab | (1:8000) | |
| Antibody | Anti-Hb9 (rabbit polyclonal) | PMID:10471502 | (1:8000) | |
| Antibody | Anti-Hb9 (guinea pig polyclonal) | PMID:10482235 | (1:2000) | |
| Antibody | Anti-GFP (mouse monoclonal) | Sigma | Cat# G6539 | (1:2000) |
| Antibody | Anti-Isl1/2 (rabbit polyclonal) | PMID:7528105 PMID:8565076 | (1:5000) | |
| Antibody | Anti-Isl2 (mouse monoclonal) | Santa Cruz | Cat# sc-390746 | (1:500) |
| Antibody | Anti-Lhx3 (guinea pig polyclonal) | Pfaff lab | (1:4000) | |
| Antibody | Anti-ChAT (goat polyclonal) | Chemicon | Cat# AB144P | (1:100) |
| Antibody | Anti-Foxp1 (rabbit polyclonal) | Abcam | Cat# ab16645 | (1:5000) |
| Antibody | Anti-Nkx6.1 (goat polyclonal) | R&D Systems | Cat# AF5857 | (1:1000) |
| Antibody | Anti-Isl1 (goat polyclonal) | R&D Systems | Cat# AF1837 | (1:1000) |
| Antibody | Anti-Isl2 (guinea pig polyclonal) | PMID:14766174 | Cat# AF1837 | (1:8000) |
| Antibody | Anti-Lhx1 (rabbit polyclonal) | Abcam | Cat# ab14554 | (1:500) |
| Antibody | Anti-Scip (guinea pig polyclonal) | Dasen lab | (1:8000) | |
| Antibody | Anti-Etv4 (rabbit polyclonal) | Dasen lab | (1:16,000) | |
| Antibody | Anti-Tetramethylrhodamine (rabbit polyclonal) | Invitrogen | Cat# A-6397 | (1:1000) |
| Antibody | Anti-vGluT1 (guinea pig polyclonal) | Sigma | Cat# AB5905 | (1:32,000) |
| Antibody | Anti-nNOS (rabbit polyclonal) | DiaSorin | (1:16,000) | |
| Antibody | Anti-pSMAD (rabbit monoclonal) | Cell Signaling Technology | Cat# 9516S | (1:500) |
| Antibody | Anti-GFP (rabbit polyclonal) | Abcam | Cat# ab290 | (1:1000) |
| Antibody | Anti-Tubulin alpha (rat monoclonal) | AbD Serotec | Cat# MCA77G | (1:10,000) |
| Antibody | Anti-HA (mouse monoclonal) | Covance | Cat# MMS-101R | (1:5000) |
| Antibody | Anti-Isl2 (mouse monoclonal) | DSHB | Cat# 51.4H9 | (1:200) |
| Antibody | Anti-MNR2 (mouse monoclonal) | DSHB | Cat# 81.5C10 | (1:500) |
| Antibody | Anti-Digoxigenin-AP, Fab fragments (sheep polyclonal) | Roche | Cat# 11093274910 | (1:5000) |
| Sequence-based reagent | ckISL2 siRNA-461 | This paper | See Materials and methods, and Figure 5c, Figure 5—figure supplement 2a–b | |
| Sequence-based reagent | ckISL2 siRNA-605 | This paper | See Materials and methods, and Figure 5c, Figure 5—figure supplement 2a–b | |
| Peptide, recombinant protein | SP6 RNA polymerase | Roche | Cat# 10810274001 | |
| Peptide, recombinant protein | T7 RNA polymerase | Roche | Cat# 10881775001 | |
| Peptide, recombinant protein | Protector RNase Inhibitor | Roche | Cat# 3335399001 | |
| Peptide, recombinant protein | RQ1 RNase-Free DNase | Promega | Cat# M6101 | |
| Peptide, recombinant protein | Proteinase K | VWR | Cat# E195-5ML | |
| Commercial assay or kit | NucleoSpin RNA XS | MACHEREY-NAGEL | Cat# 740902.50 | |
| Commercial assay or kit | pGEM-T Easy Vector Systems | Promega | Cat# A1360 | |
| Commercial assay or kit | DiaStar OneStep RT-PCR kit | Solgent | Cat# DR61-K050 | |
| Commercial assay or kit | DIG RNA Labeling Mix | Roche | Cat# 11277073910 | |
| Chemical compound, drug | Dextran, Tetramethylrhodamine, 3000 MW | Invitrogen | Cat# D3308 | |
| Chemical compound, drug | Alpha-Bungarotoxin Conjugates | Invitrogen | Cat# B35451 | |
| Chemical compound, drug | NBT/BCIP stock solution | Roche | Cat# 11681451001 | |
| Software, algorithm | Zen | ZEISS | Zen Black 2.3 SP1 | https://www.zeiss.com/microscopy/us/products/microscope-software/zen.html |
| Software, algorithm | FV31S-SW | Olympus | 2.5.1.228 | https://www.olympus-lifescience.com/ |
| Software, algorithm | GraphPad Prism | GraphPad software | Version 9 | https://www.graphpad.com/ |
| Software, algorithm | ImageJ | National Institutes of Health | 1.53k | |
| Software, algorithm | R v3.6.0 | R-project | https://www.r-project.org/ | |
| Software, algorithm | R v4.0.2 | R-project | https://www.r-project.org/ | |
| Software, algorithm | Seurat v3.2.3 | R-project | PMID:29608179 | https://satijalab.org/seurat/get_started.html |
| Software, algorithm | Metascape | PMID:30944313 | https://metascape.org/ | |
| Software, algorithm | Flaski | https://flaski.age.mpg.de. |
Additional files
-
Supplementary file 1
Genotype distribution of Isl2 knockout (KO) and conditional KO mice.
Genotype distribution of Isl2-null and conditional KO mice. Expected Mendelian inheritance and observed inheritance after breeding between Isl2 heterozygotes or between Isl2 +/-; Olig2Cre and Isl2F/F. p-Values of the Mendelian ratios were calculated using chi-square tests.
- https://cdn.elifesciences.org/articles/84596/elife-84596-supp1-v2.docx
-
Supplementary file 2
Experimental sample sizes.
Experimental sample sizes for figures and figure supplements.
- https://cdn.elifesciences.org/articles/84596/elife-84596-supp2-v2.docx
-
Supplementary file 3
List of differentially expressed genes (DEGs) downregulated in Isl2-null brachial and lumbar spinal cords.
(a) List of DEGs downregulated in Isl2-null brachial spinal cords. (b) List of DEGs downregulated in Isl2-null lumbar spinal cords. (c) List of top 30 enriched genes in sb.LMCl.2 subcluster.
- https://cdn.elifesciences.org/articles/84596/elife-84596-supp3-v2.docx
-
MDAR checklist
- https://cdn.elifesciences.org/articles/84596/elife-84596-mdarchecklist1-v2.pdf
Download links
A two-part list of links to download the article, or parts of the article, in various formats.
Downloads (link to download the article as PDF)
Open citations (links to open the citations from this article in various online reference manager services)
Cite this article (links to download the citations from this article in formats compatible with various reference manager tools)
Transcriptional control of motor pool formation and motor circuit connectivity by the LIM-HD protein Isl2
eLife 12:e84596.
https://doi.org/10.7554/eLife.84596


