Comparable in vivo joint kinematics between self-reported stable and unstable knees after TKA can be explained by muscular adaptation strategies: A retrospective observational study
- Laboratory for Movement Biomechanics, Institute for Biomechanics, Switzerland
- Department of lower extremities, Schulthess Clinic Zurich, Switzerland
- Max Delbrück Center for Molecular Medicine, Germany
Figures
Figure 1
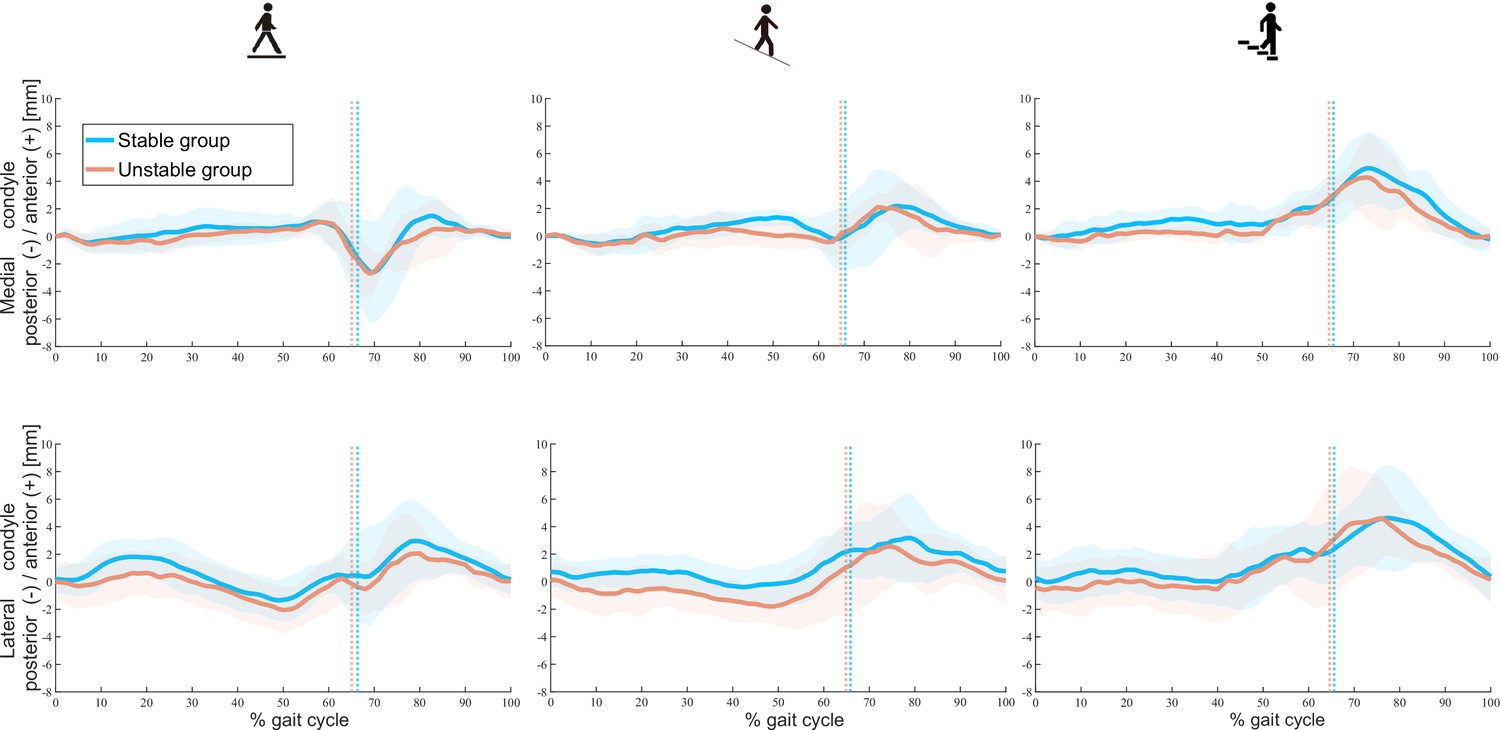
Tibiofemoral A-P translations in stable and unstable total knee arthroplasty (TKA) knees during level walking (left), downhill walking (middle), and stair descent (right).
Means (solid lines) and standard deviation (shaded areas) of A-P translations in both groups are presented. Dotted colour lines indicate the mean toe-offs for the stable and unstable groups.
Figure 2
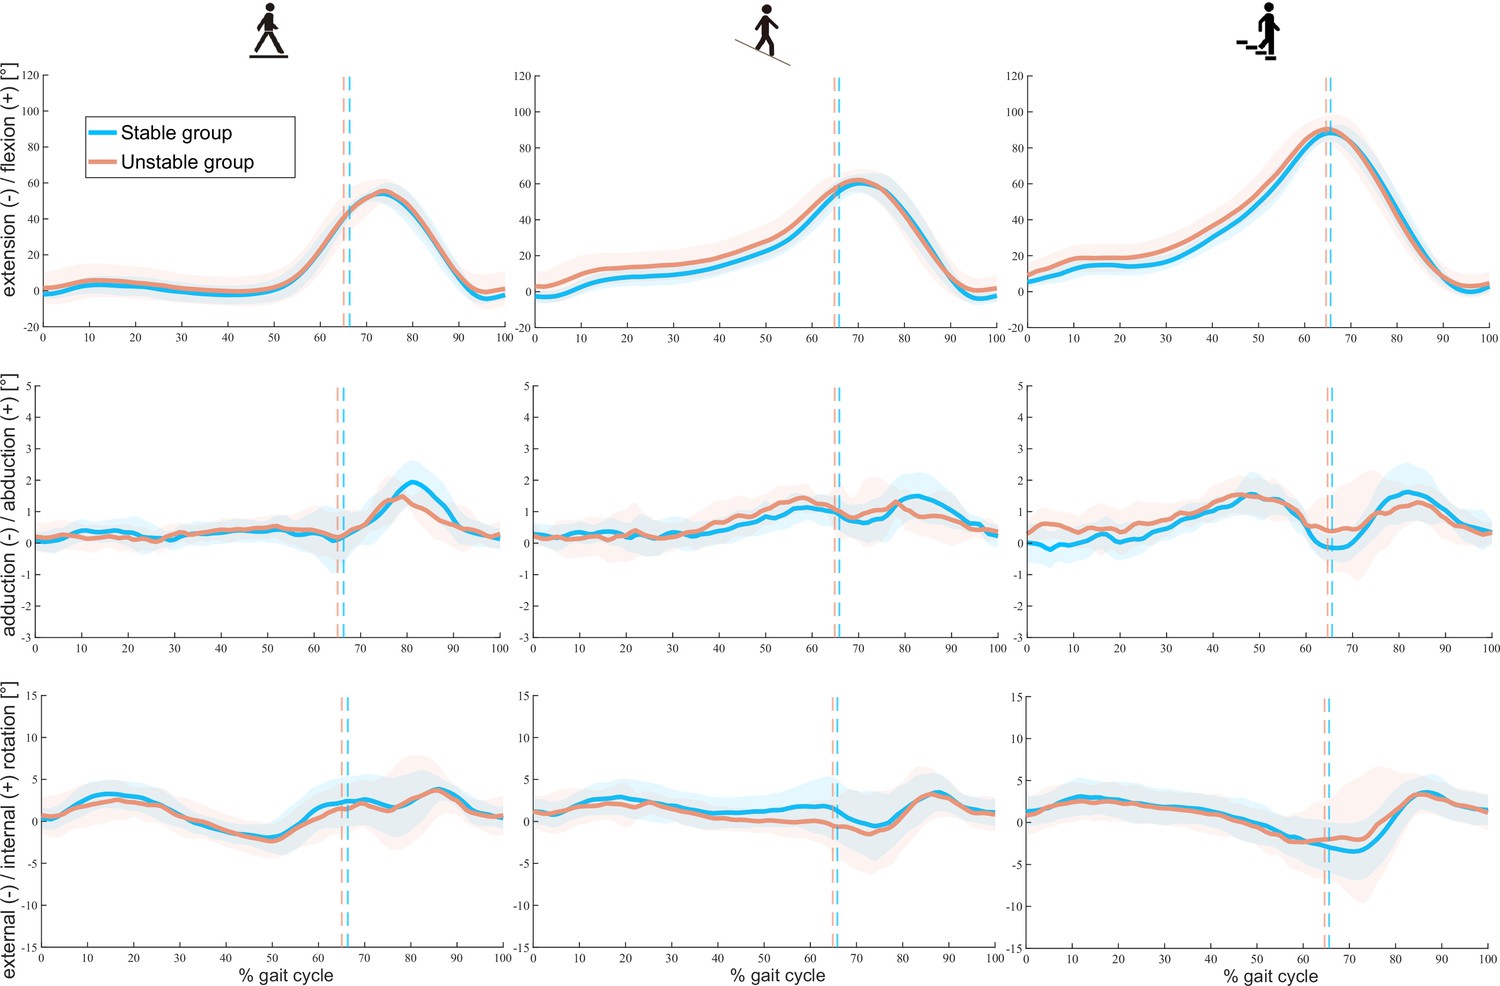
Tibiofemoral rotations throughout a gait cycle in stable and unstable total knee arthroplasty (TKA) knees during level walking (left), downhill walking (middle), and stair descent (right).
Means (solid lines) and standard deviations (shaded areas) of both groups are presented. Dotted lines indicate the mean toe-offs for each group.
Figure 3
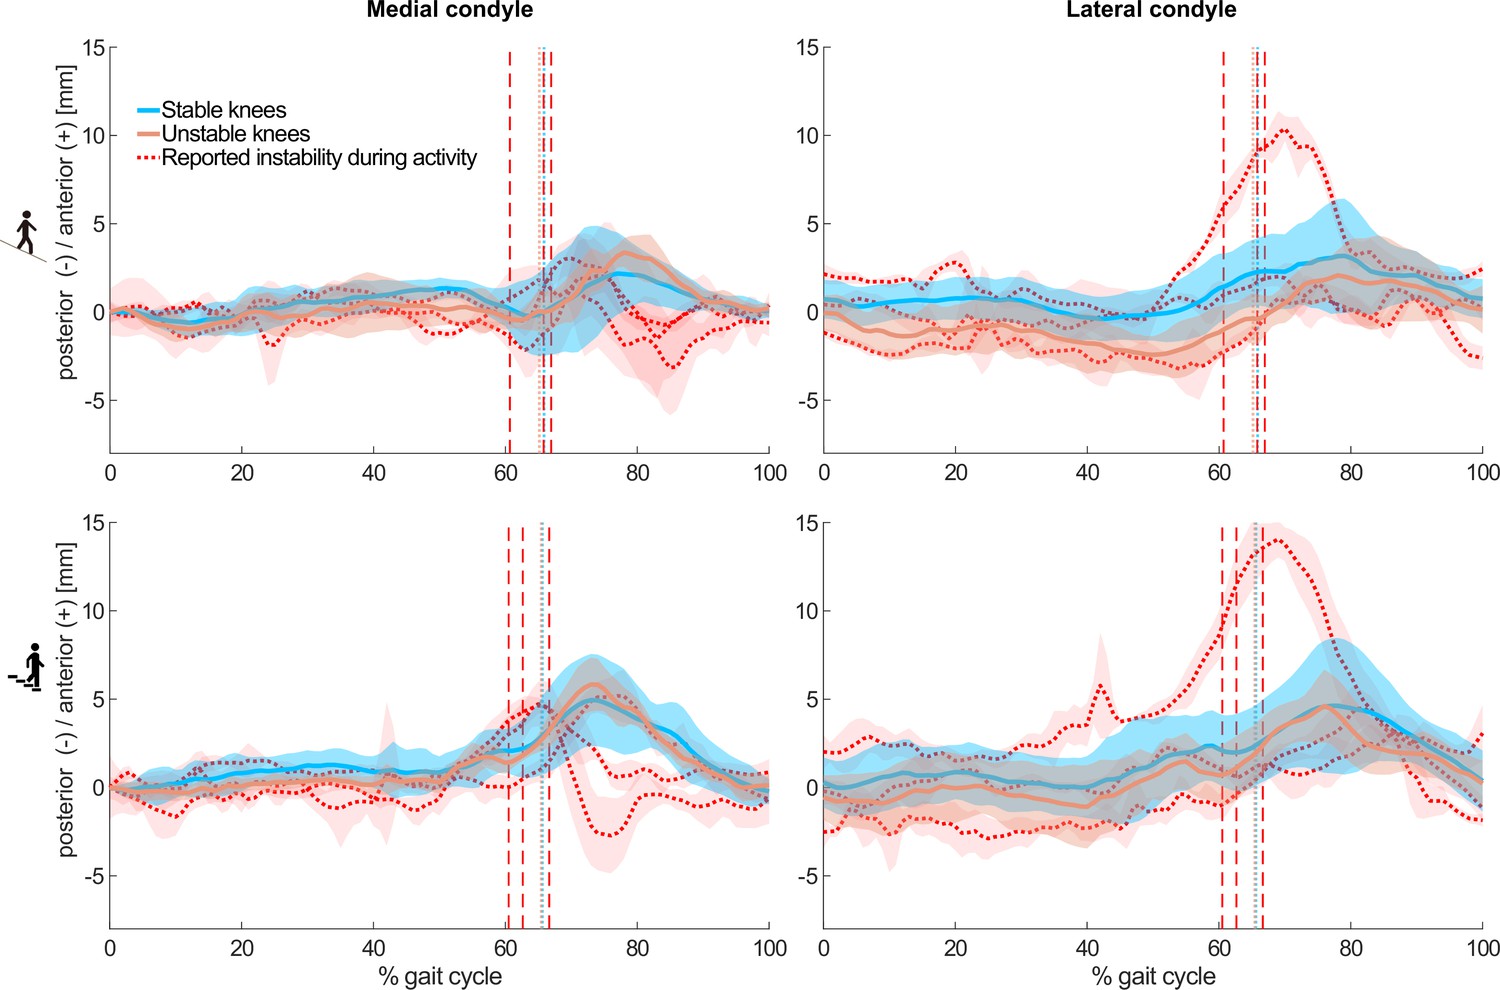
Mean and standard deviations (shaded) across subjects of the tibiofemoral A-P translations in the stable (8/8, blue), and unstable (5/8, orange) groups without reported instability during the measured activities.
In addition, mean and standard deviations (shaded) across trials of three individuals from the unstable group who reported instability during the measured activities are shown in red. Dashed colour lines indicate the mean toe-offs for the stable and unstable groups, as well as for each unstable total knee arthroplasty (TKA) knee with specifically reporting instability.
Figure 4

Classified muscle synergies in both stable and unstable total knee arthroplasty (TKA) knees during level walking, downhill walking, and stair descent.
Muscle synergy weights, as well as means (solid lines) and standard deviations (shaded areas) of the corresponding time/amplitude-normalized activation patterns are presented for each activity. RF: rectus femoris, VM: vastus medialis, VL: vastus lateralis, TA: tibialis anterior, HM: medial hamstrings, HL: lateral hamstrings, GM: gastrocnemius medialis, GL: gastrocnemius lateralis.
Tables
Table 1
Clinical assessment data of the stable and unstable groups shown as mean ± standard deviation of each parameter.
BMI: body mass index; PTS: posterior tibial slope; RoM: range of motion; OKS: Oxford Knee Score; COMI-Knee: Core Outcome Measures Index-Knee; EQ-VAS: EQ-Visual Analogue Scales. Bold values indicate a significant difference.
| Baseline data | Stable (N = 10) | Unstable (N = 8) | p |
|---|---|---|---|
| Sex ratio | 7M:3F | 3M:5F | 0.168 |
| Age [years] | 62.6 ± 6.8 | 68.9 ± 8.3 | 0.096 |
| BMI [kg/m2] | 29.4 ± 4.8 | 26.1 ± 3.2 | 0.113 |
| Time post-op [months] | 33.9 ± 8.5 | 31.9 ± 20.4 | 0.779 |
| PTS [°] | 82.0 ± 2.4 | 82.3 ± 3.0 | 0.863 |
| Inlay thickness [mm] | 11.3 ± 1.0 | 11.8 ± 1.7 | 0.511 |
| Knee flexion RoM [°] | 125.0 ± 7.8 | 126.3 ± 6.4 | 0.720 |
| Hyperextension | 1/10 | 8/8 | <0.01 |
| Drawer tests | 1/10 | 5/8 | 0.019 |
| Varus/valgus stress tests | 1/10 | 5/8 | 0.019 |
| UCLA activity score | 8.3 ± 1.3 | 7.9 ± 1.1 | 0.465 |
| OKS | 46.0 ± 2.0 | 42.9 ± 3.8 | 0.040 |
| COMI-Knee | 0.2 ± 0.6 | 0.9 ± 0.8 | 0.044 |
| EQ-VAS | 84.5 ± 13.4 | 81.3 ± 17.1 | 0.660 |
Table 2
Mean ± standard deviation of the anterior-posterior(A-P) tibiofemoral positions for the medial and lateral condyles, flexion/extension (Flex/ex), adduction/abduction (Ab/ad), and internal/external (Int/ext) rotation angles in stable and unstable groups during all activities.
| A-P translation RoM [mm] | Stance phase | Swing phase | |||||
|---|---|---|---|---|---|---|---|
| Medial | Lateral | Diff | Medial | Lateral | Diff | ||
| Level walking | Stable | 5.4 ± 1.4 | 5.1 ± 1.0 | −0.3 ± 2.2 | 7.0 ± 2.5 | 5.7 ± 1.9 | −1.1 ± 1.5 |
| Unstable | 4.5 ± 0.9 | 4.5 ± 0.8 | −0.3 ± 1.8 | 6.2 ± 1.6 | 5.5 ± 1.5 | −0.6 ± 2.1 | |
| Downhill walking | Stable | 4.2 ± 0.9 | 4.0 ± 0.7 | −0.2 ± 1.0 | 5.7 ± 1.5 | 4.7 ± 1.2 | −1.0 ± 1.6 |
| Unstable | 3.4 ± 1.0 | 4.5 ± 0.7 | 1.1 ± 1.3 | 5.5 ± 1.5 | 5.4 ± 2.0 | −0.1 ± 1.6 | |
| Stair descent | Stable | 5.1 ± 1.6 | 5.5 ± 1.9 | 0.4 ± 0.8 | 7.7 ± 1.7 | 6.0 ± 2.1 | −1.7 ± 2.0 |
| Unstable | 4.6 ± 1.2 | 5.5 ± 1.7 | 0.9 ± 0.8 | 6.9 ± 1.7 | 7.4 ± 2.9 | 0.5 ± 2.4 | |
Table 3
Mean ± standard deviation of knee range of flexion/extension (flex/ex), abduction/adduction (ab/ad), and internal/external (int/ext) rotations for the stance and swing phases of level walking, downhill walking, and stair descent.
A significant difference was observed only between stable and unstable groups in abduction/adduction during downhill walking (a).
| Rotation RoM [°] | Stance phase | Swing phase | |||||
|---|---|---|---|---|---|---|---|
| flex/ex | int/ext | ab/ad | flex/ex | int/ext | ab/ad | ||
| Level walking | Stable | 47.2 ± 4.9 | 7.7 ± 1.1 | 2.1 ± 0.2 | 61.8 ± 4.4 | 6.9 ± 1.8 | 2.8 ± 0.5 |
| Unstable | 43.5 ± 6.8 | 7.0 ± 1.8 | 2.1 ± 0.3 | 59.6 ± 8.0 | 7.8 ± 2.5 | 2.7 ± 0.7 | |
| Downhill walking | Stable | 57.9 ± 3.8 | 5.5 ± 0.9 | 2.2 ± 0.3a | 68.6 ± 4.6 | 7.0 ± 1.3 | 2.5 ± 0.4 |
| Unstable | 54.9 ± 4.3 | 6.1 ± 1.2 | 2.8 ± 0.3a | 67.4 ± 6.7 | 8.2 ± 1.8 | 2.8 ± 0.7 | |
| Stair descent | Stable | 84.4 ± 3.4 | 8.7 ± 1.2 | 3.5 ± 0.5 | 91.2 ± 4.5 | 9.4 ± 1.9 | 2.8 ± 0.6 |
| Unstable | 84.5 ± 11.7 | 8.4 ± 1.0 | 3.3 ± 0.4 | 92.8 ± 5.8 | 10.3 ± 2.6 | 3.1 ± 0.9 | |
Table 4
Mean ± standard deviation of full width at half maximum (FWHM) of the synergistic activation patterns corresponding to knee extensor, plantarflexor, dorsiflexor, and knee flexor muscle groups during level walking, downhill walking, and stair descent.
Significant differences were observed between stable and unstable knees during stair descent in dorsi- (a) and knee flexor muscles (b), with an effect size of 1.49. *The classified synergy corresponding to dorsi- and knee flexor muscles was only observed in a small number of unstable knees (3/8).
| FWHM | Knee extensors | Plantarflexors | Dorsiflexors | Knee flexors | ||||||||
|---|---|---|---|---|---|---|---|---|---|---|---|---|
| Stable | Unstable | p | Stable | Unstable | p | Stable | Unstable | p | Stable | Unstable | p | |
| Level walking | 29.3 ± 8.1 | 28.6 ± 13.1 | 0.55 | 24.3 ± 7.9 | 25.5 ± 6.7 | 0.38 | 37.4 ± 13.2 | 27.7 ± 8.3 | 0.11* | 21.7 ± 6.2 | 30.4 ± 9.5 | 0.06 |
| Downhill walking | 31.2 ± 9.4 | 34.1 ± 6.6 | 0.26 | 20.2 ± 7.3 | 22.6 ± 8.4 | 0.29 | 35.2 ± 15.9 | 31.1 ± 13.2 | 0.32 | 20.2 ± 5.7 | 21.6 ± 5.5 | 0.37* |
| Stair descent | 31.8 ± 12.2 | 36.0 ± 7.3 | 0.20 | 26.0 ± 9.4 | 33.5 ± 15.1 | 0.12 | 20.1 ± 8.1 | 35.0 ± 12.5 | 0.01a | 20.1 ± 8.1 | 35.0 ± 12.5 | 0.01b |
Table 5
Mean ± standard deviation of centre of activity (CoA) of the synergistic activation patterns corresponding to knee extensor, plantarflexor, dorsiflexor, and knee flexor muscle groups during level walking, downhill walking, and stair descent.
A significant difference was observed between stable and unstable knees during stair descent in dorsiflexor muscles (a), with an effect size of 2.17. *The classified synergy corresponding to dorsi- and knee flexor muscles was only observed in a small number of unstable knees (3/8).
| CoA | Knee extensors | Plantarflexors | Dorsiflexors | Knee flexors | ||||||||
|---|---|---|---|---|---|---|---|---|---|---|---|---|
| Stable | Unstable | p | Stable | Unstable | p | Stable | Unstable | p | Stable | Unstable | p | |
| Level walking | 31.8 ± 11.7 | 34.6 ± 23.2 | 0.39 | 60.5 ± 6.4 | 57.1 ± 8.5 | 0.81 | 141.4 ± 37.3 | 68 ± 22.7 | 0.004a* | 34.7 ± 22.9 | 69.8 ± 78.8 | 0.19 |
| Downhill walking | 35.6 ± 6.7 | 32.6 ± 8.4 | 0.77 | 45.8 ± 10.4 | 46.4 ± 9.3 | 0.46 | 119.8 ± 46.7 | 98.3 ± 51.8 | 0.23 | 86.5 ± 39.8 | 108.1 ± 30.1 | 0.19* |
| Stair descent | 41.2 ± 8.0 | 41.4 ± 9.4 | 0.49 | 157.3 ± 27.3 | 172.4 ± 29.6 | 0.16 | 61.9 ± 24.9 | 68 ± 26.2 | 0.33 | 61.9 ± 24.9 | 68 ± 26.2 | 0.33 |
Additional files
-
Supplementary file 1
Mean ± standard deviation of kinematic parameters of interest in stable and unstable groups at the instant of heel-strike in all activities.
- https://cdn.elifesciences.org/articles/85136/elife-85136-supp1-v2.docx
-
Supplementary file 2
Post hoc pair-wise comparisons of one-way analysis of variance (ANOVA) results on hamstrings-dominant classified synergy module during stair descent.
Bold values indicate the comparison of the same muscle between stable and unstable groups. RF: rectus femoris, VM: vastus medial, VL: vastus lateral, TA: tibialis anterior, HM: hamstrings medial, HL: hamstring lateral, GM: gastrocnemius medial, GL: gastrocnemius lateral.
- https://cdn.elifesciences.org/articles/85136/elife-85136-supp2-v2.docx
-
MDAR checklist
- https://cdn.elifesciences.org/articles/85136/elife-85136-mdarchecklist1-v2.pdf
-
Reporting standard 1
Strobe checklist.
- https://cdn.elifesciences.org/articles/85136/elife-85136-repstand1-v2.pdf
Download links
A two-part list of links to download the article, or parts of the article, in various formats.
Downloads (link to download the article as PDF)
Open citations (links to open the citations from this article in various online reference manager services)
Cite this article (links to download the citations from this article in formats compatible with various reference manager tools)
Comparable in vivo joint kinematics between self-reported stable and unstable knees after TKA can be explained by muscular adaptation strategies: A retrospective observational study
eLife 12:e85136.
https://doi.org/10.7554/eLife.85136


