Single-cell sequencing highlights heterogeneity and malignant progression in actinic keratosis and cutaneous squamous cell carcinoma
- Department of Dermatology, First Affiliated Hospital of Kunming Medical University, China
- Department of Dermatology, The Affiliated Hospital of Kunming University of Science and Technology, The First People's Hospital of Yunnan Province, Kunming, China
- Clinical Big Data Research Center, The Seventh Affiliated Hospital of Sun Yat-sen University, China
- School of Medical, Shenzhen Campus of Sun Yat-sen University, China
- Department of Dermatology, Changzheng Hospital, Naval Medical University, China
- Department of Dermatology, People's Hospital of Chuxiong Yi Autonomous Prefecture, Chuxiong, China
- Department of Dermatology, Qujing Affiliated Hospital of Kunming Medical University, The First People’s Hospital of Qujing, China
- Department of Dermatology, First Affiliated Hospital of Dali University, Dali, China
- Wenshan Zhuang and Miao Autonomous Prefecture Dermatology Clinic, Wenshan Zhuang and Miao Autonomous Prefecture Specialist Hospital of Dermatology, Wenshan, China
- Guangdong Provincial Key Laboratory of Digestive Cancer Research, The Seventh Affiliated Hospital of Sun Yat-sen University, China
Figures
Figure 1
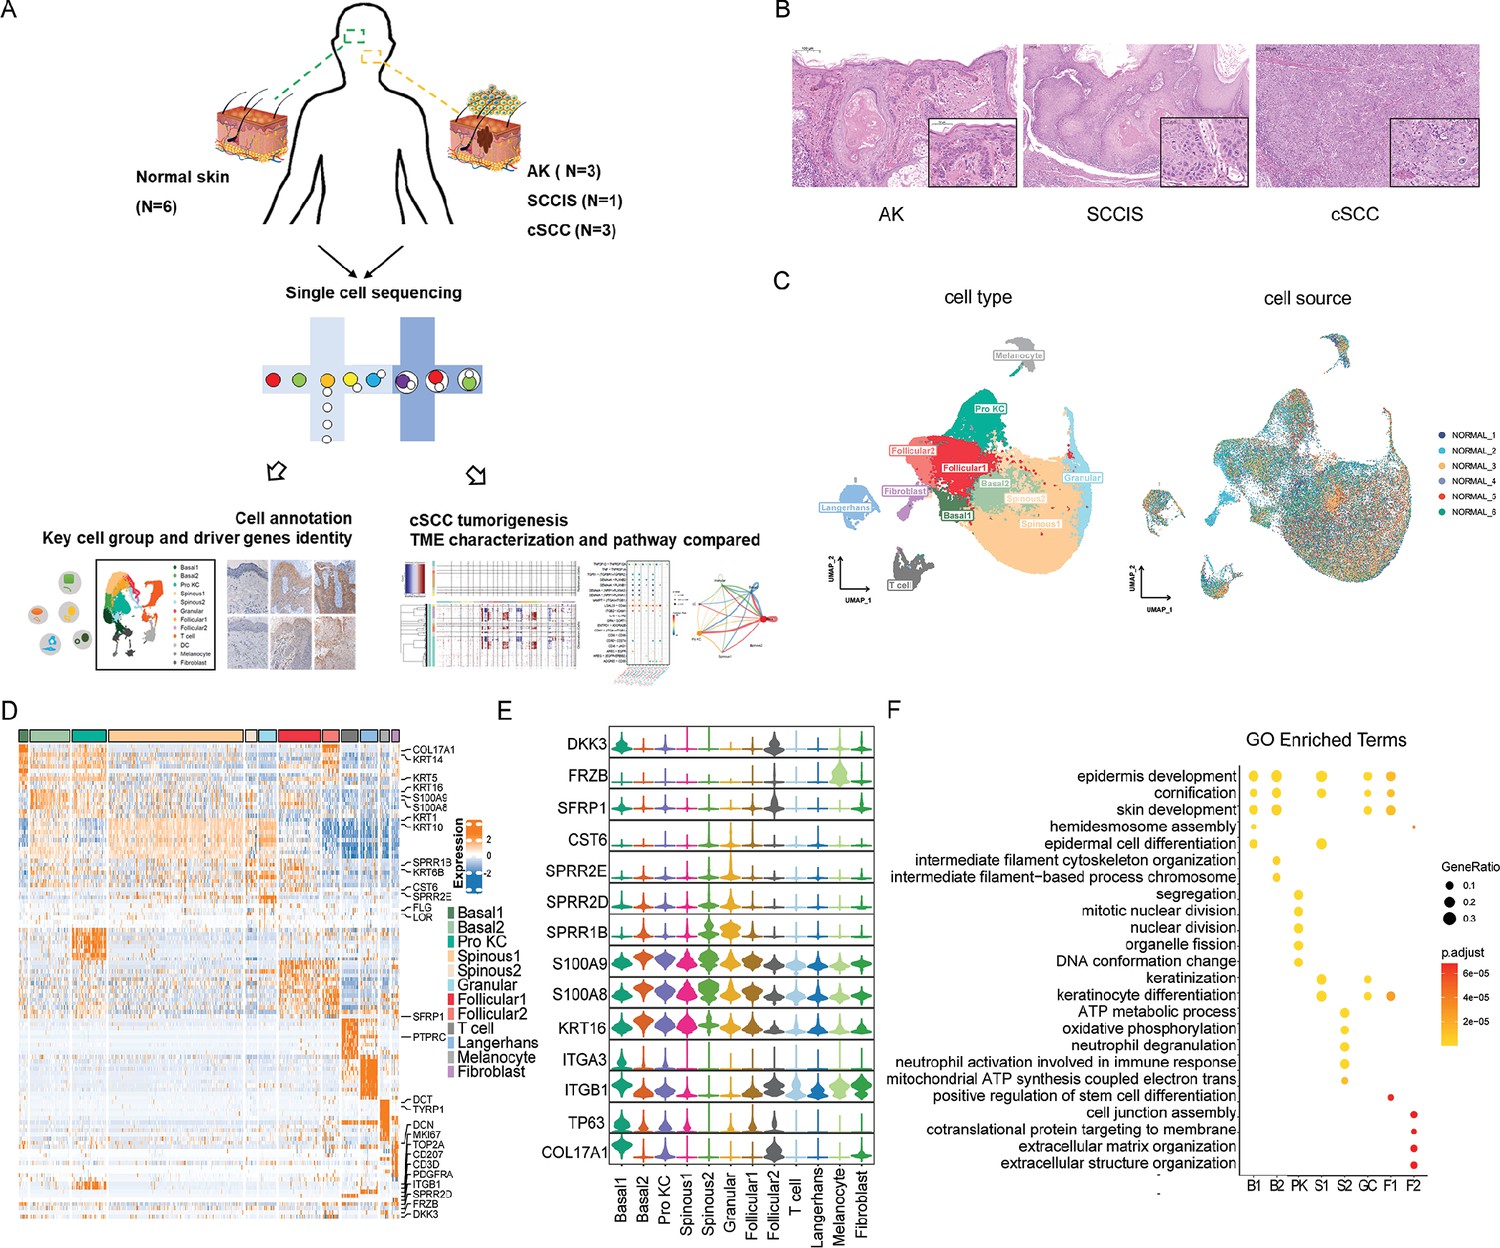
Single-cell transcriptome profiling identified different subgroups of keratinocytes in human normal skin.
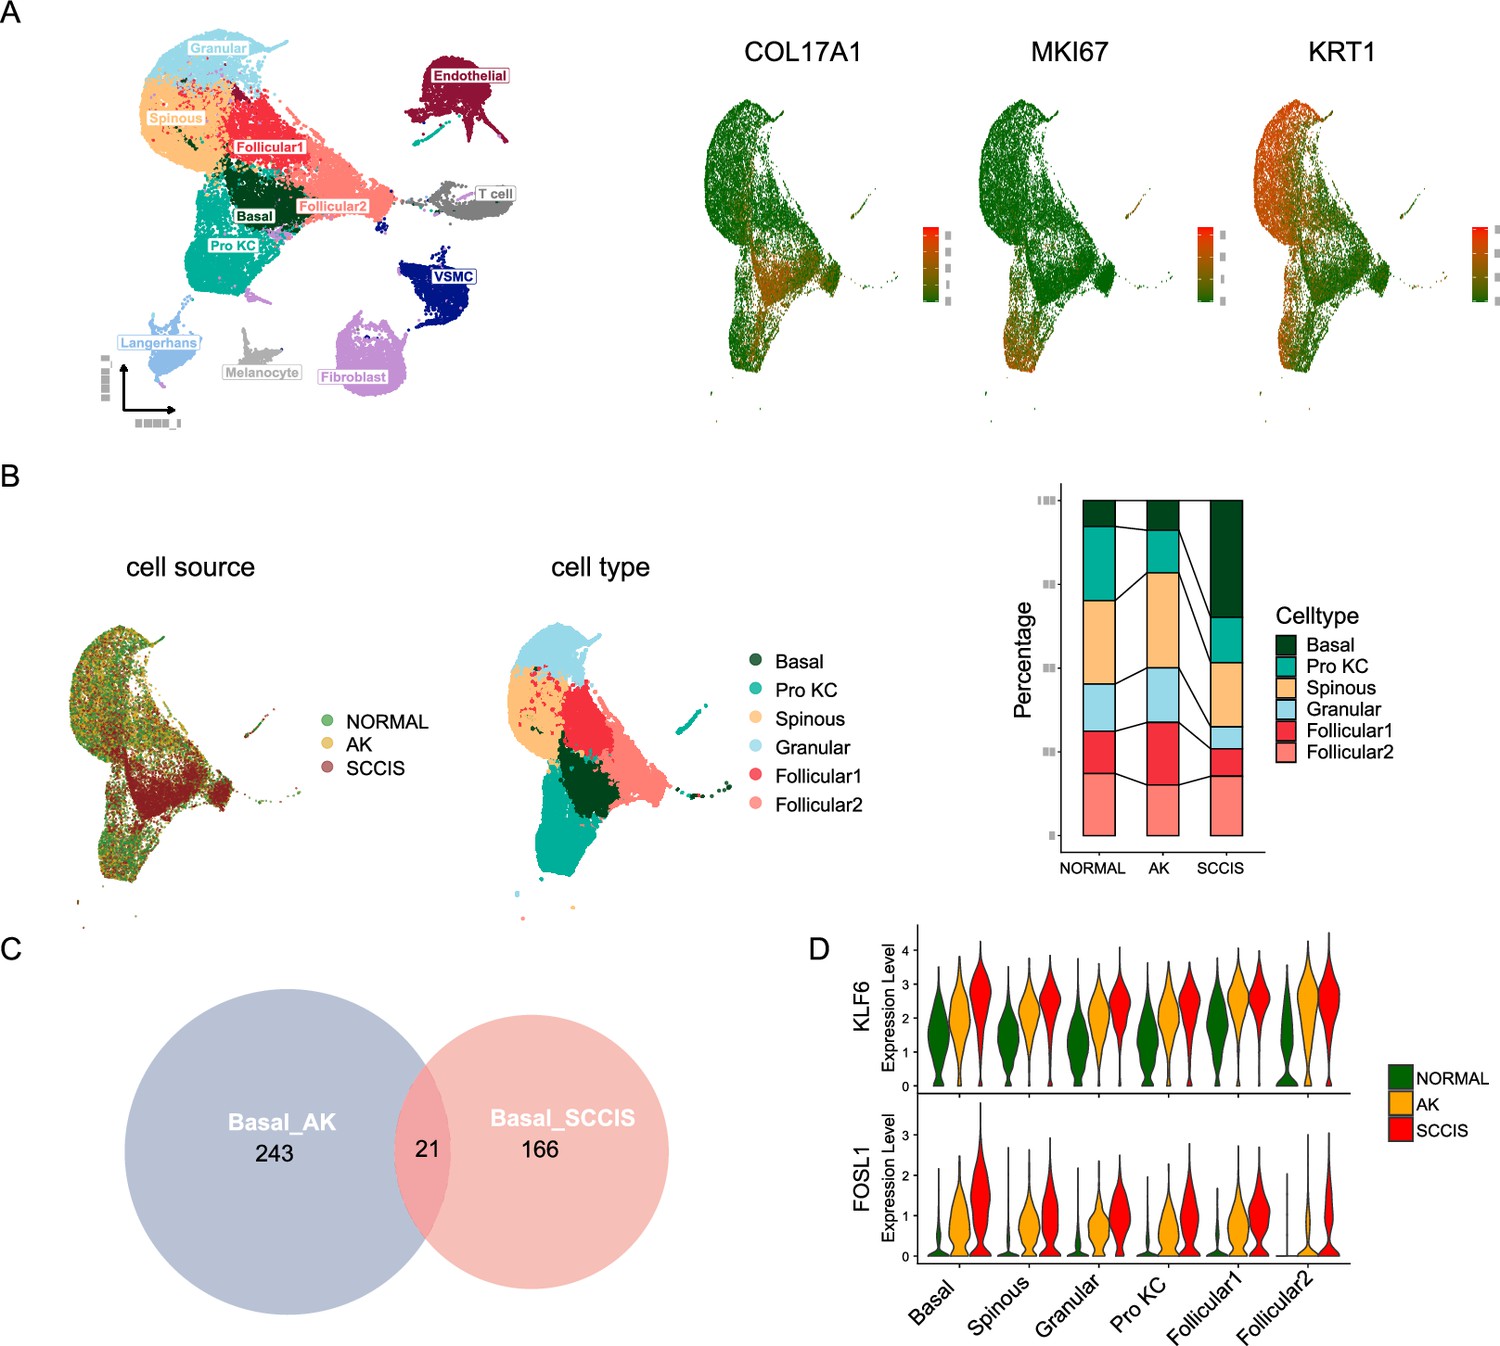
(A) Flowchart overview of single-cell sequencing in human skin of actinic keratosis (AK), squamous cell carcinoma in situ (SCCIS), and cutaneous squamous cell carcinoma (cSCC) patients. (B) Hematoxylin and eosin (H&E) staining of skin biopsies from representative AK (100× and 250×), SCCIS (50× and 250×), and cSCC (50× and 250×). (C) Uniform manifold approximation and projection (UMAP) plot of human normal skin labeled by cell type and patient, respectively. (D) Heatmap showing gene expression signatures of each cell type. (E) Violin plot displaying the expression of representative genes to identify subpopulations for each cell type. (F) Representative gene ontology (GO) terms of signature genes in different cell subpopulations. The color keys from yellow to red indicate the range of p-value.
Figure 2 with 4 supplements

Identification of potential key genes driving normal skin to actinic keratosis (AK).
(A) Uniform manifold approximation and projection (UMAP) of single-cell RNA sequencing (scRNA-seq) cells and cell proportion from each AK patient labeled by cell type. (B) Cell proportion of all AK samples and patient-matched normal skin samples. (C) Heatmap of gene ontology (GO) terms for up-regulated genes in Basal1, Basal2, and Pro KC subpopulations for AK versus normal skin. (D) Violin plots showing the different expression levels of ALDH3A1 and IGFBP2 across cell types in AK and normal samples (Wilcoxon test, p_val_adj <0.05). (E) Immunofluorescence staining of ALDH3A1 and IGFBP2 in AK and normal skin groups. Scale bar, 100 μm. (F) The mean optical density (IOD/area) analyses of ALDH3A1 and IGFBP2 in AK and normal skin. n=20 for each group. ***p<0.001.
Figure 2—figure supplement 1
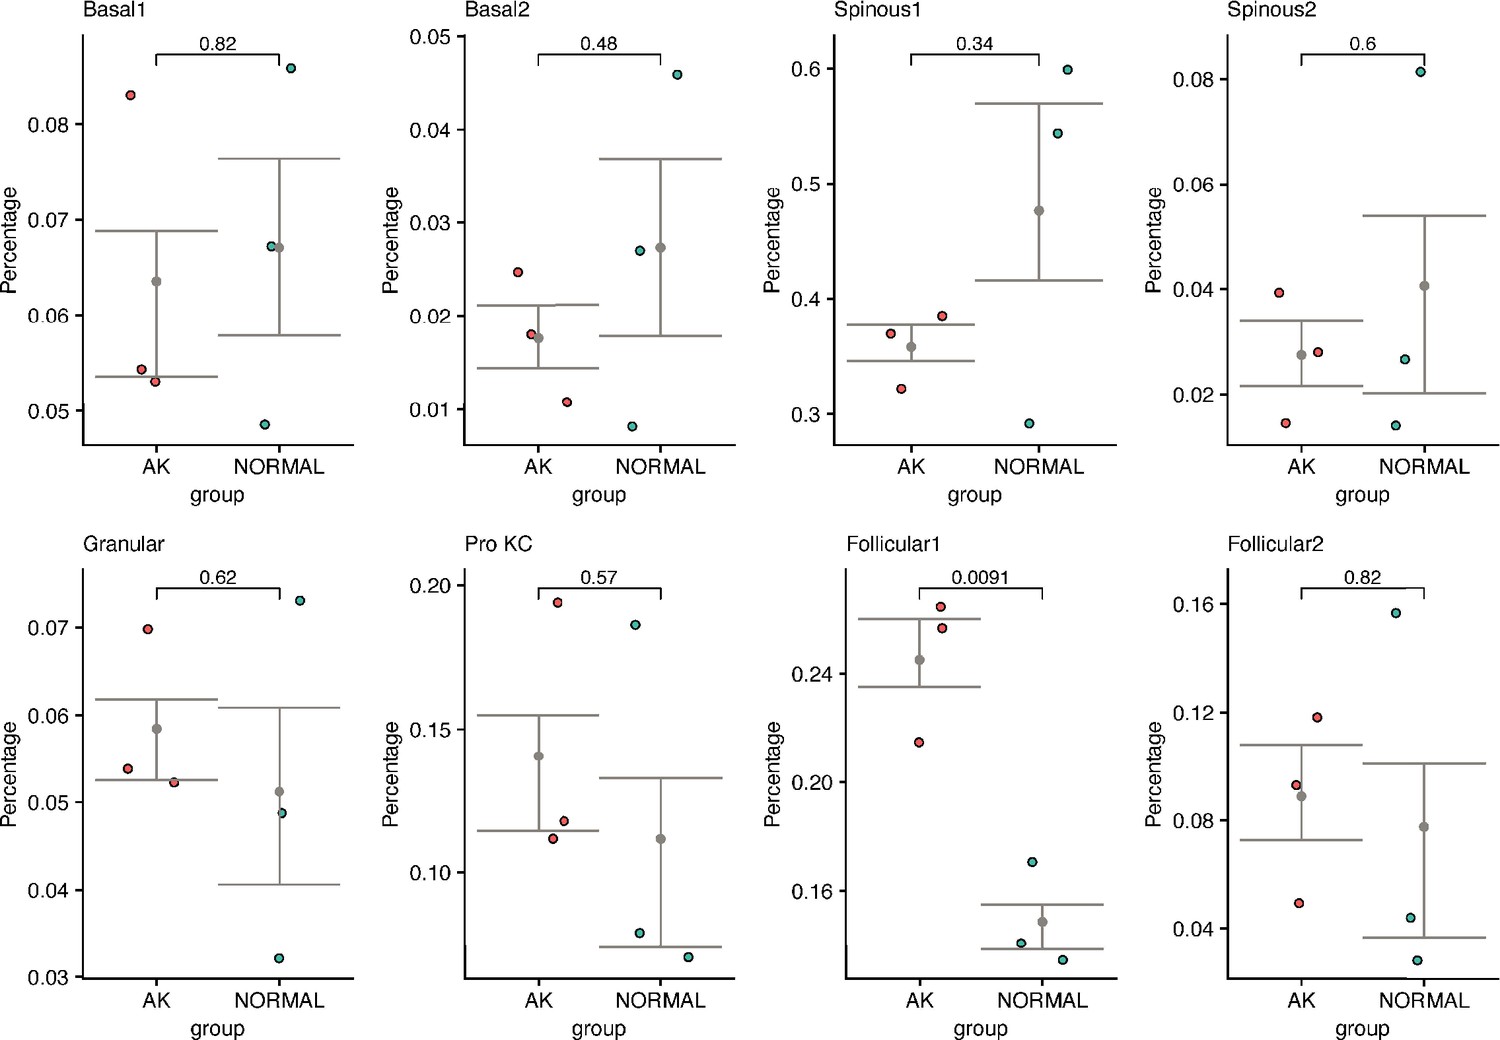
The changes of cell proportion and significance test in all actinic keratosis (AK) samples and patient-matched normal skin samples (t test, p<0.05).
Figure 2—figure supplement 2
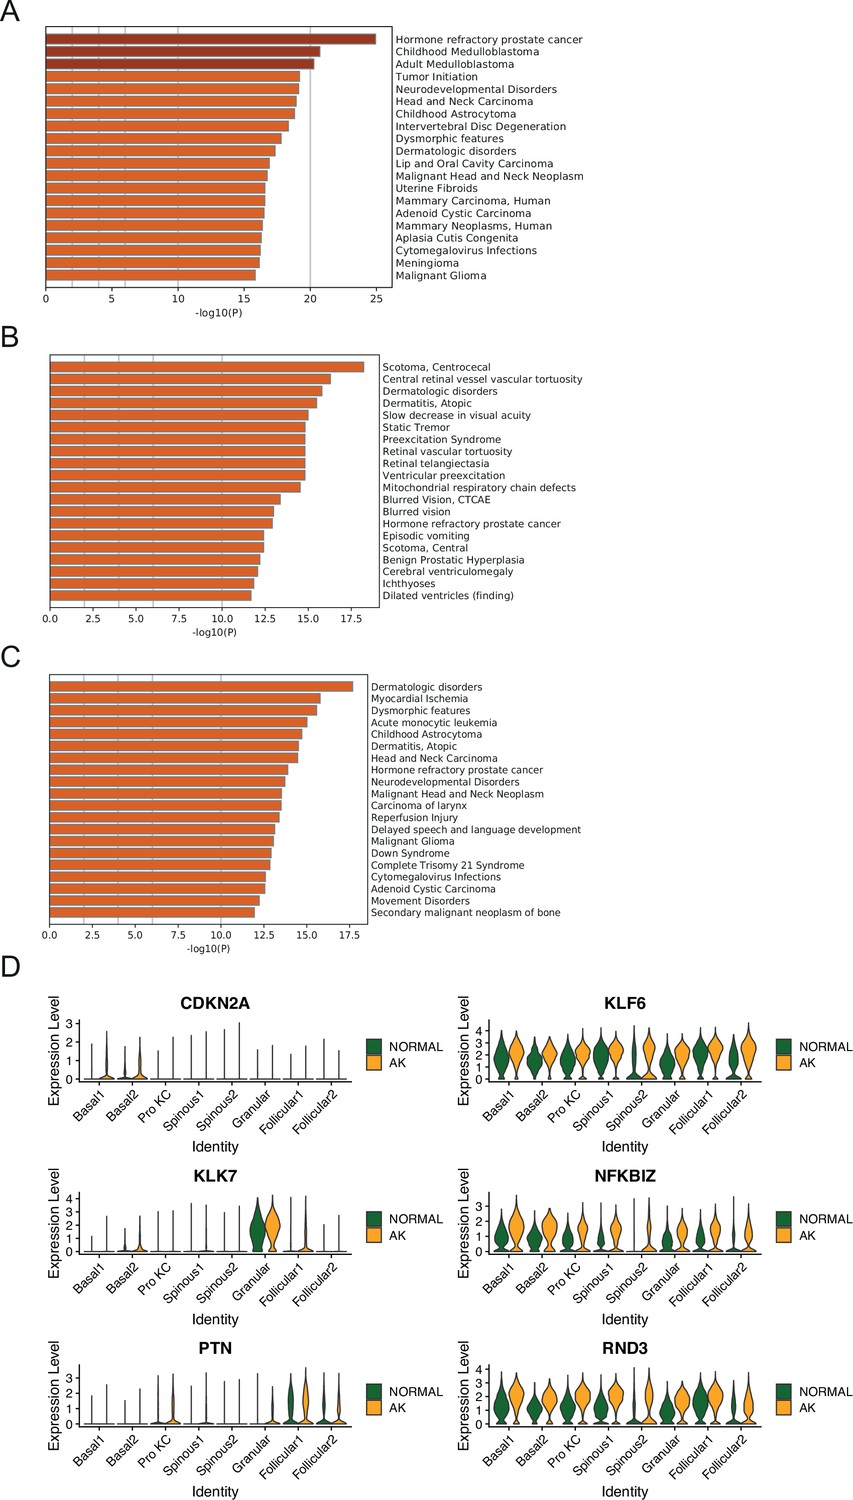
Identification of potential key driver genes from normal skin to actinic keratosis (AK).
(A) The enriched disease terms of up-regulated differentially expressed genes (DEGs) in Basal1 between AK and normal groups based on DisGeNET database. (B) The enriched disease terms of up-regulated DEGs in Basal2 between AK and normal groups based on DisGeNET database. (C) The enriched disease terms of up-regulated DEGs in Pro KC between AK and normal groups based on DisGeNET database. (D) Violin plots showing the different expression levels of candidate genes in AK and normal samples (Wilcoxon test, p_val_adj <0.05).
Figure 2—figure supplement 3
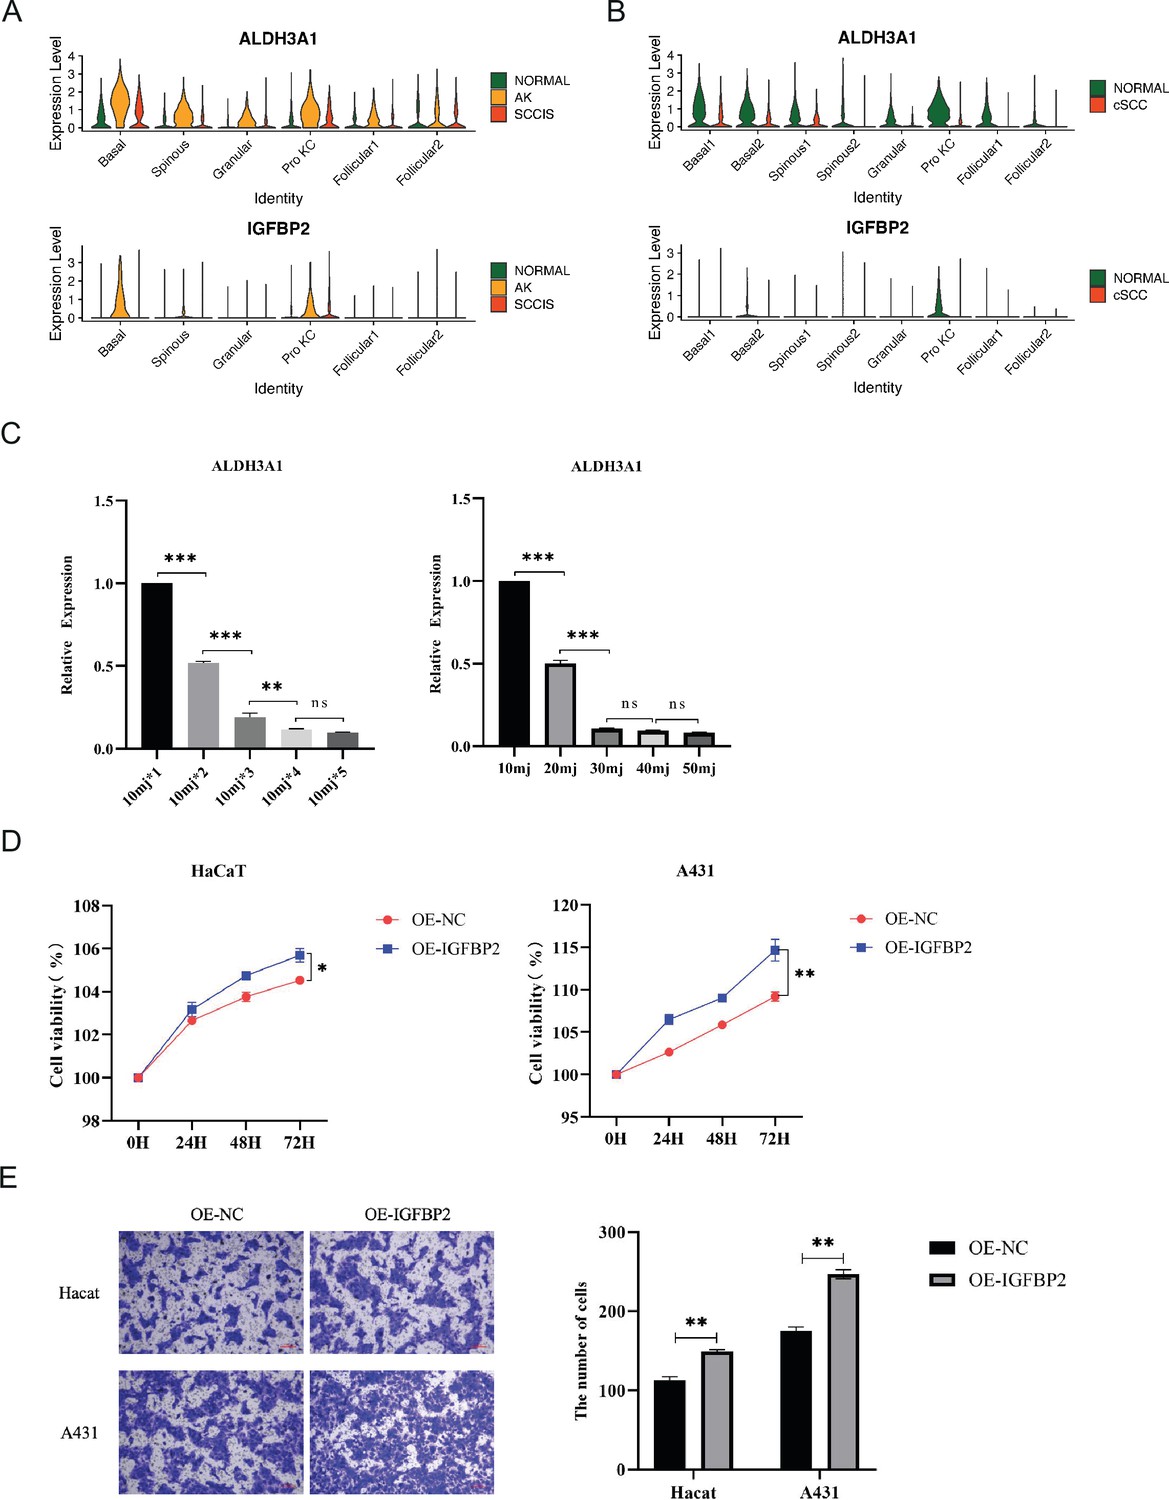
Expression and functional characterization of ALDH3A1 and IGFBP2.
(A) Violin plots showing the expression levels of ALDH3A1 and IGDBP2 in actinic keratosis (AK), squamous cell carcinoma in situ (SCCIS), and matched normal samples (Wilcoxon test, p_val_adj <0.05). (B) Violin plots showing the expression levels of ALDH3A1 and IGDBP2 in cutaneous squamous cell carcinoma (cSCC) and matched normal samples. (C) The effect of UVB on ALDH3A1 expression in HaCaT cells. Left, the cells were collected at 24 hr, 48 hr, 72 hr, 96 hr, and 120 hr after UVB irradiation with a UVB dose of 10 mJ/cm2 per 24 hr; right, the cells were collected at 24 hr after UVB irradiation with UVB doses of 10 mJ/cm2, 20 mJ/cm2, 30 mJ/cm2, 40 mJ/cm2, and 50 mJ/cm2. (D) The changes of cell proliferation after IGFBP2 overexpression in HaCaT and A431 cells. (E) The changes of cell invasion after IGFBP2 overexpression in HaCaT and A431 cells. *p<0.05; **p<0.01; ***p<0.001; ns, not significant.
Figure 2—figure supplement 4
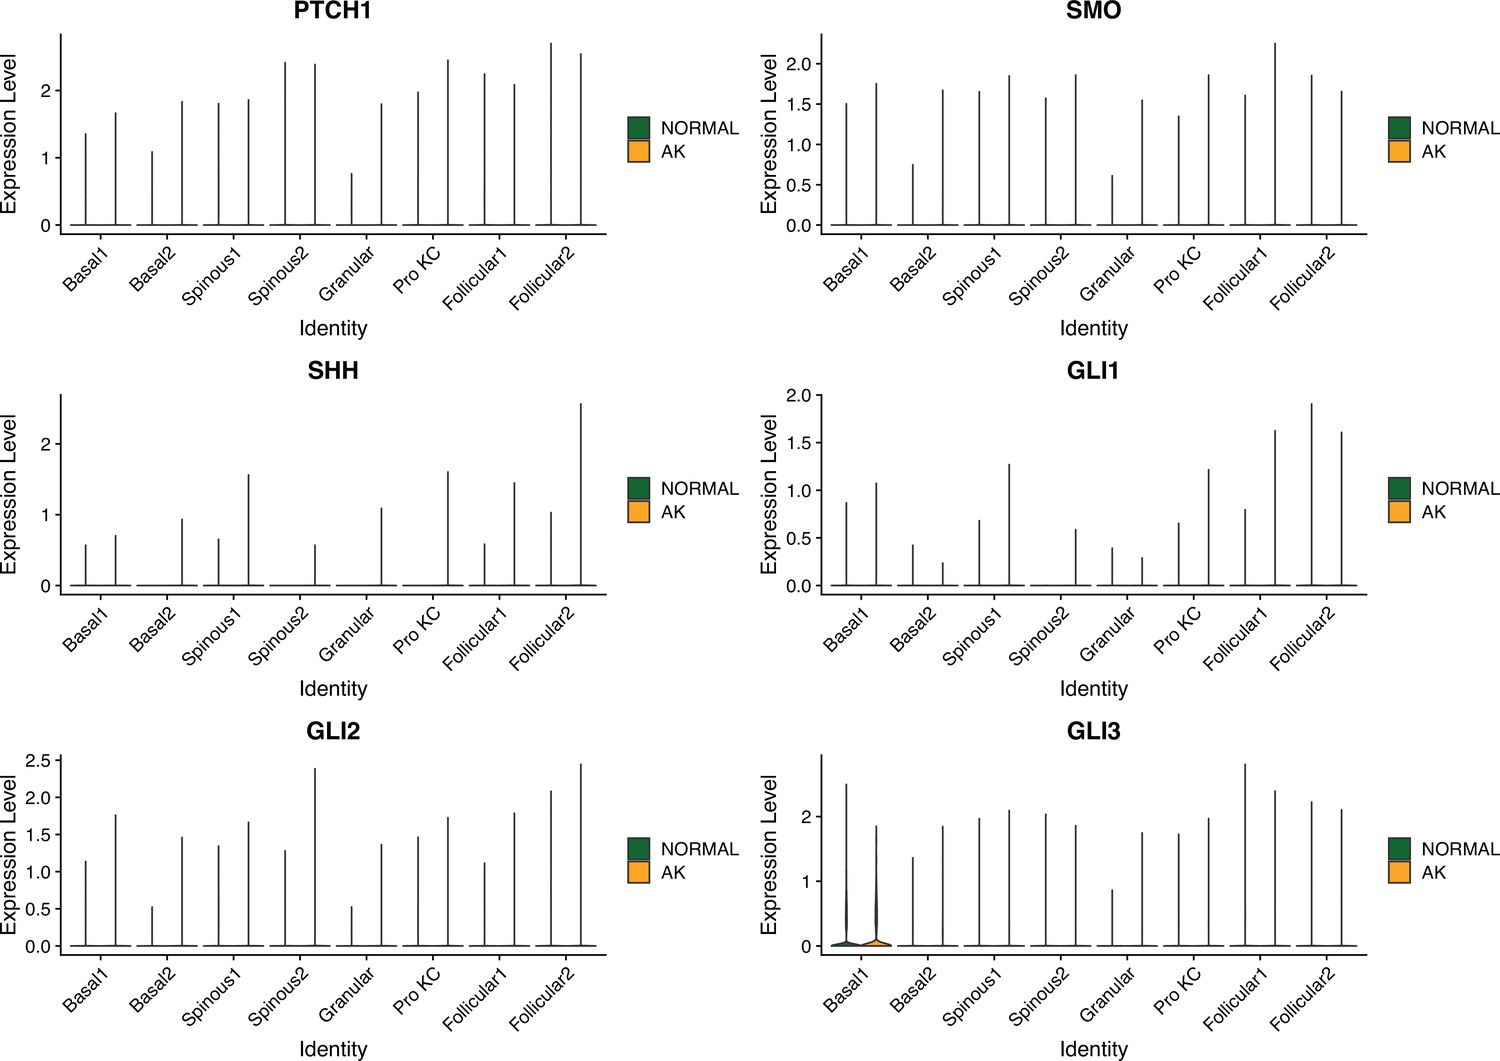
Violin plots showing the expression levels of major factors in Hedgehog signaling pathway across all types of keratinocytes in actinic keratosis (AK) and normal groups (Wilcoxon test).
Figure 3
Monotonically changed differentially expressed genes (DEGs) play important roles in the progression of actinic keratosis (AK) to squamous cell carcinoma in situ (SCCIS).
(A) Left, uniform manifold approximation and projection (UMAP) of all cells from patient (P2) with both AK and SCCIS labeled by cell types; right, expression of basal, Pro KC, and differentiated genes in all keratinocytes from P2. (B) Left, UMAP of all keratinocytes from P2 labeled by patient and cell type, respectively; right, cell proportion of normal, AK, and SCCIS samples in P2. (C) Overlap of up-regulated genes in basal cells from AK compared to normal and SCCIS compared to AK. (D) Violin plots showing the different expression levels of KLF6 and FOSL1 in normal, AK, and SCCIS samples in P2 (Wilcoxon test, p_val_adj <0.05).
Figure 4 with 4 supplements
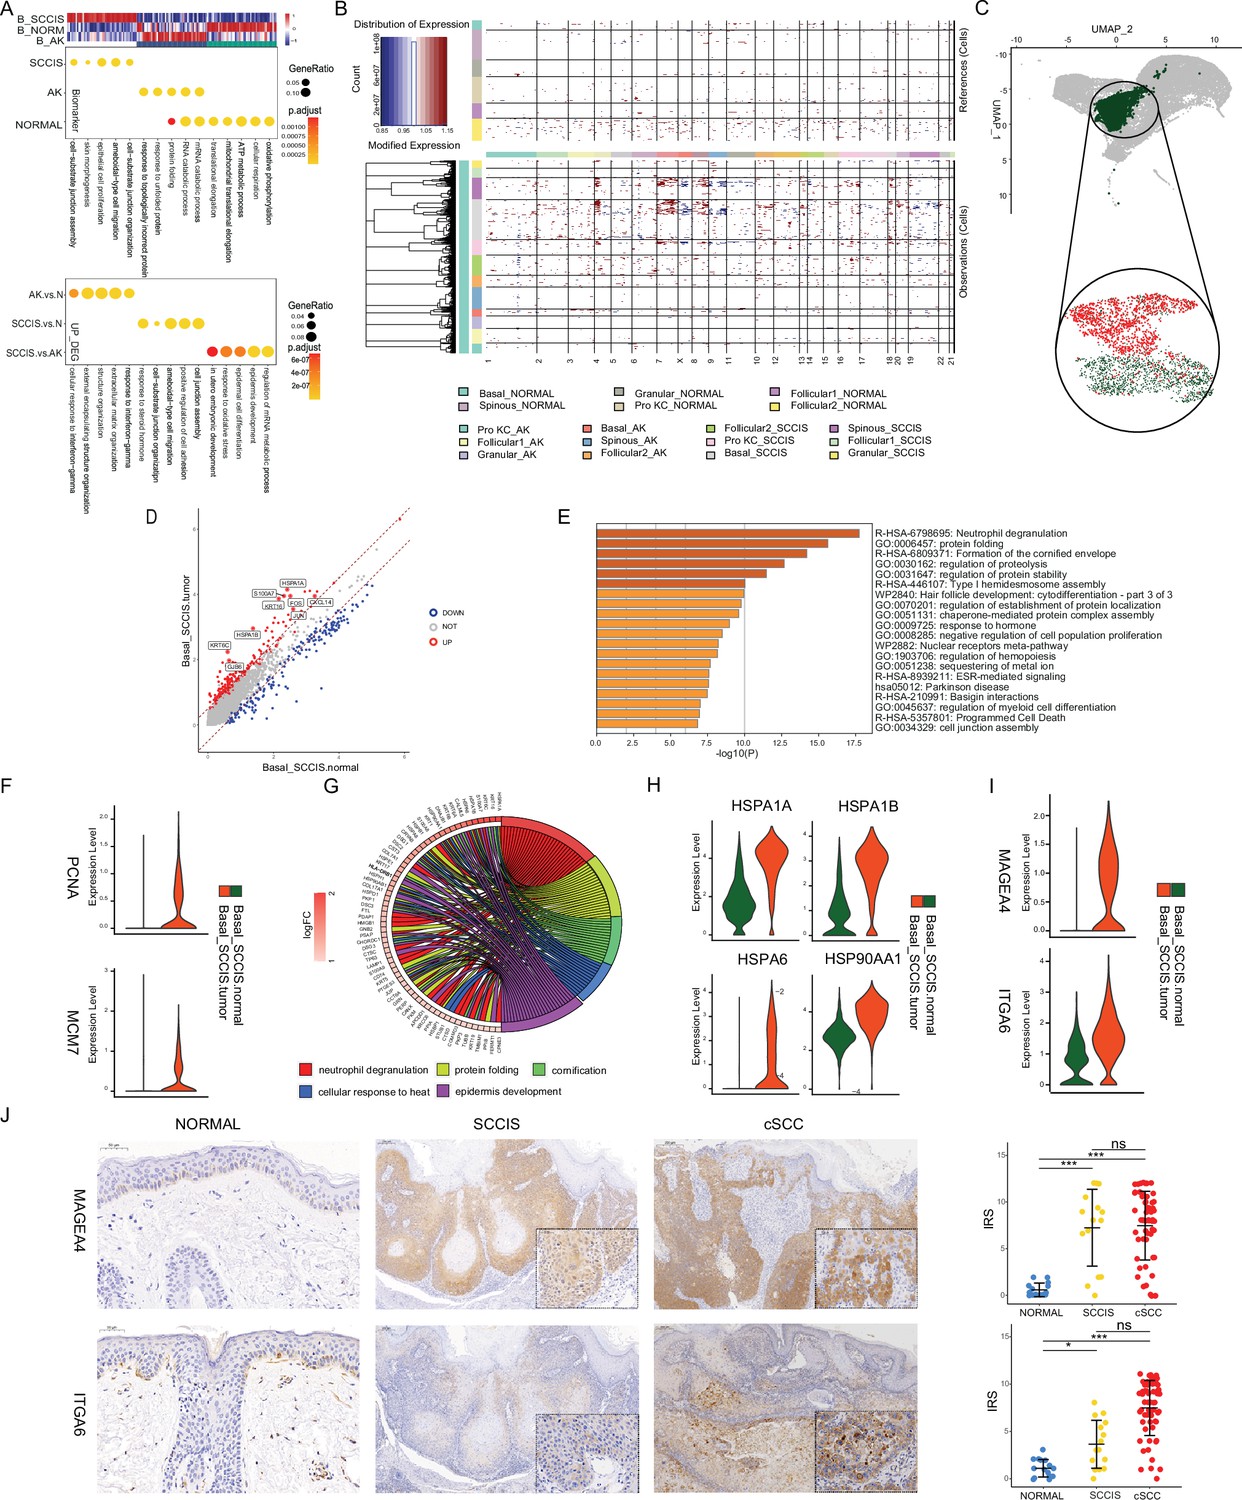
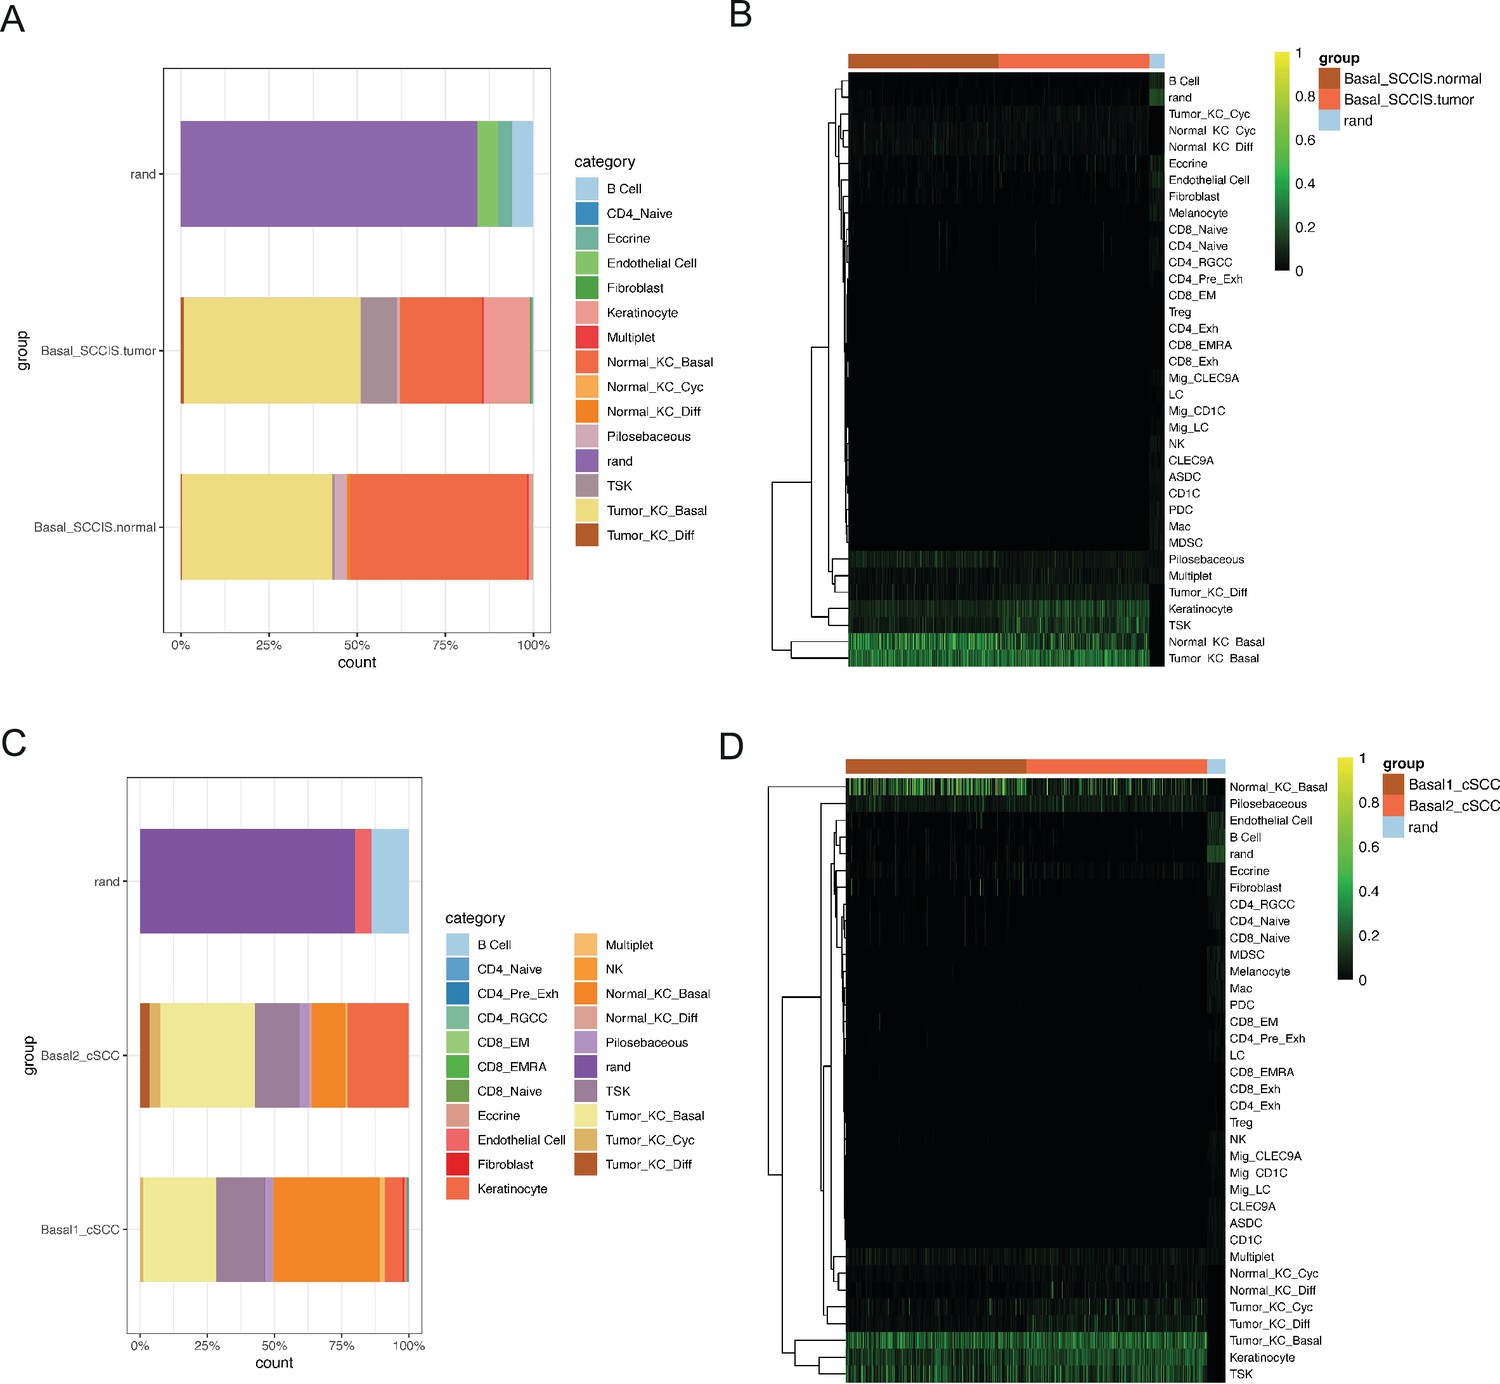
Identification of malignant basal subpopulation in squamous cell carcinoma in situ (SCCIS).
(A) Representative gene ontology (GO) terms for genes with specific expression in basal cell of SCCIS, actinic keratosis (AK), and normal samples in P2 (upper) and up-regulated differentially expressed genes (DEGs) from AK versus normal, SCCIS versus normal, SCCIS versus AK, respectively (lower). (B) Heatmap showing copy number variation (CNV) levels of all keratinocytes from AK and SCCIS samples in P2. The keratinocytes from normal sample in P2 were defined as references. (C) Uniform manifold approximation and projection (UMAP) of subgroups generated from basal cells in SCCIS sample showing basal cells with higher CNV level enriched in one subgroup; red dot representing basal cells with higher CNV level (cnv.score>81.5). (D) DEGs detected between Basal-SCCIS-tumor and Basal-SCCIS-normal. (E) Representative enriched Kyoto Encyclopedia of Genes and Genomes (KEGG) and GO terms in up-regulated genes (avg_log2FC >0.58 and p_val_adj <0.05). (F) Violin plots showing the expression level of representative DNA damage response marker genes in Basal-SCCIS-tumor and Basal-SCCIS-normal subgroups. (G) Chord plot showing the top up-regulated genes included in representative GO terms. (H) Violin plots showing the expression level of major members in HSP family across Basal-SCCIS-tumor and Basal-SCCIS-normal subgroups (Wilcoxon test, p_val_adj <0.05). (I) Violin plots showing the expression level of MAGEA4 and ITGA6 in Basal-SCCIS-tumor and Basal-SCCIS-normal subgroups (Wilcoxon test, p_val_adj <0.05). (J) Immunohistochemistry staining of MAGEA4 and ITGA6 in human skin of normal, SCCIS, and cutaneous squamous cell carcinoma (cSCC) samples.
Figure 4—figure supplement 1
The comprehensive analysis of the patient (P2) with both actinic keratosis (AK) and squamous cell carcinoma in situ (SCCIS).
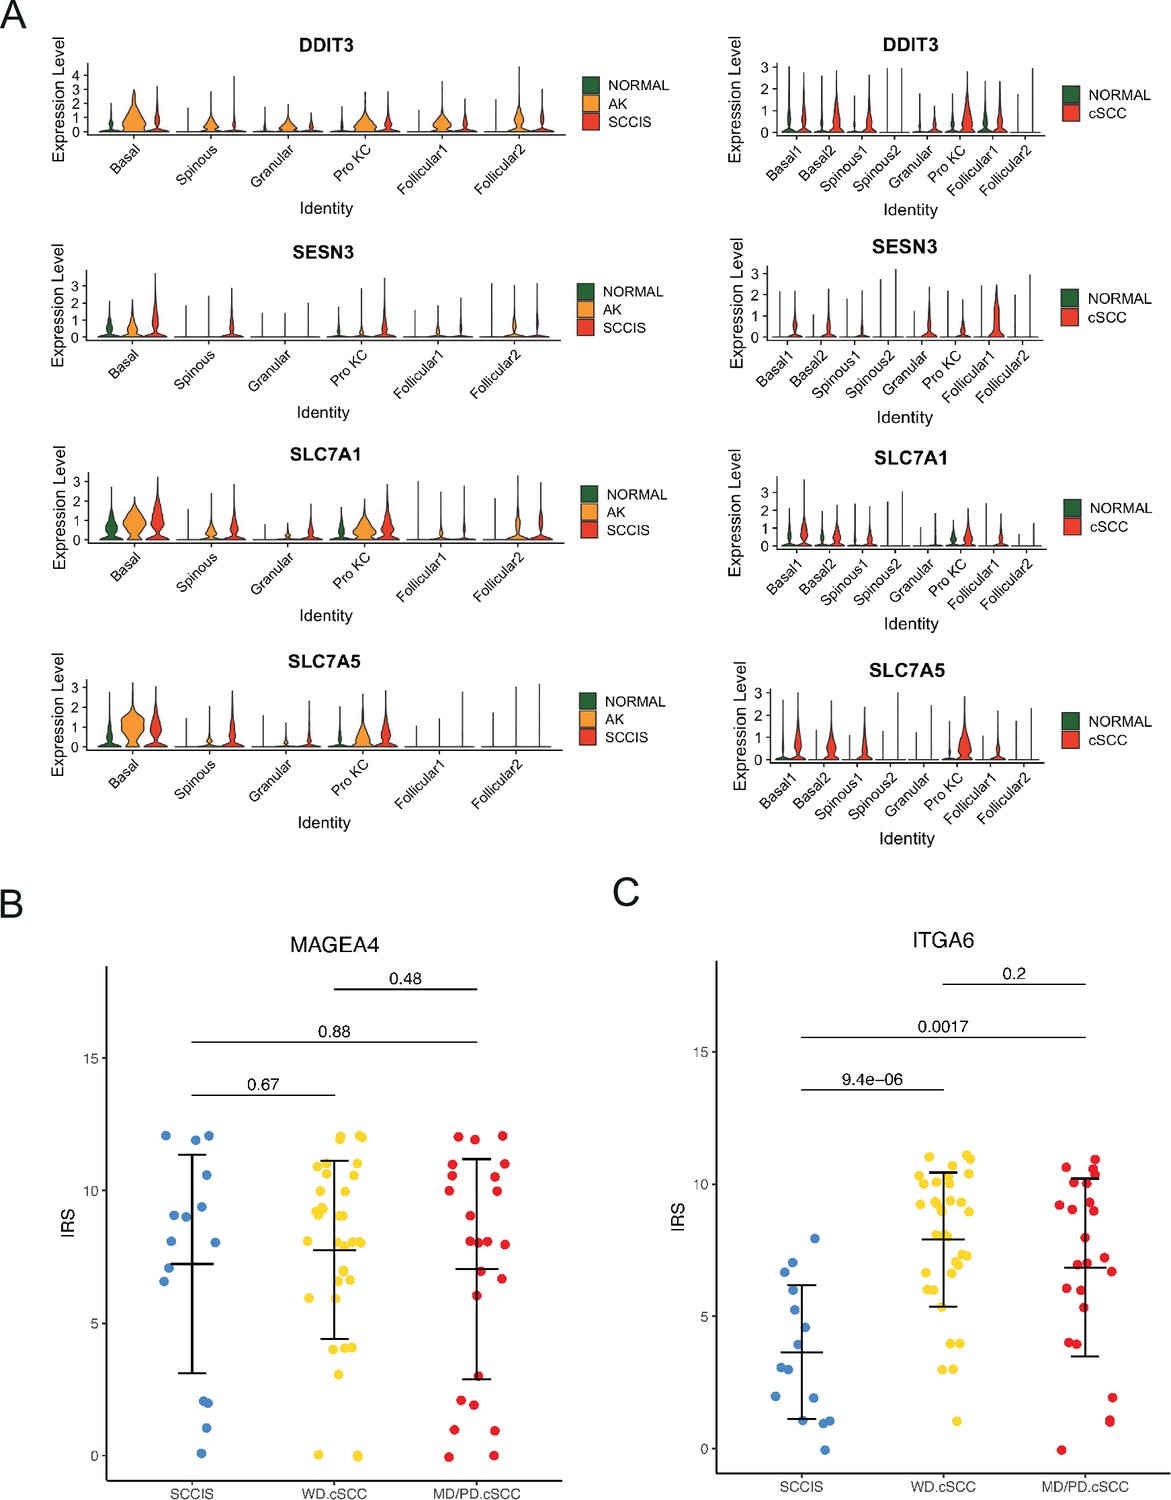
(A) Violin plots showing the different expression levels of candidate genes across all types of keratinocytes in P2, cutaneous squamous cell carcinoma (cSCC), and normal groups (Wilcoxon test, p_val_adj <0.05). (B) The statistical results of immunohistochemistry staining of MAGEA4 in different stages of cSCC including SCCIS, well-differentiated cSCC (WD cSCC), and moderately differentiated/poorly differentiated cSCC (MD/PD cSCC), respectively. (C) The statistical results of immunohistochemistry staining of ITGA6 in different stages of cSCC including SCCIS, WD cSCC, and MD/PD.cSCC, respectively.
Figure 4—figure supplement 2
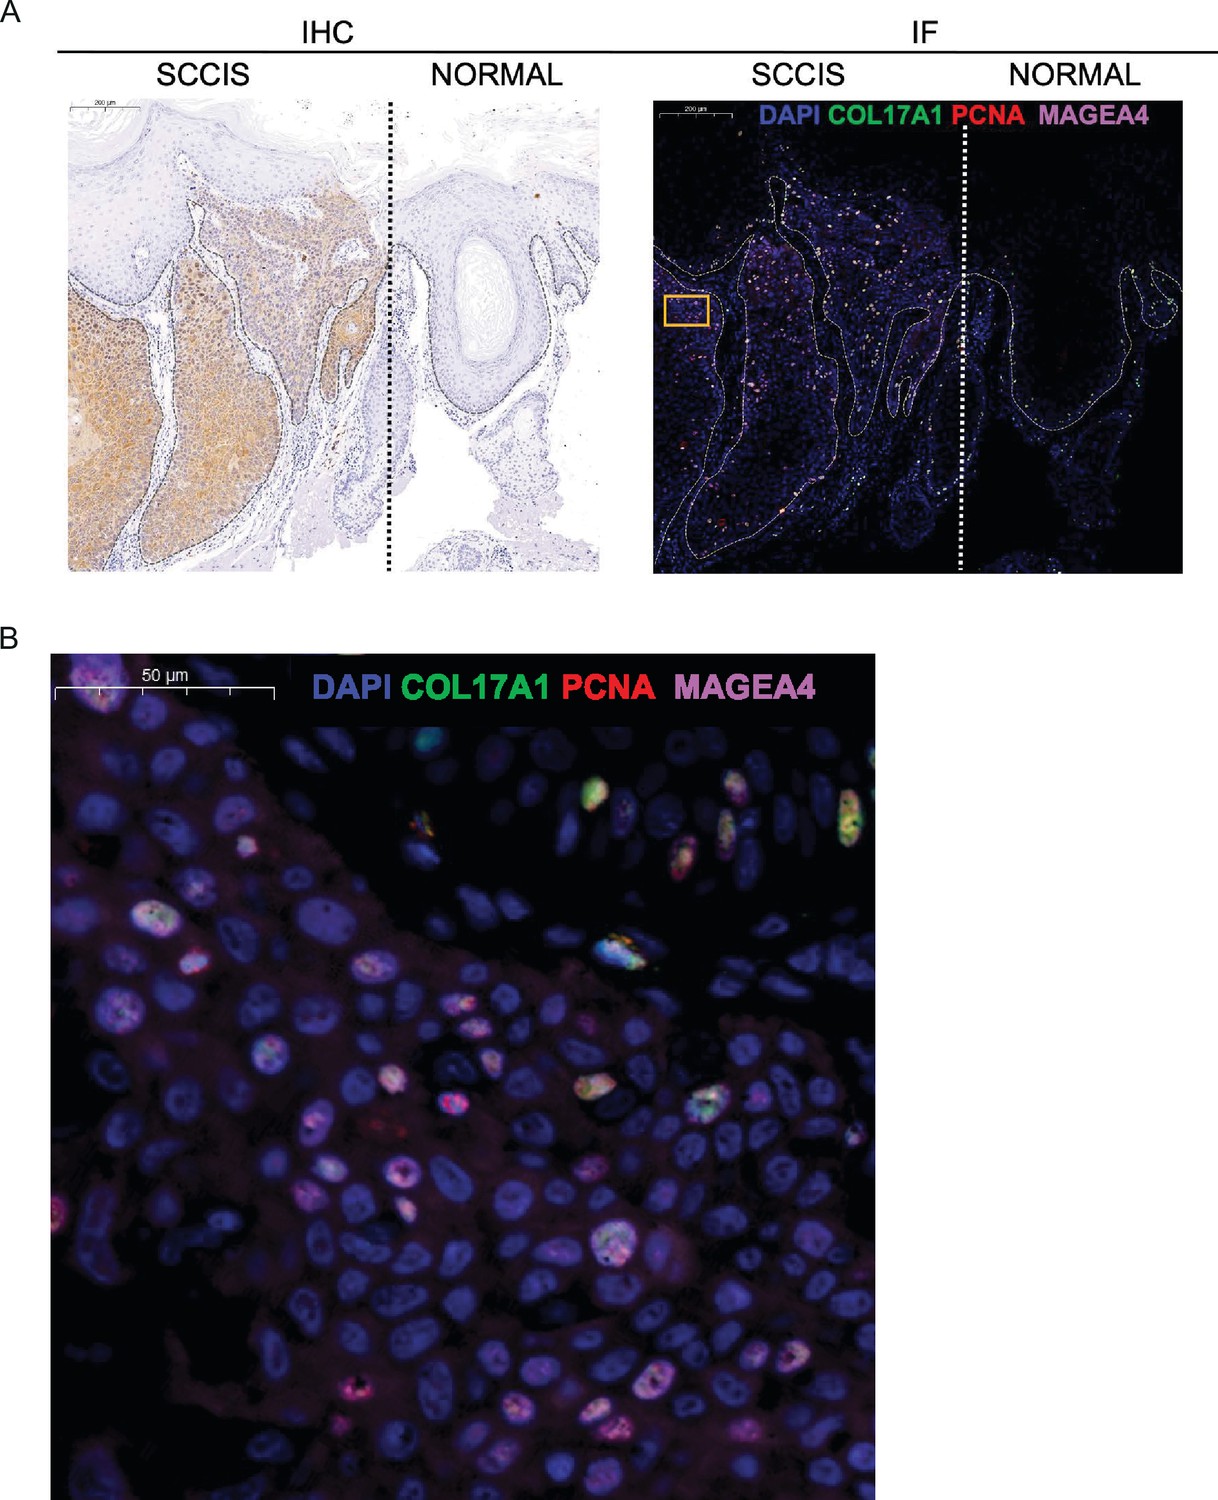
The co-expression of MAGEA4, COL17A1, and PCNA in squamous cell carcinoma in situ (SCCIS).
(A) Left, immunohistochemical staining showed the expression of MAGEA4 in SCCIS (left) was higher than that for para-cancer normal skin tissues (right). Scale bar, 200 μm. Right, immunofluorescence staining for COL17A1 (green), PCNA (red), and MAGEA4 (pink) validates their co-expression in SCCIS. DAPI stains nuclei. Scale bar, 200 μm. The thick dash lines separated the SCCIS tumor from the adjacent normal skin. The fine dash lines represented the demarcation of the basement membrane: epithelium was above and stroma was below. (B) The representative views of co-staining (yellow box in A, right) were shown in the enlarged images. Scale bar, 50 μm.
Figure 4—figure supplement 3
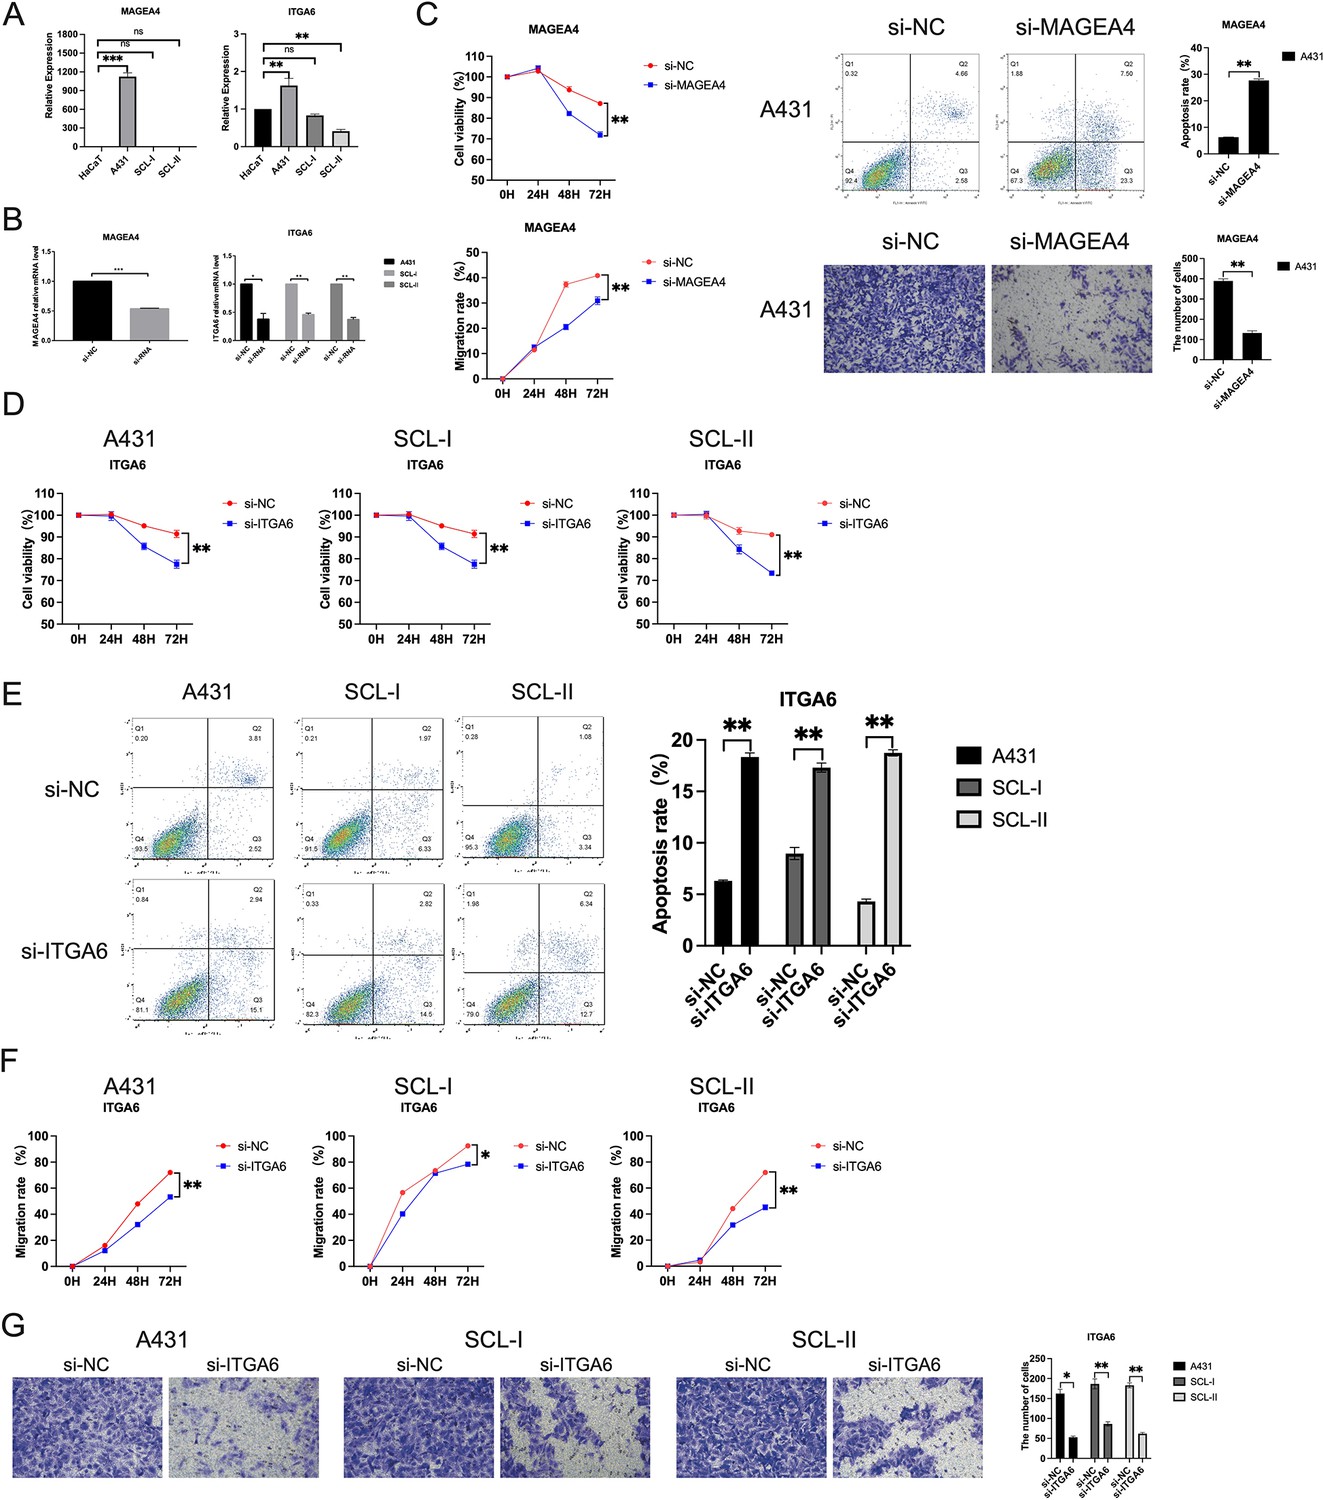
Expression and functional characterization of MAGEA4 and ITGA6.
(A) The mRNA expression of MAGEA4 and ITGA6 in human immortalized keratinocytes (HaCaT) and cutaneous squamous cell carcinoma (cSCC) cell lines (A431, SCL-I, SCL-II). *p<0.05; **p<0.01; ***p<0.001; ns, not significant. (B) Effect of small interfering RNA (siRNA) on the expression of MAGEA4 in A432 and ITGA6 in A431, SCL-I, and SCL-II determined by quantitative real-time PCR (qRT-PCR). (C) Functional experiment of MAGEA4 in A432. Upper, left, effect of MAGEA4 cSCC cell proliferation by CCK-8 proliferation in A431; upper, right, the effect of MAGEA4 on cSCC cell apoptosis was measured by staining with Annexin V-FITC/PI, followed by FACS analysis. Lower, left, the scratch experiment showed that MAGEA4 knockdown resulted in a shorter vertical migration distance compared with the control group after 72 hr; lower, right, transwell assay showed that the invasion abilities of the si-MAGEA4 groups significantly decreased compared with the si-NC group. **p<0.01. (D) Effect of ITGA6 on cSCC cell proliferation by CCK-8 proliferation assay in A431, SCL-I, and SCL-II. *p<0.05; **p<0.01. (E) The effect of ITGA6 on cSCC cell apoptosis. **p<0.01. (F) ITGA6 knockdown resulted in a shorter vertical migration distance compared with the control group after 72 hr. *p<0.05; **p<0.01. (G) The invasion abilities of the si-ITGA6 groups significantly decreased compared with the si-NC group. *p<0.05; **p<0.01.
Figure 4—figure supplement 4
Comparison of basal cells with the cell populations defined by Ji et al.
(A) The attribution plot showing the similarity between Basal-SCCIS-tumor/normal with the cell populations defined by Ji et al. (B) The classification heatmap showing the similarity between Basal-SCCIS-tumor/normal with the cell populations defined by Ji et al. (C) The attribution plot showing the similarity between basal cells in cutaneous squamous cell carcinoma (cSCC) samples with the cell populations defined by Ji et al. (D) The classification heatmap showing the similarity between basal cells in cSCC samples with the cell populations defined by Ji et al. SCCIS, squamous cell carcinoma in situ.
Figure 5 with 3 supplements

Identification of key genes associated with cutaneous squamous cell carcinoma (cSCC).
(A) Uniform manifold approximation and projection (UMAP) of all cells from cSCC patients labeled by sample and cell type, respectively. (B) Cell proportion of keratinocytes in cSCC and normal groups. (C) Expression of basal, Pro KC, and differentiated genes in all keratinocytes of cSCC and normal groups. (D) Left, immunohistochemical staining of LGALS1, IFITM3, and FTH1 in normal skin (200×), well-differentiated cSCC (WD cSCC) (50× and 250×), and moderately differentiated/poorly differentiated cSCC (MD/PD cSCC) (50× and 250×). Scale bar, 200 μm and 50 μm. Right, the immunoreactivity score (IRS) analyses of LGALS1, IFITM3, and FTH1 in normal skin, WD cSCC, and MD/PD cSCC. n=15 for each group. *p<0.05; **p<0.01; ***p<0.001; ns, not significant. (E) The mRNA expression of LGALS1, IFITM3, and FTH1 in human immortalized keratinocytes (HaCaT) and cSCC cell lines (A431, SCL-I, SCL-II). *p<0.05; **p<0.01; ***p<0.001; ns, not significant.
Figure 5—figure supplement 1
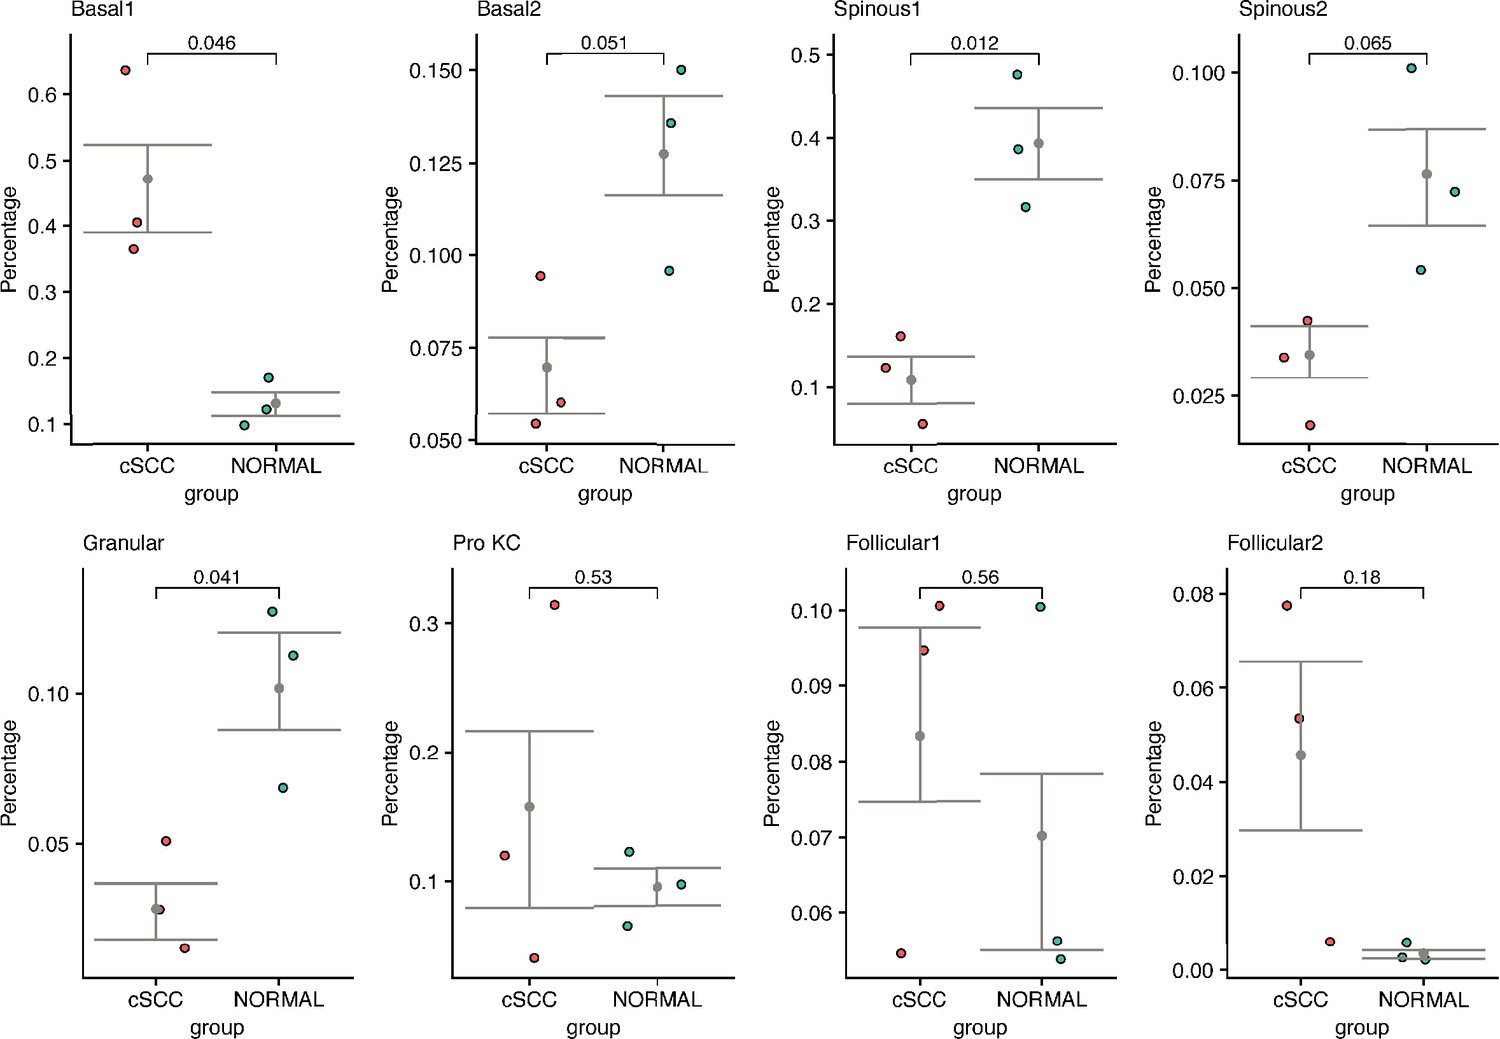
The changes of cell proportion and significance test in all cutaneous squamous cell carcinoma (cSCC) samples and patient-matched normal skin samples (t test, p<0.05).
Figure 5—figure supplement 2
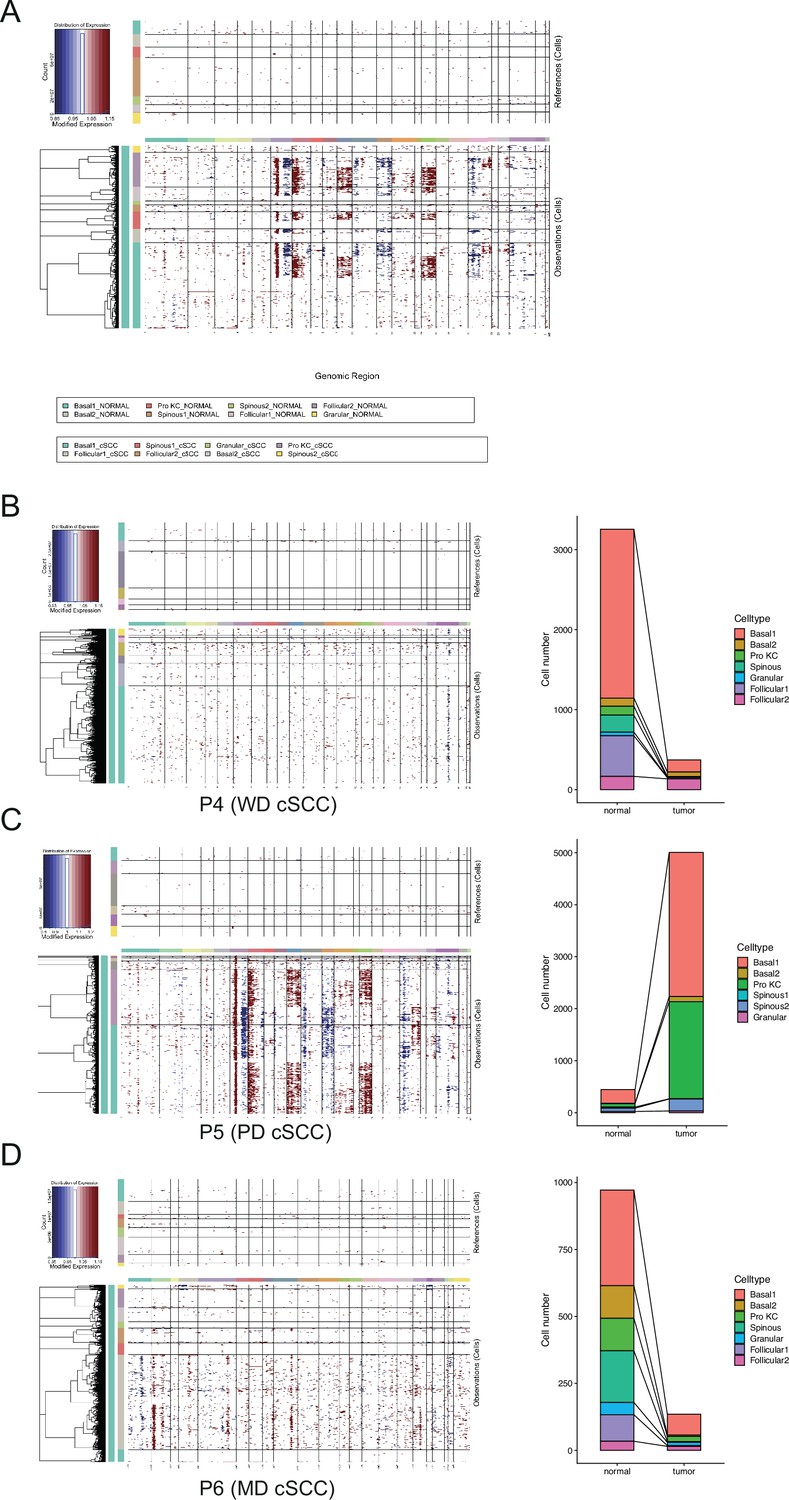
Copy number variation (CNV) scores positively correlated with malignant degrees of cutaneous squamous cell carcinoma (cSCC).
(A) Heatmap showing CNV levels of all keratinocytes from all cSCC samples. The keratinocytes from all patient-matched normal samples were defined as references. (B) Left, heatmap showing CNV levels of all keratinocytes from well-differentiated cSCC (WD cSCC) sample; right, the proportion of tumor and normal cells in WD cSCC sample defined by cnv.cut (probs = 0.99). (C) Left, heatmap showing CNV levels of all keratinocytes from poorly differentiated cSCC (PD cSCC) sample; right, the proportion of tumor and normal cells in PD cSCC sample defined by cnv.cut (probs = 0.99). (D) Left, heatmap showing CNV levels of all keratinocytes from moderately differentiated cSCC (MD cSCC) sample; right, the proportion of tumor and normal cells in MD cSCC sample defined by cnv.cut (probs = 0.99).
Figure 5—figure supplement 3
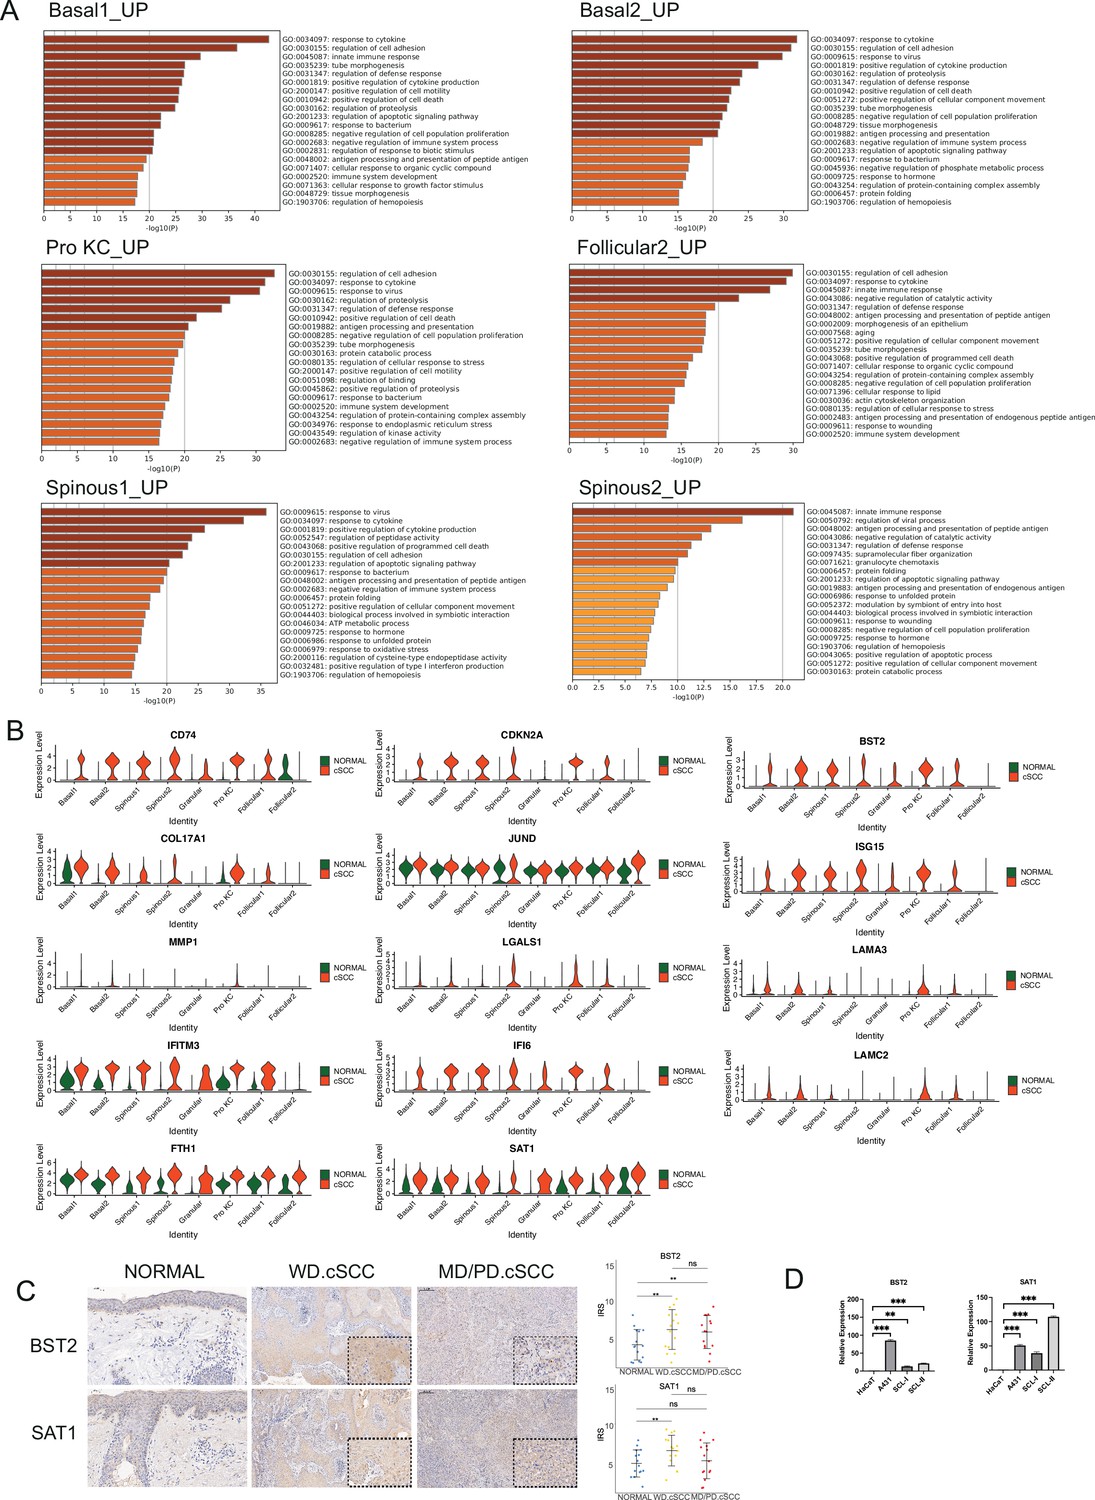
Identification of key genes associated with cutaneous squamous cell carcinoma (cSCC).
(A) The enriched gene ontology (GO) terms of up-regulated differentially expressed genes (DEGs) in Basal1, Basal2, Pro KC, Follicular2, Spinous1 and Spinous2 between cSCC and normal groups. (B) Violin plots showing the different expression levels of candidate genes in cSCC and normal groups (Wilcoxon test, p_val_adj <0.05). (C) Left, immunohistochemical staining of BST2 and SAT1 in cSCC in normal skin (200×), well-differentiated cSCC (WD cSCC) (50× and 250×) and moderately differentiated/poorly differentiated cSCC (MD/PD cSCC) (50× and 250×). Scale bar, 200 μm and 50 μm. Right, the immunoreactivity score (IRS) analyses of BST2 and SAT1 in normal skin, WD cSCC and MD/PD cSCC. n=15 for each group. *p<0.05; **p<0.01; ***p<0.001; ns, not significant. (D) The mRNA expression of BST2 and SAT1 in human immortalized keratinocytes (HaCaT) and cSCC cell lines (A431, SCL-I, SCL-II). *p<0.05; **p<0.01; ***p<0.001; ns, not significant.
Figure 6 with 1 supplement

Functional characterization of key genes associated with cutaneous squamous cell carcinoma (cSCC).
(A) Effect of small interfering RNA (siRNA) on the expression of LGALS1, IFITM3, and FTH1 in A431, SCL-I, and SCL-II determined by quantitative real-time PCR (qRT-PCR). (B) Effect of LGALS1, IFITM3, and FTH1 on cSCC cell proliferation. The CCK-8 proliferation assay demonstrated a significant decrease in the proliferation of the si-LGALS1, si-IFITM3, and si-FTH1 groups compared with the si-NC group. *p<0.05; **p<0.01; ***p<0.001; ns, not significant. (C) The effect of LGALS1, IFITM3, and FTH1 on cSCC cell apoptosis. Significant increase in the apoptosis of the si-LGALS1, si-IFITM3, and si-FTH1 groups compared with the si-NC group. *p<0.05; **p<0.01; ***p<0.001; ns, not significant. (D) The scratch experiment showed that LGALS1 and IFITM3 knockdown resulted in a shorter vertical migration distance compared with the control group after 72 hr, while there was no significant change in the si-FTH1 group. *p<0.05; **p<0.01; ***p<0.001; ns, not significant. (E) Transwell assay showed that the invasion abilities of the si-LGALS1, si-IFITM3, and si-FTH1 groups significantly decreased compared with the si-NC group. *p<0.05; **p<0.01; ***p<0.001.
Figure 6—figure supplement 1
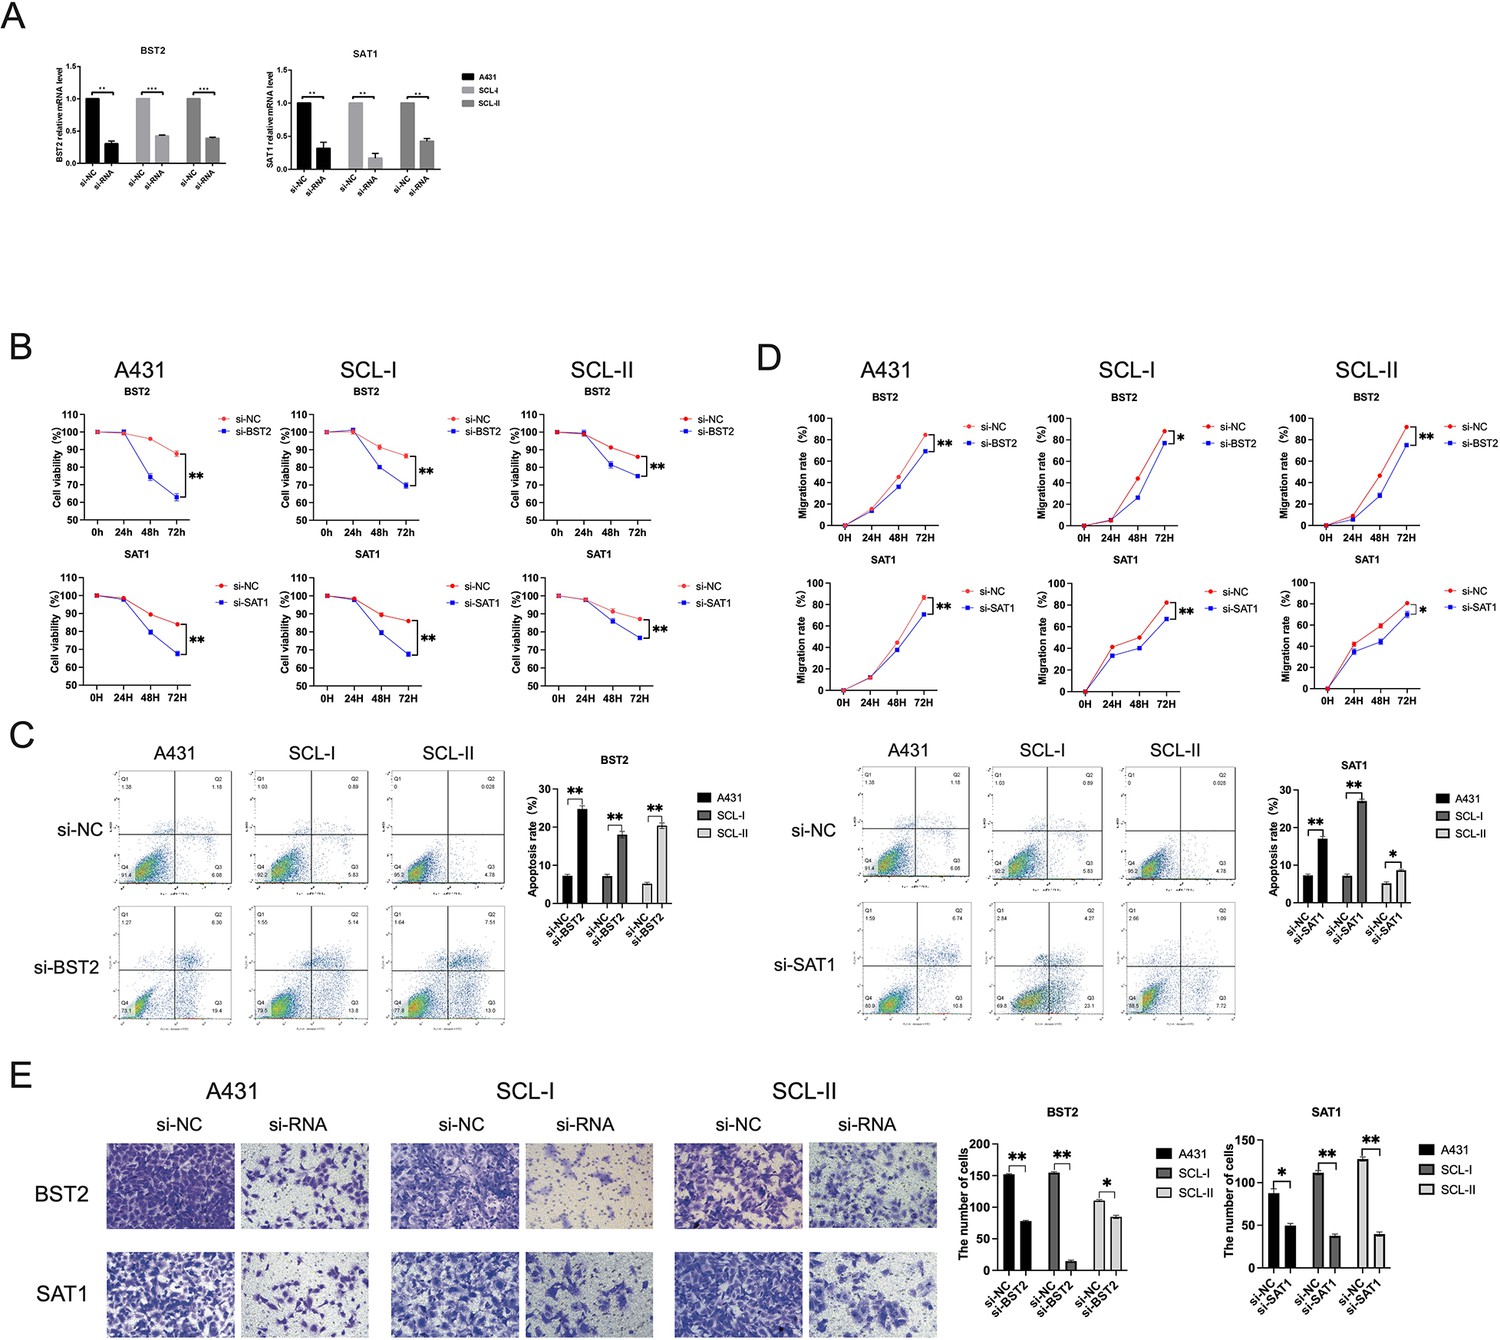
Expression and functional characterization of BST2 and SAT1.
(A) Effect of small interfering RNA (siRNA) on the expression of BST2 and SAT1 in A431, SCL-I, and SCL-II determined by quantitative real-time PCR (qRT-PCR). (B) Effect of BST2 and SAT1 on cutaneous squamous cell carcinoma (cSCC) cell proliferation by CCK-8 proliferation assay in A431, SCL-I, and SCL-II. **p<0.01. (C) The effect of BST2 and SAT1 on cSCC cell apoptosis. **p<0.01. (D) BST2 and SAT1 knockdown resulted in a shorter vertical migration distance compared with the control group after 72 hr. *p<0.05; **p<0.01. (E) The invasion abilities of the si-ITGA6 groups significantly decreased compared with the si-NC group. *p<0.05; **p<0.01.
Figure 7 with 2 supplements
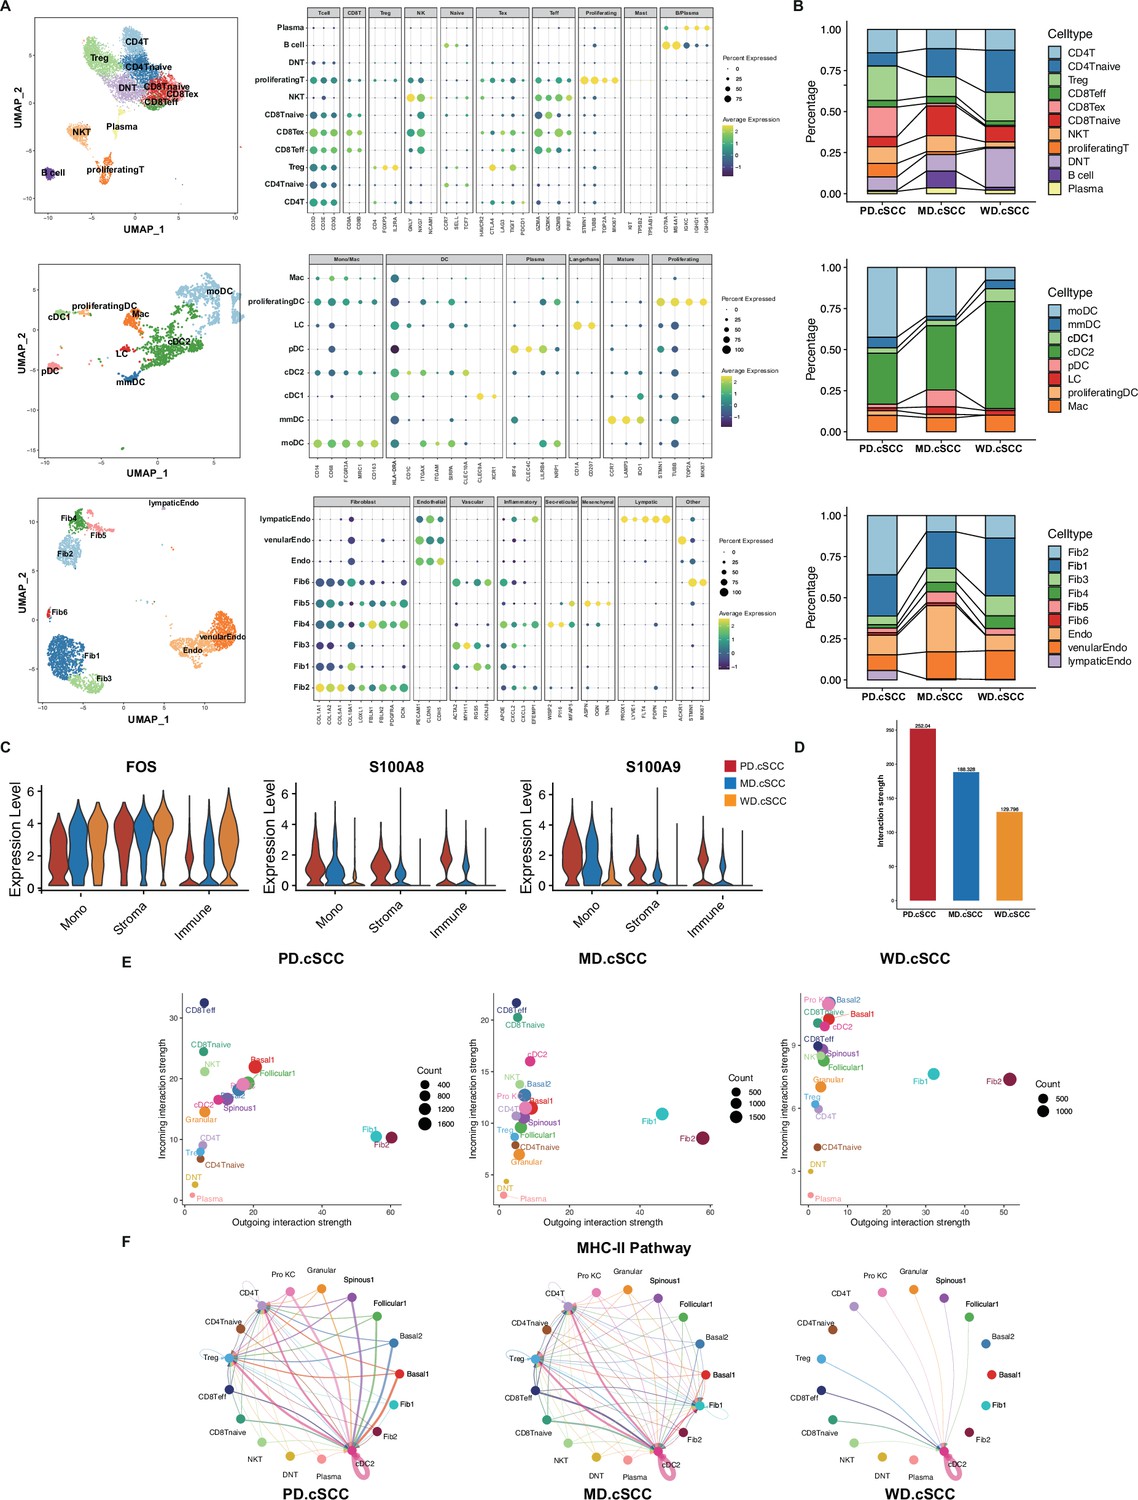
The analysis of cell-cell communication in tumor microenvironment (TME) of cutaneous squamous cell carcinoma (cSCC) samples.
(A) Identification of TME cell subpopulations based on their marker genes, including T cells, dendritic (DC) cells, and stromal cells. (B) Cell proportion of cell subpopulations in T cells, DC cells, and stromal cells, respectively. (C) The monotonically changed differentially expressed genes (DEGs) in TME cells in cSCC samples of all stages (Wilcoxon test, p_val_adj <0.05). (D) Comparison of cell interactions among the different clinical stages of cSCC (Wilcoxon test, ****p<0.0001). (E) Comparison of total incoming path weights vs total outgoing path weights across all cell populations in three cSCC samples, respectively (Wilcoxon test, p<0.1). (F) Circle plot showing the inferred intercellular communication signaling strength network of MHC-II pathway in three cSCC samples, respectively (Wilcoxon test, p<0.1).
Figure 7—figure supplement 1
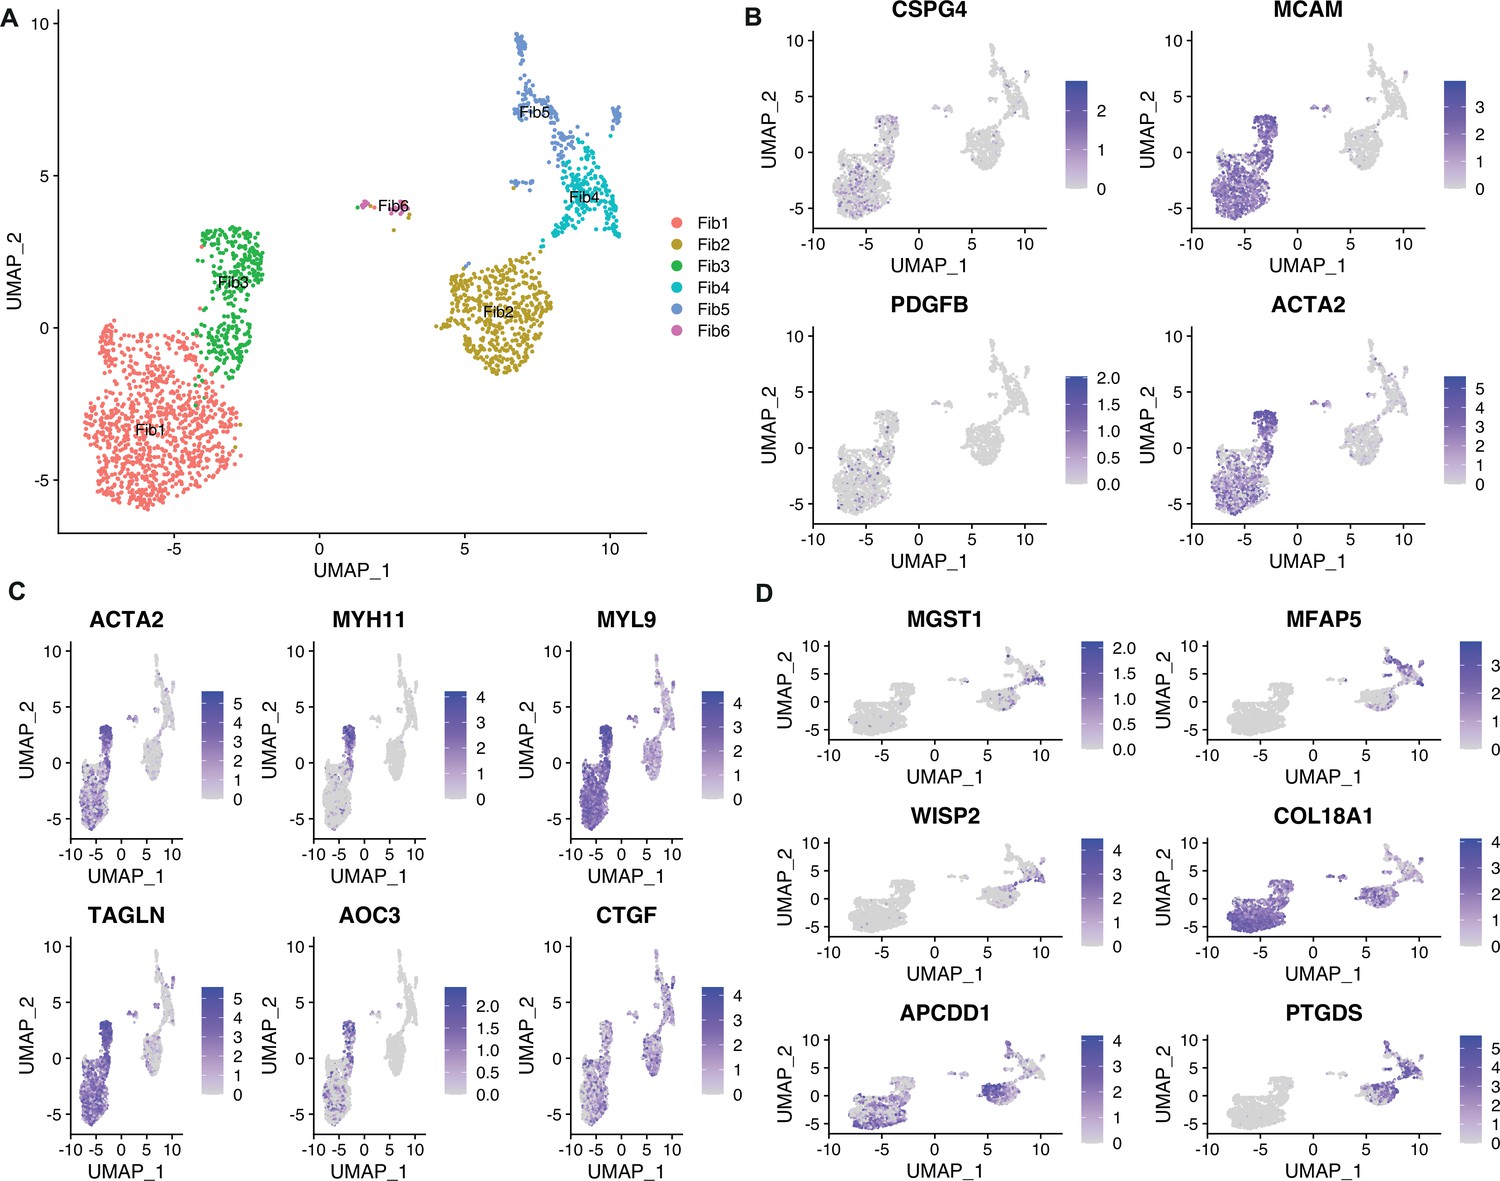
The second-level clustering on fibroblasts.
(A) Uniform manifold approximation and projection (UMAP) of subpopulations generated from fibroblasts in all cutaneous squamous cell carcinoma (cSCC) samples. (B) Feature plots showing the expression of signature genes for Figure 1. (C) Feature plots showing the expression of signature genes for Fib3. (D) Feature plots showing the expression of signature genes for Fib4.
Figure 7—figure supplement 2
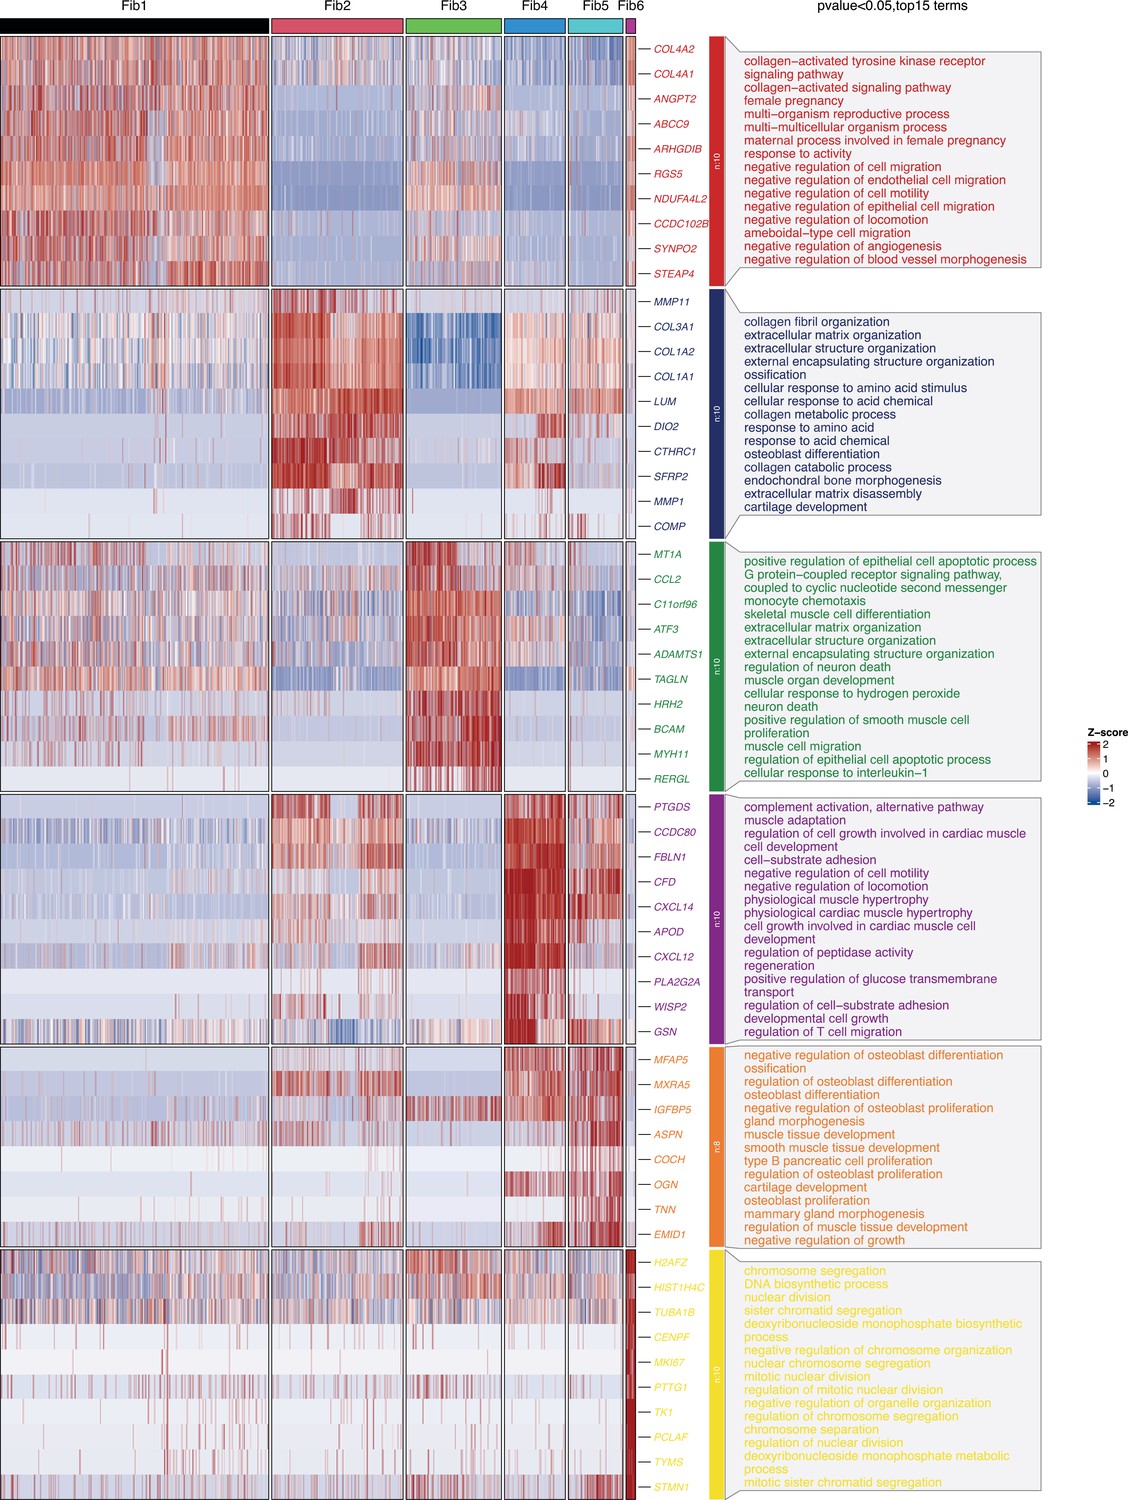
The heatmap and functional analysis of top 15 differentially expressed genes (DEGs) in fibroblast subsets.
Figure 8 with 2 supplements

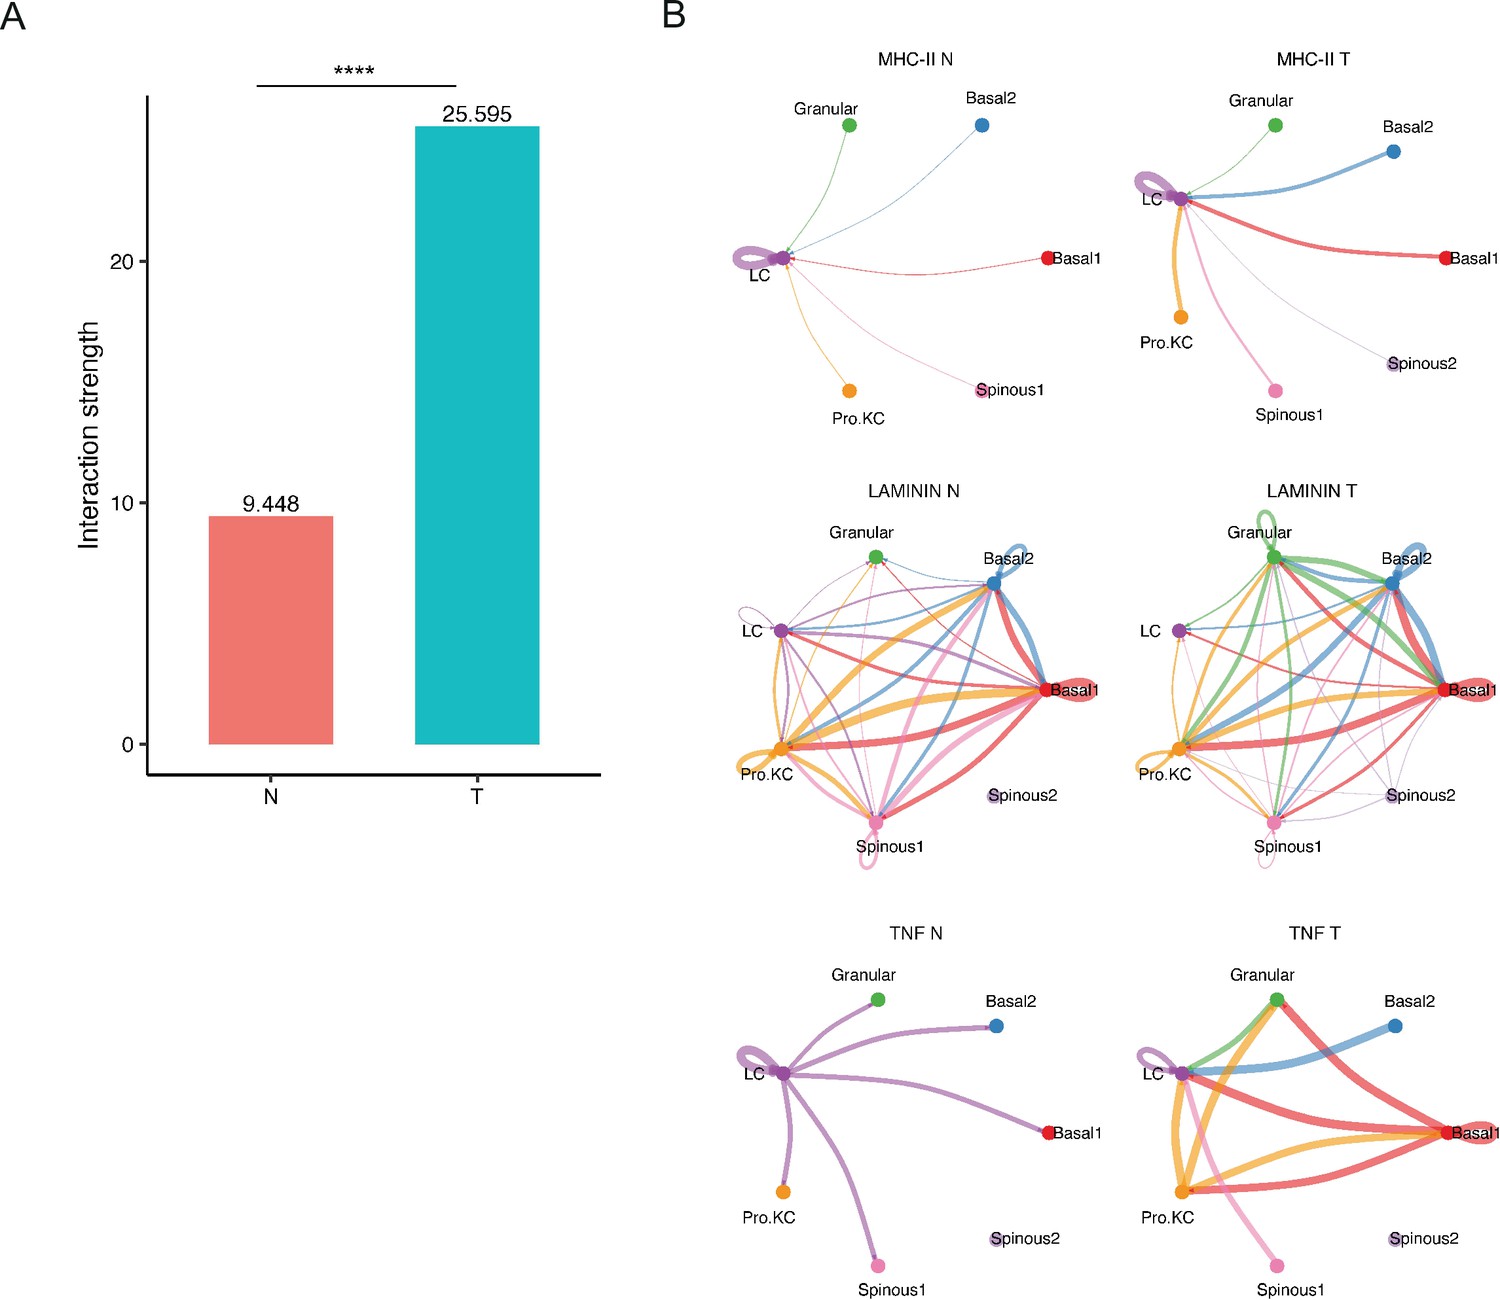
The analysis of cell-cell communication in tumor microenvironment (TME) of poorly differentiated cutaneous squamous cell carcinoma (cSCC) and matched normal samples.
(A) Comparison of total incoming path weights vs total outgoing path weights between normal and tumor samples across common cell populations (Wilcoxon test, p<0.1). (B) Significant signaling pathways were ranked based on differences in the overall information flow within the inferred networks between normal and tumor samples. The signaling pathways colored orange are enriched in normal tissue, and pathways colored dark green were enriched in the tumor tissue (Wilcoxon test, p<0.1). (C) Circle plot showing the inferred intercellular communication signaling strength network between normal and tumor samples in MHC-II, LAMININ, and TNF pathway (Wilcoxon test, p<0.1). (D) Comparison of the significant ligand-receptor pairs between normal and tumor skin. The top shows the contribution to the signaling from Langerhans to KC subpopulations. The bottom shows the contribution to the signaling from KC subpopulations to Langerhans. Dot color reflects communication probabilities and dot size represents computed p-values. Empty space means the communication probability is zero. p-Values are computed from one-sided permutation test.
Figure 8—figure supplement 1
The analysis of cell-cell communication in tumor microenvironment (TME) of poorly differentiated cutaneous squamous cell carcinoma (cSCC) and matched normal samples.
(A) Comparison of cell interactions between poorly differentiated cSCC and matched normal samples (Wilcoxon test, ****p<0.0001). (B) Circle plot showing the inferred intercellular communication signaling strength network of MHC-II, LAMININ, and TNF pathways in poorly differentiated cSCC and matched normal samples were predicted by CellPhoneDB approach (Wilcoxon test, p<0.1).
Figure 8—figure supplement 2
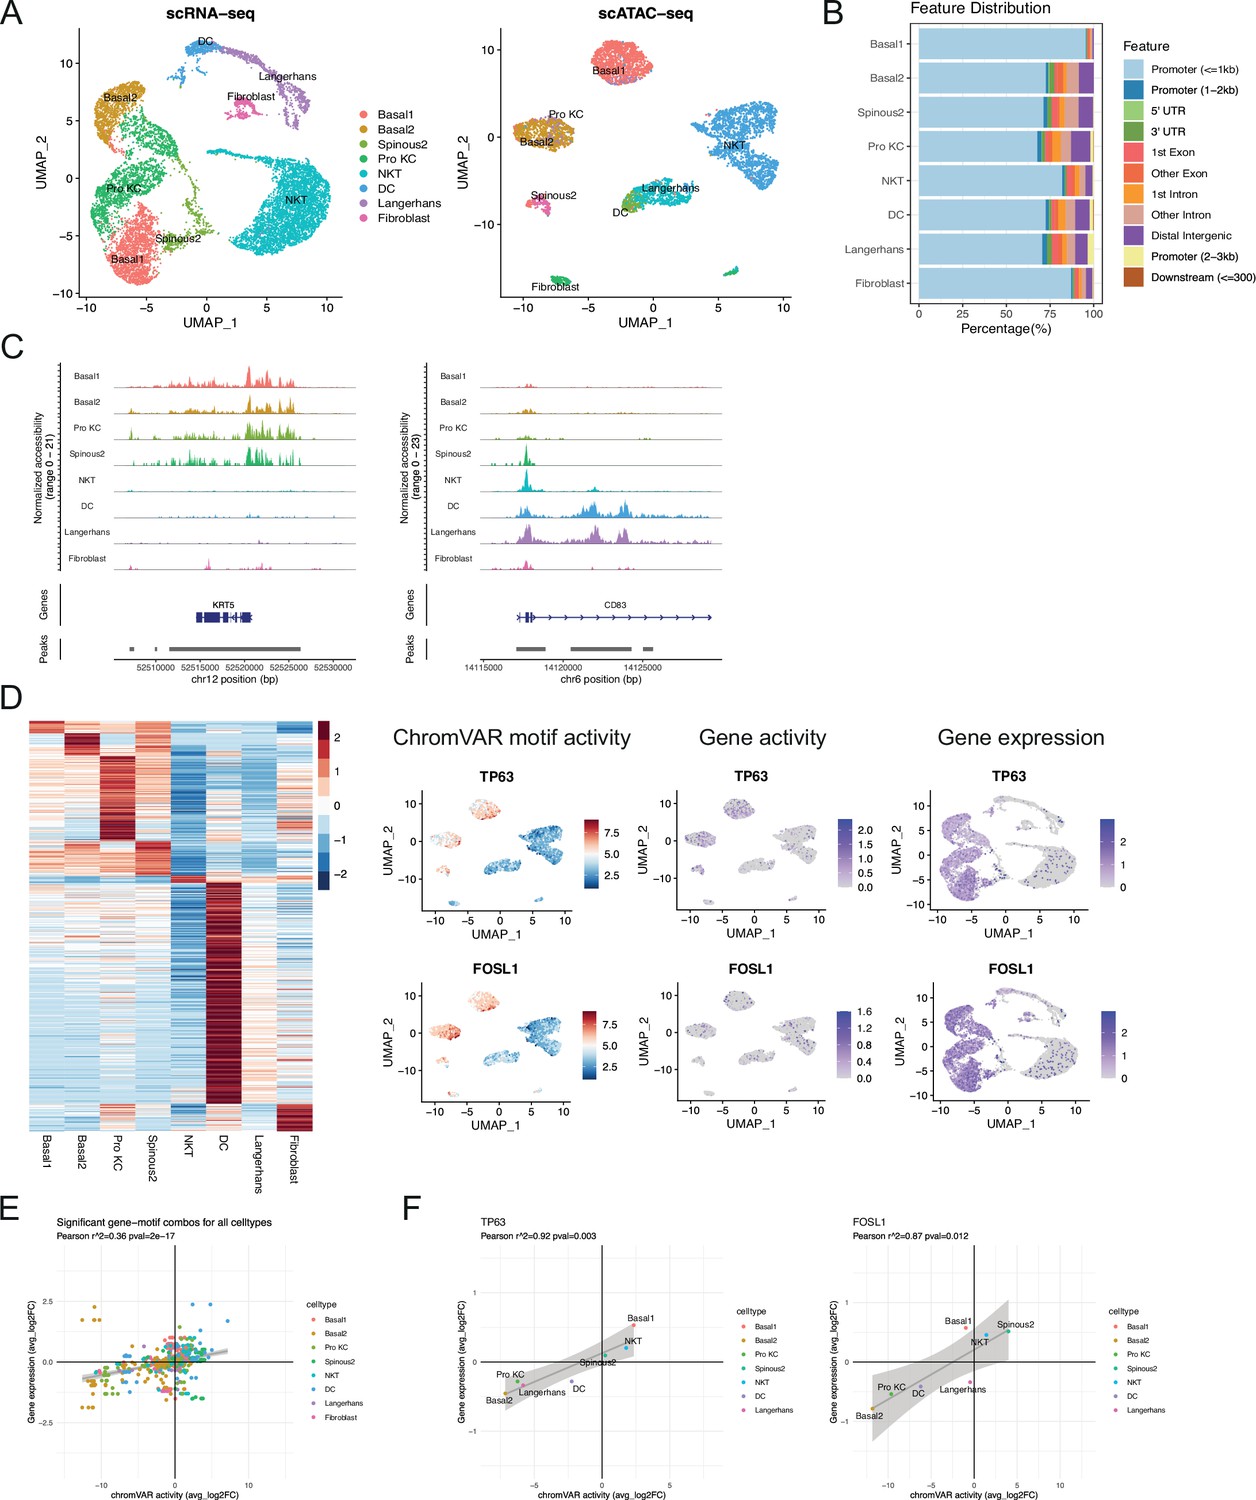
Chromatin accessibility is associated with transcription factor activity.
(A) Left, uniform manifold approximation and projection (UMAP) of single-cell RNA sequencing (scRNA-seq) dataset from poorly differentiated cSCC (PD cSCC) sample labeled by cell type; right, UMAP plot of single-cell ATAC sequencing (scATAC-seq) dataset from PD cSCC sample labeled by cell type after integration and label transfer with scRNA-seq data. (B) Bar plot of annotated differentially accessible region (DAR) location for each type. (C) Fragment coverage (frequency of Tn5 insertion) around the DAR on the gene KRT5 and CD83. (D) Left, heatmap of average chromVAR motif activity for each cell type. The color scale represents a z-score scaled by row. Right, UMAP plot displaying chromVAR motif activity, gene activity, and gene expression of TP63 (upper) and FOSL1 (lower). The color scale for each plot represents a normalized log-fold-change for the respectively assay. (E) Cell-specific mean chromVAR motif activity from the JASPAR database was plotted against cell-specific average expression for the corresponding transcription factor for all cell types and transcription factors. (F) Mean chromVAR activity was plotted against average expression for TP63 (left) and FOSL1 (right). Significant correlation was assessed with Pearson’s product moment correlation coefficient using the cor.test function in R.
Author response image 1
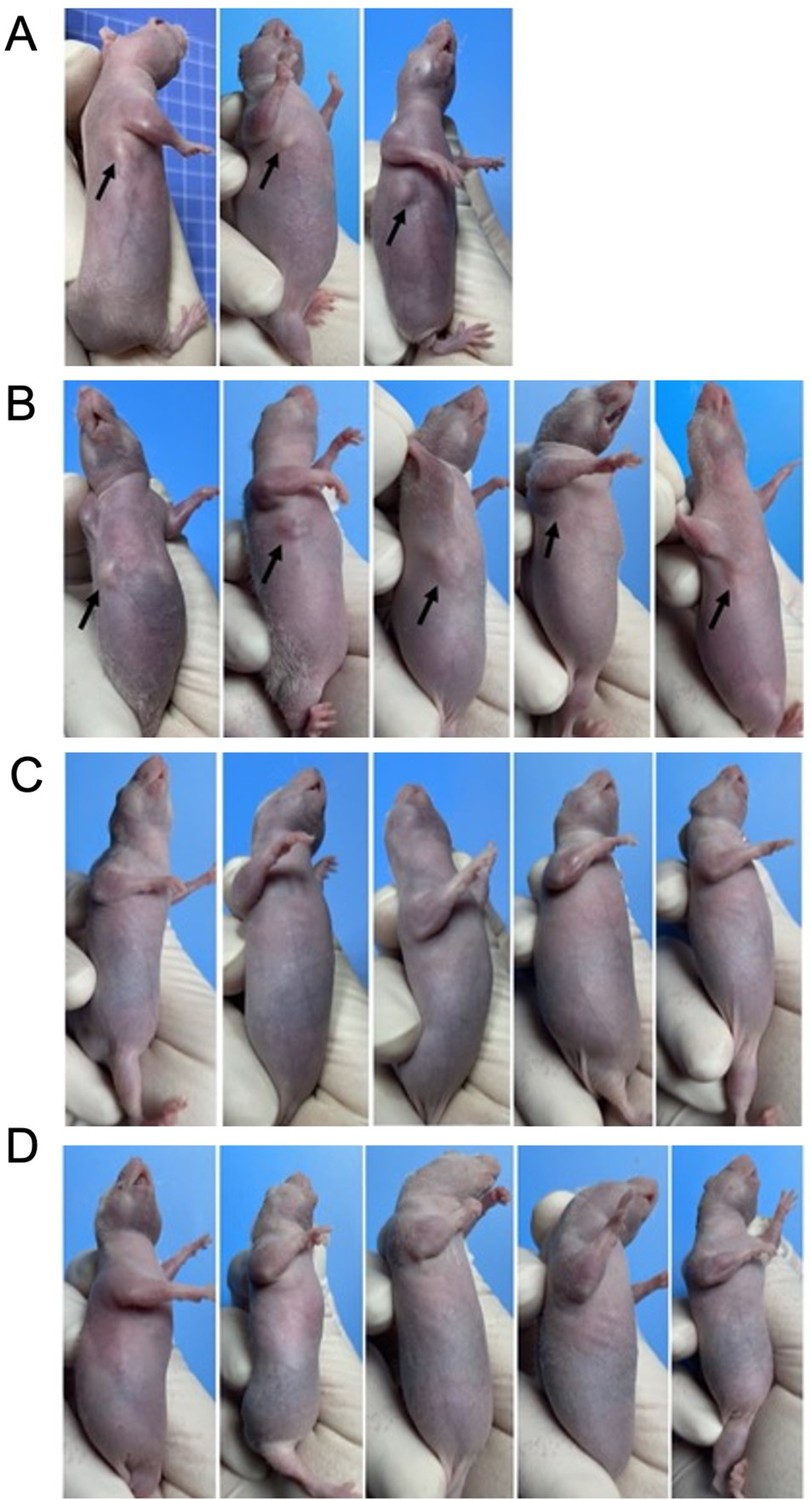
The xenograft assay results.
4-6 weeks old male BALB/c-nu mice weighing 18-22g were selected for xenograft assays. A431 cells on log phase were digested and washed twice by centrifugation with serum-free culture medium. (A) In the first xenograft assay, cell suspension concentration was 2.5*107 cells/mL. Under the sterile conditions, 0.2 ml cell suspension was injected subcutaneously into the right armpit of each BALB/c-Nu mouse. After 2 weeks, 3 out of 10 mice (30%) developed subcutaneous tumors, with a volume of about 5-15 mm3. There was no significant increase of tumor volume after 30-days continued observation. (B) In the second xenograft assay, cell suspension concentration was adjusted to 5*107 cells/mL. Matrigel matrix were added to improve the rate of tumor formation. After 2 weeks, 5 out of 20 mice (25%) developed subcutaneous tumors, and the tumor volume was about 10-80 mm3. There was no significant increase of tumor volume after 2-months continued observation. (C) The xenograft assays with sh-Control A431 cells (mock lentivirus infected). There were no visible tumors in sh-Control group (20 mice) after 2-months continued observation. (D) The xenograft assays with sh-MAGEA4 A431 cells (sh-MAGEA4 lentivirus infected). There were no visible tumors in sh-MAGEA4 group (20 mice) after 2-months continued observation.
Additional files
-
Supplementary file 1
The tables of supplementary data.
(a) Clinical characteristic of patients and samples enrolled in single-cell sequencing. (b) The gene list of up-regulated differentially expressed genes (DEGs) in actinic keratosis (AK) Basal1 subpopulation. (c) The gene list of up-regulated DEGs in AK Basal2 subpopulation. (d) The gene list of up-regulated DEGs in AK Pro KC subpopulation. (e) AK candidate driver genes and antibodies for IF. (f) The gene list of overlapped up-regulated DEGs in Basal subpopulation of P2 from AK vs normal and squamous cell carcinoma in situ (SCCIS) vs AK. (g) The gene list of overlapped down-regulated DEGs in basal subpopulation of P2 from AK vs normal and SCCIS vs AK. (h) The gene list of up-regulated DEGs between Basal-SCCIS-tumor vs Basal-SCCIS-normal. (i) SCCIS candidate driver genes and antibodies for immunohistochemistry (IHC). (j) The gene list of up-regulated DEGs in cutaneous squamous cell carcinoma (cSCC) Basal1 subpopulation. (k) The gene list of up-regulated DEGs in cSCC Basal2 subpopulation. Supplementary file (l) The gene list of up-regulated DEGs in cSCC Pro KC subpopulation. (m) The gene list of up-regulated DEGs in cSCC Follicular2 subpopulation. (n) The gene list of up-regulated DEGs in cSCC Spinous1 subpopulation. (o) The gene list of up-regulated DEGs in cSCC Spinous2 subpopulation. (p) cSCC candidate driver genes and antibodies for IHC. (q) Significance test for interaction strength of cells in Figure 7E. (r) Significance test for interaction strength of MHC-II pathway in Figure 7F. (s) Significance test for interaction strength of cells in Figure 8A. (t) Significance test for signaling pathways in Figure 8B. (u) Significance test for the interaction strength of three signaling pathways of cells in Figure 8C. (x) The correlation between chromVAR transcription factor activity with expression in single-cell ATAC sequencing (scATAC-seq) data. (y) The sequences of various small interfering RNA (siRNA) oligonucleotides used in this study. (z) The primers of genes used for quantitative real-time PCR (qRT-PCR). (v) The differentially accessible chromatin regions between cell types of poorly differentiated cSCC sample in scATAC-seq data. (w) The chromVAR transcription factor activity between cell types of poorly differentiated cSCC sample in scATAC-seq data.
- https://cdn.elifesciences.org/articles/85270/elife-85270-supp1-v2.zip
-
MDAR checklist
- https://cdn.elifesciences.org/articles/85270/elife-85270-mdarchecklist1-v2.docx
Download links
A two-part list of links to download the article, or parts of the article, in various formats.
Downloads (link to download the article as PDF)
Open citations (links to open the citations from this article in various online reference manager services)
Cite this article (links to download the citations from this article in formats compatible with various reference manager tools)
Single-cell sequencing highlights heterogeneity and malignant progression in actinic keratosis and cutaneous squamous cell carcinoma
eLife 12:e85270.
https://doi.org/10.7554/eLife.85270


