Continuous muscle, glial, epithelial, neuronal, and hemocyte cell lines for Drosophila research
- Department of Molecular Genetics, Ohio State University, United States
- Drosophila RNAi Screening Center and Department of Genetics, Harvard Medical School, United States
- Drosophila Genomics Resource Center and Department of Biology, Indiana University, United States
- Howard Hughes Medical Institute, United States
- National Science Foundation, United States
Figures
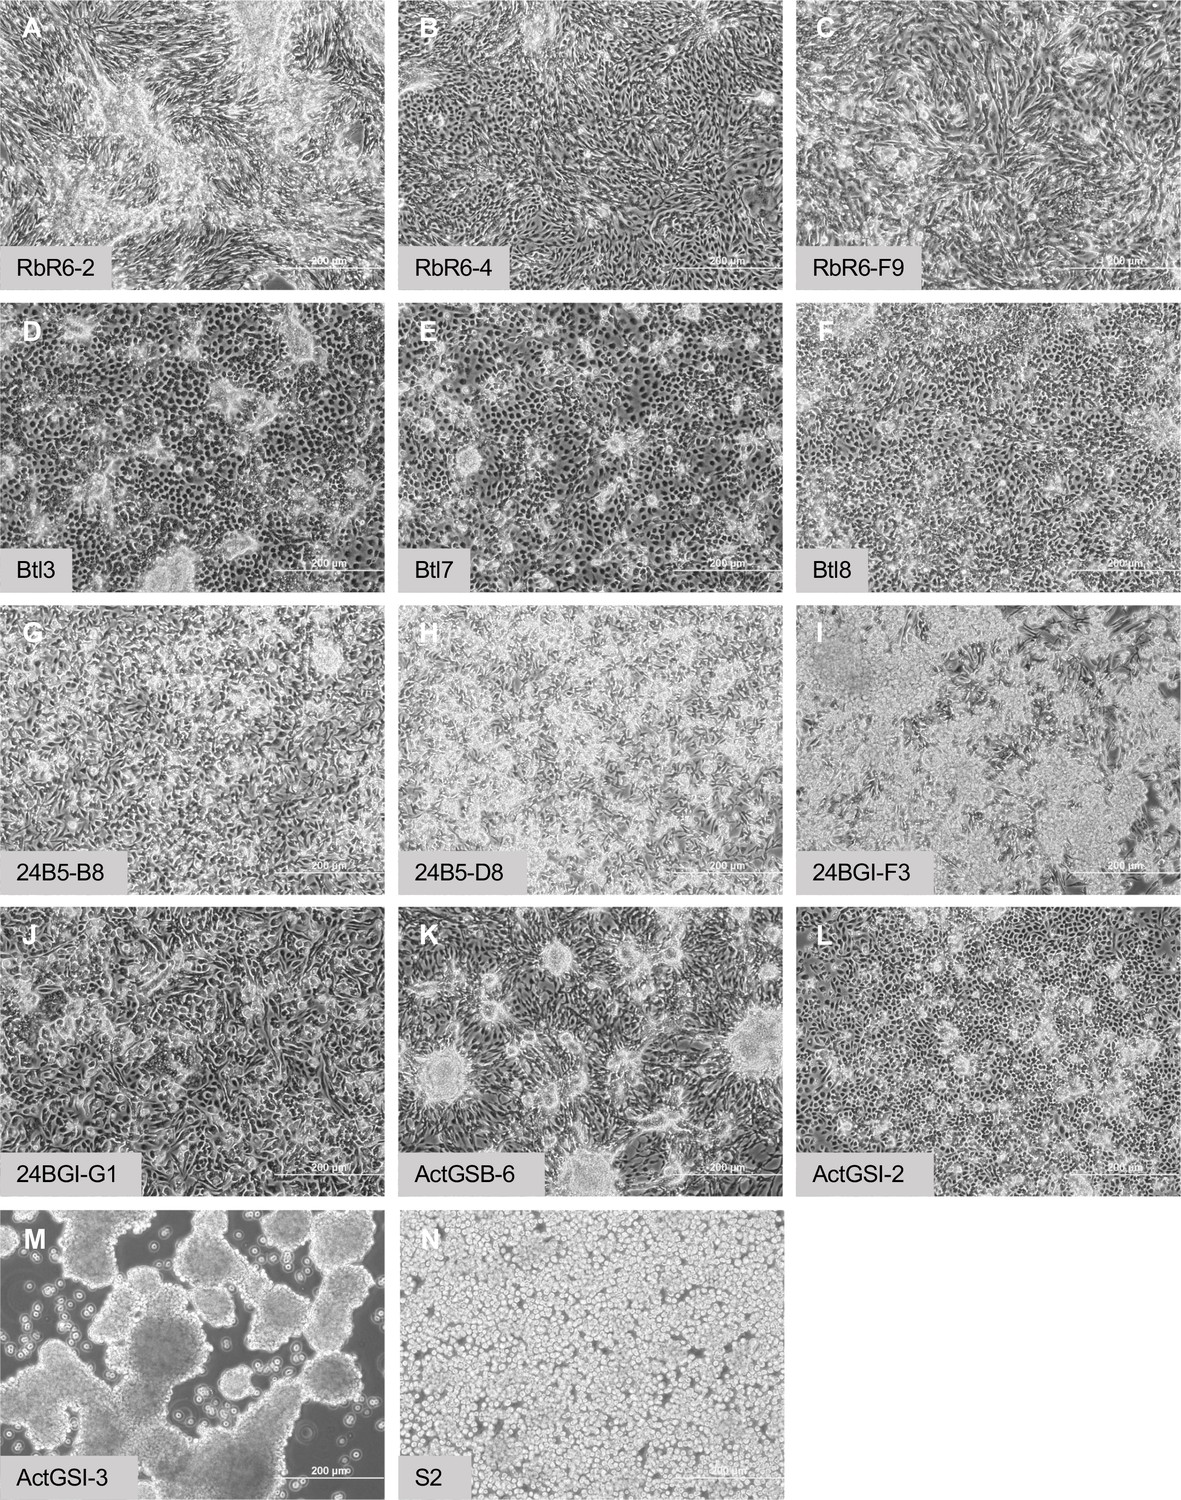
Figure 1
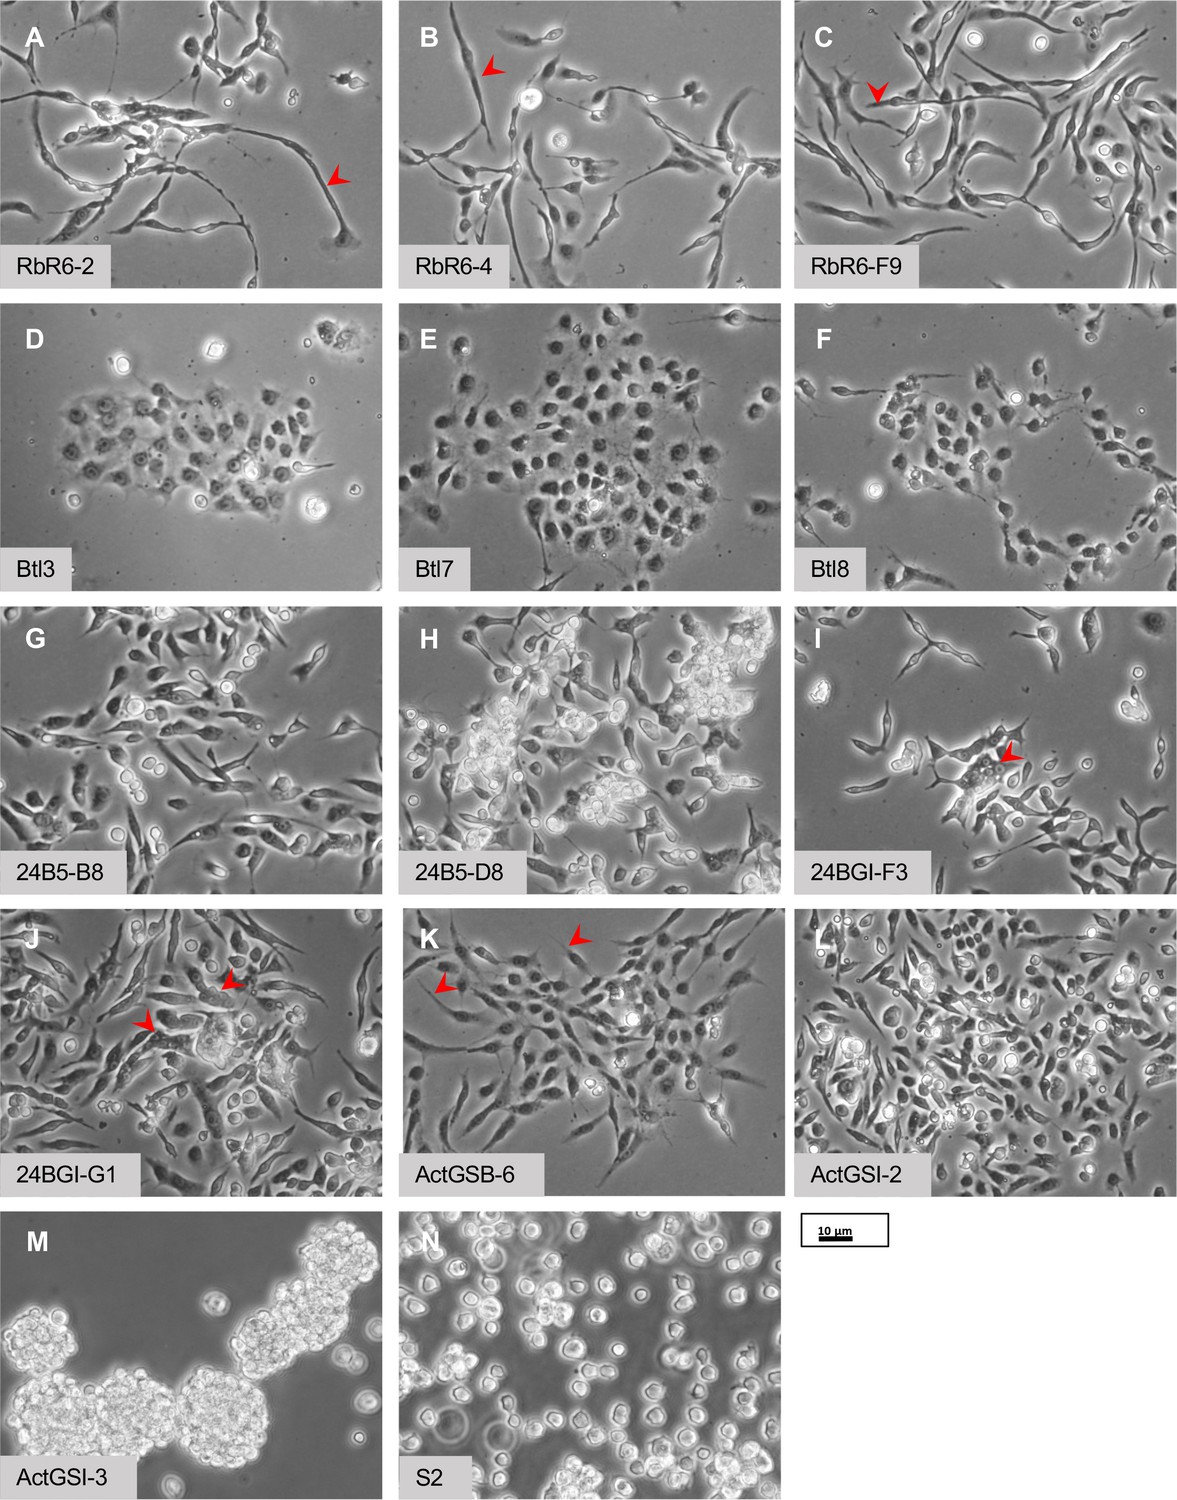
Morphology of cells.
(A–C) Glial-lineage clones. The cells have an elongated morphology with variable lengths from approximately 20 to >50 µm (red arrowheads). (D–F) Tracheal-lineage cells. Btl3 and Btl7 cells form squamous epithelial sheets. Btl8 are closely associated but do not abut each other to form a sheet. (G–J) Mesodermal-lineage cells. The cells have a bipolar morphology. Multinucleate cells are frequently found in 24BGI-F3 and 24BG1-GI clones (red arrowheads). (K, L) Neuronal-like clones. ActGSB-6 cells are mainly bipolar; however, some have asymmetric processes or thin processes (red arrowheads). ActGSI-2 are bipolar. (M) Hemocyte-like clone ActGSI-3. The cells form floating clusters that increase in cell number as they proliferate. Individual cells have a round morphology. (N) Schneider’s S2 cells. The cells are thought to be of hemocyte type and grow as single round cells in suspension. Scale bar = 10 µm.
Figure 2 with 3 supplements
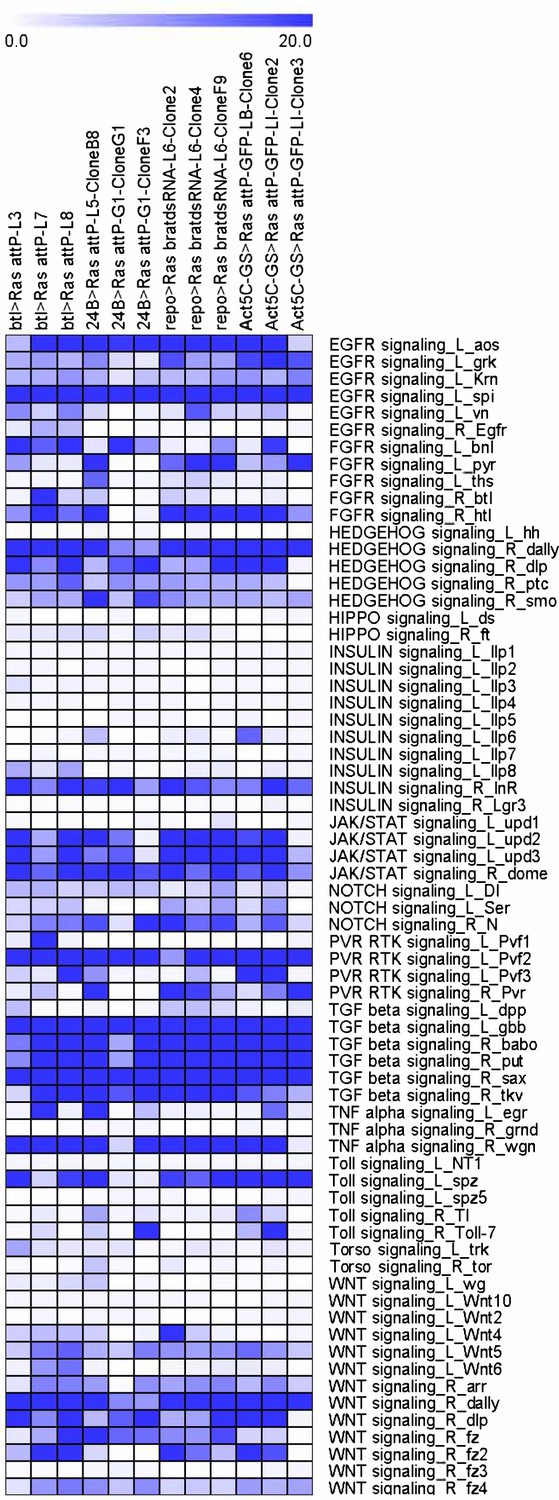
Expression levels of ligands and receptors for major signaling pathways.
The ligand and receptor annotation for major signaling pathways was obtained from FlyPhoneDB (https://www.flyrnai.org/tools/fly_phone/web/). The expression levels of ligands and receptors are represented as a heatmap of FPKM values.
Figure 2—figure supplement 1

Comparison of lineage-restricted Ras cell lines with previously isolated Drosophila cell lines.
RNAseq data for the cells described in this work were compared with RNAseq datasets determined previously for 24 other Drosophila cell lines (Cherbas et al., 2011) by clustering analysis using Pearson correlation coefficient scores. A matrix of Pearson correlation scores shown. On the heatmap key (right-hand side), a value of 1 indicates complete correlation; 0 indicates no correlation; −1 indicates complete anti-correlation.
Figure 2—figure supplement 2

Principal component analysis (PCA) of RNAseq data from the lineage-restricted Ras cell lines.
The RNAseq datasets for all cell lines were aligned to the Drosophila genome (r6.48) using STAR. The PCA plot was generated using heatmaply. As expected, cells derived using the same GAL4 driver tend to cluster with one another.
Figure 2—figure supplement 3

Relative expression of transcription factors associated in the literature with specific tissue lineages in the lineage-restricted Ras cell lines.
The set of tissue-specific transcription factors were selected manually from the literature. The fold change in gene expression levels for each cell line as compared to all other cell lines derived using different drivers were calculated using DESeq2 and fold change values are visualized on the heatmap.
Figure 3 with 3 supplements
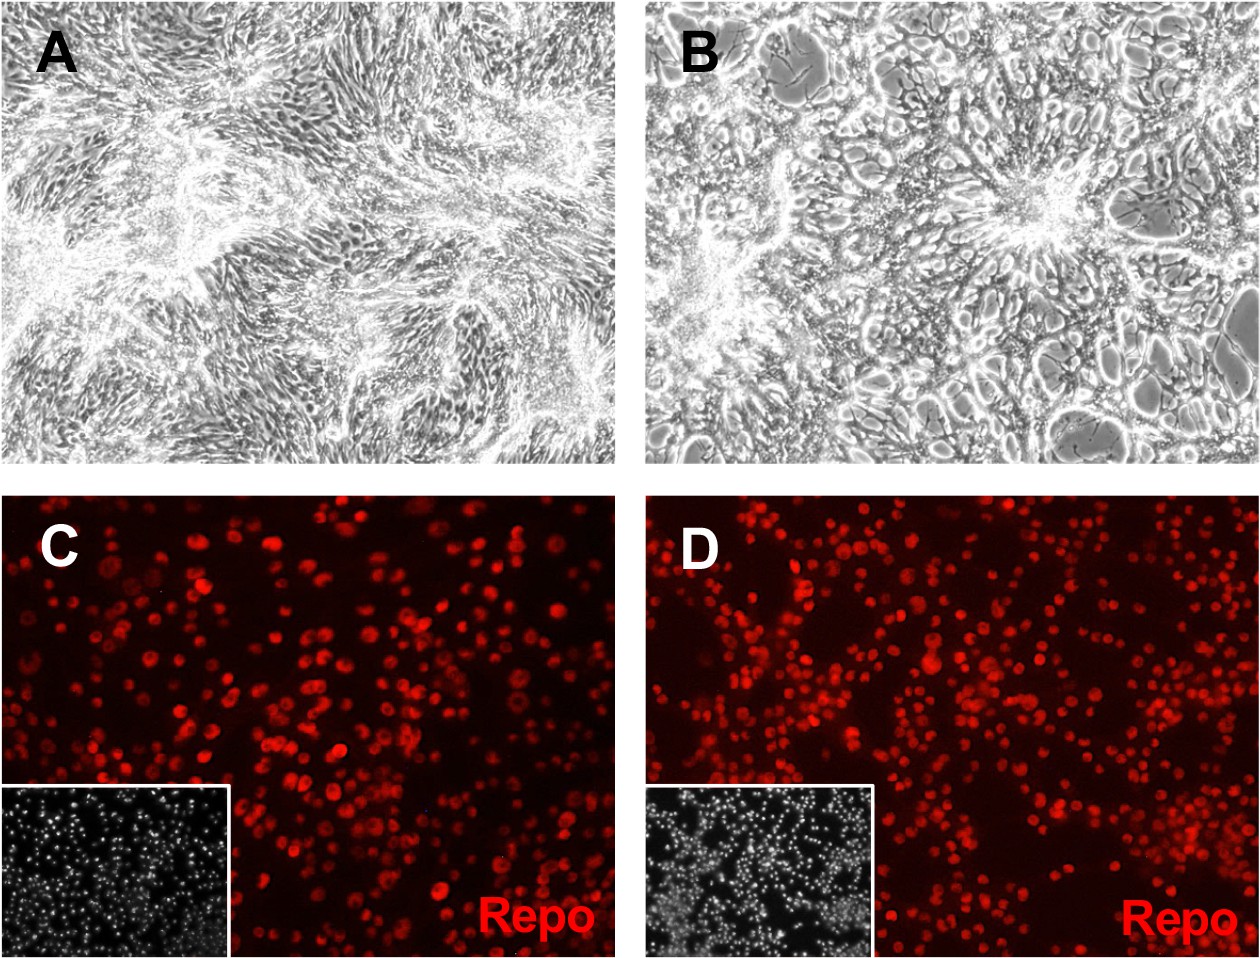
Glial clone Rbr6-2 cells express Repo.
Cells were grown in plain medium (A, C) or treated with ecdysone (B, D). (A, B) After ecdysone treatment, cells make a lace-like network. (C, D) Cells express Repo with or without ecdysone treatment. Inset: DAPI (4′,6-diamidino-2-phenylindole), DNA.
Figure 3—figure supplement 1

Marker gene expression in glial-lineage clones.
Clones were derived from parental line Repo-Gal4; RasV12; bratdsRNA Line 6. For each clone, a phase image and marker gene expression are shown. Inset: DAPI, DNA.
Figure 3—figure supplement 2

Glial cell morphology with and without ecdysone treatment.
Control: A, C. Ecdysone: B, D, cells are shown on day 4, 1 day after ecdysone-treated cells have received two doses of ecdysone separated by 1 day. (A, B) Glial clone RBr6-4. After ecdysone treatment, cells make a lacelike network. (C, D) Glial clone Rbr6-F9. After ecdysone treatment, cells appear similar to control cells.
Figure 3—figure supplement 3

Gross karyotypes of glial cell clones.
All have similar diploid karyotypes. (A) RbR6-2 is diploid XY. (B) RbR6-4 is diploid XY. (C) RbR6-F9 is diploid XY. n is number of mitotic spreads scored.
Figure 4 with 3 supplements
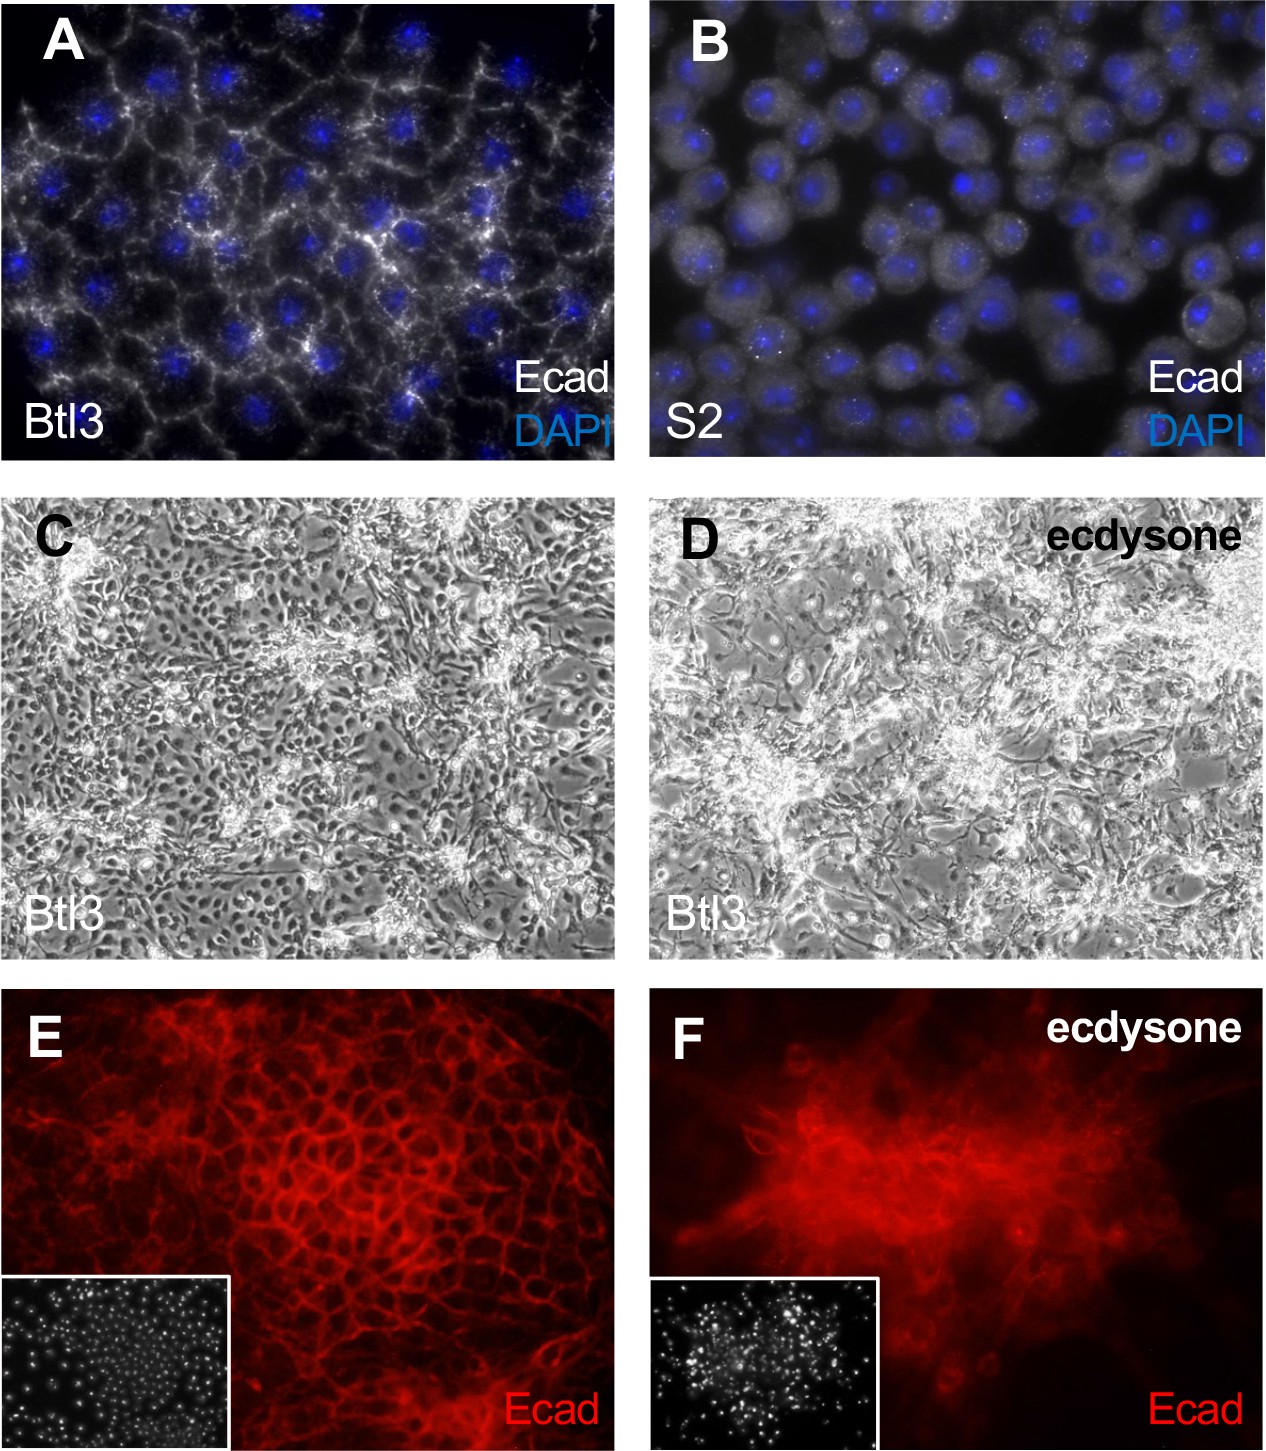
Tracheal-lineage cells of line Btl3 express the epithelial cadherin Ecad/Shotgun.
All panels show Btl3 cells except (B) that shows S2 cells. Cells were grown in plain medium (A–C, E) or treated with ecdysone (D, F). (A) Btl3 cells form a squamous epithelial sheet and express Ecad/Shotgun at cell peripheries. (B) S2 cells grow as single cells and Ecad expression is diffuse. (C) Btl3 cells form a sheet with small cell clusters and expressed Ecad at the cell boundaries (E). (D) Ecdysone-treated cells form large multicellular clusters that expressed Ecad (F). Insets in E and F show nuclei with DAPI.
Figure 4—figure supplement 1

Marker gene expression in tracheal-lineage lines.
For each line, a phase image and marker gene expression are shown. Inset: DAPI, DNA.
Figure 4—figure supplement 2

Morphology of tracheal epithelial parental lines after ecdysone treatment.
Control: A, C. Ecdysone: B, D. (A, B) Epithelial parental line Btl7. After ecdysone treatment, cells form clusters that extend vertically. (C, D) Epithelial parental line Btl8. There is extensive cell death after ecdysone treatment, suggesting some cells may be of embryonic origin.
Figure 4—figure supplement 3

Gross karyotypes of tracheal epithelial parental cell lines.
(A) Btl3 is haplo-4, XY. (B) Btl7 may be a tetraploid derivative with six copies pf chromosome 4, and two X chromosomes. (C) Btl8 may be a tetraploid derivative with three copies of chromosome 4 and two X chromosomes. Chromosomes were assigned to a number based on gross morphology. Those with a clear abnormality are indicated (ab). n is number of mitotic spreads scored.
Figure 5 with 5 supplements
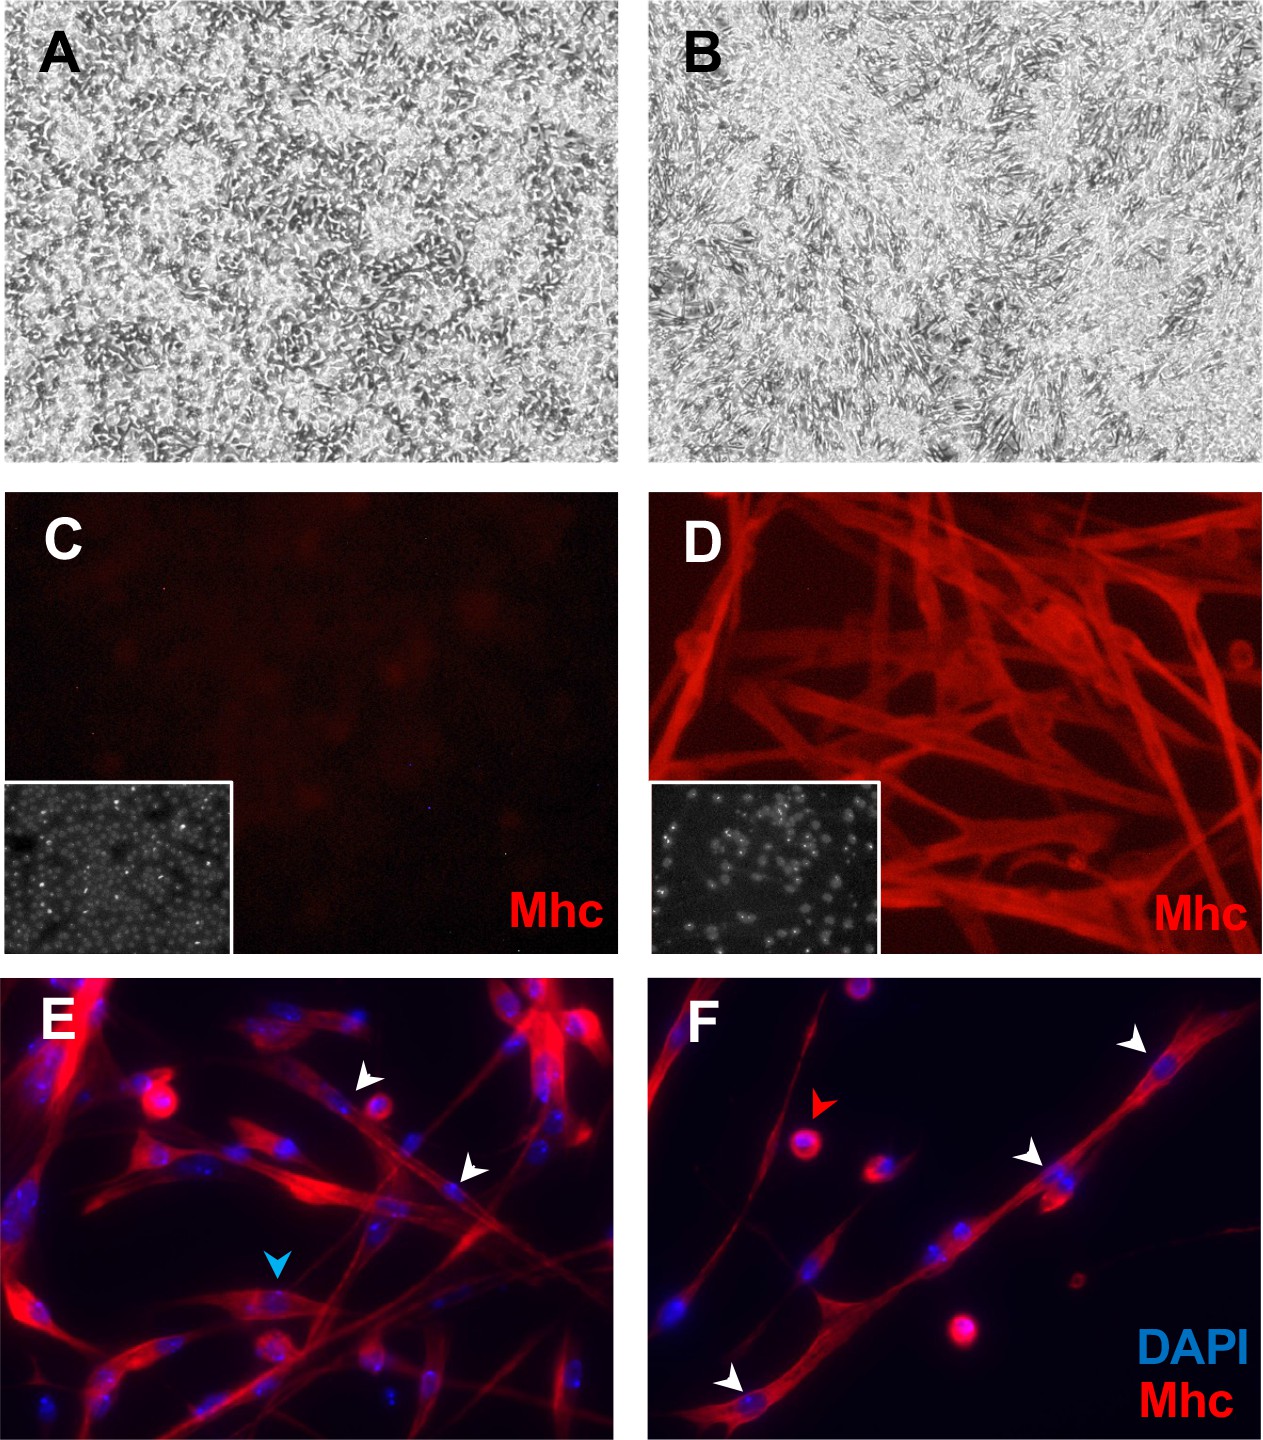
Mesodermal-lineage cells of Clone 24B5-B8 express Myosin heavy chain after differentiation.
Cells were grown in plain medium (A, C) or treated with ecdysone (B, D–F). (A) Cells have a bipolar shape. (B) Ecdysone-treated cells elongate and contract. (C) Control cells do not express Mhc. (D) Ecdysone-treated cells express the muscle marker Mhc. Inset: DAPI, DNA. (E, F) Differentiated 24B5-B8 fuse to form muscle fibers that contain multiple nuclei (white arrowheads), some differentiate without fusing with other cells and have single nucleus (blue arrowhead), and some fail to differentiate and remain spherical with a single nucleus (red arrowhead).
Figure 5—figure supplement 1

Marker gene expression in mesodermal-lineage clones.
For each clone, a phase image and marker gene expression are shown. Inset: DAPI, DNA.
Figure 5—figure supplement 2

Immunostaining of mesodermal-lineage cells for Myosin heavy chain.
(A, C, E, G) Control. (B, D, F, H) Ecdysone. (A, B) Cells of parental line 24BG1 express Mhc after ecdysone treatment at passage 16. (C, D) Rare cells of parental line 24BG1 express Mhc after ecdysone treatment at passage 115. (E, F). Cells of clonal line 24BG1-F3 do not express Mhc after ecdysone treatment. (G, H) Cells of clonal line 24BG1-G1 do not express Mhc after ecdysone treatment. All panels stained for Mhc. Inset: DAPI, DNA.
Figure 5—figure supplement 3

Mesodermal cells showed altered morphology after ecdysone treatment.
Control A, C, E. Ecdysone B, D, F. (A, B) Mesodermal clonal line 24B5-D8. After ecdysone treatment cells elongate and begin contraction. (C, D) Mesodermal clonal line 24G1-G1. After ecdysone treatment, cells aggregate, however there is no contraction. (E, F) Mesodermal clonal line 24G1-F3. After ecdysone treatment, cells aggregate, however there is no contraction.
Figure 5—figure supplement 4

Mef2-Gal4; UAS-GFP; UAS-RasV12 cultures.
(A, B) Primary culture on day 7. GFP-positive cells were amorphous and failed to attach. Attached muscle cells did not show detectable GFP expression (arrowheads). (C, D) Amorphous cells remain strongly GFP-positive and attached muscle cells were weakly GFP positive (arrowheads). (E) Muscles of control larva (Mef2-Gal4/+; UAS-GFP/+) were well ordered (inset shows pupa). (F) Muscles of RasV12-expressing larva (Mef2-Gal4/+; UAS-GFP/UAS-RasV12) were small and fragmented (inset shows pupa with a Tubby-like phenotype). (G–J) Passages were attempted with two primary cultures that had a few proliferating patches. None gave rise to continuous lines. (G, H) Passage 1 on day 5. The proliferating patch was GFP negative. (I, J) Passage 1 on day 5. The cells, including some that were GFP positive, were unhealthy and did not continue proliferating.
Figure 5—figure supplement 5

Gross karyotypes of mesodermal cell clones.
(A) 24B5-B8 is triploid for chromosomes 2 and 3, has two abnormal chromosomes (ab), a variable number of copies of chromosome 4 (83% have 4, 5, or 6), and is XXY. (B) 24B5-D8 is triploid for chromosomes 2 and 3, has two abnormal chromosomes (ab), a variable number of copies of chromosome 4 (82% have 5), and is XX. (C) 24BGI-F3 is diploid XY with rare cells having only one chromosome 4. (D) 24BGI-G1 is diploid XY with rare cells having only one chromosome 4. Chromosomes were assigned to a number based on gross morphology. Those with a clear abnormality are indicated (ab). Variable numbers of chromosome 4 could be a result of loss of the smallest chromosomes during preparation of the slides. n is number of mitotic spreads scored.
Figure 6 with 4 supplements
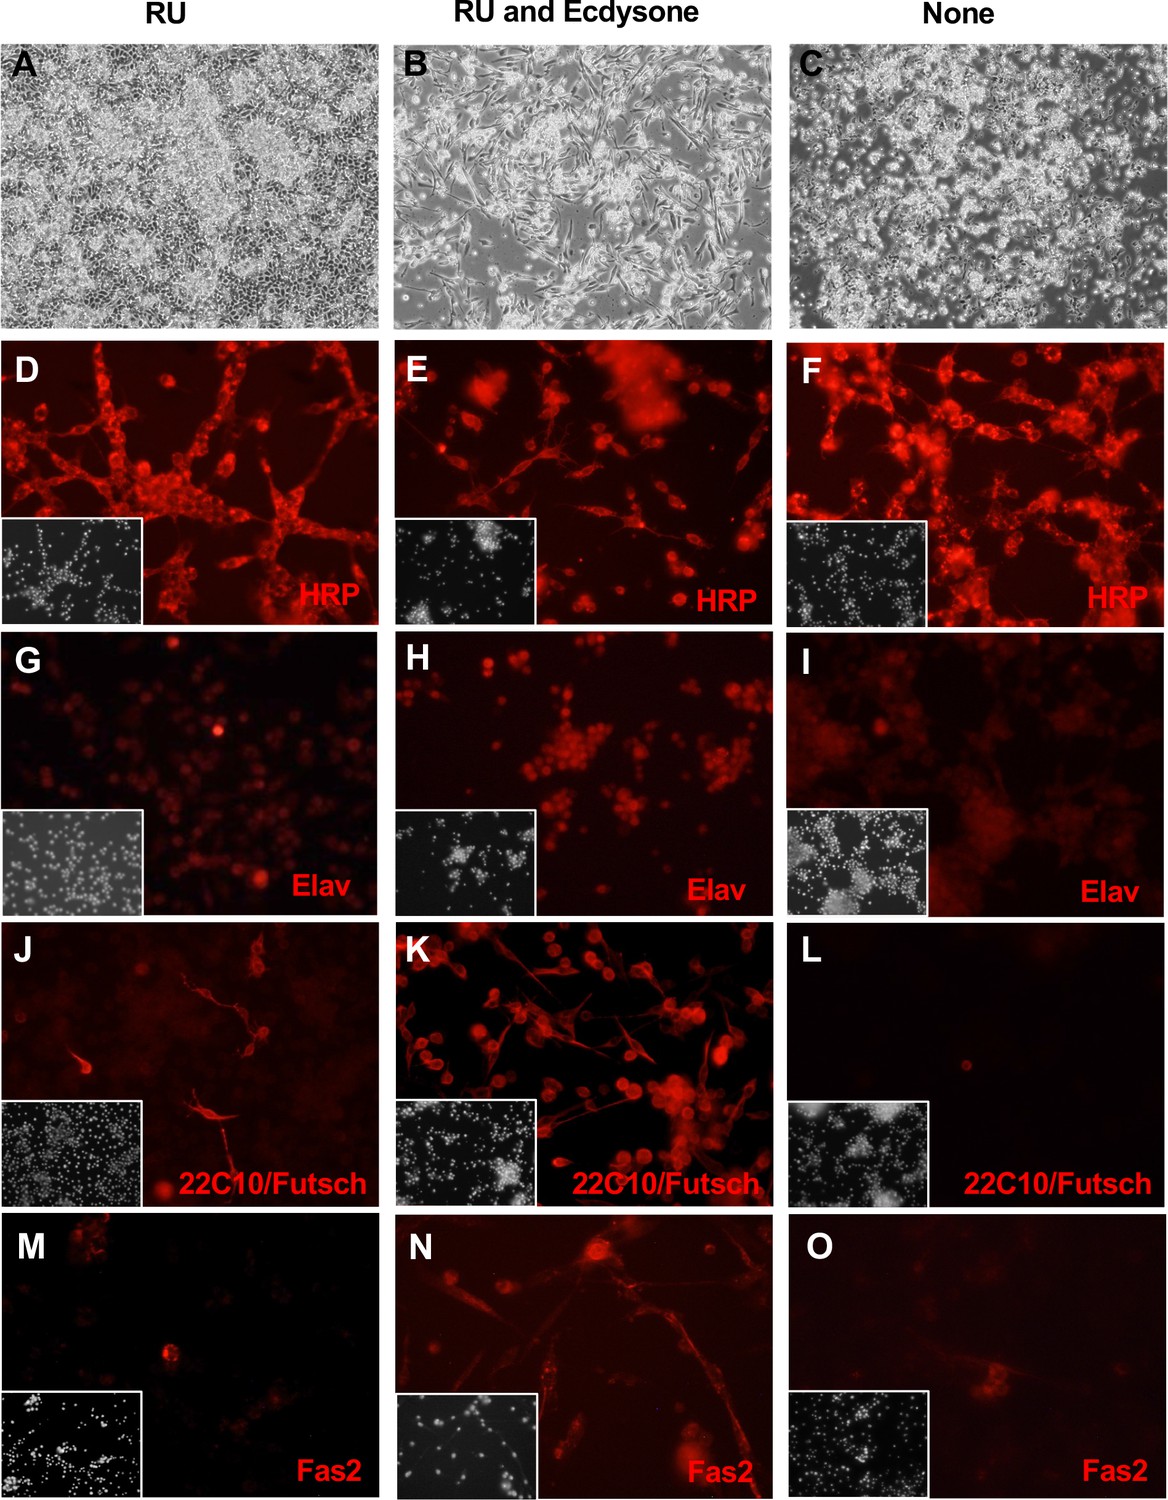
Neuronal-like clone ActGSI-2 expresses neuronal markers.
ActGSI-2 cells were grown in three conditions: RU486 (A, D, G, J, M); RU486 and ecdysone (B, E, H, K, N), or with no additives (C, F, I, L, O). RU486/mifepristone is required for GeneSwtch-Gal4 activation, transgene expression, and cell proliferation. (A) In the growing condition, cells reach confluence and continue to grow by piling up. (B) After ecdysone treatment cells elongated and developed axonal-like outgrowths. (C) In the quiescent state (no RU), cells do not proliferate and fail to reach confluence. (D–F) Cells in all conditions are positive for HRP. (G–I) Expression of Elav, is elevated after ecdysone treatment (H). (J–L) Expression of Futsch/MAP1B-like protein (recognized by antibody 22C10) is elevated after ecdysone treatment (K). (M–O) Fas2 neural-adhesion protein. Cells show elevated expression after ecdysone treatment (N). Insets: DAPI, DNA.
Figure 6—figure supplement 1

elav-G4; UAS-GFP; UAS-RasV12 cultures.
(A, B) Primary culture on day 5. GFP-positive cells were neuronal cells. Clusters of cell bodies were connected by axons. (C, D) Primary culture on day 15. GFP-positive cells were found in amorphous white cell clusters. By this day, the health of the cells was deteriorating and passaging was attempted. (E, F) Passage 1 on day 5. The cells did not attach, and no further passages were possible.
Figure 6—figure supplement 2

Marker gene expression in neuronal-like clones.
For each clone, a phase image and marker gene expression are shown. Inset: DAPI, DNA. Note, the UAS-GFP transgene is not expressed in clone B6.
Figure 6—figure supplement 3

Neuronal-like clone ActGSB-6.
Cells were grown in three conditions: RU486 (A, D, G, J, M); RU486 and ecdysone (B, E, H, K, N), or with no additives (C, F, I, L, O). RU486/mifepristone is required for GeneSwitch-Gal4 activation, UAS-RasV12 expression, and cell proliferation. (A) In the growing condition, cells form a sheet, and some cell piles are seen. (B) After ecdysone treatment cells aggregate and form processes. (C) In the quiescent state (no RU), cells cease proliferation and do not reach confluence. (D–F) HRP (pan-neural marker). Cells in all conditions are positive for HRP. (G–I) Elav (post-mitotic neurons). Elav is elevated after ecdysone treatment (H). (J–L) 22C10/Futsch (neuronal morphology). Cells show elevated expression after ecdysone treatment (K). (M–O) Fas2 (neural-adhesion protein). Cells show elevated expression after ecdysone treatment (N). Note the UASGFP transgene is not expressed in ActGSB-6 cells. Insets: DAPI, DNA.
Figure 6—figure supplement 4

Gross karyotypes of neuronal-like cell clones.
(A) ActGSB-6 is XO. (B) ActGSI-2 is diploid XX. Chromosomes were assigned to a number based on gross morphology. Those with a clear abnormality are indicated (ab). n is number of mitotic spreads scored.
Figure 7 with 2 supplements
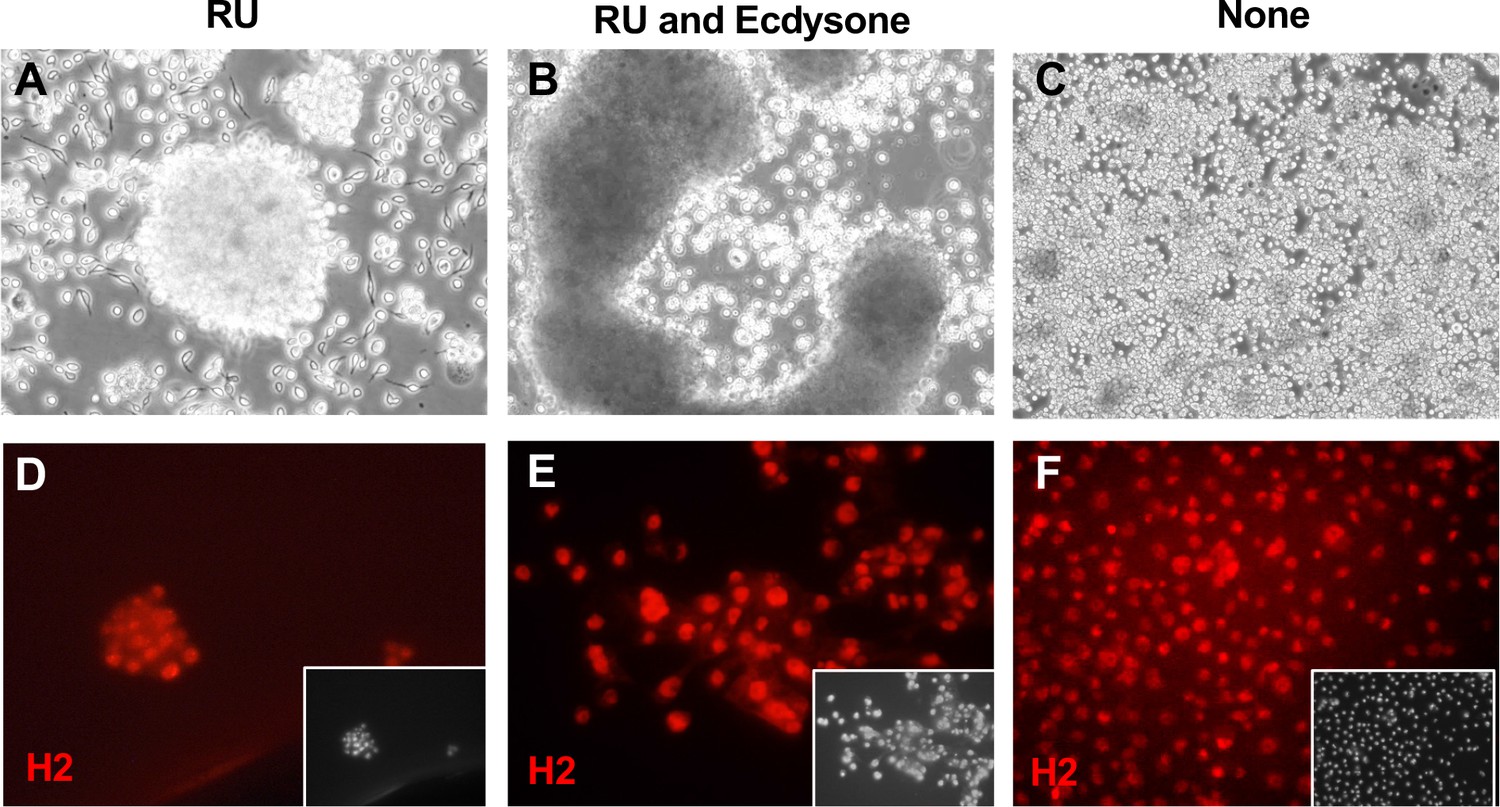
Hemocyte-like Clone ActGSI-3 morphology and marker expression.
Cells were grown in three conditions: RU486 (A, D); RU486 and ecdysone (B, E), or with no additives (C, F). (A) In the growing condition, cells formed floating clusters of multiple cells. (B) After ecdysone treatment cells formed large aggregates and there was cell lysis. (C) In the quiescent state (no RU), individual round cells are seen. (D–F) Cells in all conditions express the hemocyte cell marker Hemese, as recognized by the antibody H2. Inset: DAPI, DNA.
Figure 7—figure supplement 1

Marker gene expression in hemocyte-like clone.
A phase image and marker gene expression are shown. Inset: DAPI, DNA.
Figure 7—figure supplement 2

Gross karyotypes of hemocyte cell clone.
(A) ActGSI-3 may be a tetraploid derivative with variable numbers of copies of chromosome 4 (80% have 4) and XX. The three abnormal chromosomes (ab) maybe derived from chromosome 3 (two fragments, 3r) and chromosome 2 (2r). Chromosomes were assigned to a number based on gross morphology. Those with a clear abnormality are indicated (ab). Those that may represent a rearranged chromosome are indicated (r). Variable numbers of chromosome 4 could be a result of loss of the smallest chromosomes during preparation of the slides. n is number of mitotic spreads scored.
Figure 8 with 1 supplement
Morphology of confluent cultures.
(A–C) Glial-lineage clones. The cells grow in dense sheets and ridges with swirl patterns. (D–F) Tracheal-lineage cells. Btl3 and Btl7 cells form squamous epithelial sheets with raised clusters of cells. Btl8 grow densely however individual cells remain separate. (G–J) Mesodermal-lineage cells. The cells grow densely, and form raised clusters. (K, L) Neuronal-like clones. ActGSB-6 cells grow densely and form peaks and valleys. ActGSI-2 cells grow densely with scattered raised clusters. (M) Hemocyte-like clone ActGSI-3. The cells form floating clusters that coalesce into large cell rafts. (N) Schneider’s S2 cells. The cells grow to high density in suspension. Scale bar = 200 µm.
Figure 8—figure supplement 1

Growth curves.
The cells were seeded in triplicate at 150,000 cells (A–C), 100,000 cells (D), or 200,000 cells (E) in 12-well plates and counted on days 3, 6, and 9. (A) Glial-lineage clones Rbr6-2, Rbr6-4, and Rbr6-F9. (B) Tracheal epithelium lineage parental lines Btl3, Btl7, and Btl8. (C) Mesodermal-lineage clones 24B5-B8, 24B5-D8, 24BG1-F3, and 24BG1-G1. (D) Neuronal-like clones Act5GSI-2 and ActGSB-6. (E) Hemocyte-like clone ActGSI-3. RU−, no drug added (Ras-OFF); RU+, RU486/mifepristone added (Ras-ON).
Videos
Video 1
24B-Gal4B5-B8 cells contract spontaneously after differentiation with ecdysone.
Video 2
24B-Gal4B5-B8 cells contract spontaneously after differentiation with ecdysone.
Video 3
24B-Gal4GI cells contract spontaneously after differentiation with ecdysone.
Time-lapse video, view looping.
Video 4
24B-Gal4GI cells contract spontaneously after differentiation with ecdysone.
Time-lapse video, view looping.
Tables
Table 1
Cell lines analyzed.
| Tissue-type alignment | Genotype | Lines analyzed* | DGRC stock name and number | RRID |
|---|---|---|---|---|
| Glial | Repo-Gal4; RasV12; bratdsRNA | Rbr6 (parental) Rbr6-2 Rbr6-4 Rbr6-F9 | repo>Ras bratdsRNA-L6, 282 repo>Ras bratdsRNA-L6-Clone2, 326 repo>Ras bratdsRNA-L6-Clone4, 327 repo>Ras bratdsRNA-L6-CloneF9, 328 | RRID:CVCL_XF57 RRID:CVCL_C7G9 RRID:CVCL_C7GA RRID:CVCL_C7GB |
| Epithelial | btl-Gal4; UAS-P35; UAS-RasV12 | Btl3 (parental) | btl>Ras attP-L3, 332 | RRID:CVCL_B3N7 |
| btl-Gal4; UAS-P35; attP, UAS-RasV12 | Btl7 (parental) Btl8 (parental) | btl>Ras attP-L7, 285 btl>Ras attP-L8, 286 | RRID:CVCL_XF53 RRID:CVCL_XF54 | |
| Muscle | 24B-Gal4; attP, UAS-RasV12 | 24B5 (parental) 24B5-B8 24B5-D8 | 24B>Ras attP-L5, 284 24B>Ras attP-L5-CloneB8, 323 | RRID:CVCL_XF52 RRID:CVCL_C7G6 |
| 24B-Gal4; UAS-GFP; attP, UAS-RasV12 | 24BG1 (parental) 24BG1-F3† 24BG1-G1† | 24B>Ras attP GFP-L1, 283 24B>Ras attP-G1-CloneF3, 325 24B>Ras attP-G1-CloneG1, 324 | RRID:CVCL_XF51 RRID:CVCL_C7G8 RRID:CVCL_C7G7 | |
| Neuronal | Act5C-GeneSwitch-Gal4; UAS-GFP; attP, UAS-RasV12 | ActGSB-6‡ ActGSI-2 | Act5C-GS>Ras attP-LB-Clone6, 329 Act5C-GS>Ras attP-GFP-LI-Clone2, 330 | RRID:CVCL_C7GC RRID:CVCL_C7GD |
| Blood | Act5C-GeneSwitch-Gal4; UAS-GFP; attP, UAS-RasV12 | ActGSI-3 | Act5C-GS>Ras attP-GFP-LI-Clone3, 331 | RRID:CVCL_C7GE |
-
*
Clones unless indicated.
-
†
Do not differentiate into active muscle.
-
‡
These cells do not express GFP, the reason for this is not known.
Table 2
RNAseq data analysis.
| Tissue type | Cell line | Cell cluster scRNAseq | Enrichment p value scRNAseq | scRNAseq dataset | Cell type based on in situ data | Enrichment p value in situ |
|---|---|---|---|---|---|---|
| Glial | Rbr6-2 | Adult reticular neuropil-associated glial cell | 8.13E−05 | Whole body | Glia | 4.84E−05 |
| Rbr6-4 | Cell body glial cell | 7.56E−04 | Whole body | |||
| Rbr6-F9 | Adult glial cell | 8.13E−05 | Whole body | Glia | 3.42E−02 | |
| Epithelial | Btl3 | Adult tracheal cell | 2.61E−06 | Whole body | Tracheal | 1.08E−01 |
| Btl7 | Adult tracheal cell | 8.81E−04 | Oenocyte | |||
| Btl8 | Adult tracheal cell | 2.72E−02 | Body | Tracheal | 2.05E−02 | |
| Muscle | 24B5-B8 | Muscle cell | 2.93E−6 | Male reprod glands | ||
| 24BG1-F3 | Muscle cell | 1.66E−04 | Antenna | |||
| 24BG1-G1 | Muscle | 8.83E−02 | ||||
| Neuronal | ActGSI-2 | leg muscle motor neuron system | 5.79E−03 | Whole body | Neuron | 6.68E−02 |
| ActGSB-6 | adult ventral nervous | 7.56E−04 | Whole body | Neuron | 5.71E−02 | |
| Blood | ActGSI-3 | hemocyte | 1.00E−25 | Whole body | Circulatory system | 1.29E−01 |
-
Analysis using the Drosophila RNAi Screening Center’s single-cell DataBase (DRscDB), all datasets used are from FCA 10x Sequencing (https://flycellatlas.org/). The in situ data were from the BDGP (https://insitu.fruitfly.org/cgi-bin/ex/insitu.pl) and the enrichment p value was calculated by a hypergeometric test.
Table 3
Confluent density, growth, karyotype, and transfection efficiency of cell lines.
| Tissue type | Line | Confluent density (×106)* | Doubling time (hr) | Karyotype | Transfection efficiency (%) |
|---|---|---|---|---|---|
| Glial | Rbr6-2 | 1.8 | 20 | 8, XY | 24 |
| Rbr6-4 | 2.4 | 20 | 8, XY | 28 | |
| Rbr6-F9 | 3.4 | 19 | 8, XY | 22 | |
| Epithelial | Btl3 | 3.7 | 33 | 7, XY, –4 | 26 |
| Btl7 | 2.6 | 37 | Abnormal tetraploid, XX, variable 4 | 34 | |
| Btl8 | 2.7 | 22 | Abnormal tetraploid, XX, –4 | 16 | |
| Mesodermal | 24B5-B8 | 1.4 | 29 | Abnormal tetraploid, XXY, variable 4 | 23 |
| 24B5-D8 | 5.1 | 23 | Abnormal tetraploid, XX, variable 4 | 27 | |
| 24BG1-G1 | 2.8 | 21 | 8, XY (some –4) | ND | |
| 24BG1-F3 | 2.7 | 35 | 8, XY (some –4) | ND | |
| Neuronal | ActGSB-6 | 2.9 | 23 | 7, XO | 29 |
| ActGSI-2 | 8.1 | 27 | 8, XX | ND | |
| Blood | ActGSI-3 | 1.9 | 70 | Abnormal tetraploid, XX, variable 4 | ND |
| S2 | 6.2 | ND | ND | 53 |
-
*
Confluent density in one well of a 12-well plate, 3.5 cm2 surface area (average of three wells).
Appendix 1—key resources table
| Reagent type (species) or resource | Designation | Source or reference | Identifiers | Additional information |
|---|---|---|---|---|
| Genetic reagent (D. melanogaster) | 24B/how-Gal4 | Bloomington Drosophila Stock Center | Stock # 1767; FLYB:FBti0150063; RRID:BDSC_1767 | FlyBase symbol: P(w[+mW.hs]=GawB)how[24B] |
| Genetic reagent (D. melanogaster) | repo-Gal4 | Bloomington Drosophila Stock Center | Stock # 7415; FLYB:FBti0018692; RRID:BDSC_7415 | FlyBase symbol: P(GAL4)repo |
| Genetic reagent (D. melanogaster) | btl-Gal4 | Bloomington Drosophila Stock Center | Stock # 78328; FLYB:FBti019793; RRID:BDSC_78328 | FlyBase symbol: P(GAL4-btl.S)3–2 |
| Genetic reagent (D. melanogaster) | Act5C-GeneSwitch-Gal4 | Bloomington Drosophila Stock Center | Stock # 9431; FLYB:FBti0003040,FBti0076553; RRID:BDSC_9431 | FlyBase symbol: P(UAS-GFP.S65T)Myo31DF[T2]; P(Act5C(-FRT)GAL4.Switch.PR)3 |
| Genetic reagent (D. melanogaster) | UAS-RasV12 (3) | Bloomington Drosophila Stock Center | Stock # 64195; FLYB:FBti0012505; RRID:BDSC_64195 | FlyBase symbol: P(w[+mC]=UAS-Ras85D.V12)TL1 |
| Genetic reagent (D. melanogaster) | UAS-RasV12 (2) | Bloomington Drosophila Stock Center | Stock # 64196; FLYB:FBti0180323; RRID:BDSC_64196 | FlyBase symbol: P(w[+mC]=UAS-Ras85D.V12)2 |
| Genetic reagent (D. melanogaster) | UAS-RasV12 with RMCE site (3) | Bloomington Drosophila Stock Center | Stock # 64197; FLYB: FBti0012505, FBti0102080; RRID:BDSC_64197 | FlyBase symbol: P(w[+mC]=UAS-Ras85D.V12)TL1, P(w[+mC]=attP.w[+].attP)JB89B |
| Genetic reagent (D. melanogaster) | UAS-GFP nuclear | Bloomington Drosophila Stock Center | Stock # 4775; FLYB: FBti0012492; RRID:BDSC_4775 | FlyBase symbol: P(UAS-GFP.nls)14 |
| Genetic reagent (D. melanogaster) | bratdsRNA | Bloomington Drosophila Stock Center | Stock # 34646; FLYB:FBti0140815; RRID:BDSC_34646 | FlyBase symbol: P(y[+t7.7] v[+t1.8]=TRiP.HMS01121)attP2 |
| Genetic reagent (D. melanogaster) | UAS-p35 baculovirus death inhibitor | Bloomington Drosophila Stock Center | Stock # 5072; FLYB:FBti0012594; RRID:BDSC_5072 | FlyBase symbol: P(w[+mC]=UAS-p35.H)BH1 |
| Genetic reagent (D. melanogaster) | Gal80ts | Bloomington Drosophila Stock Center | Stock # 7019; FLYB:FBti0027796; RRID:BDSC_7019 | FlyBase symbol: P(w[+mC]=tubP-GAL80[ts])20 |
| Cell line (D. melanogaster) | S2 | Drosophila Genomics Resource Center | Stock # 181; FLYB:FBtc0000181; RRID:CVCL_Z992 | Cell line maintained in N. Perrimon lab; FlyBase symbol: S2-DRSC. |
| Cell line (D. melanogaster) | 24B5-B8 | Drosophila Genomics Resource Center | Stock # 323; RRID:CVCL_C7G6 | 24B>Ras attP-L5-CloneB8 |
| Cell line (D. melanogaster) | 24BG1-G1 | Drosophila Genomics Resource Center | Stock # 324; RRID:CVCL_C7G7 | 24B>Ras attP-G1-CloneG1 |
| Cell line (D. melanogaster) | 24BG1-F3 | Drosophila Genomics Resource Center | Stock # 325; RRID:CVCL_C7G8 | 24B>Ras attP-G1-CloneF3 |
| Cell line (D. melanogaster) | Rbr6-2 | Drosophila Genomics Resource Center | Stock # 326; RRID:CVCL_C7G9 | repo>Ras bratdsRNA-L6-Clone2 |
| Cell line (D. melanogaster) | Rbr6-4 | Drosophila Genomics Resource Center | Stock # 327; RRID:CVCL_C7GA | repo>Ras bratdsRNA-L6-Clone4 |
| Cell line (D. melanogaster) | Rbr6-F9 | Drosophila Genomics Resource Center | Stock # 328; RRID:CVCL_C7GB | repo>Ras bratdsRNA-L6-CloneF9 |
| Cell line (D. melanogaster) | ActGSI-2 | Drosophila Genomics Resource Center | Stock # 329; RRID:CVCL_C7GC | Act5C-GS>Ras attP-LB-Clone6 |
| Cell line (D. melanogaster) | ActGSI-2 | Drosophila Genomics Resource Center | Stock # 330; RRID:CVCL_C7GD | Act5C-GS>Ras attP-GFP-LI-Clone2 |
| Cell line (D. melanogaster) | ActGSI-3 | Drosophila Genomics Resource Center | Stock # 331; RRID:CVCL_C7GE | Act5C-GS>Ras attP-GFP-LI-Clone3 |
| Cell line (D. melanogaster) | Btl3 | Drosophila Genomics Resource Center | Stock # 332; RRID:CVCL_B3N7 | btl>Ras attP-L3 |
| Cell line (D. melanogaster) | OK6-3 | Drosophila Genomics Resource Center | Stock # 281; RRID:CVCL_XF56 | OK6>Ras attP-L3 |
| Cell line (D. melanogaster) | Rbr6 | Drosophila Genomics Resource Center | Stock # 282; RRID:CVCL_XF57 | repo>Ras bratdsRNA-L6 |
| Cell line (D. melanogaster) | 24BG1 | Drosophila Genomics Resource Center | Stock # 283; RRID:CVCL_XF51 | 24B>Ras attP GFP-L1 |
| Cell line (D. melanogaster) | 24B5 | Drosophila Genomics Resource Center | Stock # 284; RRID:CVCL_XF52 | 24B>Ras attP-L5 |
| Cell line (D. melanogaster) | Btl7 | Drosophila Genomics Resource Center | Stock # 285; RRID:CVCL_XF53 | btl>Ras attP-L7 |
| Cell line (D. melanogaster) | Btl8 | Drosophila Genomics Resource Center | Stock # 286; RRID:CVCL_XF54 | btl>Ras attP-L8 |
| Cell line (D. melanogaster) | OK6-2 | Drosophila Genomics Resource Center | Stock # 287; RRID:CVCL_XF55 | OK6>Ras attP-L2 |
| cell line (E. coli) | DH5-alpha | Thermo Fisher | Cat. # 18265017 | Subcloning efficiency DH5-alpha competent cells |
| Transfected construct (D. melanogaster) | pAc5.1B-EGFP | Addgene | Cat. # 21181; http://n2t.net/addgene:21181; RRID:Addgene_21181 | pAc5.1B-EGFP was a gift from Elisa Izaurralde |
| Transfected construct (D. melanogaster) | pCoPURO | Addgene | Cat. # 17533; http://n2t.net/addgene:17533; RRID:Addgene_17533 | pCoPURO was a gift from Francis Castellino |
| Antibody | AffiniPure Rabbit Anti-Horseradish Peroxidase (Rabbit polyclonal) | Jackson ImmunoResearch | Cat. # 323-005-021; RRID: AB_2314648 | Rabbit polyclonal; IF (1:500) |
| Antibody | 22C10 (mouse monoclonal) | Developmental Studies Hybridoma Bank | Cat. # 22C10 RRID: AB_528403. FBgn0259108 | 22C10 was deposited to the DSHB by Benzer, S./Colley, N.; mouse monoclonal; IF (1:100) |
| Antibody | Rat-Elav-7E8A10 anti-elav (rat monoclonal) | Developmental Studies Hybridoma Bank | Cat. # Rat-Elav-7E8A10 anti-elav, RRID:AB_528218 | Rat-Elav-7E8A10 anti-elav was deposited to the DSHB by Rubin, G.M.; rat monoclonal; IF (1:100) |
| Antibody | 8D12 anti-Repo (mouse monoclonal) | Developmental Studies Hybridoma Bank | Cat. # 8D12 anti-Repo, RRID:AB_528448 | 8D12 anti-Repo was deposited to the DSHB by Goodman, C.; mouse monoclonal; IF (1:100) |
| Antibody | 1D4 anti-Fasciclin II (mouse monoclonal) | Developmental Studies Hybridoma Bank | Cat. # 1D4 anti-Fasciclin II, RRID:AB_528235 | 1D4 anti-Fasciclin II was deposited to the DSHB by Goodman, C.; mouse monoclonal; IF (1:100) |
| Antibody | Guinea pig anti-Twist (guinea pig polyclonal) | M.Levine, UC Berkeley, CA | A gift from M. Levine, UC Berkeley, CA; guinea pig polyclonal; IF (1:500) | |
| Antibody | 3E8-3D3 (mouse monoclonal) | Developmental Studies Hybridoma Bank | Cat. # 3E8-3D3, RRID:AB_2721944 | 3E8-3D3 was deposited to the DSHB by Saide, J.D.; mouse monoclonal; IF (1:100) |
| Antibody | DCAD2 (rat monoclonal) | Developmental Studies Hybridoma Bank | Cat. # DCAD2, RRID:AB_528120 | DCAD2 was deposited to the DSHB by Uemura, T.; rat, monoclonal; IF (1:100) |
| Antibody | Rabbit anti-DMef2 (rabbit polyclonal) | doi:10.1101/gad.9.6.730 | A gift from J. R. Jacobs; rabbit polyclonal; IF (1:500) | |
| Antibody | Mouse anti-H2 (mouse monoclonal) | doi:10.1073/pnas.0436940100 | Kurucz et al., 2003; IF (1:10) | |
| Antibody | Cy3 AffiniPure Goat Anti-Mouse IgG (H+L) (Goat polyclonal) | Jackson ImmunoResearch | Cat. # 115-165-003; RRID: AB_2338680 | Goat polyclonal; IF (1:1000) |
| Antibody | Cy3 AffiniPure Goat Anti-Rat IgG (H+L) (Goat polyclonal) | Jackson ImmunoResearch | Cat. # 112-165-003; RRID: AB_2338240 | Goat polyclonal; IF (1:1000) |
| Antibody | Cy3 AffiniPure Goat Anti-Guinea Pig IgG (H+L) (Goat polyclonal) | Jackson ImmunoResearch | Cat. # 106-165-003; RRID: AB_2337423 | Goat polyclonal; IF (1:1000) |
| Antibody | Cy3 AffiniPure Goat Anti-Rabbit IgG (H+L) (Goat polyclonal) | Jackson ImmunoResearch | Cat. # 111-165-045; RRID: AB_2338003 | Goat polyclonal; IF (1:1000) |
| Antibody | Donkey anti-Rabbit IgG (H+L) Highly Cross-Adsorbed Secondary Antibody, Alexa Fluor 488 (donkey polyclonal) | Thermo Fisher | Cat. # A-21206; RRID: AB_2535792 | Donkey polyclonal; IF (1:1000) |
| Commercial assay or kit | Effectene Transfection Reagent | QIAGEN | Cat. # 301425 | |
| Commercial assay or kit | NucleoSpin Plasmid Kit (No Lid) | Macherey-Nagel | Cat. # 740499.250 | |
| Commercial assay or kit | DNeasy Blood & Tissue Kit | QIAGEN | Cat. # 69504 | |
| Chemical compound, drug | KaryoMAX Colcemid Solution in PBS | Gibco Thermo Fisher | Cat. # 15212–012 | |
| Chemical compound, drug | Schneider′s Insect Medium | Sigma-Aldrich | Cat. # S0146 | |
| Chemical compound, drug | FBS | Gibco Thermo Fisher | Cat. # 26140–079 | |
| Chemical compound, drug | 0.05% Trypsin–EDTA (1×) | Gibco Thermo Fisher | Cat. # 25300–120 | |
| Chemical compound, drug | Penicillin–streptomycin (10,000 U/ml) | Gibco Thermo Fisher | Cat. # 15140122 | |
| Chemical compound, drug | Mifepristone | Invitrogen Thermo Fisher | Cat. # H11001 | |
| Chemical compound, drug | 20-Hydroxyecdysone | Sigma-Aldrich | Cat. # H5142 | |
| Chemical compound, drug | VECTASHIELD Antifade Mounting Medium With DAPI | Vector Laboratories | Cat. # H1200 | |
| Software, algorithm | GraphPad Prism version 9.5.1 | https://www.graphpad.com/ | RRID:SCR_002798 | |
| Software, algorithm | Fiji | doi:10.1038/nmeth.2019 | RRID:SCR_002285 |
Additional files
-
Supplementary file 1
Primary cultures and continuous lines produced from indicated genotypes.
Glial primary cultures grew well at first and could be passaged several times; however, only one continuous line was produced. This line was cloned using single-cell dilution to produce three clonal derivatives. Tracheal lines were produced readily. Cloning the parental lines was not successful with either single-cell dilution or puro selection. Mesodermal lines were produced using expression of RasV12 with 24B-Gal4 but not Mef2-Gal4. Cloning of the continuous lines was done using single-cell dilution. Neuronal. Expression of RasV12 with neuronal Gal4 drivers (elav-Gal4 or scratch-Gal4) did not give rise to continuous lines. Cloning of lines generated by broad expression of RasV12 with Act5C-GeneSwitch-Gal4 produced two clonal lines with neuronal characteristics and one with hemocyte characteristics. These were cloned using puro selection.
- https://cdn.elifesciences.org/articles/85814/elife-85814-supp1-v2.xlsx
-
Supplementary file 2
Analysis of marker gene expression in parental lines and clones.
Cell lines and their clonal derivatives were stained with antibodies against the indicated markers. The fraction of cells staining positive was determined. The intensity and cellular location of the signal are indicated in cases when there was variation. The clones and parental lines highlighted were analyzed by RNAseq.
- https://cdn.elifesciences.org/articles/85814/elife-85814-supp2-v2.xlsx
-
Supplementary file 3
Fragments Per Kilobase of transcript per Million mapped reads (FPKM).
FPKM values are shown for each of the clones and parental lines that were analyzed by RNAseq.
- https://cdn.elifesciences.org/articles/85814/elife-85814-supp3-v2.xlsx
-
MDAR checklist
- https://cdn.elifesciences.org/articles/85814/elife-85814-mdarchecklist1-v2.docx
Download links
A two-part list of links to download the article, or parts of the article, in various formats.
Downloads (link to download the article as PDF)
Open citations (links to open the citations from this article in various online reference manager services)
Cite this article (links to download the citations from this article in formats compatible with various reference manager tools)
Continuous muscle, glial, epithelial, neuronal, and hemocyte cell lines for Drosophila research
eLife 12:e85814.
https://doi.org/10.7554/eLife.85814


