Sterol derivative binding to the orthosteric site causes conformational changes in an invertebrate Cys-loop receptor
- Center for Structural Biology, Vlaams Instituut voor Biotechnologie, Belgium
- Structural Biology Brussels, Department of Bioengineering Sciences, Vrije Universiteit Brussel, Belgium
- Laboratory of Structural Neurobiology, Department of Cellular and Molecular Medicine, Katholieke Universiteit Leuven, Belgium
Figures
Figure 1 with 10 supplements
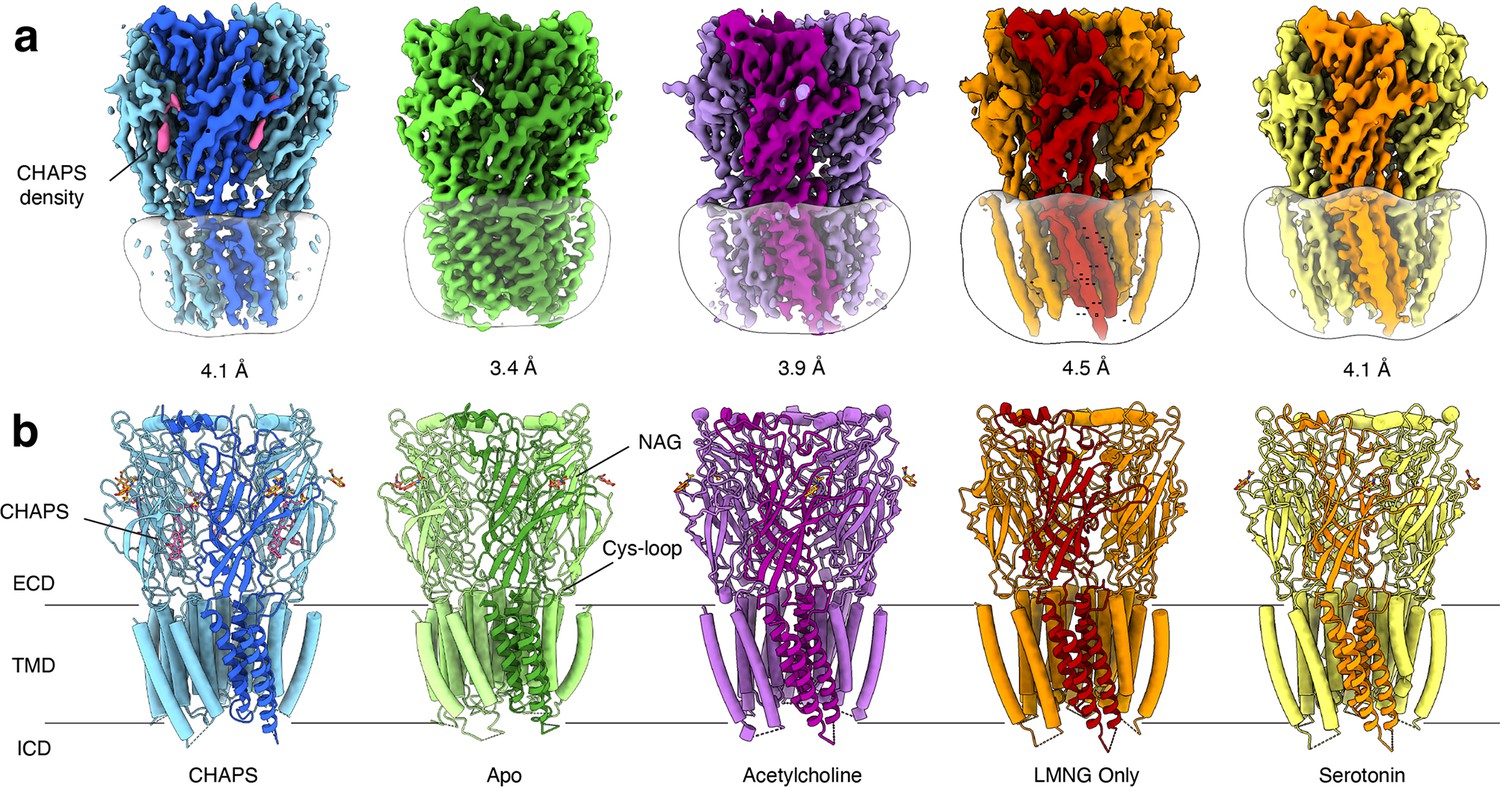
Overview of solved Alpo4 structures.
(a) Electron cryogenic microscopy (Cryo-EM) reconstruction of apo Alpo4CHAPS (blue), Alpo4APO (green), Alpo4ACH (purple), Alpo4APO_LMNG (orange), and Alpo4SER (yellow). The detergent micelle is shown in white surface representation. A monomer is shown in a darker shade. The density corresponding to bound CHAPS is shown in violet. (b) Side view of the atomic models shown in cartoon representation with NAG moieties shown as sticks. One subunit is highlighted. Bound CHAPS molecules are shown as sticks (violet).
Figure 1—figure supplement 1
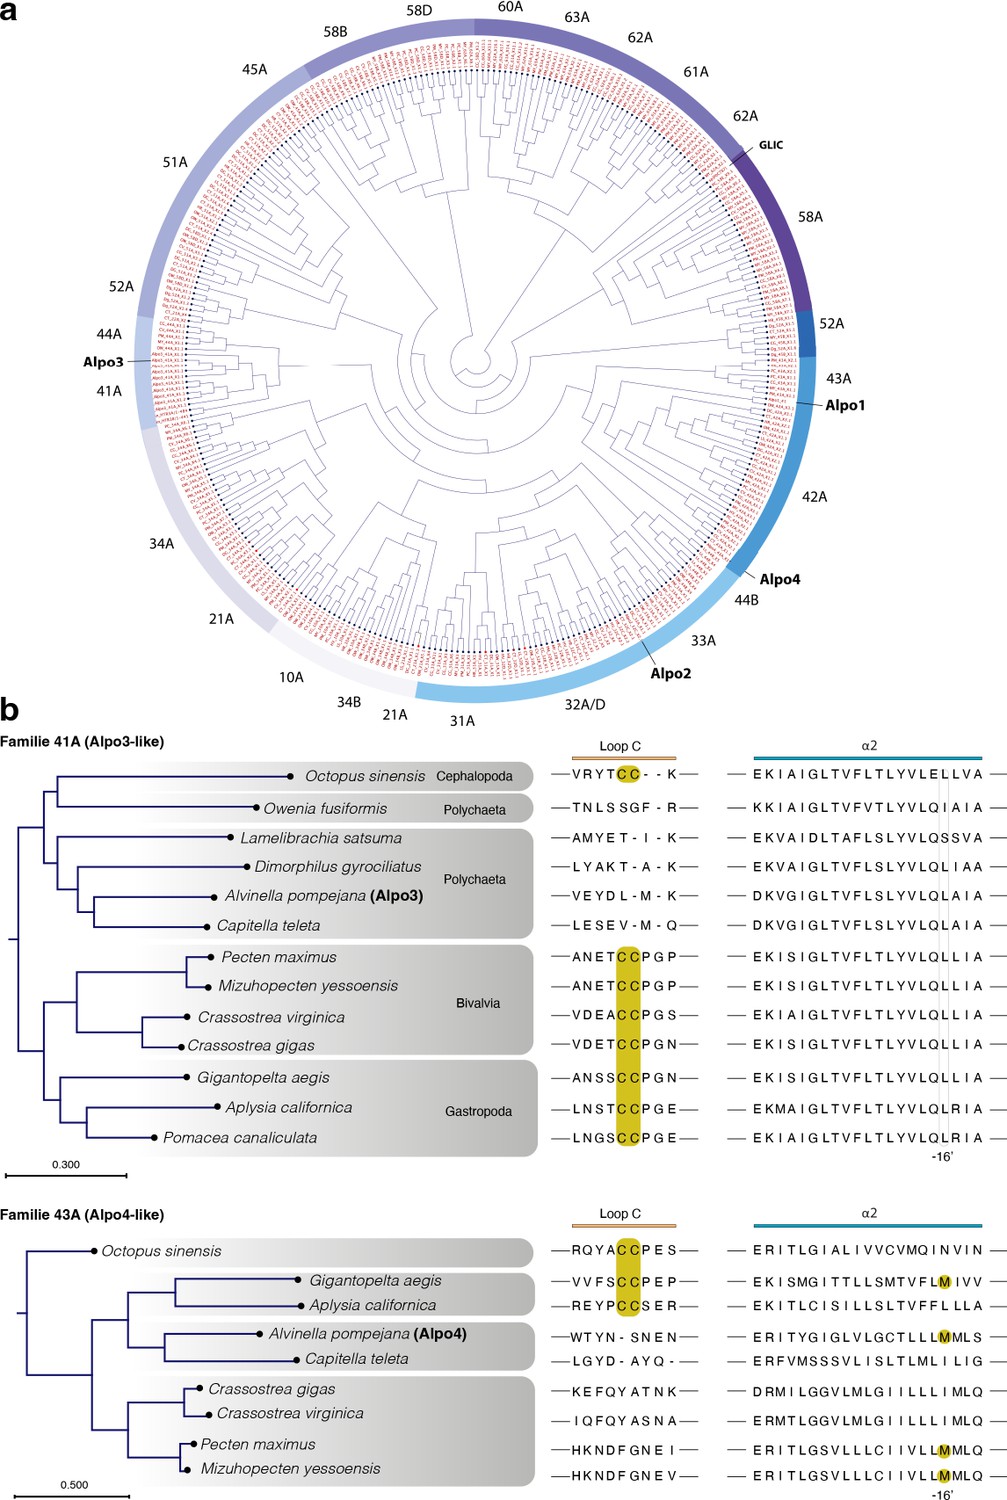
Phylogenetic analysis of nicotinic acetylcholine (nAChR) in lophotrochozoans.
(a) Maximum likelihood phylogeny of lophotrochozoans nAChR receptors using one isoform of each protein sequence from genomes of the following annelids: Capitella teleta (CT), Dimorphilus gyrociliatus (DM), Owenia fusiformis (OW), Hirudo verbana (HV), Helobdella robusta (HR), and proteins of Mollusca Crassostrea virginca (MV), Crassostrea gigas (CG), Mizuhopecten yessoensis (MY), Pecten maximus (PM), and Pomacea canaliculata (PC). Based on this classification, the nAChR were grouped in families as indicated in the tree. Positions of Alpo1-4 are indicated. (b) Phylogenetic tree and multiple sequence alignment of proteins sequences corresponding to family 41 A (Alpo3-like) and 43 A (Alpo4-like). Only one isoform for each selected Lophotrochozoan member was used with the addition of Octopus sensis (OS), Gigantopelta aegis (GA), Aplysia californica (AC), and Pomacea canaliculata (PC). The alignments show the conservation of the characteristic CC tip (yellow) in the ligand-binding pocket. Alignment of the M2 sequences reveals proteins with methionine on position 16’.
Figure 1—figure supplement 2
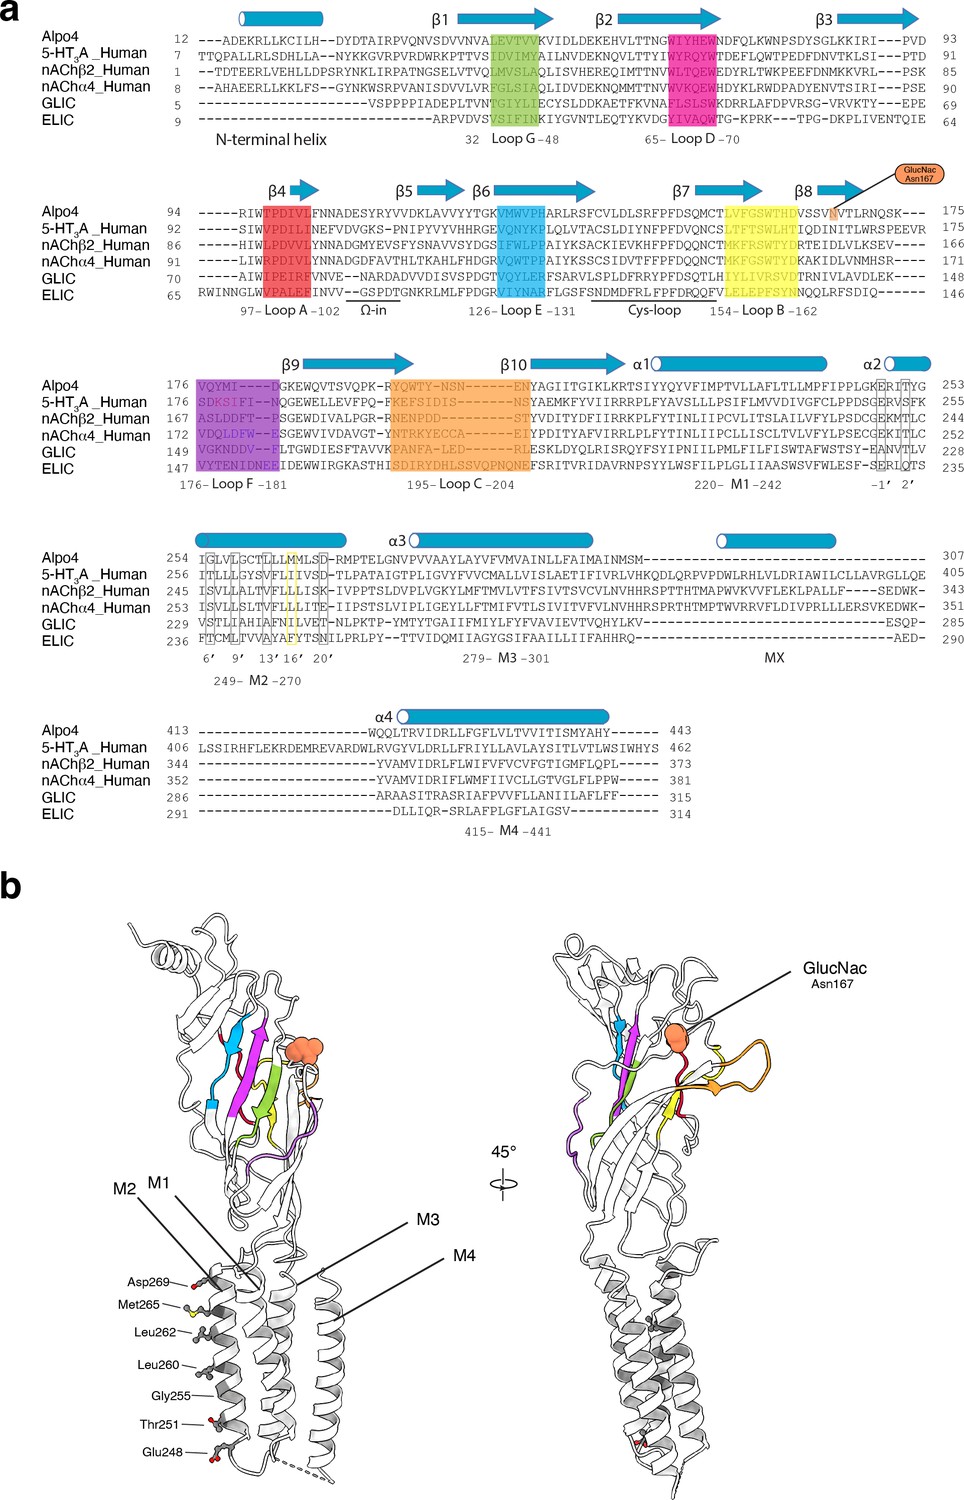
Structure-based sequence alignment of cation-selective pentameric ligand-gated ion channels (pLGICs).
(a) Sequence alignment of selected pLGIC by PROMALS3D. The following structural models were used for the alignment: Alpo4ACH (chain A), 5-HT3A (PDB: 6NPO, chain A), nACh α4 (PDB: 5KXI, chain A), nACh β2 (PDB: 5KXI, chain B), GLIC (PDB: 4HFI, chain A), and ELIC (PDB: 6HJX, chain A). Secondary structure elements are indicated. Loops A-F are colored and pore-facing residues are outlined by gray rectangles. One glycosylation site at Asn167 was identified in the structure of Alpo4. ICD, residues 308–412, are not resolved in Alpo4 maps. The sequence numbering of structural elements corresponds to Alpo4. (b) The structure of the Alpo4 monomer is shown in the cartoon representation. Loops A-F are color-coded as in panel a, GlucNac on Asn167 is shown in coral, and the pore-facing residues are shown in stick and ball representation.
Figure 1—figure supplement 3
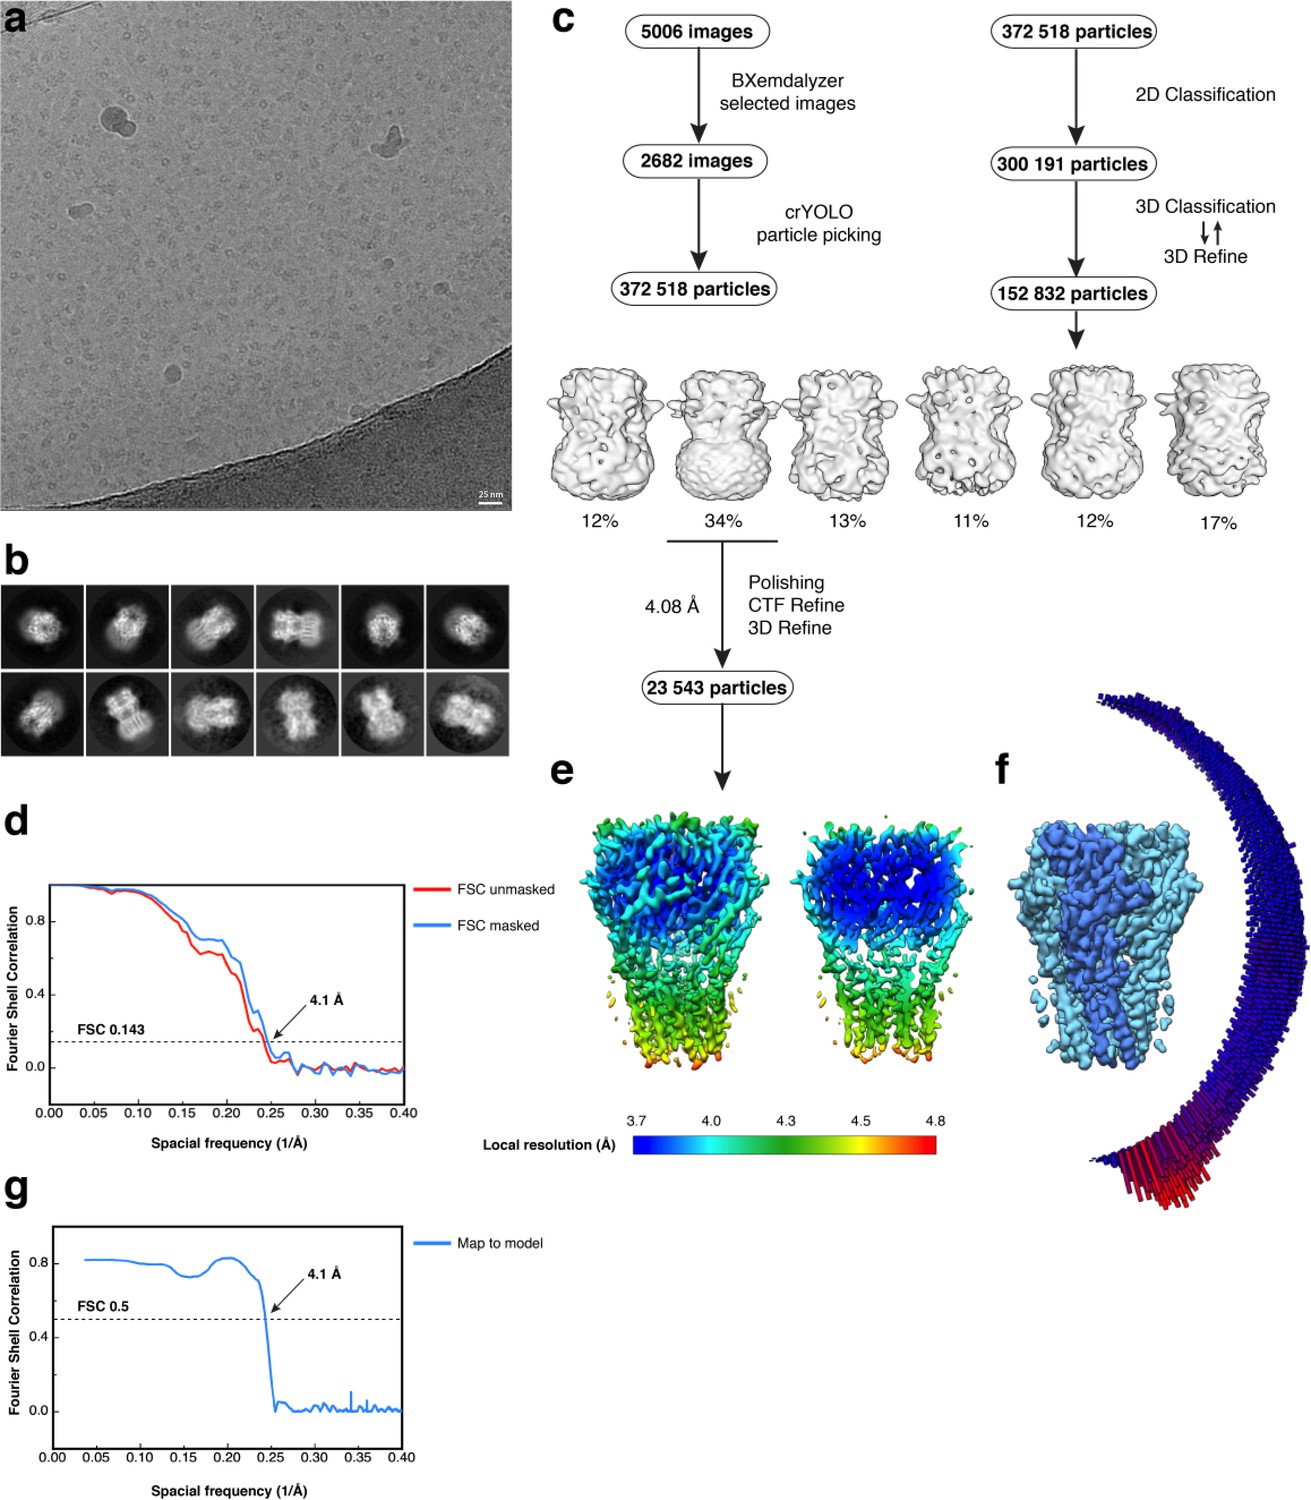
Electron microscopy, classification, and 3D reconstruction for the Alpo4CHAPS dataset.
(a) Representative micrograph of Alpo4CHAPS embedded in vitreous ice on graphene oxide coated R2/1 grids. (b) The 2D class averages. (c) Image selection, particle picking, classification, and refinement workflow. (d) Gold-standard Fourier Shell Correlation (FSC) curves are shown for unmasked (red) and masked (blue) reconstructions. The horizontal dashed line indicates the 0.143 cutoff threshold. (e) Side-view and ‘clipped’ view of the final masked reconstruction colored by local resolution calculated using Relion 3.0. (f) Angular distribution of particle orientations for the final reconstruction. (g) Model-to-map FSC indicates a nominal resolution of 4.1 Å using the 0.5 FSC threshold.
Figure 1—figure supplement 4
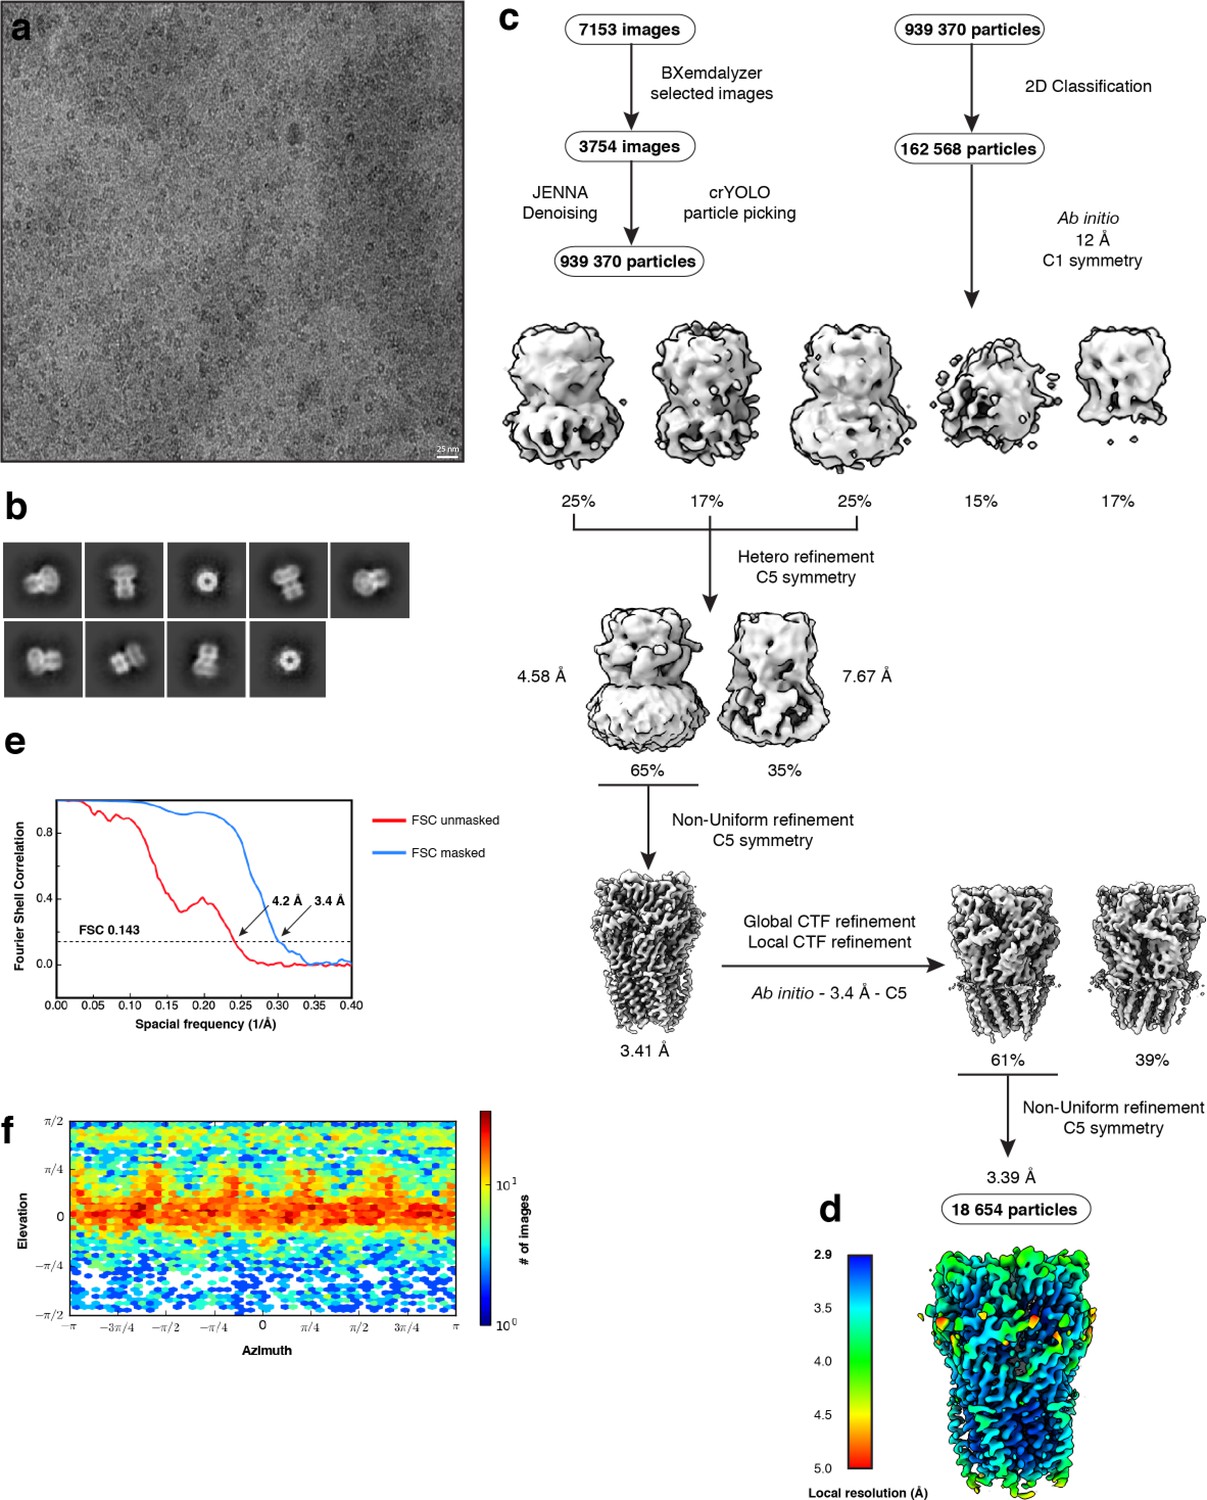
Electron microscopy, classification, and 3D reconstruction for the Alpo4APO dataset.
(a) Representative micrograph of Alpo4APO embedded in vitreous ice on graphene oxide coated R2/1 grids. (b) The 2D class averages. (c) Image selection, particle picking, classification, and refinement workflow in cryoSPARC. (d) The local resolution of the final reconstruction is calculated using cryoSPARC. (e) Gold-standard Fourier Shell Correlation (FSC) curves are shown for unmasked (red) and masked (blue) reconstructions. The horizontal dashed line indicates the 0.143 cutoff threshold. (f) Heat map of the angular distribution of the final reconstruction as calculated in cryoSPARC.
Figure 1—figure supplement 5
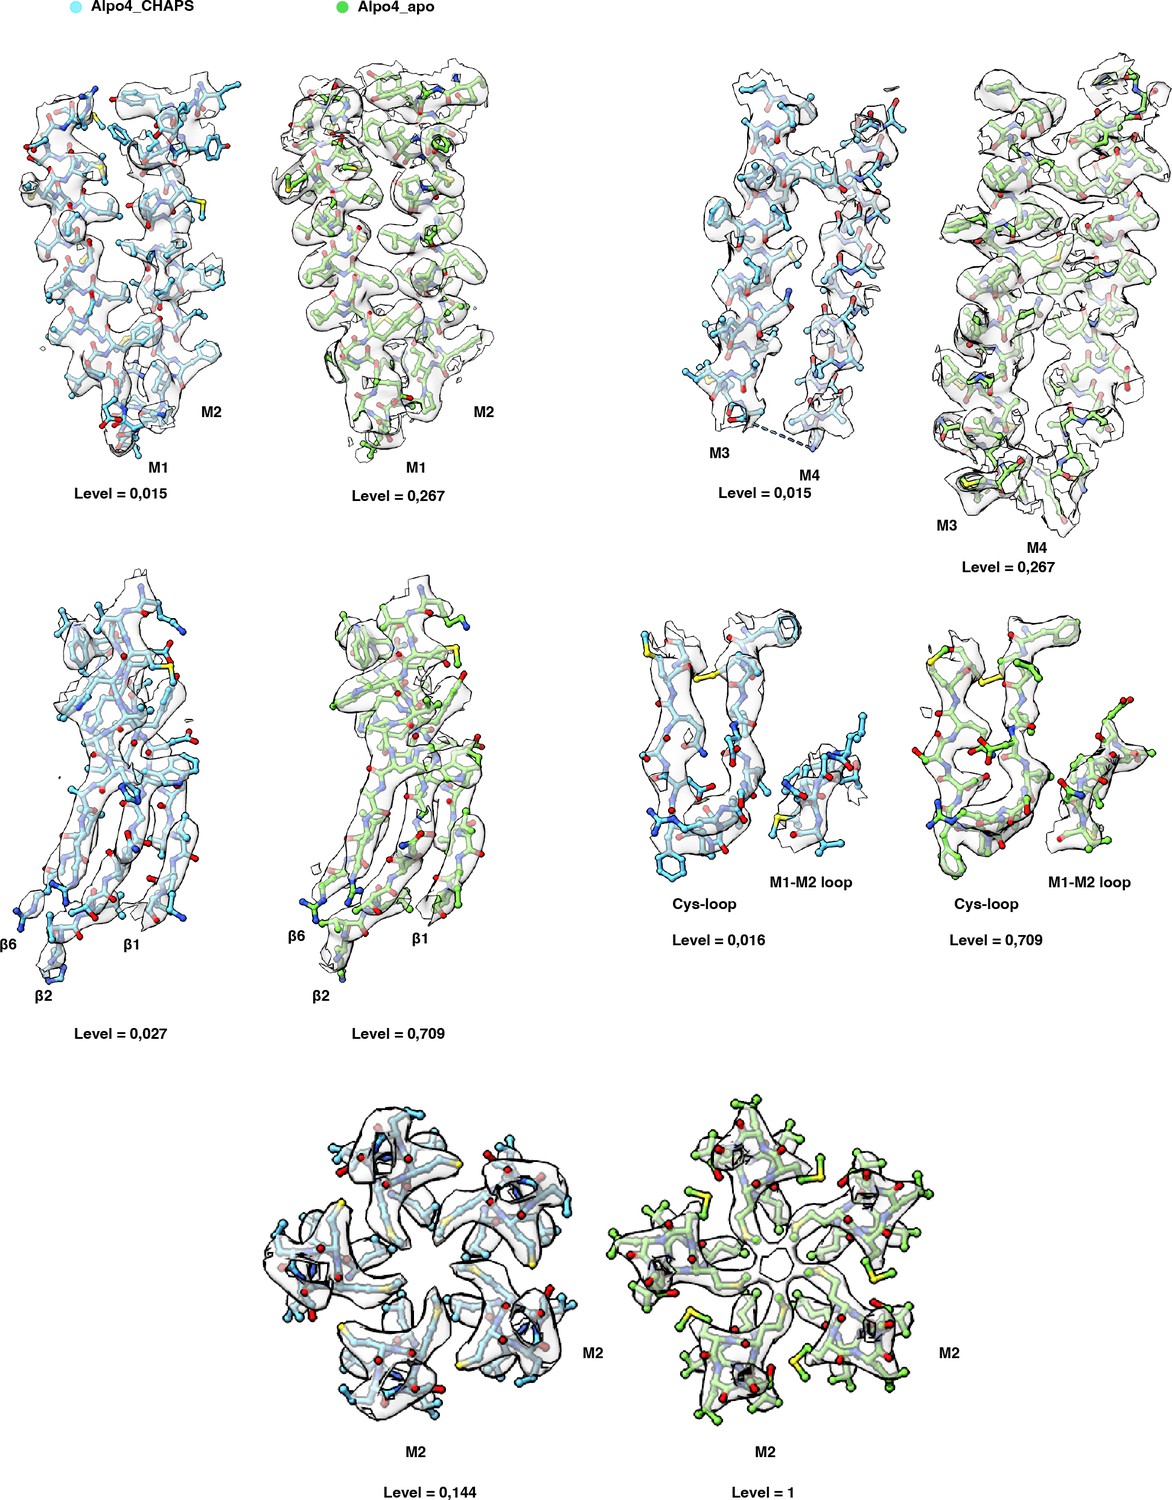
Quality of the electron cryogenic microscopy (cryo-EM) maps.
The cryo-EM maps and models are shown for representative regions of Alpo4CHAPS (blue) and Alpo4APO (green).
Figure 1—figure supplement 6
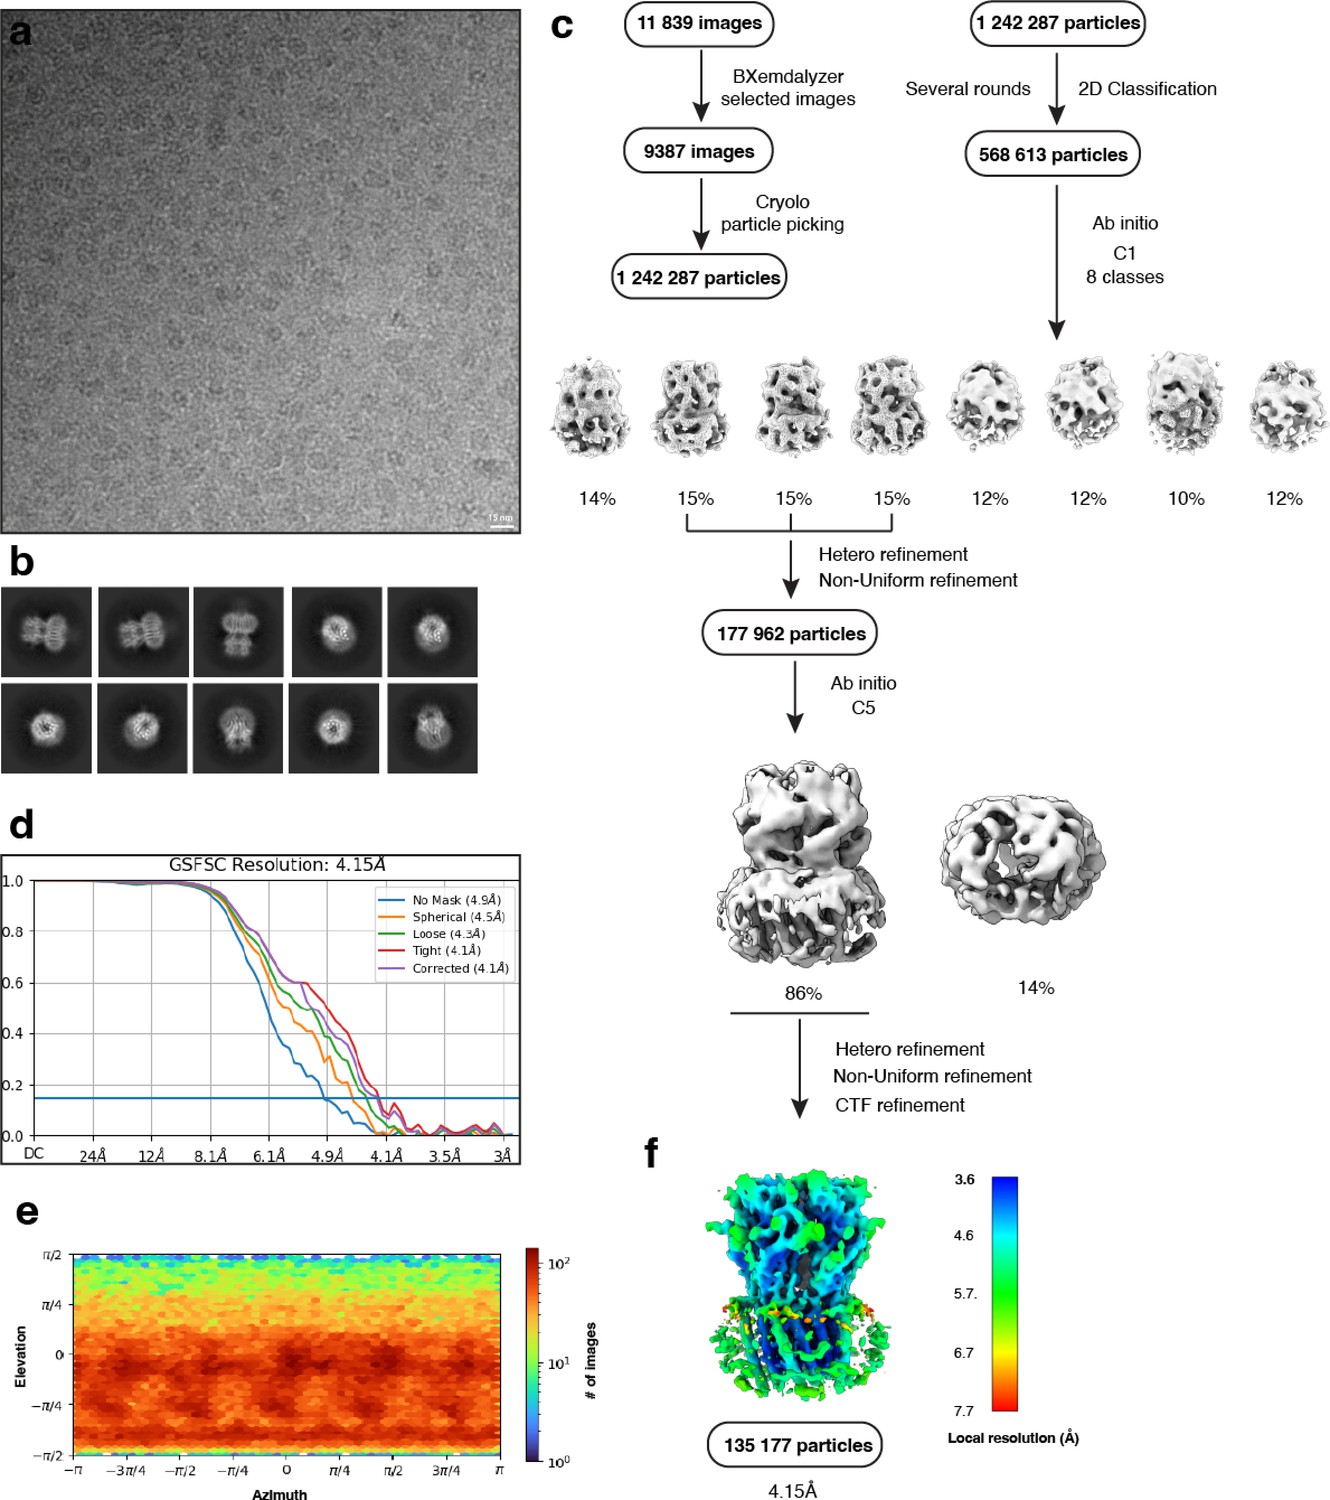
Electron microscopy, classification, and 3D reconstruction for the Alpo4APO_LMNG (LMNG only) dataset.
(a) Representative micrograph of Alpo4APO_LMNG embedded in vitreous ice on graphene oxide coated R2/1 grids and (b) the resulting 2D class averages of the final model. (c) Image selection, particle picking, classification, and refinement workflow in cryoSPARC. (d) Gold-standard Fourier shell correlation (FSC) curves with the horizontal dashed lines highlighting the 0.143 thresholds. The unmasked reconstruction (red) reaches 4.9 Å while the tight dynamic masked reconstruction (blue) reaches 4.1 Å. (e) Heat map of the angular distribution of the final reconstruction as calculated in cryoSPARC. (f) The local resolution of the final reconstruction is calculated using cryoSPARC.
Figure 1—figure supplement 7
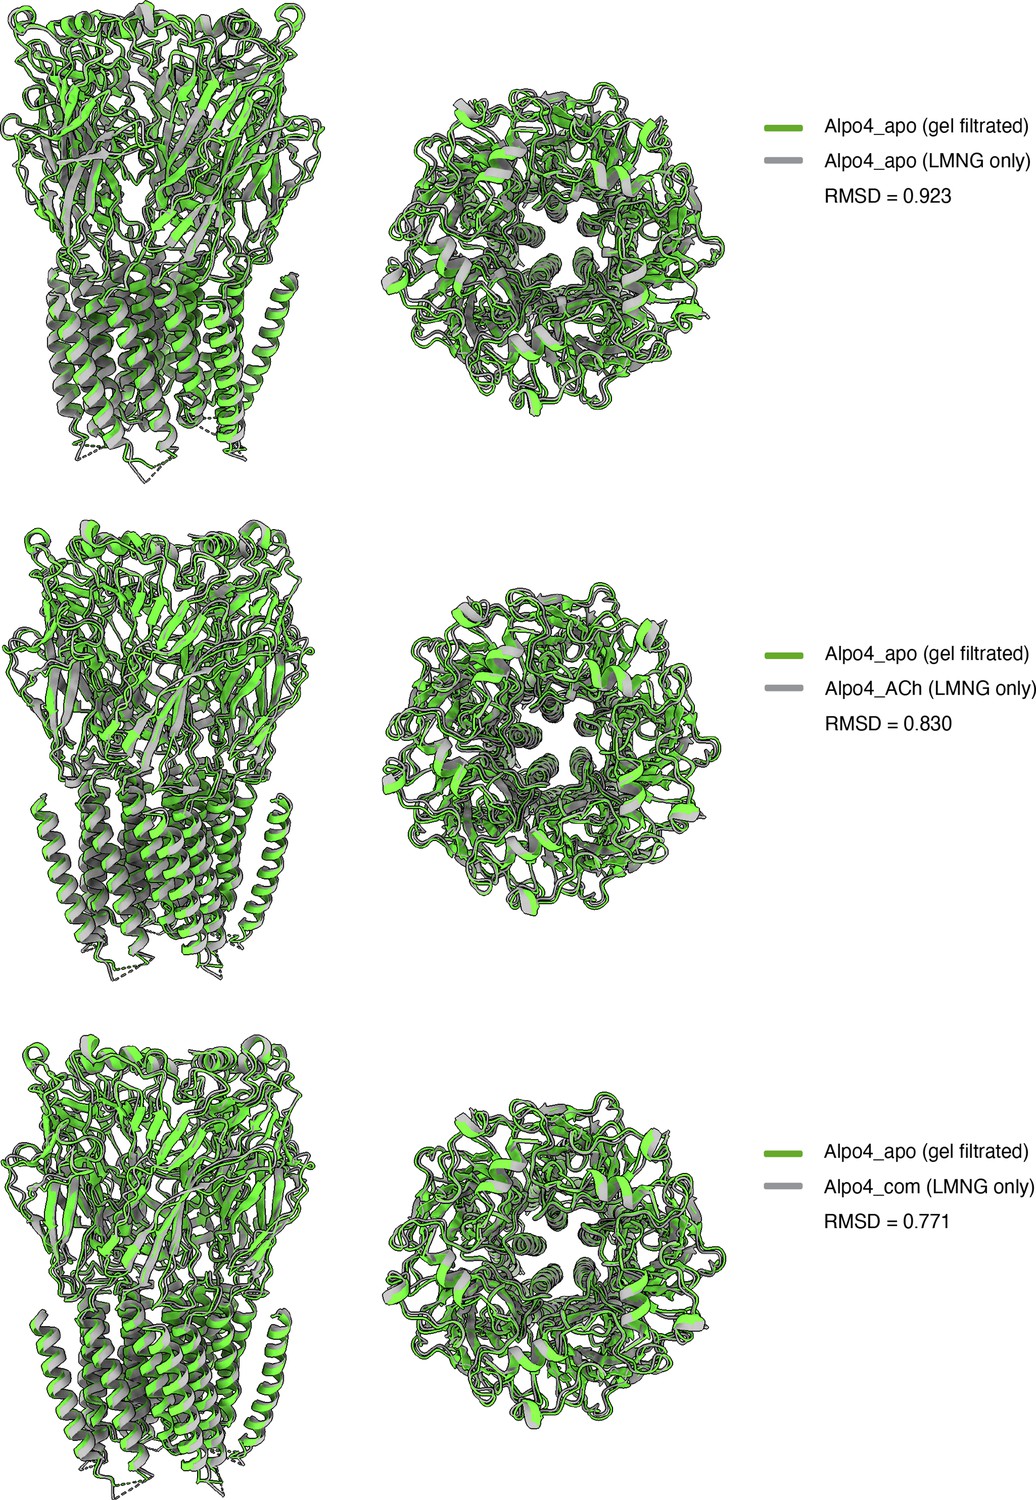
Superposition of Alpo4 structures.
Alpo4APO (gel filtrated) is shown in green and superimposed on Alpo4APO_LMNG, Alpo4ACH, and Alpo4COMBINED (LMNG only).
Figure 1—figure supplement 8

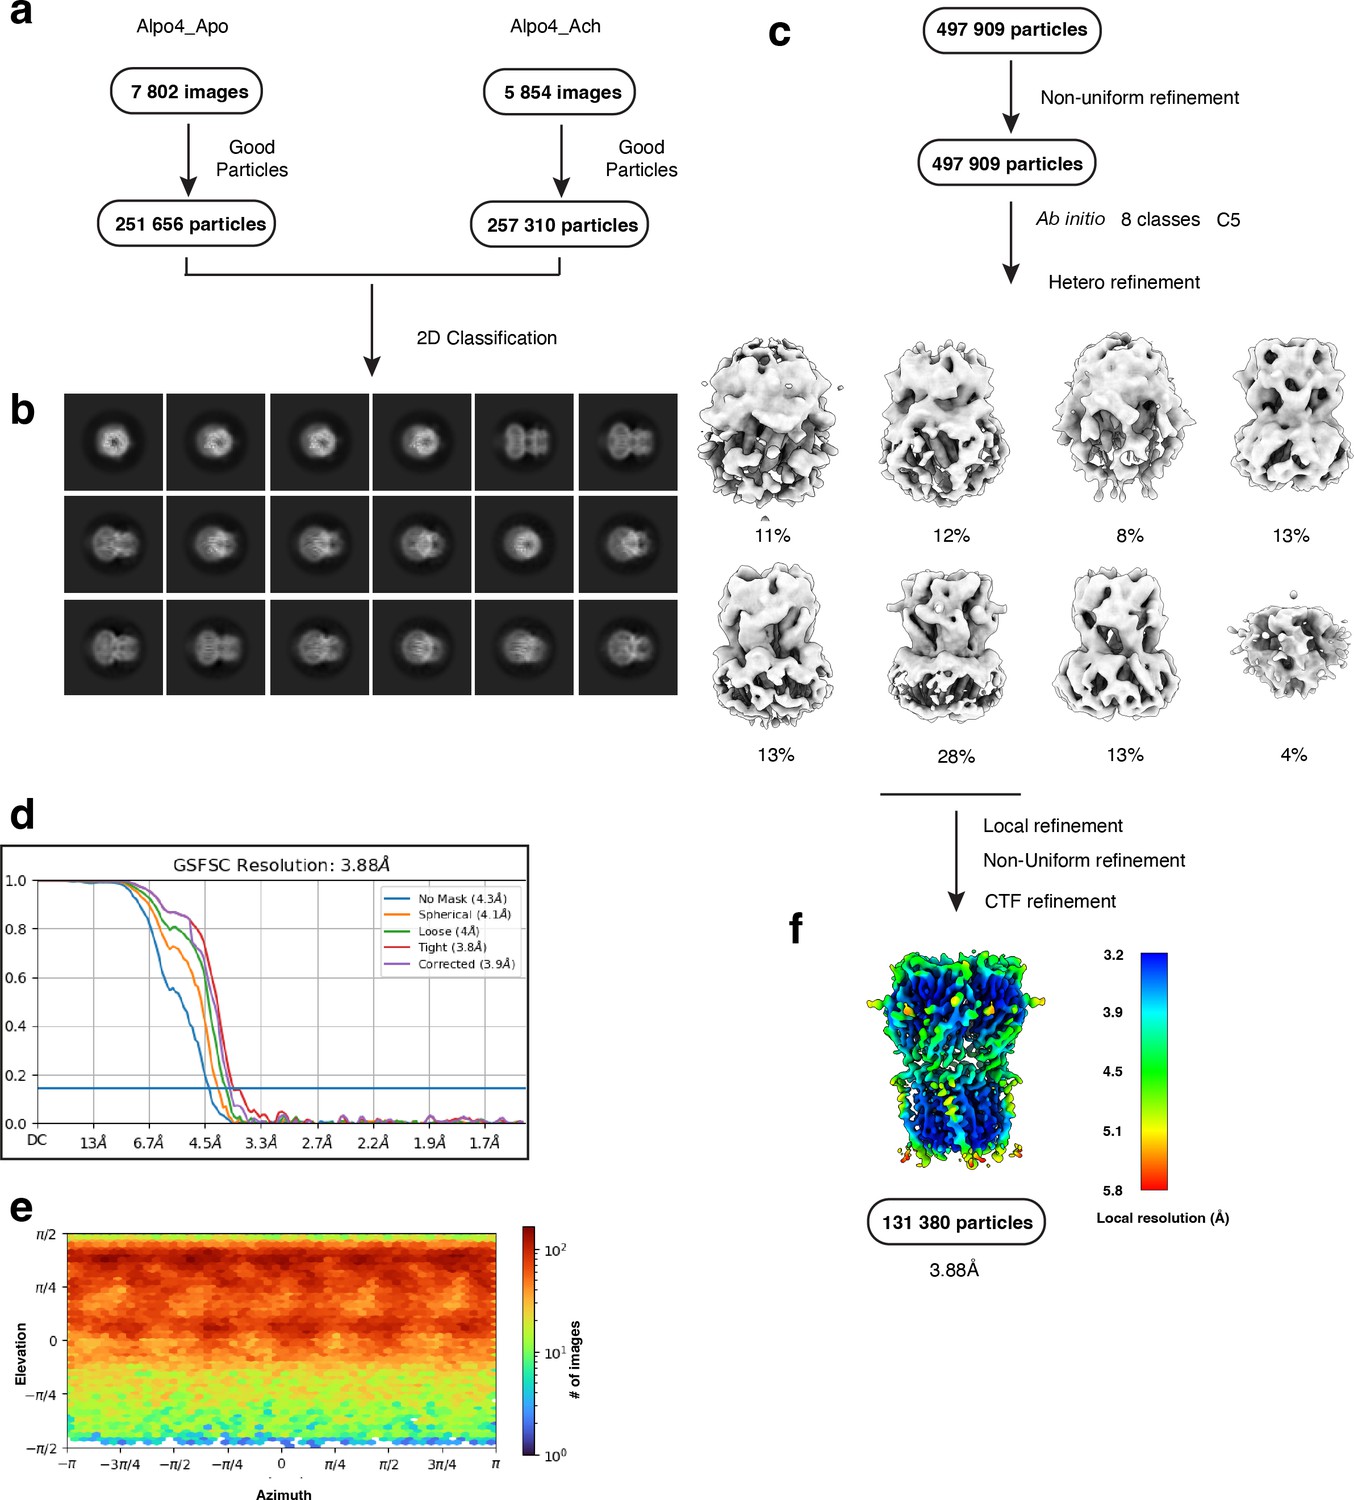
Electron microscopy, classification, and 3D reconstruction for the Alpo4ACH (LMNG only) dataset.
(a) Representative micrograph of Alpo4ACH embedded in vitreous ice on graphene oxide coated R2/1 grids and (b) the resulting 2D class averages of the final model. (c) Image selection, particle picking, classification, and refinement workflow in cryoSPARC. (d) Gold-standard Fourier shell correlation (FSC) curves with the horizontal dashed lines highlighting the 0.143 thresholds. The unmasked reconstruction (red) reaches 4.3 Å while the tight dynamic masked reconstruction (blue) reaches 3.9 Å. (e) Heat map of the angular distribution of the final reconstruction as calculated in cryoSPARC. (f) The local resolution of the final reconstruction is calculated using cryoSPARC.
Figure 1—figure supplement 9
Electron microscopy, classification, and 3D reconstruction for the Alpo4combined (LMNG only) dataset.
(a) Electron cryogenic microscopy (Cryo-EM) workflow of combining Alpo4APO_LMNG and Alpo4ACh particles in cryoSPARC. (b) Representative 2D classifications. (c) Refinement workflow. (d) Gold-standard Fourier shell correlation (FSC) curves with the horizontal dashed lines highlighting the 0.143 thresholds. The unmasked reconstruction (red) reaches 4.3 Å while the tight dynamic masked reconstruction (blue) reaches 3.9 Å. (e) Heat map of the angular distribution of the final reconstruction as calculated in cryoSPARC. (f) The local resolution of the final reconstruction is calculated using cryoSPARC.
Figure 1—figure supplement 10

Electron microscopy, classification, and 3D reconstruction for the Alpo4SER (LMNG only) dataset.
(a) Representative micrograph of Alpo4SER embedded in vitreous ice on graphene oxide coated R2/1 grids and (b) the resulting 2D class averages of the final model. (c) Image selection, particle picking, classification, and refinement workflow in cryoSPARC. (d) Gold-standard Fourier shell correlation (FSC) curves with the horizontal dashed lines highlighting the 0.143 thresholds. The unmasked reconstruction (red) reaches 6.9 Å while the tight dynamic masked reconstruction (blue) reaches 6.2 Å. (e) Heat map of the angular distribution of the final reconstruction as calculated in cryoSPARC. (f) The local resolution of the final reconstruction is calculated using cryoSPARC.
Figure 2 with 2 supplements
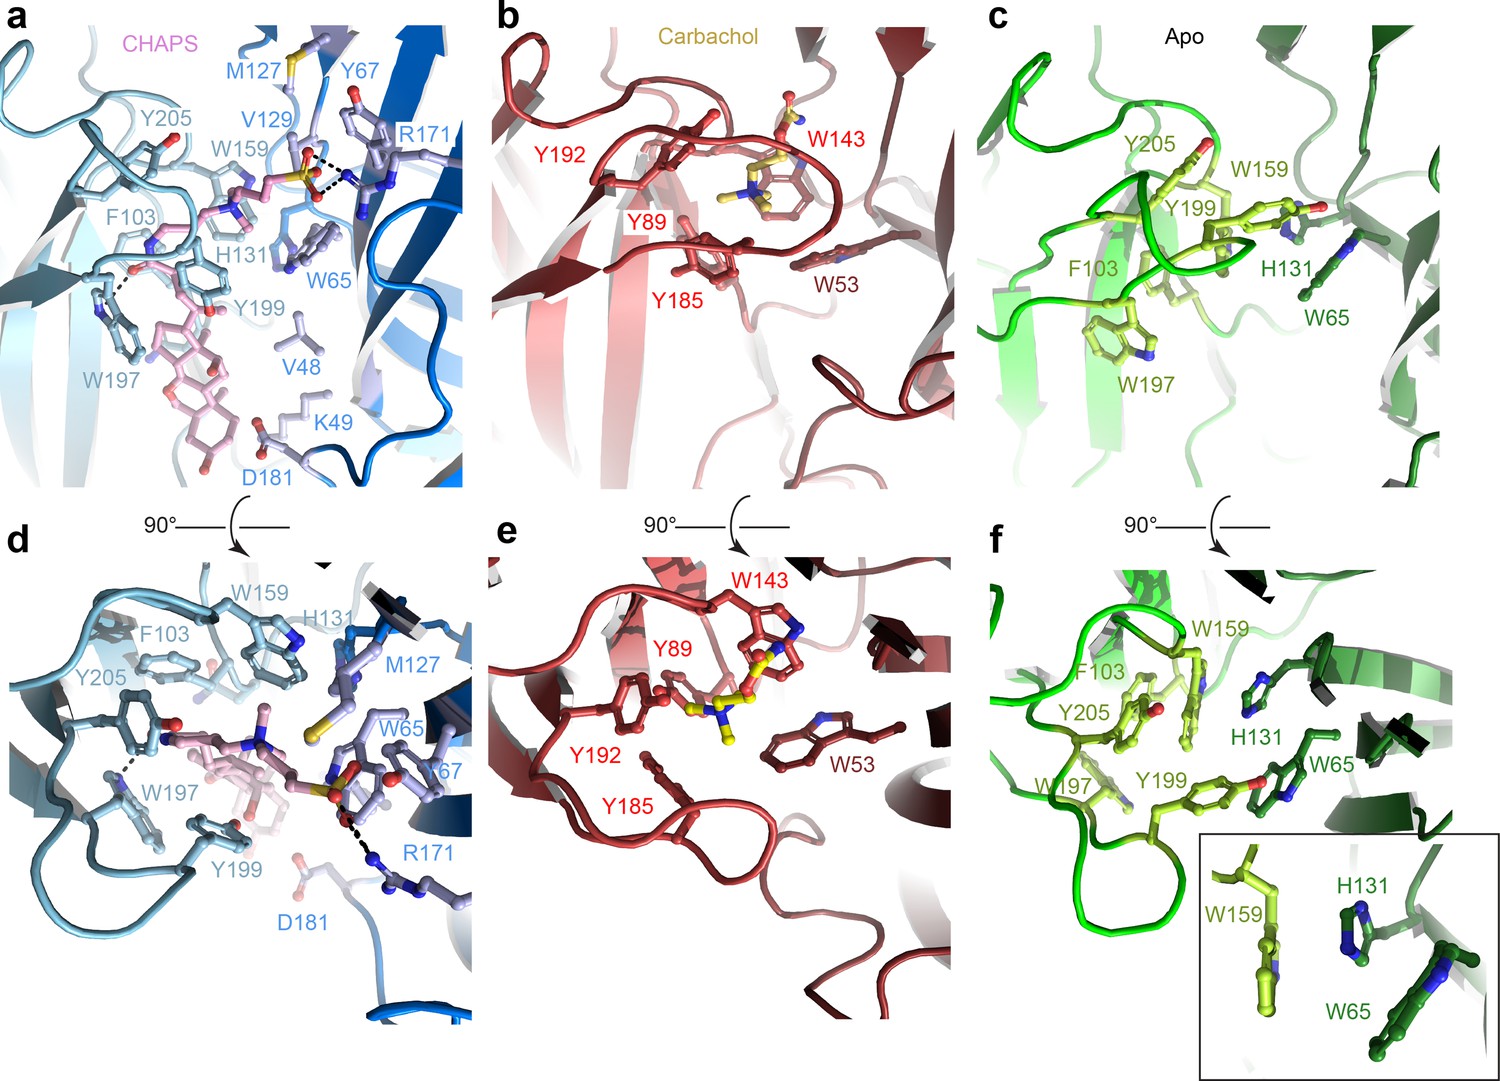
Orthosteric binding site of Alpo4.
(a, d) Ligand binding pocket of Alpo4 with bound CHAPS. The residues interacting with CHAPS are shown as sticks. (b, e) Similar views of the ligand binding site in the acetylcholine binding protein (AChBP) in complex with carbachol (PDB code 1UV6). (c, f) Ligand binding pocket of Alpo4 in apo state. Residues constituting the aromatic cage are shown as sticks. The self-liganded state of W159 is shown as an inset in sticks representation. The principal subunit is colored in a lighter shade and complimentary in a darker.
Figure 2—figure supplement 1
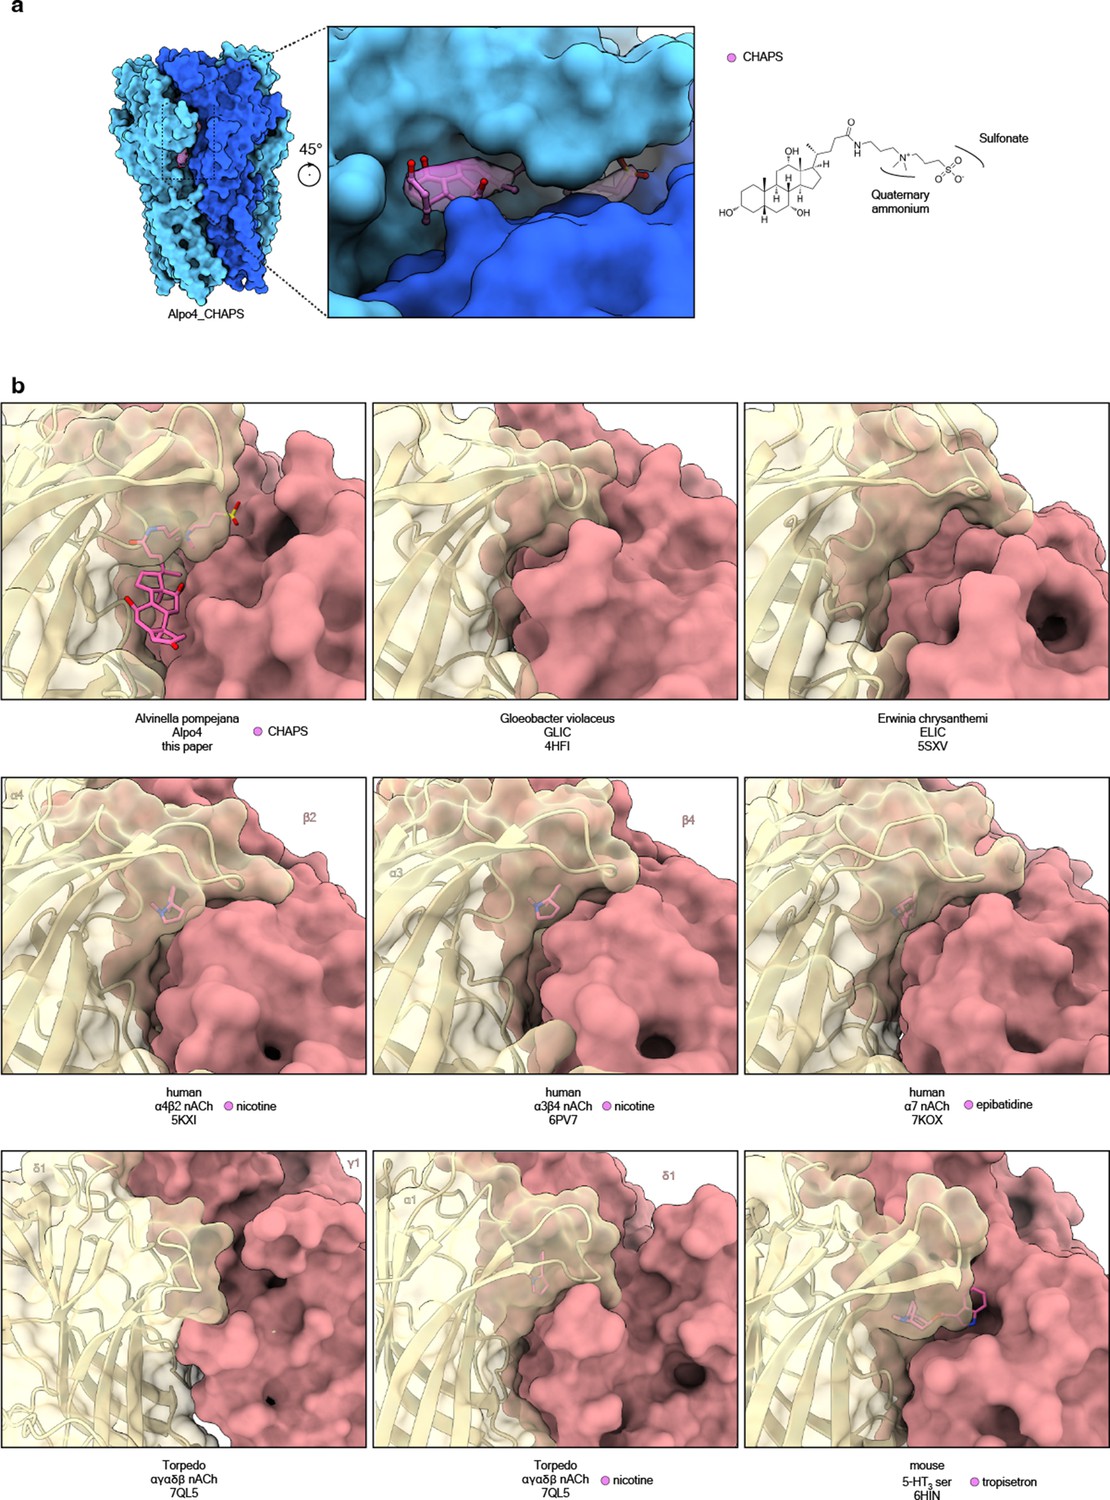
Sterol-binding pocket in Alpo4 and other pentameric ligand-gated ion channels (pLGICs).
(a) Surface representation of Alpo4CHAPS in blue highlights the position of additional density found in the electron cryogenic microscopy (cryo-EM) map (violet). The modeled CHAPS molecule is shown in the ball and sticks representation. (b) Ligand binding pockets of different pLGIC reveal accessible area. Ligands are shown in pink.
Figure 2—figure supplement 2
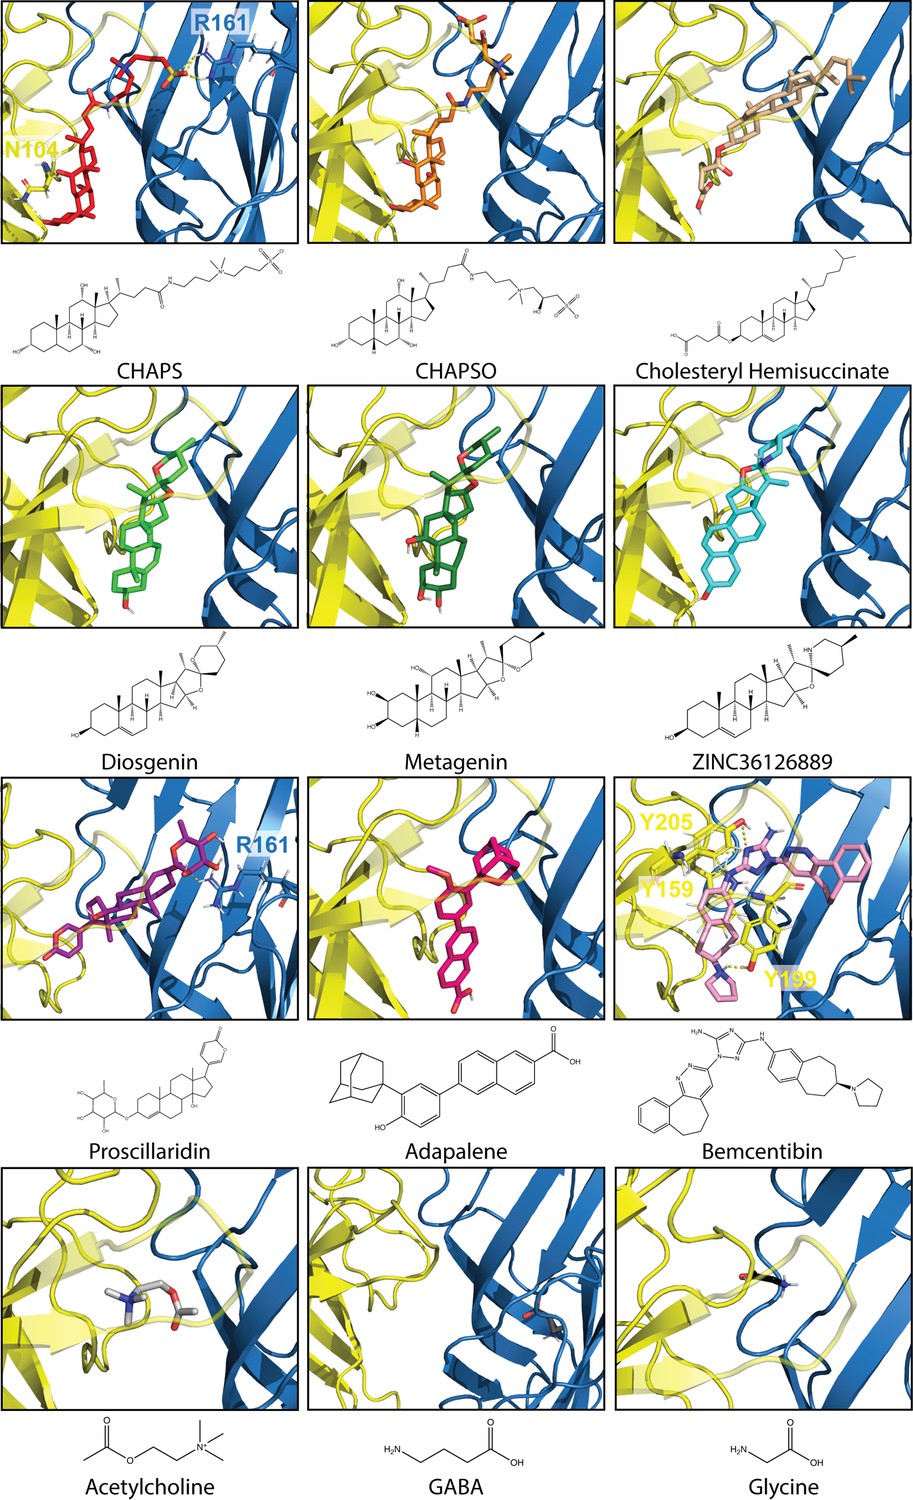
Best docked poses of 12 compounds in Alpo4.
Docking was conducted with the CHAPS-bound Alpo4 structure using Auto Dock Vina in USCF Chimera. The complementary subunit is shown in blue and the principal subunit is shown in yellow with loop C made transparent. Residues predicted to bind with docked compounds are represented as sticks with yellow dashed lines indicating binding interactions. 2D-representation of compounds was created using ChemDraw 20.1.
Figure 3 with 1 supplement
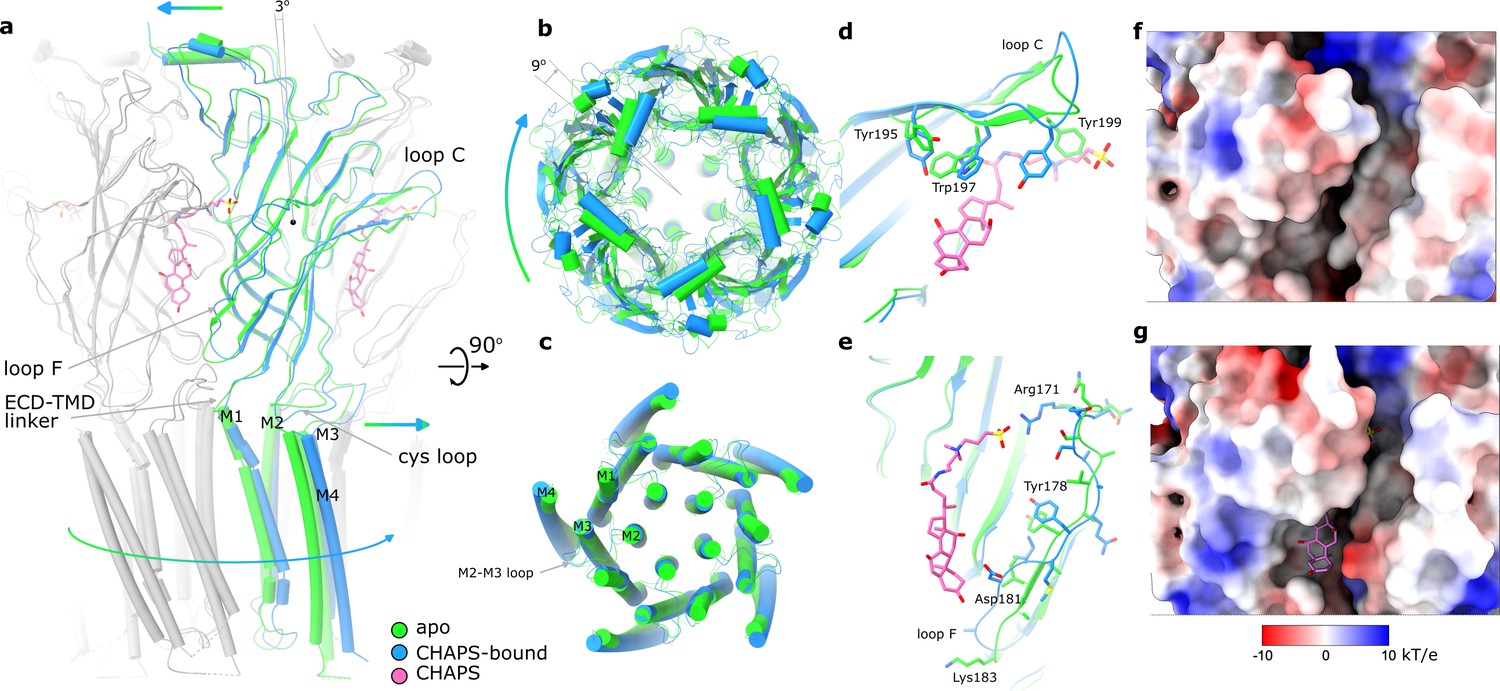
Conformational changes between apo and CHAPS-bound Alpo4.
(a) Structures of apo (green) and CHAPS-bound (light blue) Alpo4 are overlayed. The extracellular domain (ECD) was aligned between the structures. Bound CHAPS is shown in pink for reference. Only one subunit from each pentamer is colored, others are shown in gray for clarity. The binding of CHAPS results in an around 3 degrees clockwise rotation. The approximate rotation center is indicated by the black dot. The rotation of the membrane domain is indicated by an arrow. (b) Relative rotation of transmembrane domain (TMD) and ECD. The structures are aligned to TMDs. (c) Same as panel (b) but only TMDs are shown. Changes in TMD associated with CHAPS binding are minor. (d, e) Close-up of conformational changes in loops C and F, respectively. (f, g) Surface electrostatics is shown around sterol-binding grooves for apo (f) and CHAPS-bound states (g).
Figure 3—figure supplement 1
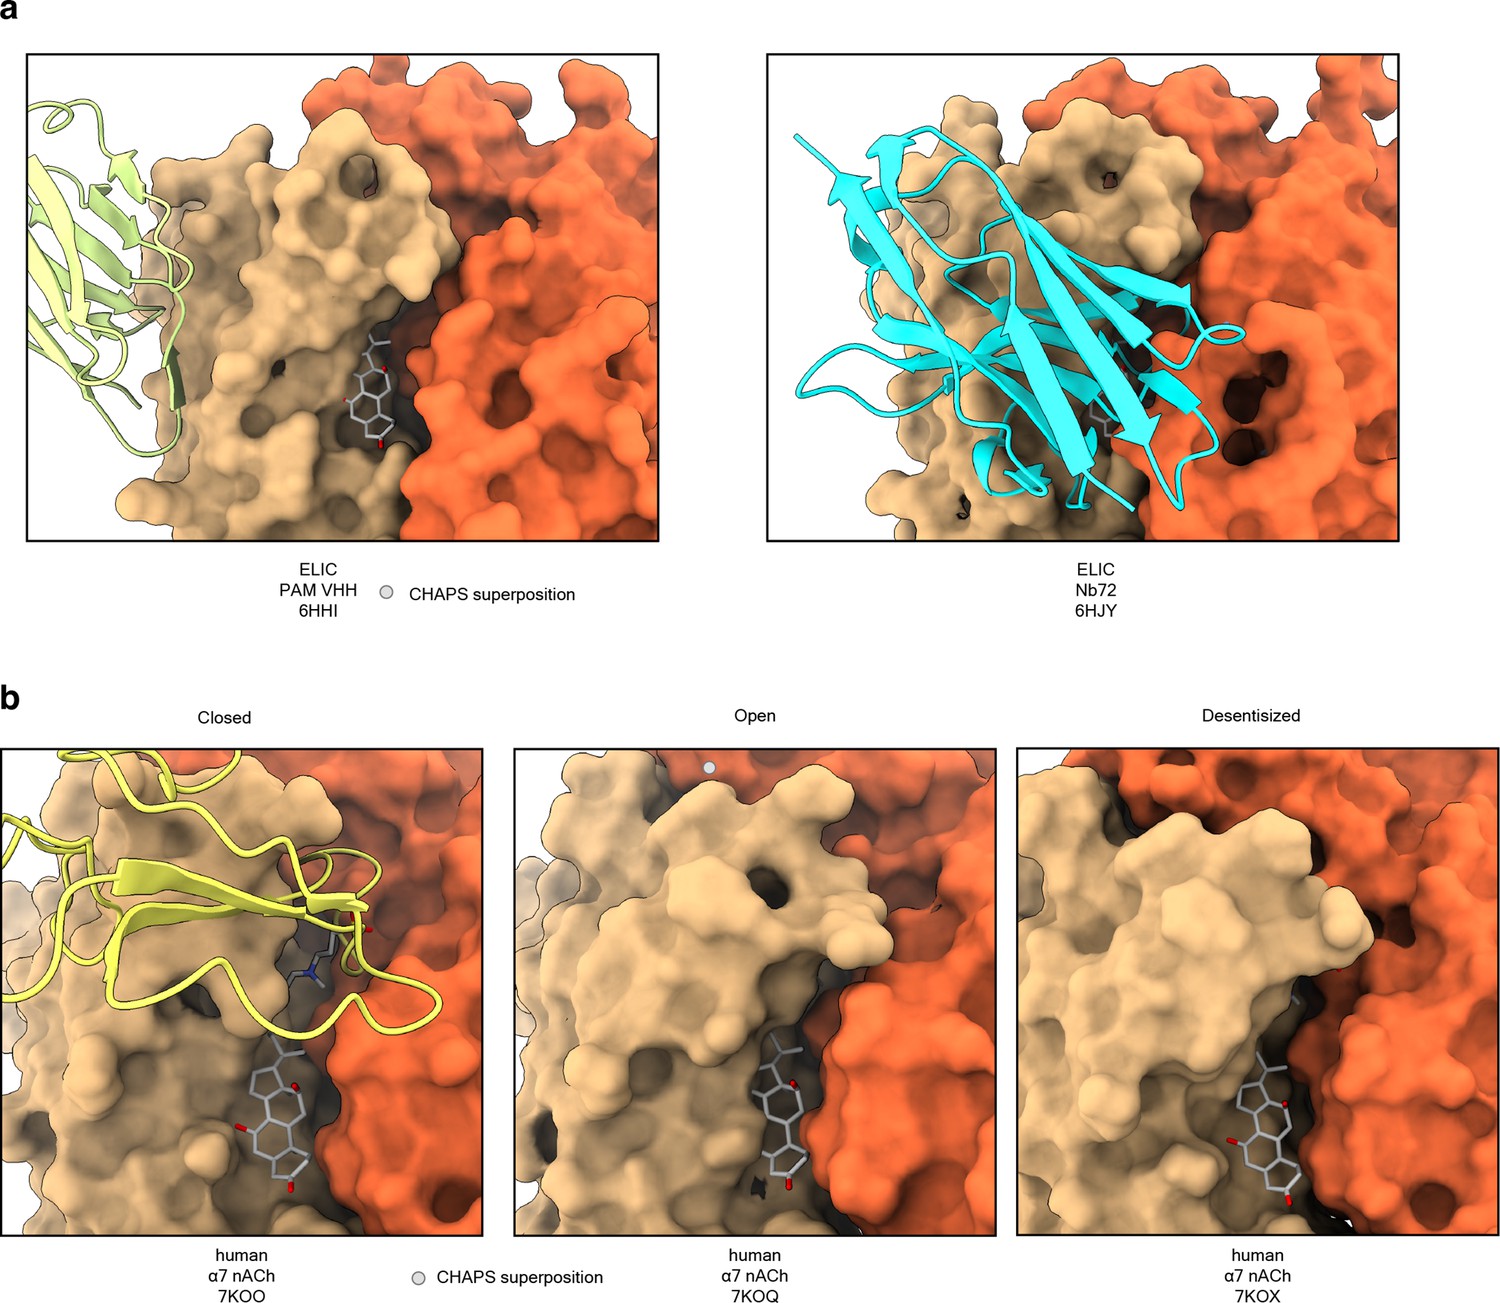
Sterol binding groove is a ligand-binding site suitable for allosteric modulation.
(a) Positions of VHH bound to ELIC (Mazurov et al., 2006; Brams et al., 2020). (b) Structures of α7 nicotinic acetylcholine (nACh) receptors in three functional states show that quaternary twist changes the width of the sterol-binding groove. CHAPS from the aligned Alpo4 structure is shown to indicate the position of the groove.
Figure 4
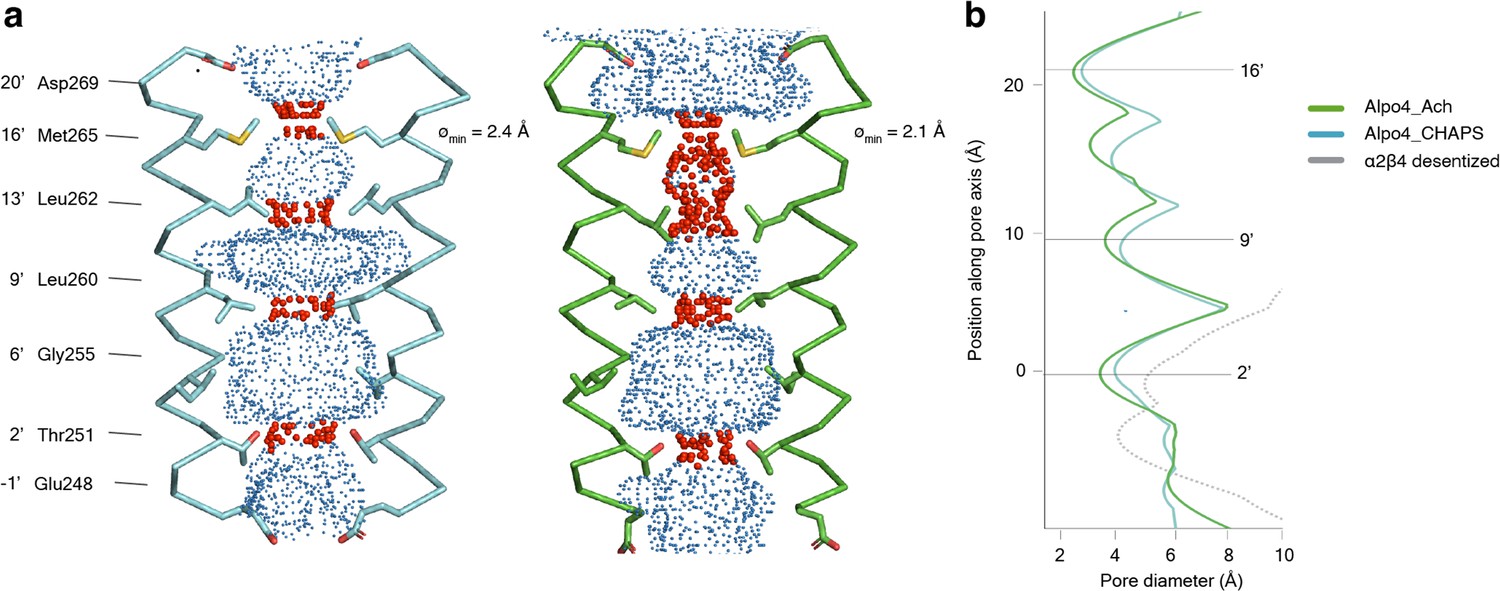
Permeation pathway of Alpo4.
(a) Pore diameter calculated using HOLE and represented as dots for Alpo4CHAPS (blue) and Alpo4APO (green). Only M2 is shown in the cartoon and the pore-facing residues are shown as sticks. Constrictions are shown in red. (b) Pore diameter along the channel axis for Alpo4CHAPS (blue), Alpo4APO (green), and α4β2 (gray, PDB: 5KXI). The zero value along the channel axis corresponds to position 2’ (Thr251).
-
Figure 4—source data 1
The pore diameter of the channels shown in panel b is calculated by HOLE.
- https://cdn.elifesciences.org/articles/86029/elife-86029-fig4-data1-v2.xlsx
Videos
Video 1
Transition of Alpo4APO to Alpo4CHAPS viewed from the extracellular side, side view, the C-loop, and the F-loop.
Video 2
Quaternary conformational changes in Alpo4 upon binding of CHAPS are shown along with quaternary changes in α7 nicotinic acetylcholine (nACh) and 5-HT3 receptors upon transition from resting to active state.
The channels were aligned to the extracellular surface of the pore to show rotation of extracellular domain (ECD) relative to transmembrane domain (TMD) and to ECD of one subunit to show relative movements of ECDs. One subunit is shown in purple.
Tables
Table 1
Statistics of cryo-EM data collection, data processing, and model refinement.
| Data deposition | ||||||
|---|---|---|---|---|---|---|
| Alpo4 ID: | Alpo4CHAPS | Alpo4APO | Alpo4APO_LMNG | Alpo4ACH | Alpo4COMB* | Alpo4SER |
| PDB ID: | 8BYI | 8BXF | 8BX5 | 8BXB | 8BXE | 8BXD |
| EMDB ID: | EMD-16326 | EMD-16317 | EMD-16308 | EMD-16314 | EMD-16316 | EMD-16315 |
| Data collection | ||||||
| Microscope | JOEL CRYOARM300 | |||||
| Acceleration voltage [kV] | 300 | |||||
| Energy filter | In-column Omega energy filter | |||||
| Energy filter slit width [eV] | 20 | |||||
| Spherical aberration [mm] | 2.55 | |||||
| Magnification | 60 000 | |||||
| Detector | Gatan K2 | Gatan K3 | Gatan K3 | Gatan K3 | Gatan K3 | Gatan K3 |
| Refined pixel size [Å] | 0.782 | 0.784 | 0.7596 | 0.7596 | 0.7596 | 0.7596 |
| Exposure time [s] | 2.985 | 3.955 | 2.985 / 3.955 | 3.955 | ||
| Number of frames | 61 | 61 | 59 | 59 | 59 | 59 |
| Electron exposure [e-/Å2] | 37 | 30 | 45 | 59 | 45/59 | 59 |
| Defocus range [μm] | 1.6–2.8 | 0.8–2.8 | 1.0–2.4 | 1.0–2.4 | 1.0–2.4 | 1.0–2.4 |
| Collected images | 5003 | 7153 | 11 839 | 13 830 | 25 669 | 2200 |
| Used images | 2682 | 3754 | 9387 | 7816 | 13 647 | 1595 |
| Particles picked | 372 518 | 939 370 | 1 242 287 | 2 597 373 | 508 966 | 446 221 |
| Data processing | ||||||
| Symmetry | C5 | C5 | C5 | C5 | C5 | C5 |
| Particles refined | 23 543 | 18 654 | 135 177 | 251 656 | 131 380 | 79 454 |
| Final resolution [Å], FSC = 0.143 | 4.1 | 3.4 | 4.2 | 3.9 | 3.9 | 6.2 |
| Sharpening B-factor [Å2] | –176 | –139 | –297 | –170 | –235 | –1062 |
| Local resolution range [Å] | 3.7–4.6 | 2.9–5.0 | 3.5–7.7 | 3.2–5.8 | 3.2–5.8 | 5.5–7.0 |
| Model refinement | ||||||
| Refinement package | PHENIX 1.19 | |||||
| Initial model used | 6HIQ | Alpo4CHAPS | Alpo4ACH | Alpo4APO | Alpo4ACH | Alpo4ACH |
| Model resolution [Å], FSC = 0.5 | 4.2 | 3.9 | 4.5 | 4.2 | 4.1 | |
| Model composition | ||||||
| Non-hydrogen protein atoms | 13 321 | 12 692 | 12 550 | 12 547 | 12 553 | |
| Protein residues | 1600 | 1630 | 1630 | 1630 | 1600 | |
| Ligands | 131 | 31 | 31 | 31 | 31 | |
| B-factors mean [Å2] | ||||||
| Protein | 63 | 93 | 203 | 54 | 93 | |
| Ligand | 40 | 108 | 199 | 54 | 111 | |
| R.M.S deviations | ||||||
| Bond lengths (Å) | 0.002 | 0.005 | 0.003 | 0.004 | 0.004 | |
| Bond angles (°) | 0.688 | 1.240 | 0.736 | 0.779 | 1.055 | |
| Validation | ||||||
| Molprobity score | 1.9 | 1.6 | 1.8 | 2.3 | 1.9 | |
| Clashscore | 24.1 | 4.8 | 14.1 | 7.2 | 12.5 | |
| Poor rotamers (%) | 0 | 0.4 | 0 | 5.5 | 0 | |
| Ramachandran plot | ||||||
| Favored (%) | 98 | 96 | 97 | 96 | 95 | |
| Allowed (%) | 2 | 4 | 3 | 4 | 5 | |
| Disallowed (%) | 0 | 0 | 0 | 0 | 0 | |
-
*
Combined Alpo4ACH and Alpo4APO.
Key resources table
| Reagent type (species) or resource | Designation | Source or reference | Identifiers | Additional information |
|---|---|---|---|---|
| gene (Alvinella pompejana) | Alpo4 | GenBank | PLoS ONE 11(3): e0151183. doi:10.1371/journal.pone.0151183 | N/A |
| Cell line (Spodoptera frugiperda) | Sf9 | Thermo Fisher | CAS: 1149015 | Insect cells used for baculovirus production and expression of Alpo4 |
| chemical compound, drug | Lauryl Maltose Neopentyl Glycol; LMNG | Anatrace | CAS: 1257852-96-2 | Detergent used for the solubilization and purification of Alpo4 |
| chemical compound, drug | CHAPS (3-((3- cholamidopropyl) dimethylammonio)–1- propanesulfonate) | Anatrace | CAS: 75621-03-3 | Detergent used for the solubilization and purification of Alpo4 |
| chemical compound, drug | Acetylcholine chloride | Merck | CAS: 60-31-1 | Neurotransmitter |
| chemical compound, drug | Serotonin hydrochloride | Sigma-Aldrich | CAS: 153-98-0 | Neurotransmitter |
| chemical compound, drug | Graphene oxide | GO Graphene | N/A | Graphene Oxide Dispersion (1% Aqueous) |
| software, algorithm | CLC sequence manager 21.0.5 | Qiagen | N/A | |
| software, algorithm | SerialEM 3.0.8 | Mastronarde, 2005 | RRID:SCR_017293 | |
| software, algorithm | MotionCorr2 | Zheng et al., 2017 | RRID:SCR_016499 | |
| software, algorithm | CTFFIND-4.1 | Rohou and Grigorieff, 2015 | RRID:SCR_016732 | |
| software, algorithm | crYOLO 1.7.0 | Wagner et al., 2019 | RRID:SCR_018392 | |
| software, algorithm | Relion 3.0 | Zivanov et al., 2018 | RRID:SCR_016274 | |
| software, algorithm | cryoSPARC 2.11, cryoSPARC 3.2.0 | Punjani et al., 2017 | RRID:SCR_016501 | |
| software, algorithm | UCSF Chimera 1.13.1 | Pettersen et al., 2004 | RRID:SCR_004097 | |
| software, algorithm | Coot 0.9 | Casañal et al., 2020 | RRID:SCR_014222 | |
| software, algorithm | PHENIX 1.14 | Liebschner et al., 2019 | RRID:SCR_014224 | |
| software, algorithm | MolProbity | Williams et al., 2018 | RRID:SCR_014226 | |
| software, algorithm | ConSurf server | Ashkenazy et al., 2016 | RRID:SCR_002320 | |
| software, algorithm | UCSF ChimeraX 1.3 | Goddard et al., 2007 | RRID:SCR_015872 | |
| software, algorithm | The PyMOL Molecular Graphics System, Version 2.4.1 | Schrödinger, LLC | RRID:SCR_000305 | |
| Other | Quantifoil R2/1 Cu300 holey carbon grids | Quantifoil | N1-C15nCu30-01 | Electron microscopy grids used as a support to vitrify Alpo4 for cryo-EM studies |
| Cell line (Xenopus laevis) | Xenopus laevis oocytes | CRB Xénopes | XB-LAB-462 | Oocyte cells used for expression and functional characterization of Alpo4 |
| chemical compound, drug | Adapalene | Tokyo Chemical industry (TCI) | CAS: 106685-40-9 | |
| chemical compound, drug | Bemcentinib | TargetMol | CAS: 1037624-75-1 | |
| chemical compound, drug | Proscillaridin A | Sigma-Aldrich | CAS: 466-06-8 | |
| chemical compound, drug | Diosgenin | Fluorochem | CAS: 512-04-0 | |
| chemical compound, drug | CHAPSO (3-[(3-Cholamidopropyl)dimethylammonio]–2-Hydroxy-1-Propanesulfonate) | Anatrace | CAS: 82473-24-3 | |
| chemical compound, drug | CHEMS Cholesteryl hemisuccinate; | Anatrace | CAS: 102601-49-0 | |
| chemical compound, drug | Glycine | Sigma-Aldrich | CAS: 56-40-6 | Neurotransmitter |
| chemical compound, drug | GABA (γ-Aminobutyric acid) | Sigma-Aldrich | CAS: 56-12-2 | Neurotransmitter |
| software, algorithm | MTiOpenScreen | Ressource Parisienne en BioInformatique Structurale | Nucleic Acids Res 1;43(W1):W448-54. DOI:10.1093/nar/gkv306 | Online server used for virtual screening |
| software, algorithm | AutoDock Vina | Dr. Oleg Trott in the Molecular Graphics Lab (CCSB) at The Scripps Research Institute. | J. Chem. Inf. Model. 2021, 61, 8, 3891–3,898. DOI: 10.1021/acs.jcim.1c00203. | Software used for docking |
| Commercial assay, kit | mMESSAGE mMACHINE T7 ULTRA Transcription Kit | Invitrogen | Catalog No. AM1345 | Kit used to transcribe RNA for functional studies of Alpo4 |
Additional files
-
Supplementary file 1
Channel parameter values for anionic pentameric ligand-gated ion channels.
Ion channel PDB identifiers, channel conformation, ligands, and narrowest constriction residues are listed.
- https://cdn.elifesciences.org/articles/86029/elife-86029-supp1-v2.docx
-
Supplementary file 2
The top hits from virtual screening.
Name of the compounds, their CID number, and average binding energies across the top five docking poses are shown. Binding energies for acetylcholine, GABA, and glycine are shown for comparison.
- https://cdn.elifesciences.org/articles/86029/elife-86029-supp2-v2.docx
-
MDAR checklist
- https://cdn.elifesciences.org/articles/86029/elife-86029-mdarchecklist1-v2.docx
Download links
A two-part list of links to download the article, or parts of the article, in various formats.
Downloads (link to download the article as PDF)
Open citations (links to open the citations from this article in various online reference manager services)
Cite this article (links to download the citations from this article in formats compatible with various reference manager tools)
Sterol derivative binding to the orthosteric site causes conformational changes in an invertebrate Cys-loop receptor
eLife 12:e86029.
https://doi.org/10.7554/eLife.86029


