Structures of NF-κB p52 homodimer-DNA complexes rationalize binding mechanisms and transcription activation
- Faculty of Health Sciences, University of Macau, China
- Department of Physics, Chinese University of Hong Kong, Hong Kong
- Department of Chemistry and Biochemistry, University of California, San Diego, United States
- MoE Frontiers Science Center for Precision Oncology, University of Macau, Macao
- Cancer Centre, Faculty of Health Sciences, University of Macau, China
Figures
Figure 1 with 2 supplements
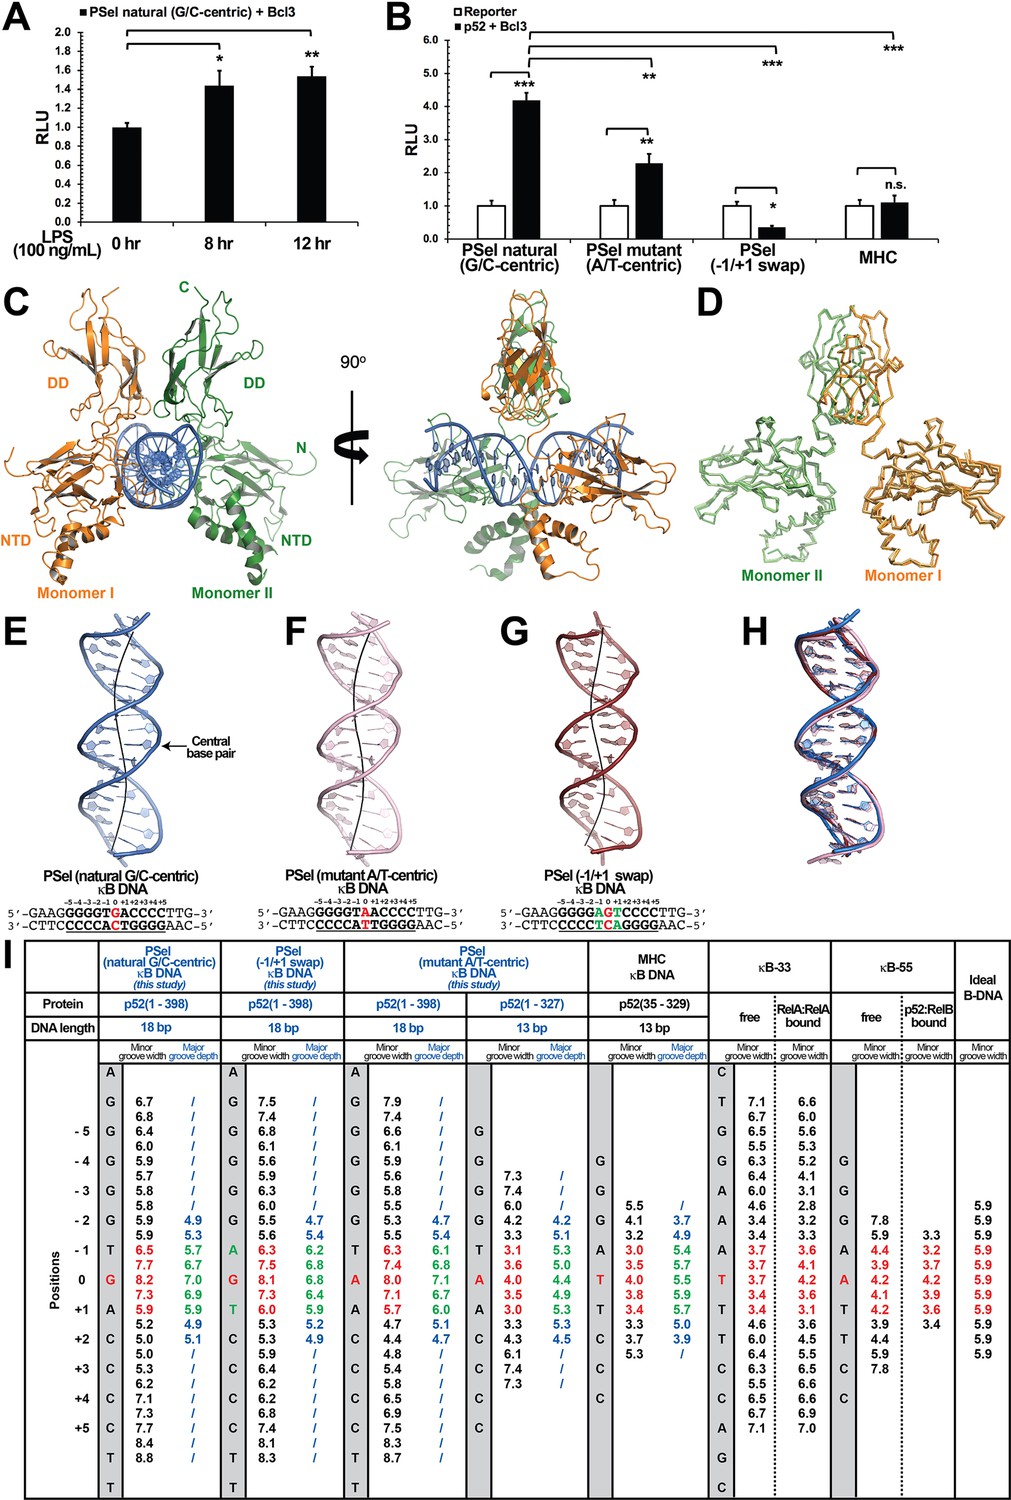
Crystal structures of p52:p52 homodimer in complex with PSel-κB DNA variants reveal distinct signatures.
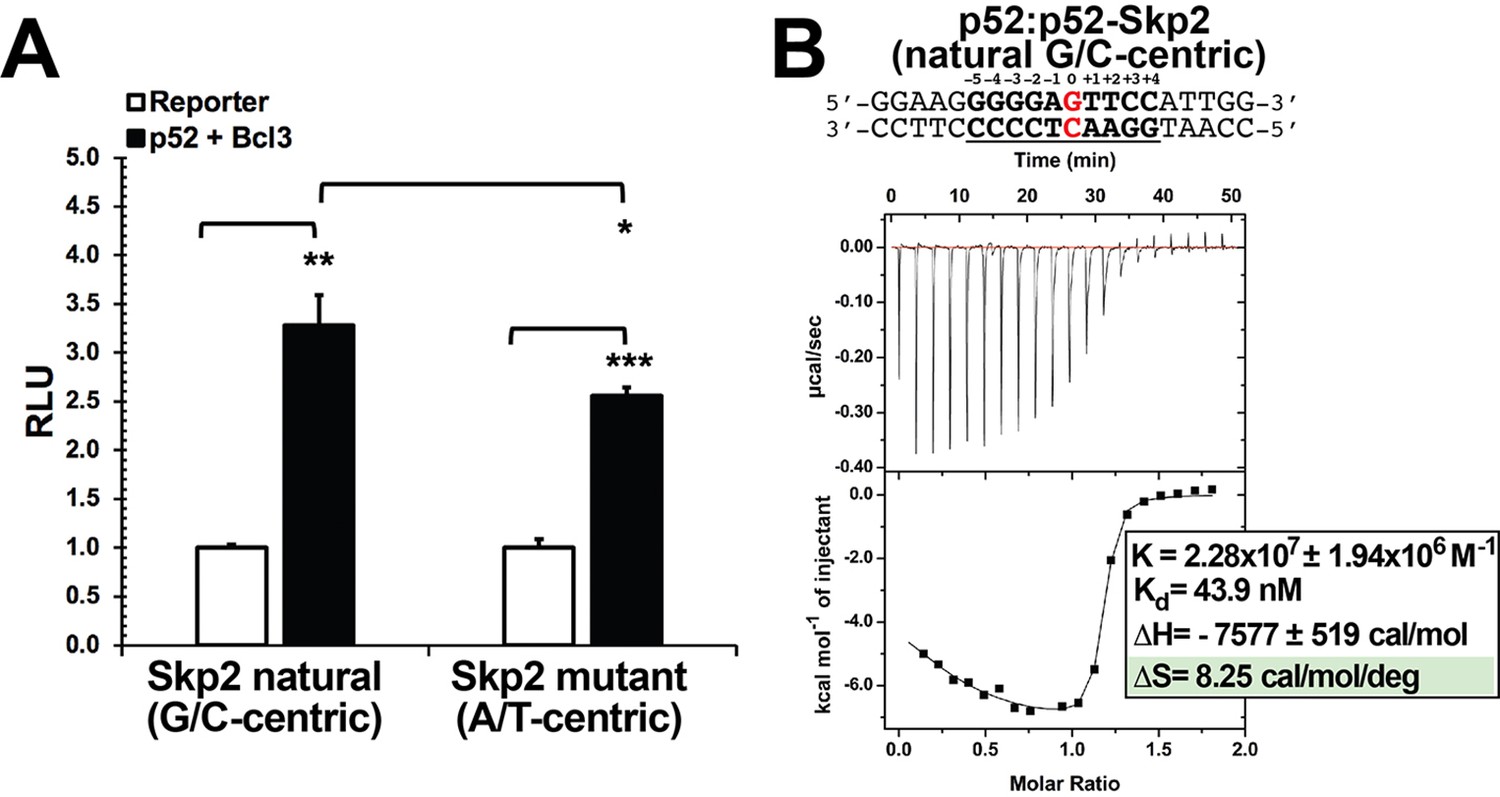
(A) The natural G/C-centric PSel luciferase reporter was activated by endogenous NF-κB with LPS stimulation and Bcl3 co-expression. The data were analyzed from three independent experiments performed in triplicate. RLU, relative luciferase unit. *p<0.05; **p<0.01 (t test). Error bars represent standard deviation (SD). (B) Luciferase reporter activity driven by co-expression of p52 and Bcl3 was reduced when the natural G/C-centric PSel site was mutated to A/T-centric or −1/+1 swap sites; and the MHC luciferase reporter was not activated by p52:p52:Bcl3 complex. The data were analyzed from three independent experiments performed in triplicate. *p<0.05; **p<0.01; ***p<0.001; n.s., not significant (t test). Error bars represent SD. (C) Overall structure of p52:p52 in complex with the natural G/C-centric PSel-κB DNA. (Left) Ribbon diagram showing the entire complex viewed down the DNA helical axis. The two p52 monomers are shown in orange (monomer I) and green (monomer II), respectively; and the DNA duplex is shown in blue; (Right) View of the complex after rotating 90° along the vertical axis. (D) Overlay p52:p52 homodimers in three PSel-κB DNA variants by their dimerization domain (DD). Monomer I is shown in tv_orange, bright orange, and light orange; monomer II is shown in forest, tv_green, and lime in the natural G/C-centric, mutant A/T-centric, and −1/+1 swap complexes. All three structures are presented as backbone traces. (E–G) Structure of the 18 bp PSel-κB DNAs with (E) natural G/C-centric (blue), (F) mutant A/T-centric (light pink), and (G) −1/+1 swap (ruby). The DNA bps as observed in the co-crystal structures are shown in filled sticks. The view is onto the central minor groove. The nucleotide sequences used in co-crystallization are shown at the bottom, with κB DNA underlined and numbering scheme indicated above; the central position 0 is highlighted in red, and the swap of −1 and +1 positions is highlighted in green. (H) Overlay of natural G/C-centric, mutant A/T-centric, and−1/+1 swap PSel-κB DNAs in (E–G). (I) Table showing minor groove widths and major groove depths (Å); the ideal B-form DNA was built using Coot program (Emsley and Cowtan, 2004; Emsley et al., 2010) based on the sequence of PSel-κB DNA. The minor groove widths at the central region from position −1 to +1 are shown in red, and the corresponding major groove depths are shown in green. Geometrical parameters and the helical axes were calculated with Curves+. Groove widths are measured as minimal distances between the backbone spline curves passing through the phosphorus atoms; values are given at base pair levels and halfway between these levels (Blanchet et al., 2011; Lavery et al., 2009). LPS, lipopolysaccharide.
Figure 1—figure supplement 1

p52 and DNA crystallization.
(A) Domain organization of the precursor protein p100/NF-κB2 and the processed p52. (B) Primary sequence of human p52 RHR. The secondary structures are mapped on top of the sequence. DNA base-specific contacting residues are denoted by red and backbone contacting residues are marked by green circle. NLS and GRR regions are highlighted in cyan and purple, respectively. (C) Co-expression of p52 and Bcl3, but not either one alone, activates the natural PSel luciferase reporter. The data were analyzed from three independent experiments performed in triplicate. RLU, relative luciferase unit. ***p<0.001 (t test). Error bars represent SD. (D) Biolayer interferometry (BLI) binding analysis of His-tagged-Bcl3 protein to immobilized biotin labeled natural PSel-κB DNA; the result indicated Bcl3 does not interact with κB DNA without p52 protein. (E, F) BLI binding analysis of (E) short p52:p52 (aa 1–327) and (F) long p52:p52 (aa 1–398) protein to immobilized His-tagged-Bcl3. The results showed only the long p52:p52 (aa 1–398) interacts with Bcl3 in (F). (G) Analytical Superdex-200-Increase size exclusion chromatography elution profile showing the long p52:p52 (aa 1–398) but not the short p52:p52 (aa 1–327) homodimer forms complex with Bcl3. (H) SDS-PAGE analysis indicating the p52:p52:Bcl3 complex formation in (G).
-
Figure 1—figure supplement 1—source data 1
Raw image of SDS-PAGE gels in Figure 1—figure supplement 1H, with label.
- https://cdn.elifesciences.org/articles/86258/elife-86258-fig1-figsupp1-data1-v2.pdf
-
Figure 1—figure supplement 1—source data 2
Raw image of SDS-PAGE gels in Figure 1—figure supplement 1H, without label.
- https://cdn.elifesciences.org/articles/86258/elife-86258-fig1-figsupp1-data2-v2.pdf
-
Figure 1—figure supplement 1—source data 3
Raw image of SDS-PAGE gels in Figure 1—figure supplement 1H, with label.
- https://cdn.elifesciences.org/articles/86258/elife-86258-fig1-figsupp1-data3-v2.pdf
-
Figure 1—figure supplement 1—source data 4
Raw image of SDS-PAGE gels in Figure 1—figure supplement 1H, without label.
- https://cdn.elifesciences.org/articles/86258/elife-86258-fig1-figsupp1-data4-v2.pdf
Figure 1—figure supplement 2

κB DNA conformations.
(A) Structure of the κB-55 DNA in the (Left) p52:RelB-bound and (Right) free forms; free κB-55 DNA structure was obtained serendipitously where two κB-55 DNA molecules were found in the crystal, with one bound to the p52:RelB heterodimer and the other remained free (Fusco et al., 2009). (B) Structure of the 20 bp κB-33 DNA in the (Left) RelA:RelA-bound (Chen et al., 1998a) and (Right) free forms (Huang et al., 2005). (C) Structure of (Left) the 13 bp MHC-κB DNA (Cramer et al., 1997) and (Right) overlay of natural G/C-centric PSel-κB DNA (in blue) with MHC-κB DNA (in gray), showing the widened minor groove in PSel-κB DNA. (D) Structure of (Left) short 13 bp PSel (mutant A/T) κB DNA duplex in the co-crystal structure with short p52:p52 (aa 1–327) (in pink); overlay of 13 bp PSel (mutant A/T) DNAs (in pink) with (Middle) the long 18 bp PSel (mutant A/T) (in light pink), and (Right) the 13 bp MHC-κB DNA (in gray). The DNA bps as observed in the co-crystal structures are shown in filled sticks. The view is onto the central minor groove. The nucleotide sequences used in co-crystallization are shown at the bottom, with κB DNA underlined and numbering scheme indicated above. (E) Table showing various nucleotide sequences used in co-crystallization with different NF-κB dimers The various NF-κB protein constructs used are also indicated. The κB DNAs are shown in bold, bases making contacts with NF-κB proteins are underlined, and the numbering scheme are indicated. The central bps are highlighted in red. The p52 protein construct and DNA sequences used in the current study are in blue. The MGW(s) from position −1 to 0 are listed. Geometrical parameters were calculated with Curves+ (Blanchet et al., 2011; Lavery et al., 2009).
Figure 2
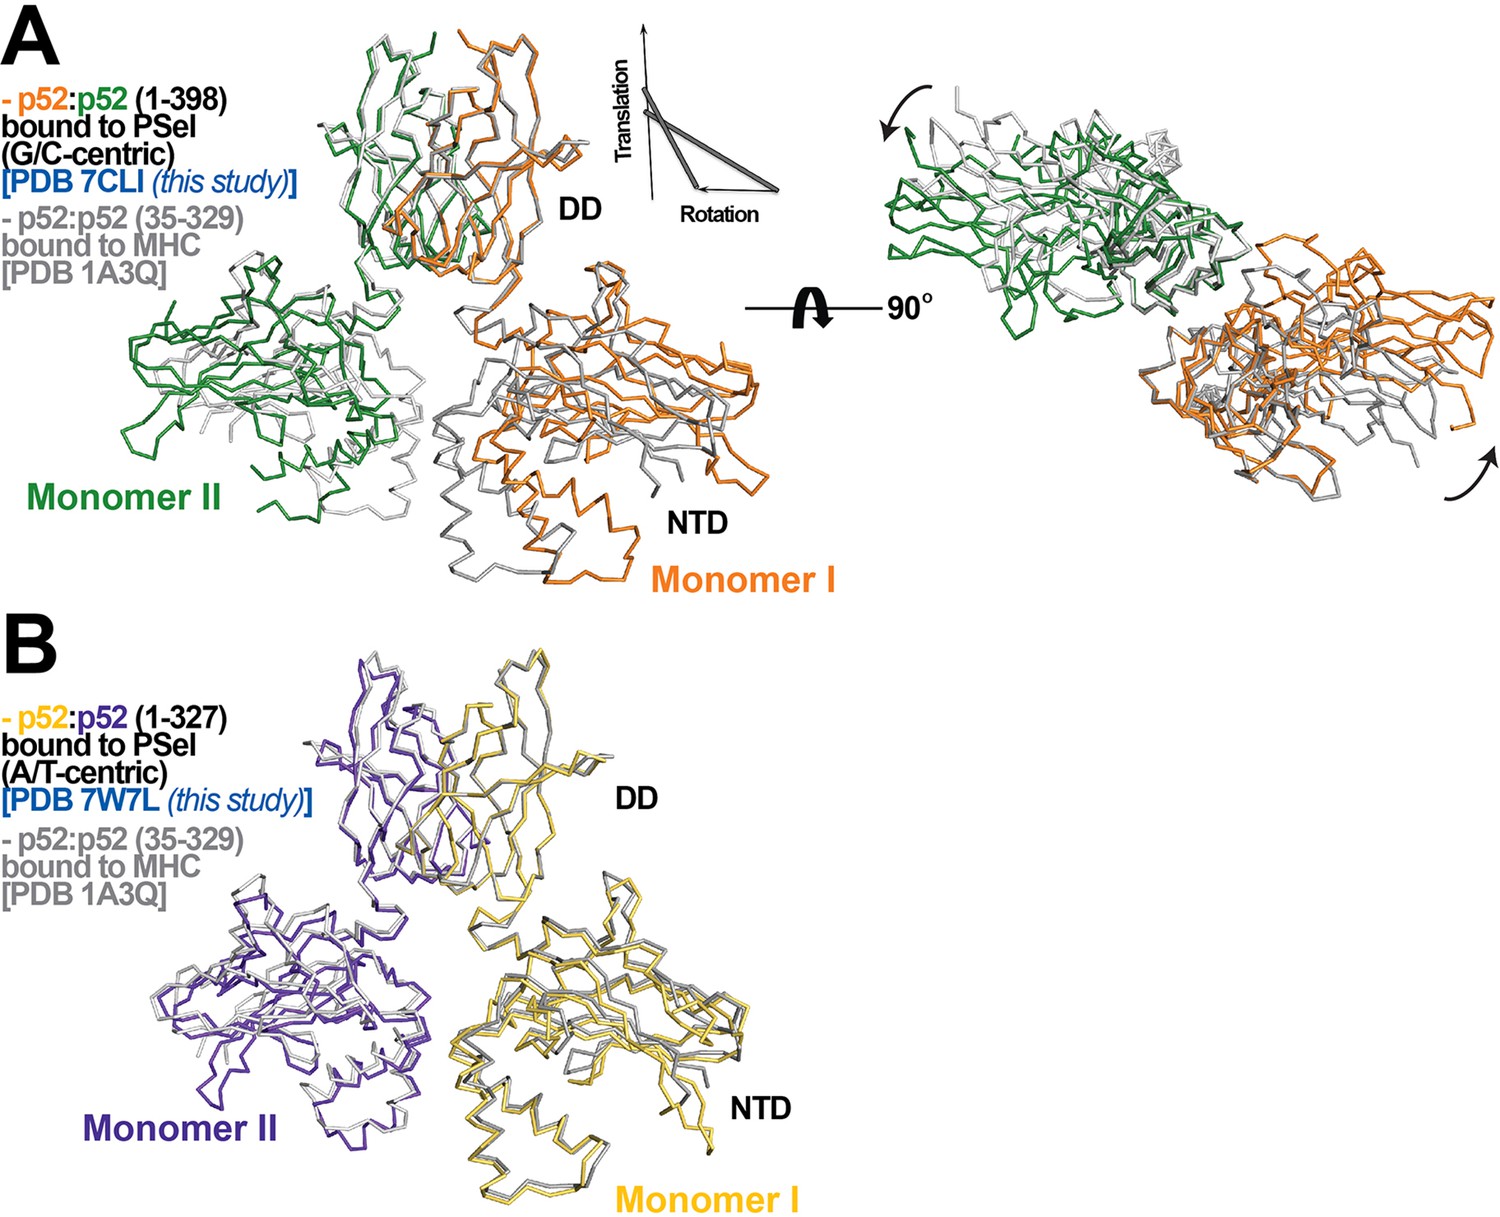
p52:p52 dimer conformations.
(A) (Left) Overlay of p52:p52 (aa 1–398) in complex with the 18 bp natural G/C-centric PSel-κB DNA (PDB 7CLI, this study) (in orange and green for monomers I and II, respectively) and p52:p52 (aa 35–329) in complex with the MHC-κB DNA (PDB 1A3Q) (in gray). Diagram explains rigid-body movement of the NTD. (Right) View of the complex after rotating 90° along the horizontal axis. Both protein structures are presented as backbone traces. (B) Overlay of the short p52:p52 (aa 1–327) in complex with the 13 bp PSel (mutant A/T-centric)-κB DNA (PDB 7W7L, this study) (in yellow orange and purple blue for monomers I and II, respectively) and p52:p52 (aa 35–329) in complex with the MHC-κB DNA (PDB 1A3Q) (in gray).
Figure 3 with 1 supplement
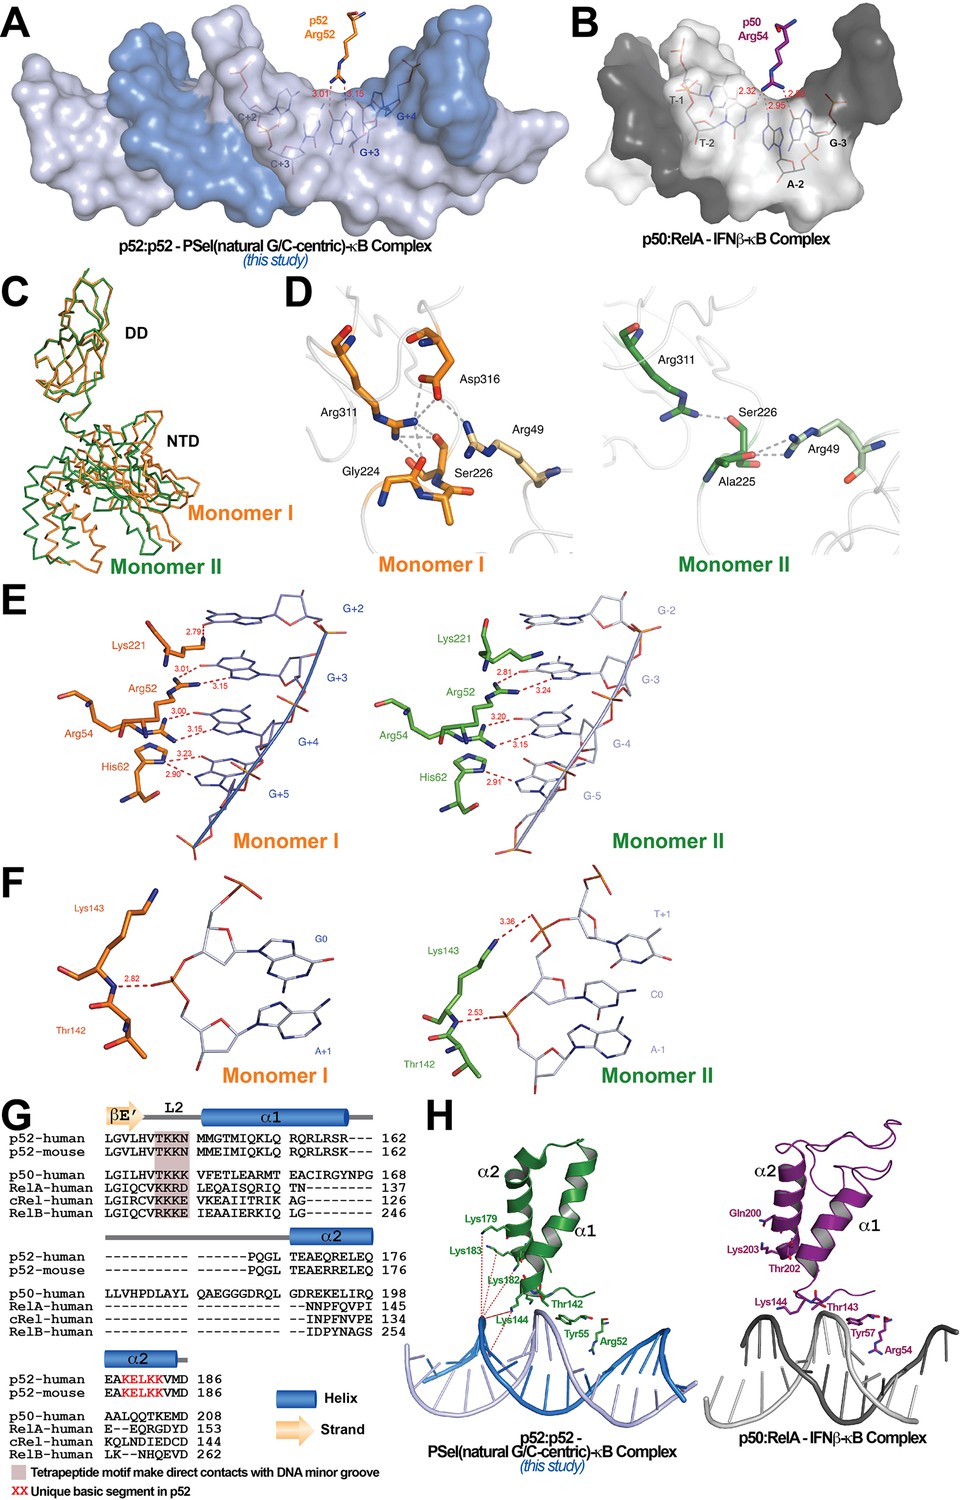
Protein-DNA contacts.
(A) Arg52 of p52 in the PSel-κB complex (PDB 7CLI, this study) only makes base-specific contacts with G at +3 position. (B) The corresponding Arg54 of p50 in the p50:RelA-IFNb-κB complex (PDB 1LE5) makes base-specific contacts with A at −2 and G at −3 positions as well as additional cross-strand contacts with T at −2 position. (C) Conformational differences between two p52 monomers in complex with the 18 bp natural G/C-centric PSel-κB DNA (PDB 7CLI, this study) are shown by superposing their DDs. The two monomers are presented as backbone traces. (D) Hydrogen bonding network at the interdomain interface between DD and NTD in each p52 monomer. In monomer I, the two domains form contacts with each other through a wide network of H-bonds between the side chains of Arg49 from the NTD and Gly224, Ser226, Arg311, and Asp316 from the DD; whereas in monomer II, there are only contacts between Arg49 and Ala225, as well as Ser226 and Arg311. Residues from NTD are colored in lighter orange and lighter green for monomers I and II, respectively. (E) DNA based-specific contacts made by Arg52, Arg54, His62, and Lys221 of p52 (Left) monomer I and (Right) monomer II in complex with the natural PSel-κB DNA. H-bonds are indicated as red dotted lines with distances labeled. Noted that Lys221 in monomer II is in a different conformation and has no specific contacts with DNA. (F) DNA backbone contacts made by Lys143 of p52 (Left) monomer I and (Right) monomer II. (G) Sequence alignment showing the unique basic segment in p52 among all NF-κB family members. Both human and mouse sequences of the p52 subunit are shown. Only human sequences are shown for the rest of the family members. Secondary structures and connecting loops are drawn above the sequences. (H) (Left) The unique basic segment in p52 NTD helix α2 interacts with PSel-κB DNA in the present structure (PDB 7CLI, this study); (Right) these interactions are absent in p50 subunit in the p50:RelA-IFNb-κB complex (PDB 1LE5).
Figure 3—figure supplement 1
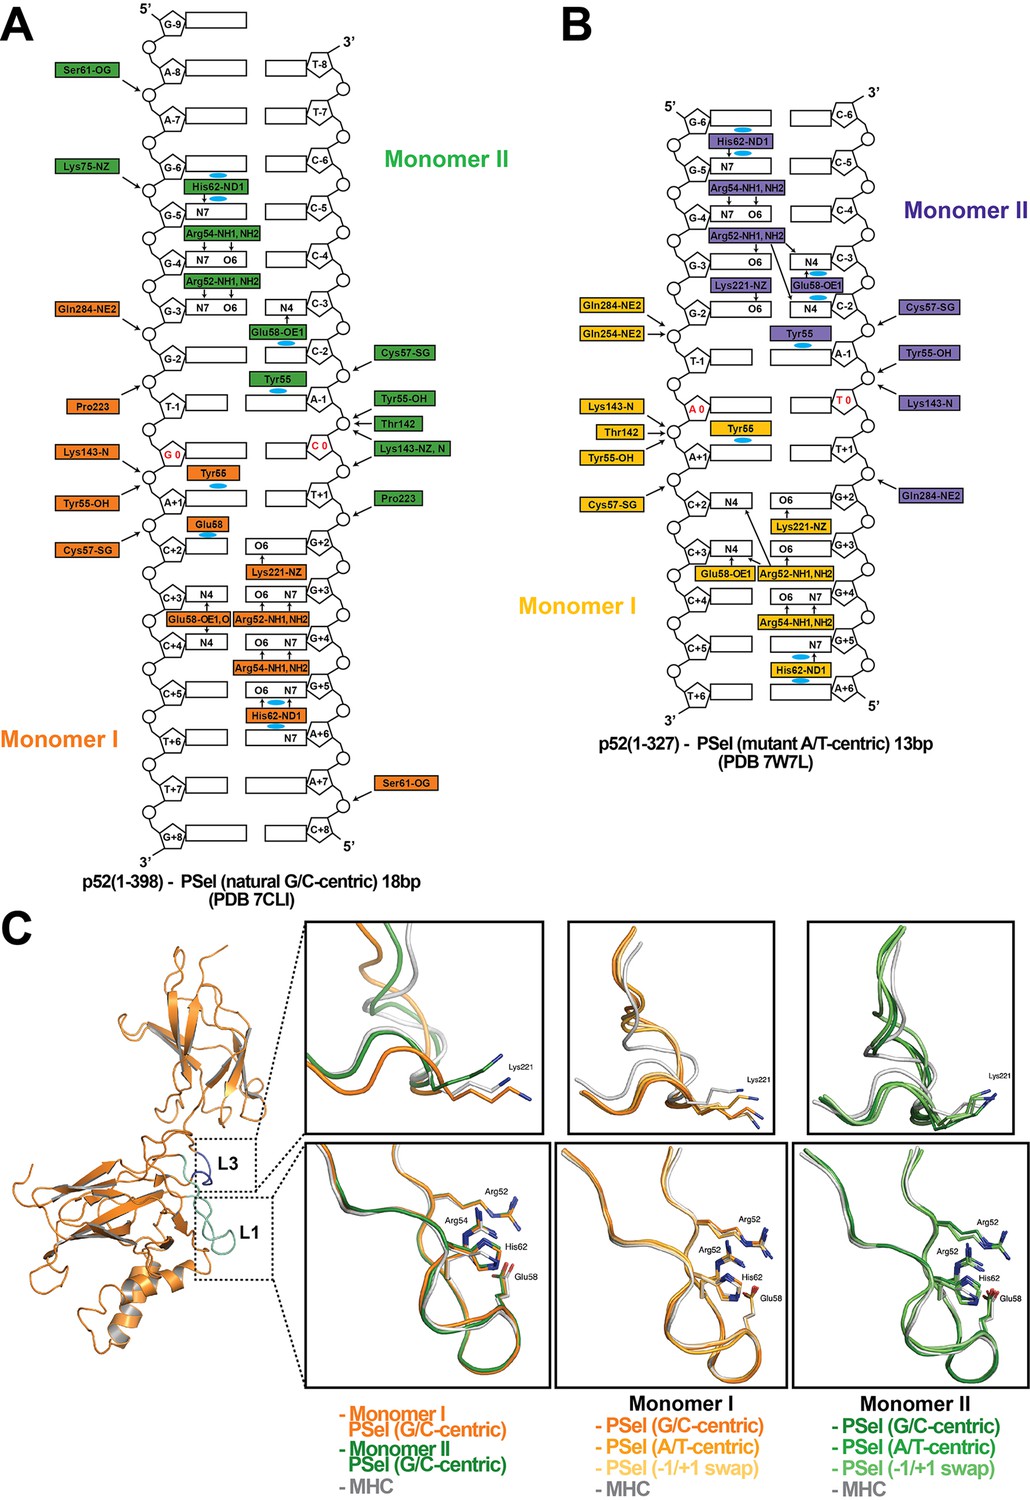
Asymmetric p52 monomers.
(A, B) Schematic representation of the DNA contacts made by (A) the long p52:p52 (aa 1–398) with the 18 bp natural PSel-κB DNA (PDB 7CLI); and (B) the short p52:p52 (aa 1–327) with the 13 bp PSel (mutant A/T)-κB DNA (PDB 7W7L). Two colors indicate two different monomers within the complex. Arrows indicate H-bonds; cyan circles indicate van der Waals interactions. Arg52(s) from both monomers make cross-strand DNA contacts in (B) but not in (A). (C) Ribbon diagram of p52 monomer I, loops L1 (cyan), and L3 (blue) are highlighted. Residues in these two loops make base-specific contacts with DNA. The zoom-in views show overlays of loops L1 and L3 in (p52:p52)-PSel and (p52:p52)-MHC complexes with indicated colors.
Figure 4 with 2 supplements
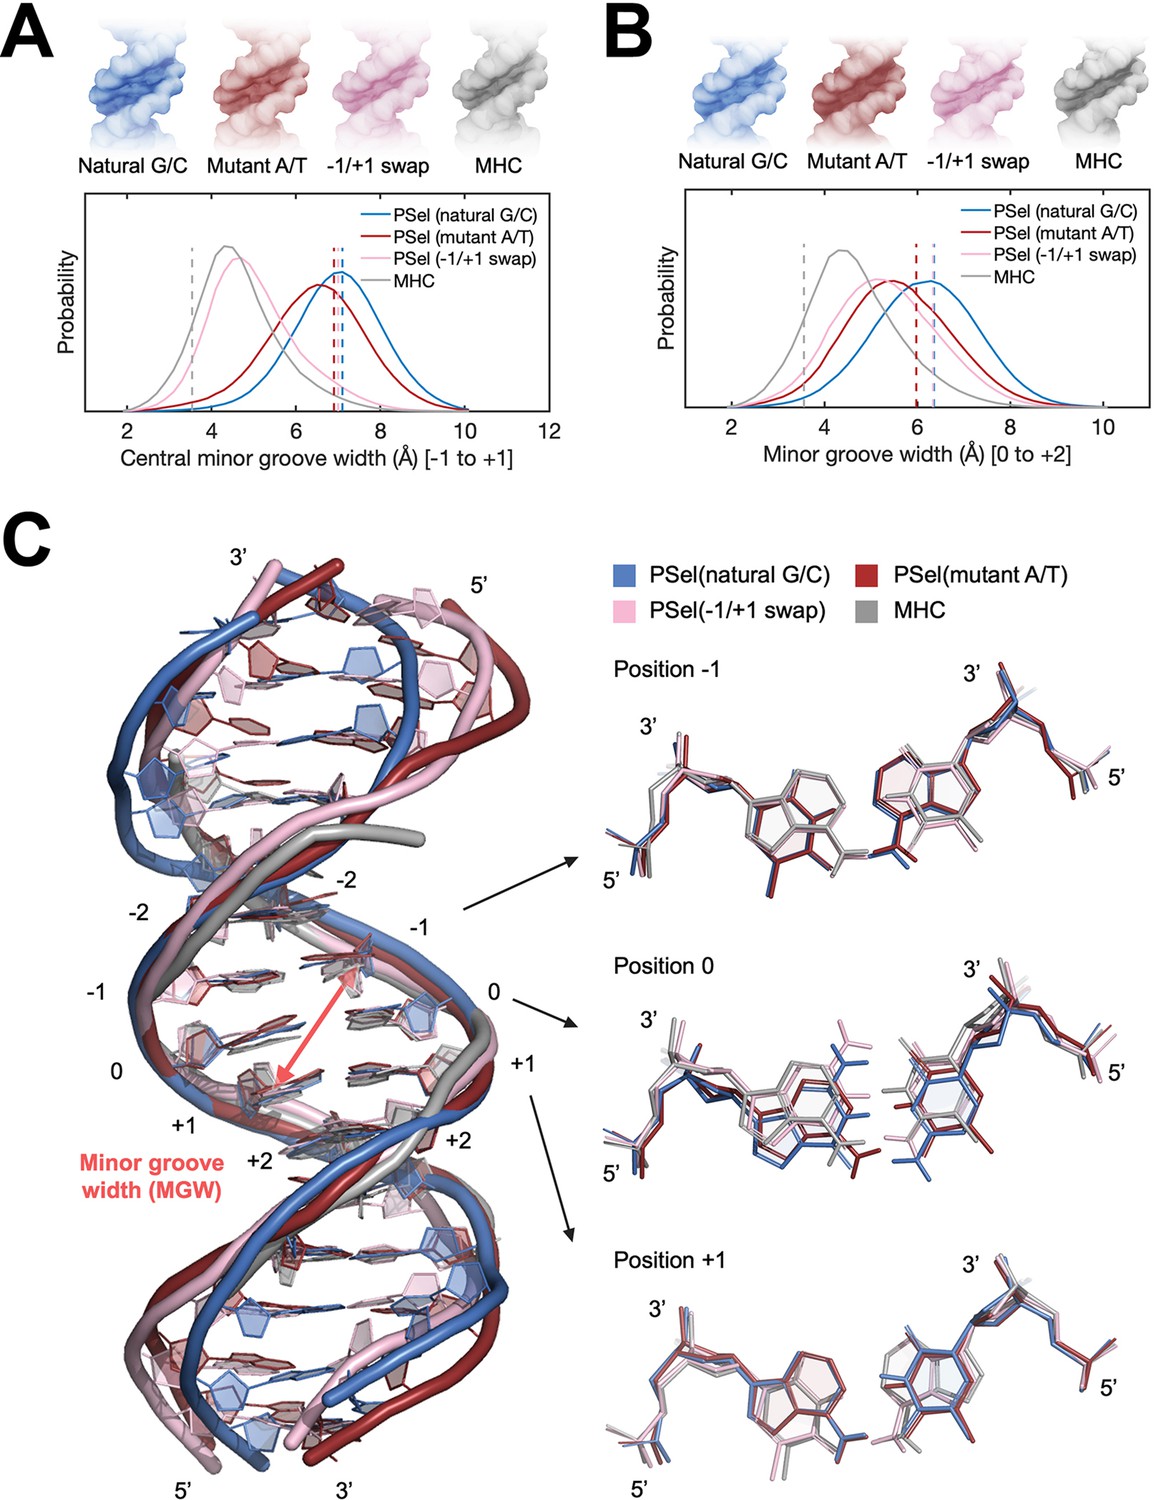
MD simulations for free κB DNAs.
(A, B) Statistics of the minor groove width over the aggregated 10-µs simulations of each system at (A) the central 0 position (averaged over the five levels from −1 to +1 positions) and (B) the +1 position (averaged over the five levels from 0 to +2 positions). (Upper) DNA isosurface at 0.2 isovalue (20% occupancy); (Lower) Probability distribution of minor groove width. Dashed lines show the minor groove width in the (p52:p52)-bound crystal structures. (C) Representative structures of natural G/C-centric, mutant A/T-centric, −1/+1 swap PSel-κB DNAs, and MHC-κB DNA revealed from MD simulations. (Left) Superimposed structures showing the narrowed central minor groove on −1/+1 swap DNAs; (Right) Representative conformations of bps at −1, 0, and +1 positions revealed from MD simulations. Minor groove width was calculated with Curves+ (Blanchet et al., 2011; Lavery et al., 2009). MD, molecular dynamics.
Figure 4—figure supplement 1
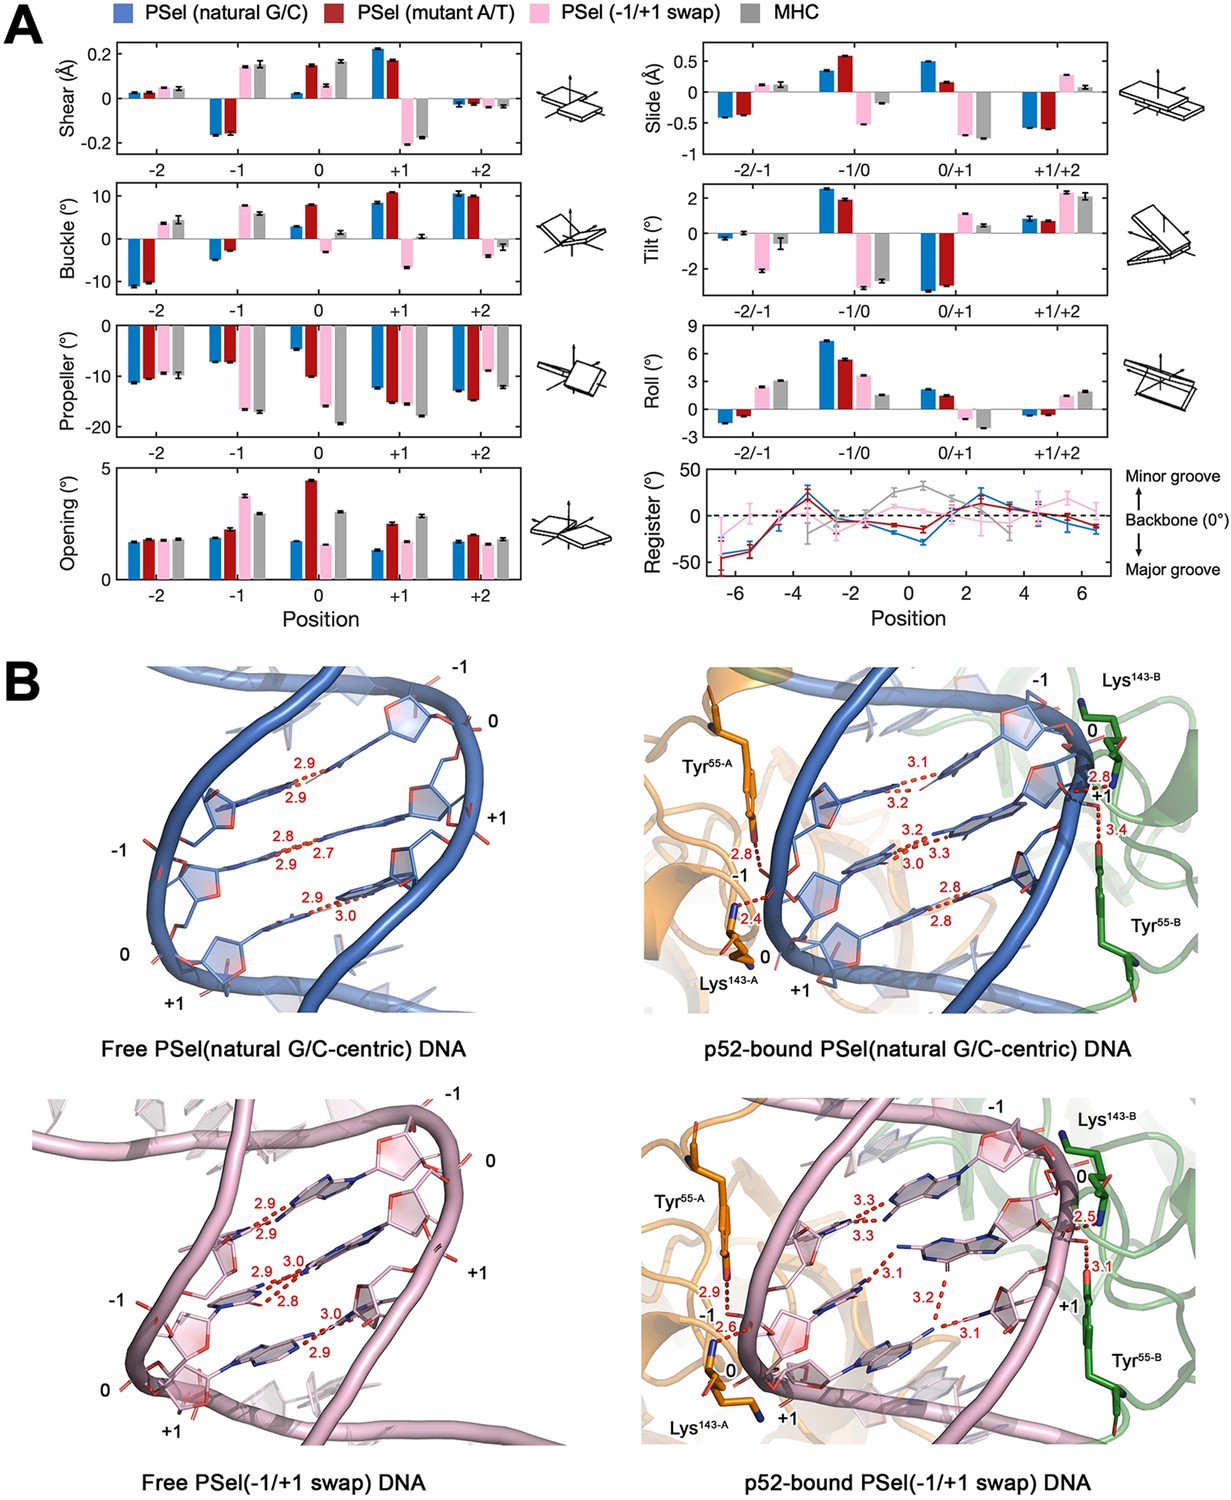
Free DNA simulations.
(A) Geometric parameters at −2 to +2 positions revealed in the MD simulations. The swap of T and A at ±1 positions causes an opposite shear and buckle of the nucleotide, which leads to a slide and tilt of the central bps toward the minor groove in −1/+1 swap DNA and therefore narrows the central minor grooves; A:T has a larger shear and opening at the 0 position compared to G:C which might have led to the decrease in minor groove width at +1 position. Geometrical parameters and the helical axes were calculated with Curves+ (Blanchet et al., 2011; Lavery et al., 2009). Corresponding schematic images of each parameter are viewed from the minor groove and shown in the positive sense. Error bars represent standard error of the mean computed from the five replica simulations of a given system. (B) Structure of natural G/C-centric and −1/+1 swap PSel-κB DNA in (Left) free forms from MD simulations and (Right) (p52:p52)-bound forms from crystal structures. Red dashed lines represent the intermolecular H-bonds formed at DNA’s central part. MD, molecular dynamics.
Figure 4—figure supplement 2
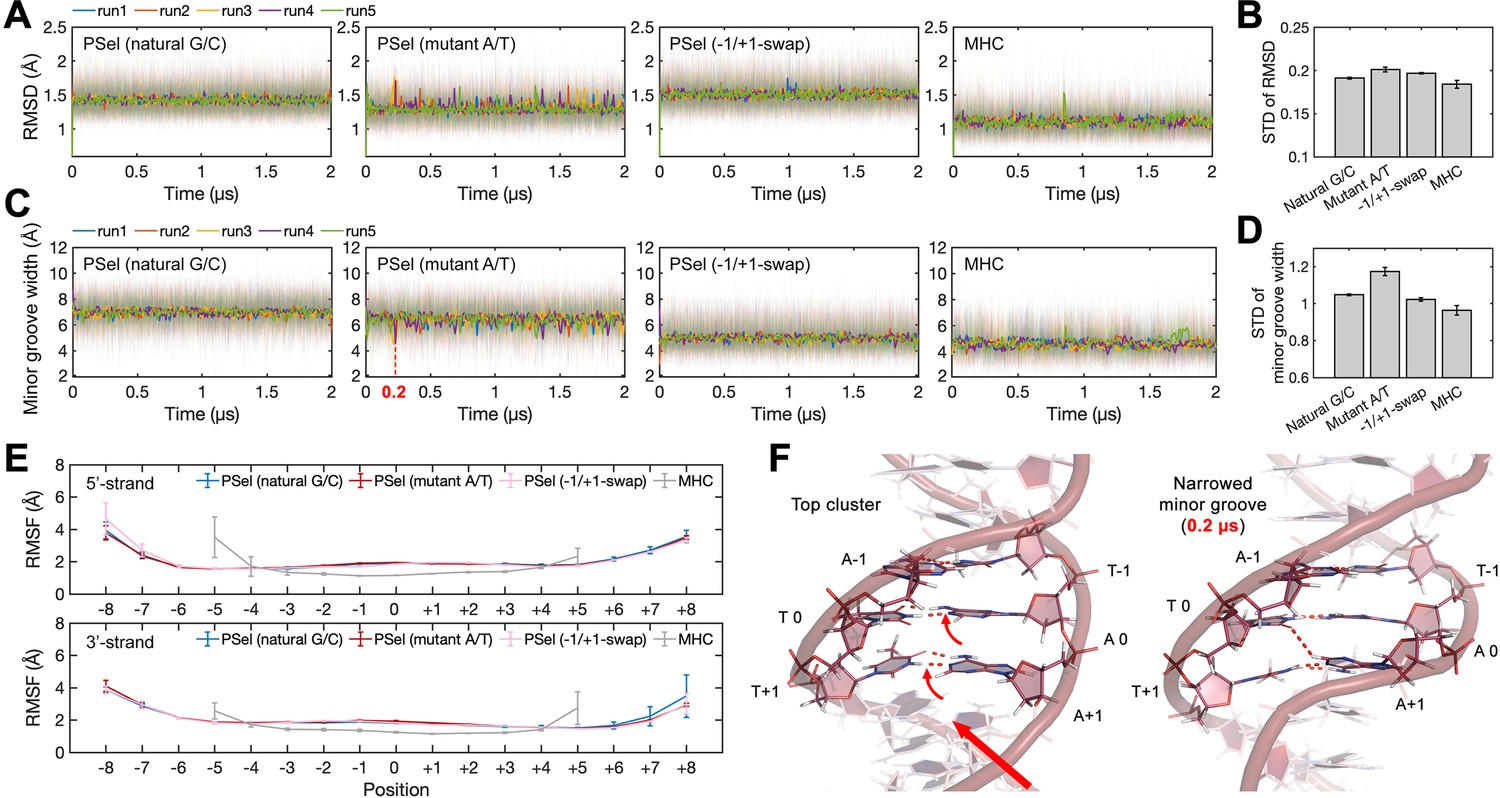
DNA conformations in MD simulations.
(A) Root-mean-square deviation (RMSD) of DNA central parts (−2 to +2 positions) during MD simulations and (B) the corresponding standard deviation (STD). (C) Minor groove width at position 0 during MD simulations and (D) the corresponding STD. (E) Root-mean-square fluctuation (RMSF) of DNAs. (F) Snapshots of PSel (mutant A/T) showing that the cross-strand H-bonds formed by the propeller twist of at +1 position further narrowed the minor groove (indicated by the dashed line in panel (C)). Both RMSD and minor groove width show less structural stability at the central part of PSel (mutant A/T-centric), which may be attributed to the occasionally formed cross-strand H-bonds. Error bars represent standard error of the mean computed from the five replica simulations of a given system. MD, molecular dynamics.
Figure 5 with 2 supplements

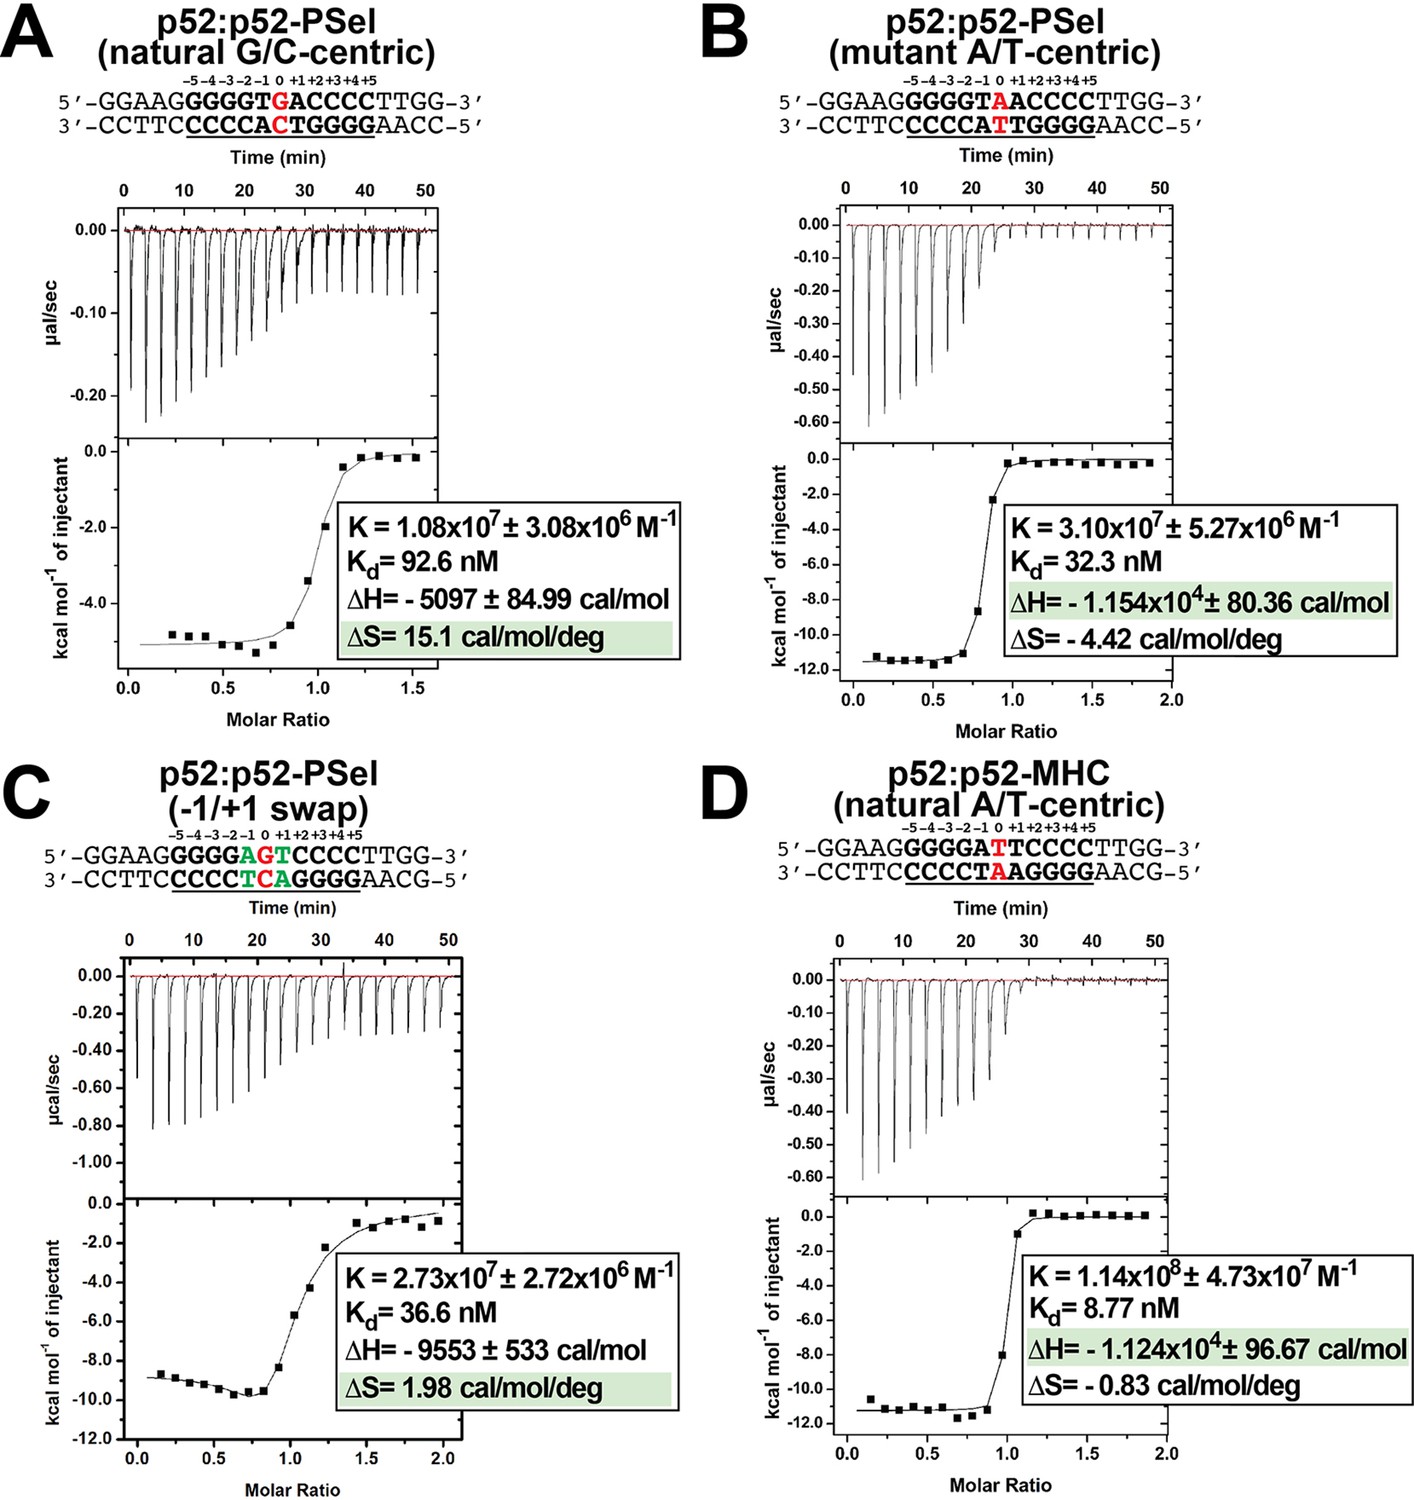
p52 binds κB DNAs with different thermodynamic features.
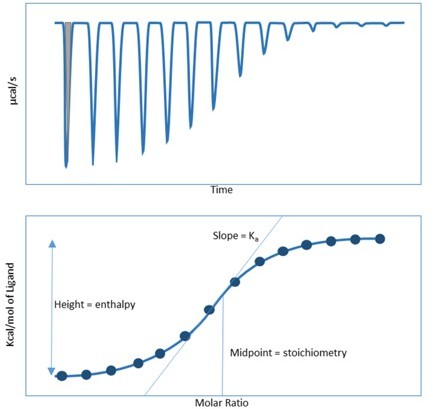
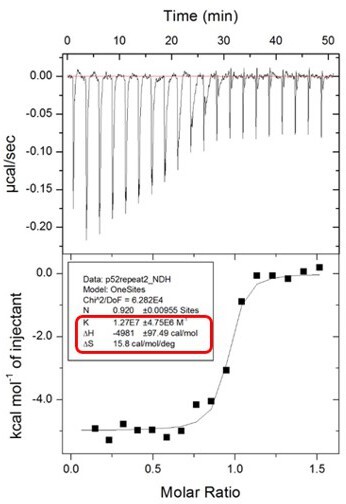
(A–D) Calorimetric titration data showing the binding of recombinant p52:p52 (aa 1–398) homodimer with (A) natural G/C-centric, (B) mutant A/T-centric, (C) −1/+1 swap PSel-κB, and (D) MHC-κB DNAs. The top panel of the ITC figures is the raw data plot of heat flow over time for the titration of 300 μM of indicated DNA into 35 µM of p52; the bottom panel shows the corresponding plot after integration of peak areas and normalization to yield a plot of ΔH against the DNA/p52 ratio and the line represents the best fit to the data according to a single-site binding model. The determined Kd, changes of enthalpy and entropy are shown on the bottom panel. ITC, isothermal titration calorimetry.
Figure 5—figure supplement 1
Repeat ITC experiments in Figure 5.
(A–D) Calorimetric titration data showing the binding of recombinant p52:p52 (aa 1–398) homodimer with (A) natural G/C-centric, (B) mutant A/T-centric, (C) −1/+1 swap PSel-κB, and (D) MHC-κB DNAs. The top panel of the ITC figures represent the binding isotherms; the bottom panel shows the integrated heat of the reaction and the line represents the best fit to the data according to a single-site binding model. ITC, isothermal titration calorimetry.
Figure 5—figure supplement 2
p52 interacts with Skp2-κB DNA.
(A) The natural G/C-centric Skp2 luciferase reporter activity driven by co-expression of p52 and Bcl3; the corresponding A/T-centric mutant showed less transcription activity. The data were analyzed from three independent experiments performed in triplicate. RLU, relative luciferase unit. *p<0.05; **p<0.01; ***p<0.001 (t test). Error bars represent SD. (B) Calorimetric titration data showing the binding of recombinant p52:p52 homodimer with Skp2 G/C-centric κB DNA. The top panel of the ITC figures represent the binding isotherms; the bottom panel shows the integrated heat of the reaction and the line represents the best fit to the data according to a single-site binding model. The determined Kd, changes of enthalpy and entropy are shown on the bottom panel. ITC, isothermal titration calorimetry.
Figure 6 with 2 supplements
p52 binds the natural transcriptionally active G/C-centric PSel-κB DNA with faster kinetics.
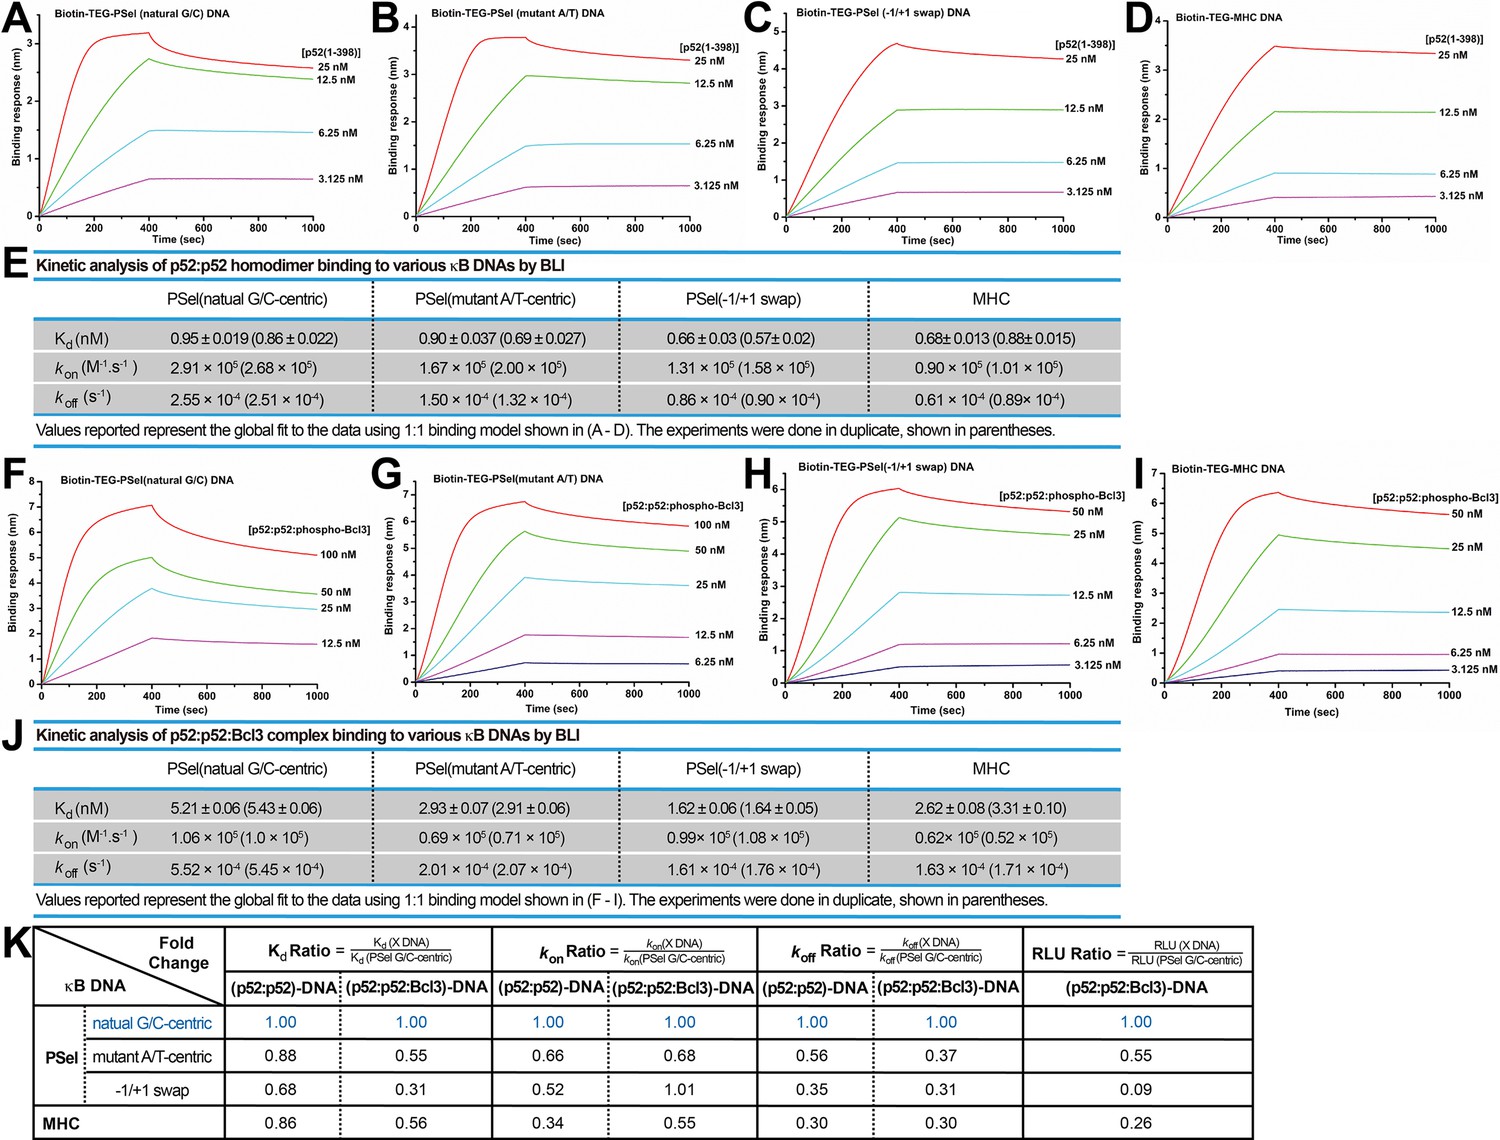
(A–D) Biolayer interferometry (BLI) binding analysis of p52:p52 (aa 1–398) homodimer to immobilized biotin labeled (A) natural G/C-centric, (B) mutant A/T-centric, (C) −1/+1 swap PSel-κB, and (D) MHC-κB DNAs. The differences in kon and koff can be seen in the shapes of the association and dissociation curves. Each experiment was done in duplicate and one representative set of curves is shown. (E) Table showing the kinetic analysis in (A–D). (F–I) BLI binding analysis of p52:p52:Bcl3 complex to immobilized biotin labeled (F) natural G/C-centric, (G) mutant A/T-centric, (H) −1/+1 swap PSel-κB, and (I) MHC-κB DNAs. Each experiment was done in duplicate and one representative set of curves is shown. (J) Table showing the kinetic analysis in (F–I). (K) Table summarizing the fold change of Kd, kon, and koff with respect to the more transcriptionally active G/C-centric PSel-κB DNA. The average values of the duplicated kinetics data in (A–J) and the relative reporter activities in RLU from Figure 1A–B were used for ratio calculations. The numbers for the greater reporter active G/C-centric PSel are shown in blue.
Figure 6—figure supplement 1
p52 and Skp2-κB DNA binding kinetics.
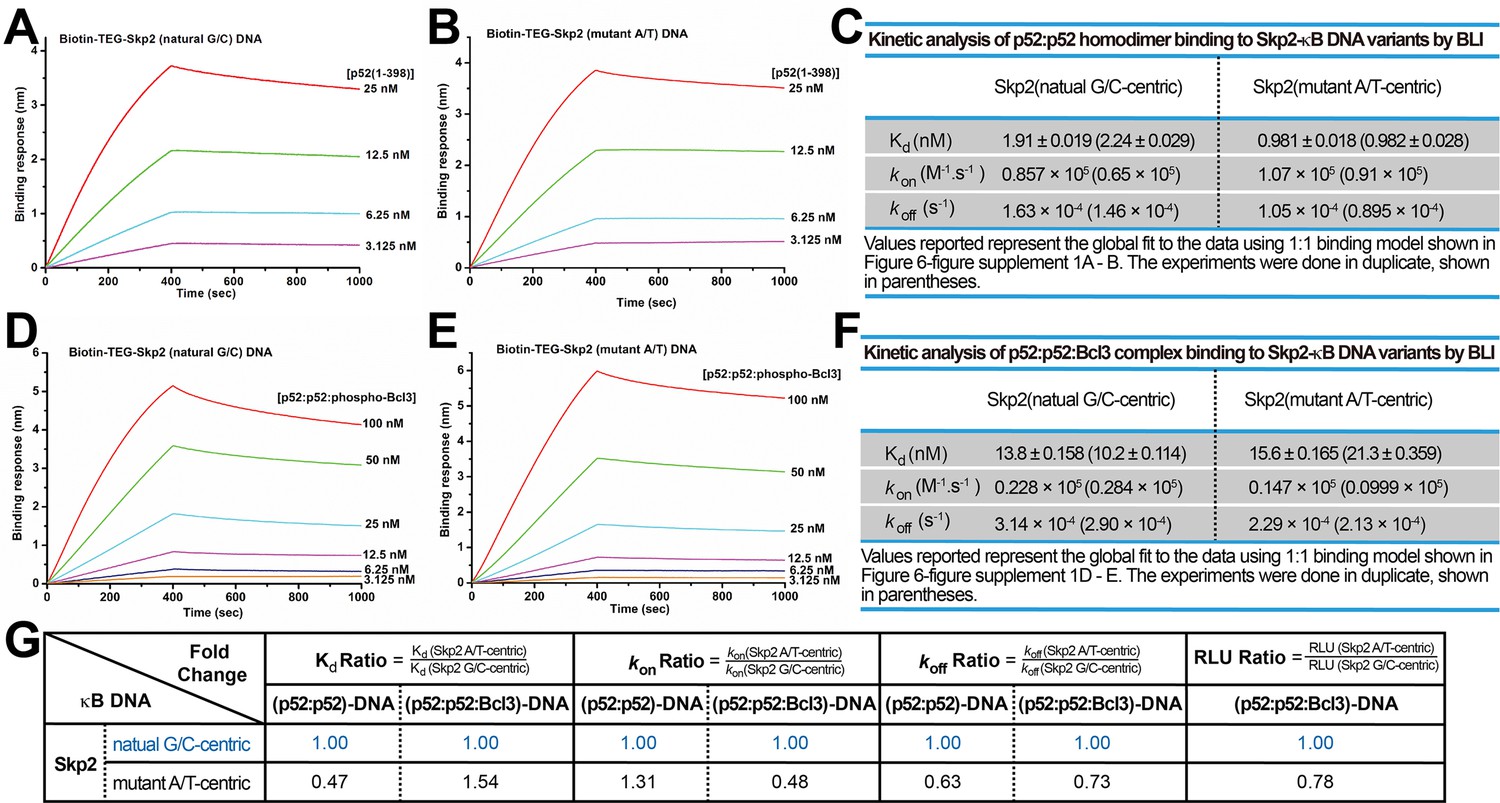
(A–B) BLI binding analysis of p52:p52 (aa 1–398) homodimer to immobilized biotin labeled (A) Skp2 natural G/C-centric and (B) mutant A/T-centric DNAs. Each experiment was done in duplicate and one representative set of curves is shown. (C) Table showing the kinetic analysis in (A) and (B). (D–E) BLI binding analysis of p52:p52:Bcl3 complex to immobilized biotin labeled (D) Skp2 natural G/C-centric and (E) mutant A/T-centric DNAs. Each experiment was done in duplicate and one representative set of curves is shown. (F) Table showing the kinetic analysis in (D) and (E). (G) Table summarizing the fold change of Kd, kon, and koff with respect to the more transcriptionally active G/C-centric Skp2-κB DNA. The average values of the duplicated kinetics data in (A–F) and the relative reporter activities in RLU from Figure 6—figure supplement 1A were used for ratio calculations. The numbers for the greater reporter active G/C-centric Skp2 DNAs are shown in blue. BLI, biolayer interferometry.
Figure 6—figure supplement 2
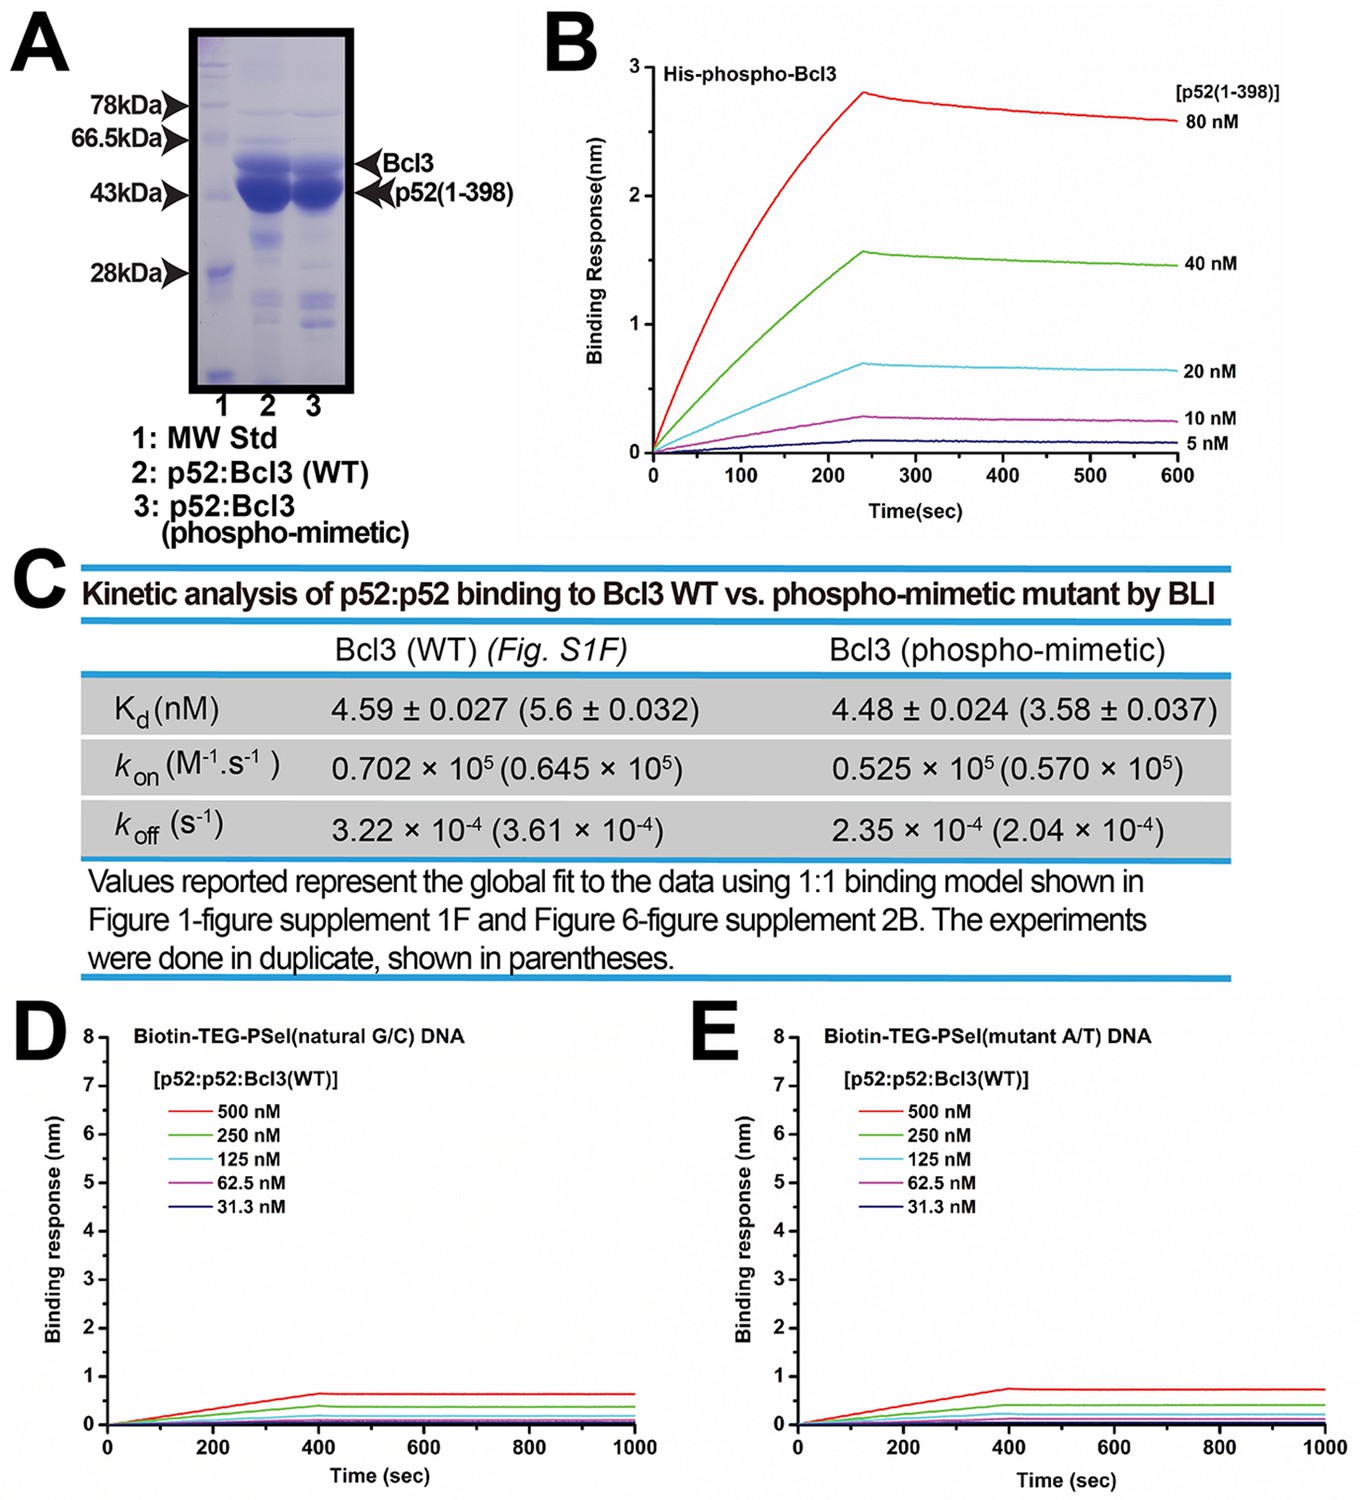
Recombinant phospho-mimetic Bcl3 forms a ternary complex with p52 and κB DNA.
(A) SDS-PAGE analysis showing the p52:p52:Bcl3 WT versus phospho-mimetic mutant complexes with similar purity. (B) BLI analysis of p52 to immobilized His-tagged-Bcl3 phospho-mimetic mutant protein. (C) Table showing the kinetic analysis in Figure 1—figure supplement 1F and Figure 6—figure supplement 2B, suggesting p52:p52 homodimer interacts with WT and phospho-mimetic Bcl3 with similar affinity and kinetics. (D–E) BLI analysis of p52:p52:Bcl3 (WT) complex to immobilized PSel (D) natural G/C-centric and (E) mutant A/T-centric DNAs. The WT complex does not interact with either DNAs. Each experiment was done in duplicate and one representative set of curves is shown. BLI, biolayer interferometry.
-
Figure 6—figure supplement 2—source data 1
Raw image of SDS-PAGE gel in Figure 6—figure supplement 2A, with label.
- https://cdn.elifesciences.org/articles/86258/elife-86258-fig6-figsupp2-data1-v2.pdf
-
Figure 6—figure supplement 2—source data 2
Raw image of SDS-PAGE gel in Figure 6—figure supplement 2A, without label.
- https://cdn.elifesciences.org/articles/86258/elife-86258-fig6-figsupp2-data2-v2.pdf
Figure 7 with 2 supplements
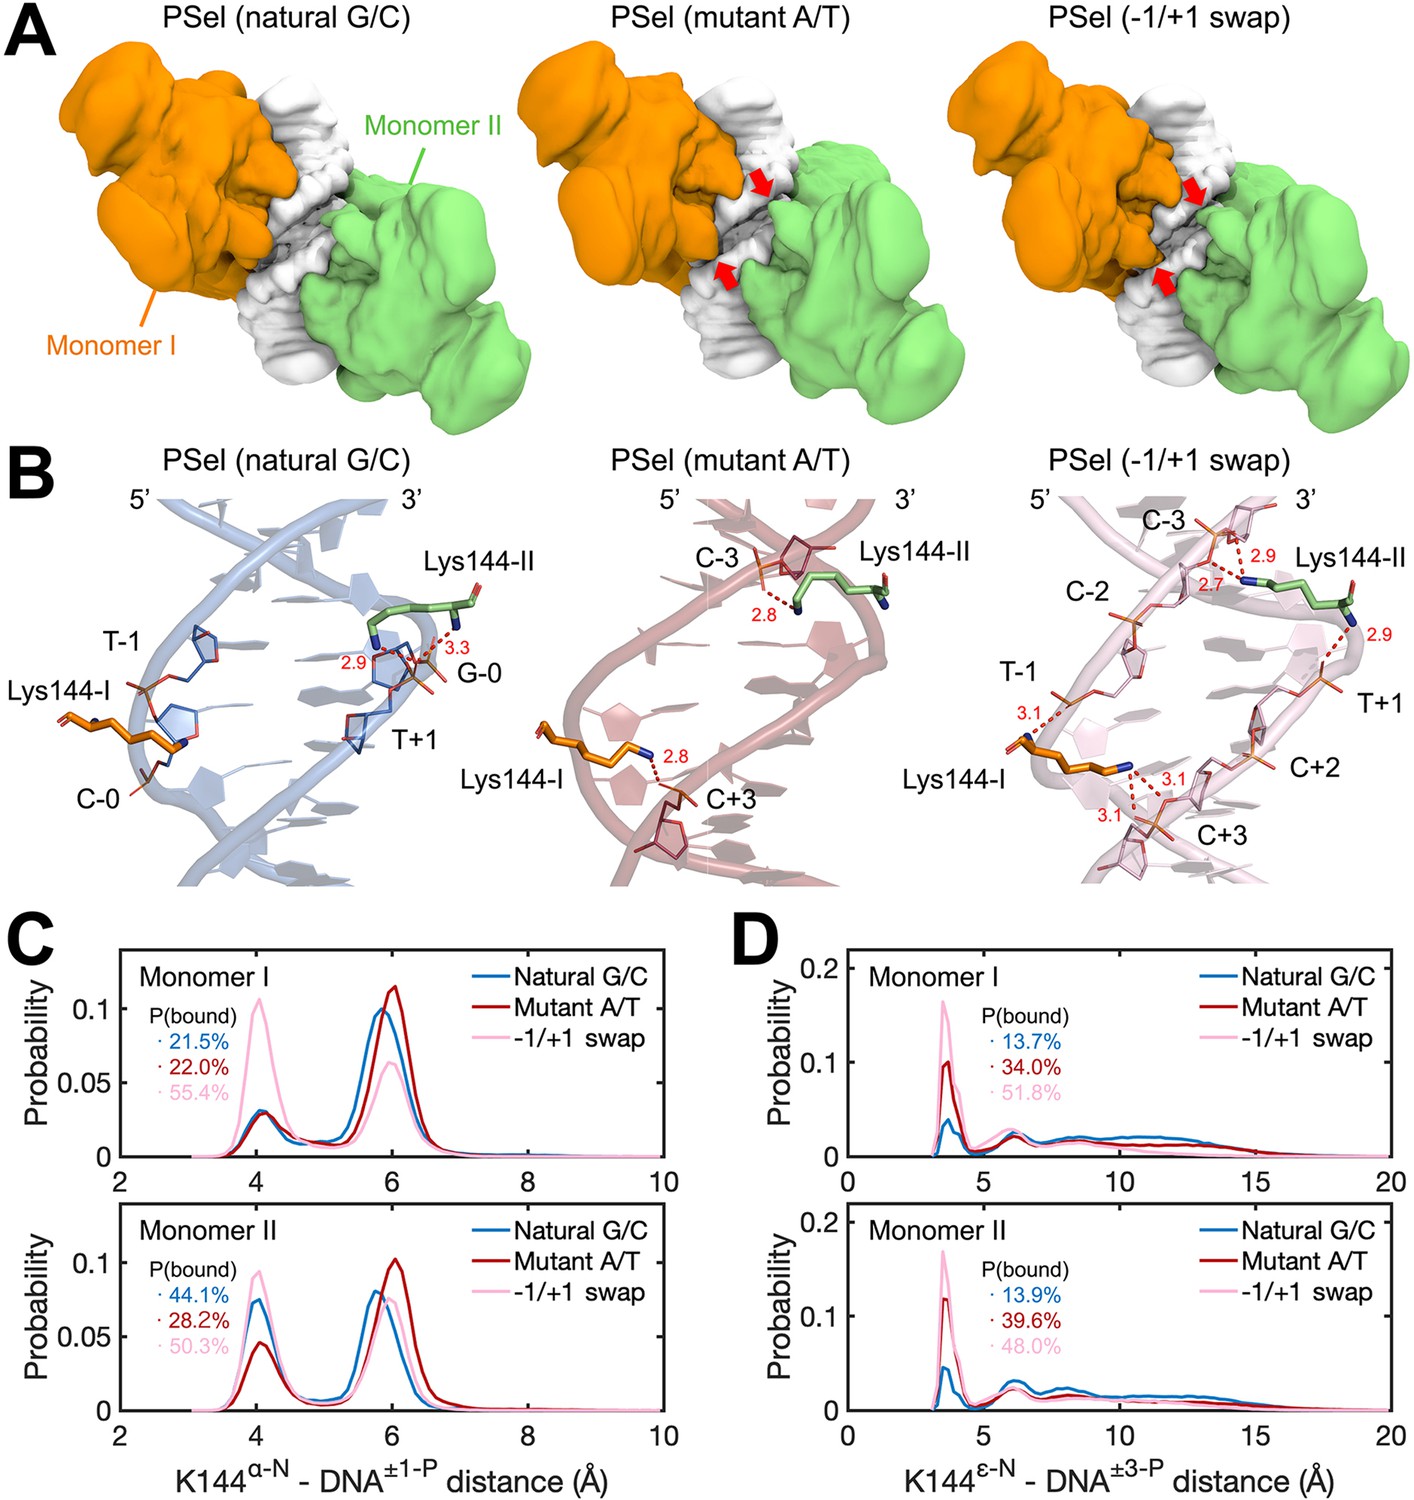
MD simulations for (p52:p52)-DNA complexes.
(A) Isosurface of (p52:p52)-DNA complexes (20% occupancy). Red arrows indicate the cross-strand contacts by p52 homodimer observed in conformations bound to mutant A/T-centric and −1/+1 swap PSel-κB. (B) Representative binding conformations of Lys144 at the minor grooves showing the cross-strand binding formed in mutant A/T-centric and −1/+1 swap PSel-κB. Red dashed lines stand for the hydrogen bonds formed between Lys144 and DNAs. (C) Probability distributions of minimum distance between the α-N of Lys144 backbone and the P atom at position −1/+1 of the nearby strand of DNA, and (D) between the ε-N of Lys144 side chain and the P atom at position +3/–3 of the far strand of DNA. The cumulative probabilities of close contacts (<4.8 Å) are marked in the same coloring scheme. MD, molecular dynamics.
Figure 7—figure supplement 1
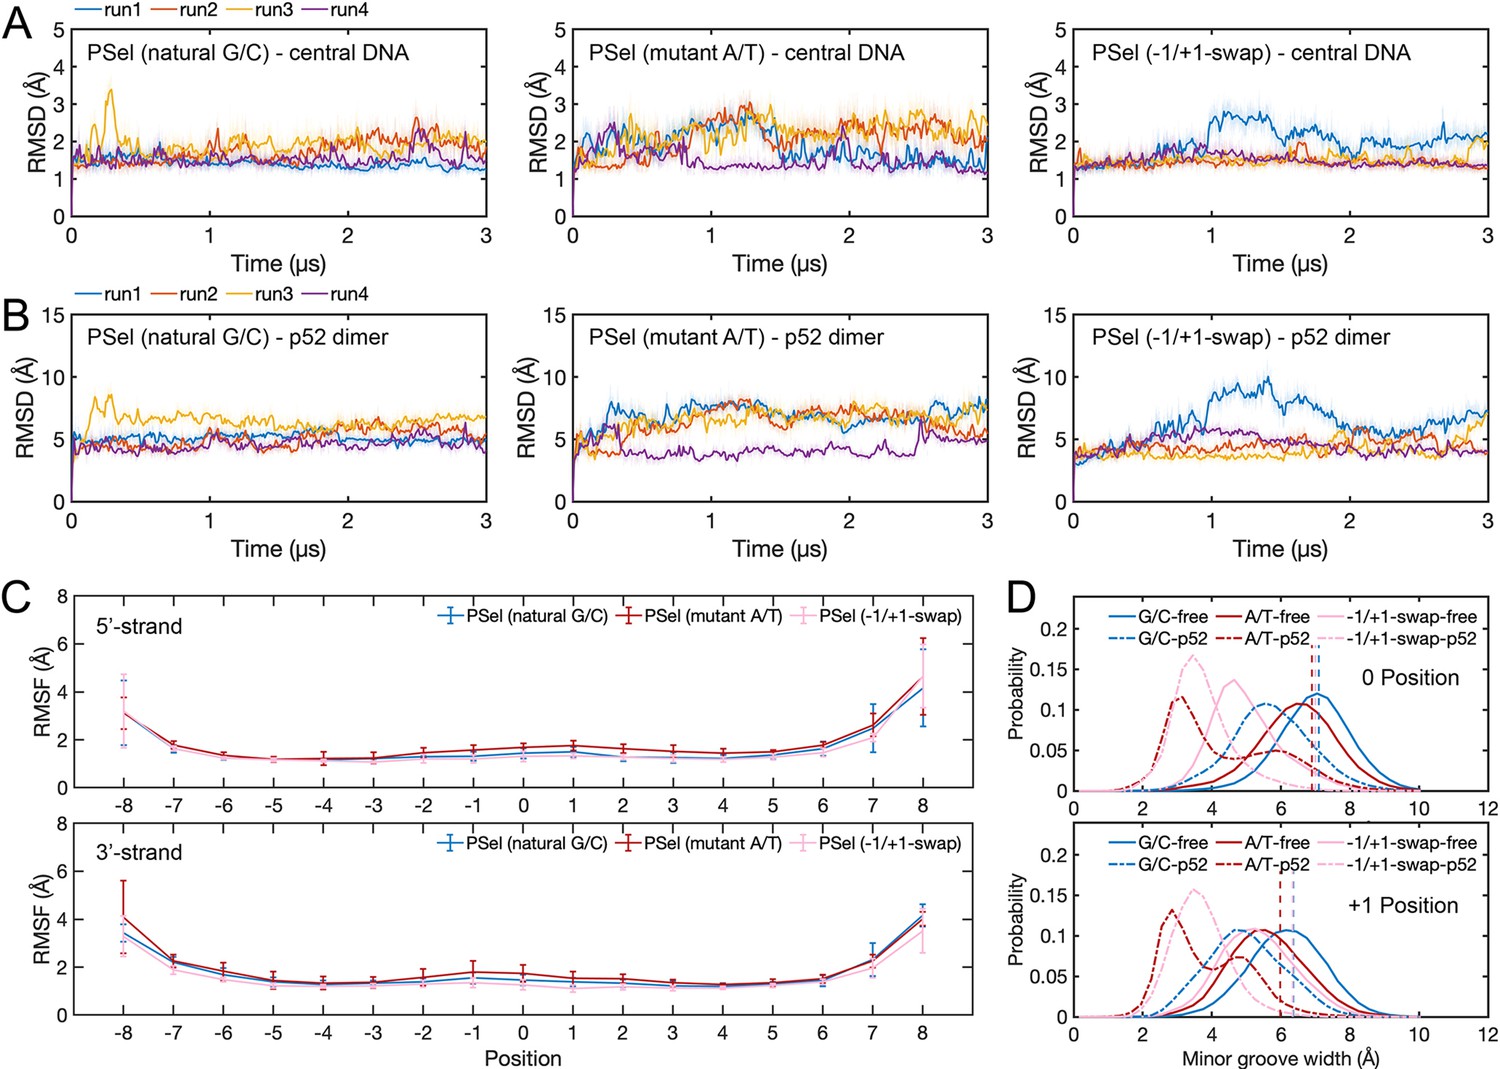
Conformation of (p52:p52)-DNA complexes in MD simulations.
(A) RMSD of central DNAs (11 bp κB sites) and (B) p52 dimer backbone during MD simulations. (C) RMSF of κB DNAs. Error bars represent standard error of the mean computed from the five replica simulations of a given system. (D) Minor groove width at 0 and +1 positions calculated with Curves+ (Blanchet et al., 2011; Lavery et al., 2009). MD, molecular dynamics.
Figure 7—figure supplement 2

Binding conformation of p52:p52 homodimer in MD simulations.
(A) Front view and (B) top view of the segments (Lys143-Asp186) that bound to the central minor groove of κB DNAs in NTDs. The mentioned segments are shown in Surf representation. The rotation angle is defined as the Euler angle around z-axis derived from the transformation matrix that aligning the segment in monomer I with that in monomer II. (C) Probability distribution of the rotation angle around z-axis between the two minor groove-binding segments in MD simulations. MD, molecular dynamics; NTD, N-terminal domain.
Figure 8 with 1 supplement

p52K144A binds κB DNAs with slower kinetics.
(A–C) BLI binding analysis of p52K144A:p52K144A (aa 1–398) homodimer to immobilized biotin labeled (A) natural G/C-centric, (B) mutant A/T-centric, and (C) −1/+1 swap PSel-κB DNAs. Each experiment was done in duplicate and one representative set of curves is shown. (D) Table showing the kinetic analysis in (A–C). (E–G) BLI binding analysis of p52K144A:p52K144A:Bcl3 complex to immobilized biotin labeled (E) natural G/C-centric, (F) mutant A/T-centric, and (G) −1/+1 swap PSel-κB DNAs. Each experiment was done in duplicate and one representative set of curves is shown. (H) Table showing the kinetic analysis in (E–G). BLI, biolayer interferometry.
Figure 8—figure supplement 1

Recombinant p52K144A mutant.
(A) SDS-PAGE analysis showing the p52 (aa 1–398) WT and K144A mutant with similar purity. (B) Analytical Superdex-200-Increase size exclusion chromatography elution profile showing the p52 (aa 1–398) WT and K144A mutant have the same elution volume. (C) BLI analysis of p52K144A:p52K144A (aa 1–398) to immobilized His-tagged-Bcl3 phospho-mimetic mutant protein. (D) SDS-PAGE analysis showing the p52WT:p52WT versus p52K144A:p52K144A in complex with phospho-mimetic Bcl3 with similar purity. BLI, biolayer interferometry.
-
Figure 8—figure supplement 1—source data 1
Raw image of SDS-PAGE gel in Figure 8—figure supplement 1A, with label.
- https://cdn.elifesciences.org/articles/86258/elife-86258-fig8-figsupp1-data1-v2.pdf
-
Figure 8—figure supplement 1—source data 2
Raw image of SDS-PAGE gel in Figure 8—figure supplement 1A, without label.
- https://cdn.elifesciences.org/articles/86258/elife-86258-fig8-figsupp1-data2-v2.pdf
-
Figure 8—figure supplement 1—source data 3
Raw image of SDS-PAGE gel in Figure 8—figure supplement 1D, with label.
- https://cdn.elifesciences.org/articles/86258/elife-86258-fig8-figsupp1-data3-v2.pdf
-
Figure 8—figure supplement 1—source data 4
Raw image of SDS-PAGE gel in Figure 8—figure supplement 1D, without label.
- https://cdn.elifesciences.org/articles/86258/elife-86258-fig8-figsupp1-data4-v2.pdf
Author response image 1
Author response image 2
Tables
Table 1
Summary of crystallographic information.
| Structure | p52-PSel(natural G/C-centric)(7CLI) | p52-PSel(mutant A/T-centric)(7VUQ) | p52-PSel(−1/+1 swap)(7VUP) | p52-PSel(mutant 13-mer A/T-centric)(7W7L) |
|---|---|---|---|---|
| p52 construct | aa 1–398 | aa 1–398 | aa 1–398 | aa 1–327 |
| DNA length | 18 bp | 18 bp | 18 bp | 13 bp |
| Data collection | ||||
| Wavelength (Å) | 0.97852 | 0.979183 | 0.979183 | 0.979183 |
| Resolution range (Å) | 45.63–3.00 (3.16–3.00) | 46.48–3.10 (3.27–3.10) | 46.85–3.40 (3.58–3.40) | 48.77–3.00 (3.16–3.00) |
| Space group | P212121 | P212121 | P212121 | P6222 |
| a, b, c (Å) | 84.50, 85.37, 140.29 | 84.45, 84.63, 139.43 | 83.99, 84.29, 140.57 | 225.28, 225.28, 96.94 |
| α, β, γ (o) | 90, 90, 90 | 90, 90, 90 | 90, 90, 90 | 90, 90, 90 |
| Mosaicity (o) | 0.54 | 0.2 | 0.38 | 0.17 |
| Total no. of reflections | 279,204 (42,196) | 246,551 (36,406) | 185,745 (27,383) | 1,101,703 (164,545) |
| No. of unique reflections | 19,950 (2963) | 18,756 (2690) | 14,272 (2025) | 29,500 (4217) |
| Completeness (%) | 95.4 (98.2) | 99.8 (99.6) | 99.7 (99.9) | 100 (100) |
| Multiplicity | 14.0 (14.2) | 13.1 (13.5) | 13.0 (13.5) | 37.3 (39.0) |
| Mean I/σ(I) | 14.3 (1.9) | 16.1 (2.1) | 9.6 (1.6) | 18.0 (2.4) |
| Rp.i.m. | 0.037 (0.498) | 0.030 (0.455) | 0.049 (0.618) | 0.031 (0.396) |
| CC1/2 | 0.999 (0.767) | 0.999 (0.934) | 0.998 (0.782) | 0.999 (0.840) |
| Wilson B-factor (Å2) | 86.8 | 100.1 | 118 | 98.9 |
| Refinement | ||||
| Resolution range (Å) | 42.72–3.00 (3.29–3.00) | 40.00–3.10 (3.39–3.10) | 45.45–3.40 (3.72–3.40) | 48.77–3.00 (3.29–3.00) |
| No. of reflections | 19,898 | 17,720 | 13,543 | 27,943 |
| Rwork/Rfree | 0.236/0.275 | 0.224/0.249 | 0.271/0.286 | 0.239/0.258 |
| No. of non-hydrogen atoms | 5359 | 5381 | 5359 | 5191 |
| Protein | 4634 | 4668 | 4668 | 4640 |
| DNA | 713 | 713 | 691 | 527 |
| Water | 12 | 24 | ||
| Average B factors (Å2) | ||||
| Protein | 115.3 | 139.6 | 165.6 | 128.9 |
| DNA | 116.7 | 141.2 | 178.5 | 80.1 |
| Water | 63.2 | 81.2 | ||
| R.m.s. deviations | ||||
| Bond length (Å) | 0.012 | 0.011 | 0.010 | 0.011 |
| Bond angles (o) | 1.78 | 1.866 | 1.735 | 1.887 |
| Ramachandran plot (%) | ||||
| Favored | 96 | 95.24 | 93.54 | 93.15 |
| Allowed | 4 | 4.76 | 5.78 | 6.85 |
| Outliers | 0.68 | |||
-
The numbers in parentheses are for the highest resolution shell. One crystal was used for each data collection.
Additional files
-
Supplementary file 1
Nucleotide sequences of PSel-κB DNA variants used in crystallization.
- https://cdn.elifesciences.org/articles/86258/elife-86258-supp1-v2.docx
-
Supplementary file 2
Assembly analysis of p52-DNA complexes made by PDBePISA (Krissinel and Henrick, 2007).
- https://cdn.elifesciences.org/articles/86258/elife-86258-supp2-v2.docx
-
Supplementary file 3
Summary of protein-DNA contacts.
- https://cdn.elifesciences.org/articles/86258/elife-86258-supp3-v2.xlsx
-
MDAR checklist
- https://cdn.elifesciences.org/articles/86258/elife-86258-mdarchecklist1-v2.docx
Download links
A two-part list of links to download the article, or parts of the article, in various formats.
Downloads (link to download the article as PDF)
Open citations (links to open the citations from this article in various online reference manager services)
Cite this article (links to download the citations from this article in formats compatible with various reference manager tools)
Structures of NF-κB p52 homodimer-DNA complexes rationalize binding mechanisms and transcription activation
eLife 12:e86258.
https://doi.org/10.7554/eLife.86258


